Embed Size (px)
Citation preview
Past and Future Water Use in Pacific Coast StatesLaurie L. Houston, Michio Watanabe, Jeffrey D. Kline, and Ralph J. Alig
United StatesDepartment ofAgriculture
Forest Service
Pacific NorthwestResearch Station
General Technical ReportPNW-GTR-588July 2003

Authors Laurie L. Houston is a former program associate and Michio Watanabe is a graduate research assistant, Department of Agricultural and Resource Economics, Oregon State University, Corvallis, OR 97331; Jeffrey D. Kline and Ralph J. Alig are research foresters, U.S. Department of Agriculture, Forest Service, Pacific Northwest Research Station, Forestry Sciences Laboratory, 3200 SW Jefferson Way, Corvallis, OR 97331.
Abstract Houston, Laurie L.; Watanabe, Michio; Kline, Jeffrey D.; Alig, Ralph J. 2003. Past and future water use in Pacific Coast States. Gen. Tech. Rep. PNW-GTR-588. Portland, OR: U.S. Department of Agriculture, Forest Service, Pacific Northwest Research Station. 37 p.
We examine socioeconomic factors affecting water demand and expected trends in these factors. Based on these trends, we identify past, current, and projected with-drawal of surface water for various uses in Pacific Coast States (California, Idaho, Oregon, and Washington), including public, domestic, commercial, industrial, ther-moelectric, livestock, and irrigation. Additionally, we identify projected demands for nonconsumptive instream recreational uses of water, such as boating, swimming, and fishing, which can compete with consumptive uses. Allocating limited water resources across multiple users will present water resource managers and policymakers with distinct challenges as water demands increase. To illustrate these challenges, we present a case study of issues in the Klamath Basin of northern California and south-ern Oregon. The case study provides an example of the issues involved in allocating scarce water among diverse users and uses, and the difficulties policymakers face when attempting to design water allocation policies that require tradeoffs among eco-nomic, ecological, and societal values.
Keywords: Water quality, water quantity, demand, recreation, Klamath Basin.

1
1
Introduction Scarcity of water in terms of quality, quantity, or timing, raises issues about how to deliver water, when, to whom, and for what purposes. Resolving such questions can be accomplished through appropriate institutional mechanisms (see, for example, Houston and others 2002). Their resolution, however, depends on understanding future demands for water in all potential uses, the priorities society places on those uses, and how various groups value different uses of water. Such information provides the basis for anticipating how trends in particular water uses over time might affect other water users, and evaluating who might gain and who might lose as a result of particular policy decisions and management actions.
Growth in demands for water will depend on a variety of changing socioeconomic factors, including population, income, and technological innovation, to name a few. Because water is essential for human life, increases in population will necessarily increase the demand for water. Increases in income also may increase the demand for water, because higher incomes generally lead to greater demands for goods and services produced by industrial, commercial, and agricultural sectors that use water as a production input. Some of these increases in water demand can be offset by tech-nological innovations that increase the efficiency with which water is used in industrial, commercial, or agricultural production. Technological innovations, however, also can increase total demand for water if new technologies bring about new uses.
Nationally, the efficiency with which water is used has increased over the past few de-cades. If this trend continues, aggregate withdrawals of fresh water nationally will stay below the 1995 level through at least 2050, despite an expected 41-percent increase in the U.S. population (Brown 1999). This projection, however, relies on an assump-tion that irrigated acreage in the Western United States will decline. In Pacific Coast States, irrigation accounts for the largest proportion of all freshwater withdrawals and is projected to decrease in the future owing, in part, to increased technological ef-ficiencies (Brown 1999). Expected reductions in irrigation water use will be offset by increasing demands for water in nonagricultural uses. If irrigation acreage does not decline as anticipated, future water withdrawals could be substantially greater (Brown 1999). Competing demands for water in all uses will shape the context in which water management and policymaking will take place.
The overall demand for water in Pacific Coast States is projected to increase in the foreseeable future, largely because of anticipated increases in the region’s population. For the purposes of this report, we include as Pacific Coast States the coastal states of California, Oregon, and Washington, as well as Idaho, because of the relatively sub-stantial impact Idaho has on the Columbia River system. Water uses in these Pacific Coast States include navigation, power generation, industrial uses, irrigation, boating, fishing, swimming, drinking, lawn and landscape maintenance, and habitat for salmon and other fish and wildlife species. Although some of these uses are compatible with one another, others can be in direct competition, especially during low rainfall years.
Increased competition for water among different users and uses was most recently ex-emplified during summer 2001 by conflicts between irrigators and the U.S. Department of the Interior, Bureau of Reclamation, regarding the allocation of water in Oregon’s Klamath River Basin. Lower than average snow and rainfall led to insufficient water for both irrigation and riparian or instream habitat for fish species listed as endangered under the Endangered Species Act, resulting in significant conflict. Allocating water among multiple competing uses will increasingly necessitate difficult tradeoffs among
2 3
socioeconomic and ecological values as competition for limited water resources in-creases. Information about potential demands for water for various uses can be useful for anticipating the need to make such tradeoffs in the future.
In this report, we examine socioeconomic factors affecting water demand and how those factors are likely to change. Based on these trends, we identify past, current, and projected demands for the withdrawal of surface water for various water uses in Pacific Coast States, including public, domestic, commercial, industrial, thermoelectric, livestock, and irrigation. Additionally, we summarize projected demands for noncon-sumptive instream recreational water uses that will compete with diverted consumptive uses. We then summarize water use issues in the Klamath Basin region of northern California and southern Oregon. This case study provides an example of the difficul-ties managers and policymakers can face when attempting to allocate limited water resources among diverse users and uses.
Future demand for both freshwater withdrawals and water recreation will depend on trends in socioeconomic factors, such as changes in population, income, and irrigated acreages, and changes in technology that improve water use efficiencies. Expected trends in these factors can be used to describe future demands for water in all of its uses. Examining past trends in water use by state and use category can help formu-late expected trends in water demand determinants and water use.
The U.S. Geological Survey (USGS), in cooperation with individual states, collects and reports uniform information on the sources and uses of water in the United States. Reports are published every 5 years. This effort provides long-term data on national water use that can be used to assess the effectiveness of alternative water manage-ment policies, regulations, and conservation activities and to project water demands (Solley and others 1998). Total withdrawn freshwater use, as reported by USGS, con-sists of eight water use categories: public, domestic, commercial, irrigation, livestock, industrial, mining, and thermoelectric power. In Pacific Coast States, very little water is used for livestock, mining, and thermoelectric power, and for this reason we have ag-gregated these categories along with traditional industrial and commercial uses into a single industrial and commercial category. With the exception of thermoelectric power, these water uses are primarily consumptive. Consumptive uses generally reduce the quantity of water available for instream uses, because typically only a small proportion of withdrawals is returned to water systems. Water that is returned to water systems can be of lower quality because of changes in its temperature or the introduction of chemical compounds.
Historical trends in each water use category for Pacific Coast States can be estab-lished by using data provided in USGS water use reports (Murray 1968; Murray and Reeves 1972, 1977; Solley and others 1983, 1988, 1993, 1998). Although the data are a useful resource for describing historical water use, minor variations over time in data collection methods and personnel have resulted in frequent fluctuations in reported use that likely are unrelated to changes in actual use. These fluctuations are magnified as the data are reported for smaller scales (state versus regional, for example) and for more specific uses. For this reason, we think it best to focus on long-term trends pres-ent in the data rather than relatively short-term fluctuations from one reporting year to the next.
Historical Freshwater Withdrawals
2 3
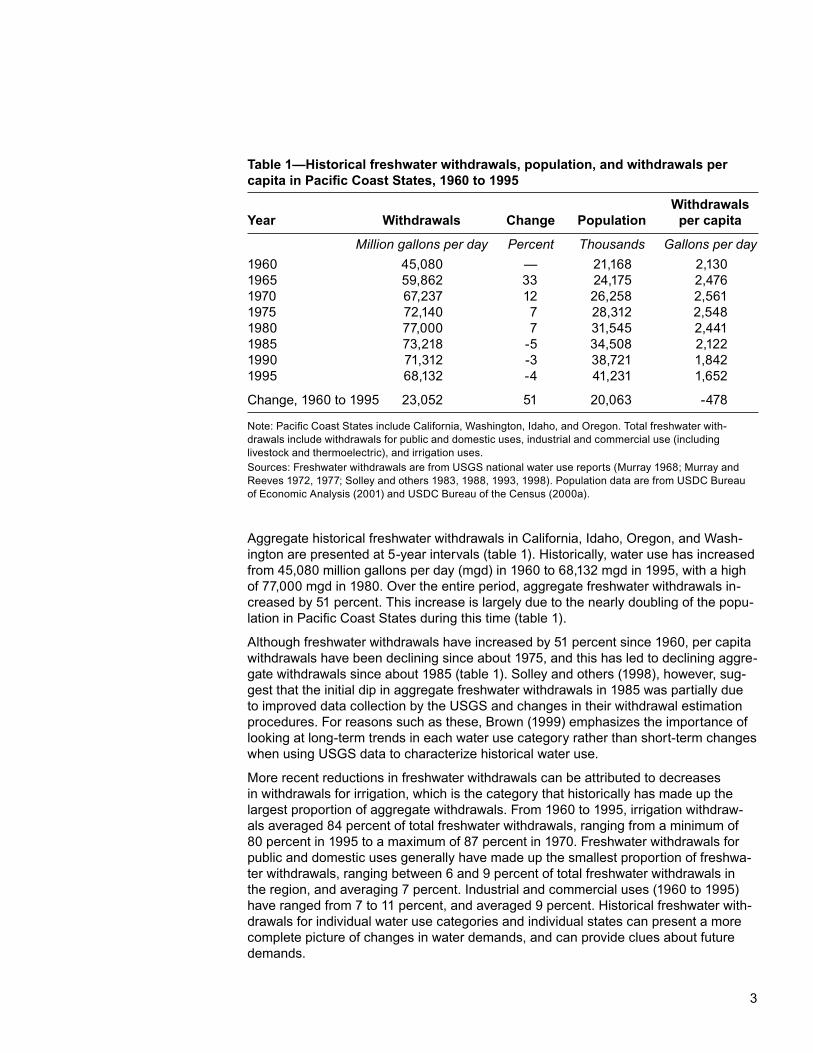
Aggregate historical freshwater withdrawals in California, Idaho, Oregon, and Wash-ington are presented at 5-year intervals (table 1). Historically, water use has increased from 45,080 million gallons per day (mgd) in 1960 to 68,132 mgd in 1995, with a high of 77,000 mgd in 1980. Over the entire period, aggregate freshwater withdrawals in-creased by 51 percent. This increase is largely due to the nearly doubling of the popu-lation in Pacific Coast States during this time (table 1).
Although freshwater withdrawals have increased by 51 percent since 1960, per capita withdrawals have been declining since about 1975, and this has led to declining aggre-gate withdrawals since about 1985 (table 1). Solley and others (1998), however, sug-gest that the initial dip in aggregate freshwater withdrawals in 1985 was partially due to improved data collection by the USGS and changes in their withdrawal estimation procedures. For reasons such as these, Brown (1999) emphasizes the importance of looking at long-term trends in each water use category rather than short-term changes when using USGS data to characterize historical water use.
More recent reductions in freshwater withdrawals can be attributed to decreases in withdrawals for irrigation, which is the category that historically has made up the largest proportion of aggregate withdrawals. From 1960 to 1995, irrigation withdraw-als averaged 84 percent of total freshwater withdrawals, ranging from a minimum of 80 percent in 1995 to a maximum of 87 percent in 1970. Freshwater withdrawals for public and domestic uses generally have made up the smallest proportion of freshwa-ter withdrawals, ranging between 6 and 9 percent of total freshwater withdrawals in the region, and averaging 7 percent. Industrial and commercial uses (1960 to 1995) have ranged from 7 to 11 percent, and averaged 9 percent. Historical freshwater with-drawals for individual water use categories and individual states can present a more complete picture of changes in water demands, and can provide clues about future demands.
Table 1—Historical freshwater withdrawals, population, and withdrawals per capita in Pacific Coast States, 1960 to 1995
Withdrawals Year Withdrawals Change Population per capita
Million gallons per day Percent Thousands Gallons per day1960 45,080 — 21,168 2,130 1965 59,862 33 24,175 2,476 1970 67,237 12 26,258 2,5611975 72,140 7 28,312 2,548 1980 77,000 7 31,545 2,441 1985 73,218 -5 34,508 2,122 1990 71,312 -3 38,721 1,842 1995 68,132 -4 41,231 1,652
Change, 1960 to 1995 23,052 51 20,063 -478
Note: Pacific Coast States include California, Washington, Idaho, and Oregon. Total freshwater with-drawals include withdrawals for public and domestic uses, industrial and commercial use (including livestock and thermoelectric), and irrigation uses.Sources: Freshwater withdrawals are from USGS national water use reports (Murray 1968; Murray and Reeves 1972, 1977; Solley and others 1983, 1988, 1993, 1998). Population data are from USDC Bureau of Economic Analysis (2001) and USDC Bureau of the Census (2000a).
4 5
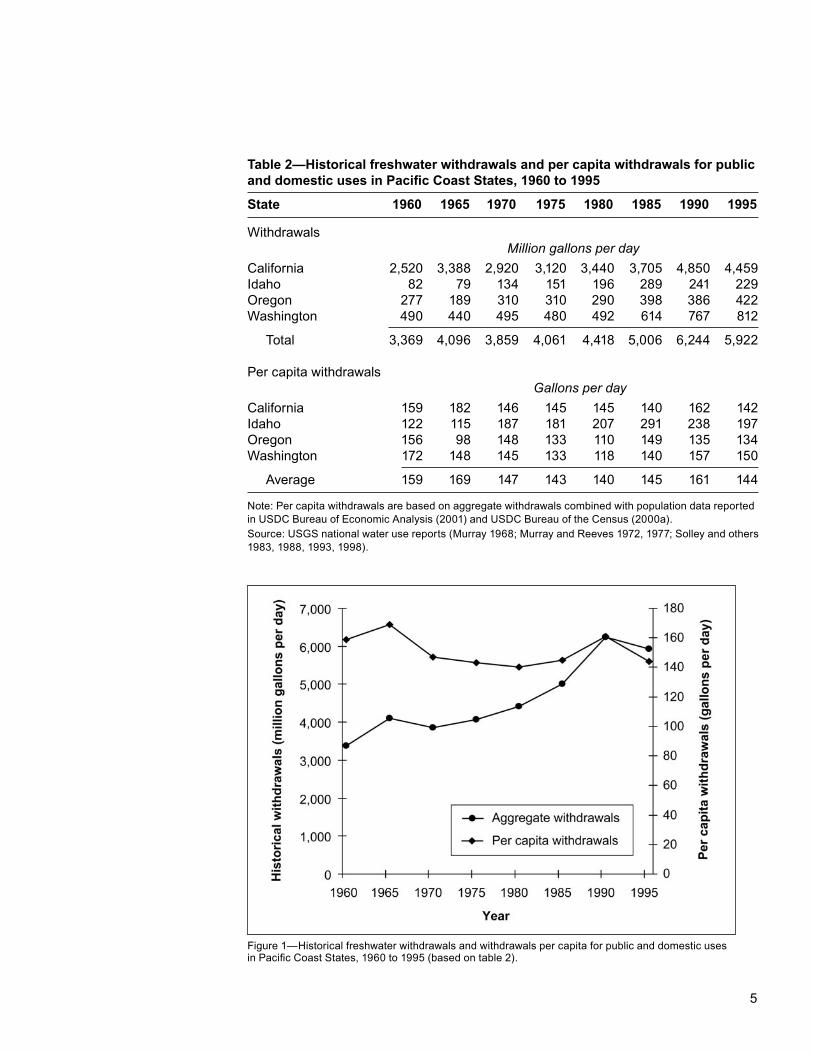
For many people, the first use of water that comes to mind is public and domestic use. Public and domestic uses include household uses, such as drinking, food preparation, bathing, washing, flushing toilets, and watering lawns and gardens, as well as water for firefighting, street washing, municipal office buildings, parks, and public swimming pools. Public and domestic uses in Pacific Coast States have increased by 76 per-cent since 1960 (table 2), owing in large part to the roughly 95-percent increase in the region’s population over the same period. Water use data for 1995 indicate a recent and more moderate rate of increase; however, with only one data point indicating this decline, it is impossible to determine if this is the start of an actual trend.
On a per capita basis, withdrawals for public and domestic water uses have been fairly steady. Per capita withdrawals for public and domestic water uses generally have fol-lowed a declining trend since 1960 (table 2, fig. 1). Per capita public and domestic wa-ter withdrawals in the region averaged 144 gallons per day (gpd) in 1995, with Oregon having the lowest per capita withdrawals (134 gpd), and Idaho having the highest (197 gpd).
The populations of Pacific Coast States are projected to continue to grow rather sig-nificantly over the next few decades relative to a fairly constant, or at best only mod-erately declining per capita water consumption. For this reason, we can expect that public and domestic demands for freshwater withdrawals will increase with increasing populations in future years. The magnitude of this increase will rely greatly on the rate of population growth and on water use efficiency gains resulting from technological improvements that could contribute to lower per capita consumption.
Withdrawals for industrial and commercial uses include water for motels, hotels, res-taurants, office buildings, commercial facilities, civilian and military institutions, and industrial uses such as processing, washing, and cooling facilities. For the purposes of this report, we also include water for livestock and thermoelectric uses. In many cases, freshwater withdrawal estimates for commercial uses are based on the popula-tions of commercial facilities—for example, the number of workers in an office build-ing, the number of inmates at a penal facility, or average occupancy rate of a hotel—rather than actual water use. In contrast, most estimates of industrial water use are based on actual reported freshwater withdrawals (Solley and others 1998). Livestock water is used primarily for raising cattle, hogs, sheep, and poultry; in 1985, water used for aquaculture was removed from the industrial category and added to the livestock category (Brown 1999). Thermoelectric uses include water used in fossil fuel, nuclear, and geothermal electric power generation (Solley and others 1998). The water use estimates for the thermoelectric category are fairly reliable because they are based on actual withdrawal data maintained by federal and state agencies.
Freshwater withdrawals for industrial and commercial uses in Pacific Coast States increased steadily between 1960 and 1980, declined somewhat between 1980 and 1990, but increased again by 1995 (table 3). The decline between 1980 and 1990 can be attributed to new technologies in the industrial sector that required less water, improved plant efficiencies, and increased water recycling in addition to higher energy prices and increased regulation of pollutant discharges (Solley and others 1993). The overall trend, however, has mirrored the increasing trend in the region’s population. Between 1960 and 1995, the average annual percentage of increase for both popula-tion and freshwater withdrawals for industrial and commercial uses has been close to
Public and Domestic Uses
Industrial and Commercial Uses
4 5
Table 2—Historical freshwater withdrawals and per capita withdrawals for public and domestic uses in Pacific Coast States, 1960 to 1995
State 1960 1965 1970 1975 1980 1985 1990 1995
Withdrawals Million gallons per dayCalifornia 2,520 3,388 2,920 3,120 3,440 3,705 4,850 4,459Idaho 82 79 134 151 196 289 241 229Oregon 277 189 310 310 290 398 386 422Washington 490 440 495 480 492 614 767 812
Total 3,369 4,096 3,859 4,061 4,418 5,006 6,244 5,922 Per capita withdrawals Gallons per dayCalifornia 159 182 146 145 145 140 162 142Idaho 122 115 187 181 207 291 238 197Oregon 156 98 148 133 110 149 135 134Washington 172 148 145 133 118 140 157 150
Average 159 169 147 143 140 145 161 144
Note: Per capita withdrawals are based on aggregate withdrawals combined with population data reported in USDC Bureau of Economic Analysis (2001) and USDC Bureau of the Census (2000a). Source: USGS national water use reports (Murray 1968; Murray and Reeves 1972, 1977; Solley and others 1983, 1988, 1993, 1998).
Figure 1—Historical freshwater withdrawals and withdrawals per capita for public and domestic uses in Pacific Coast States, 1960 to 1995 (based on table 2).
6 7
3 percent. If we assume that this correlation will continue in future years, then popula-tion growth can be a useful indicator of future demand for industrial and commercial freshwater withdrawals.
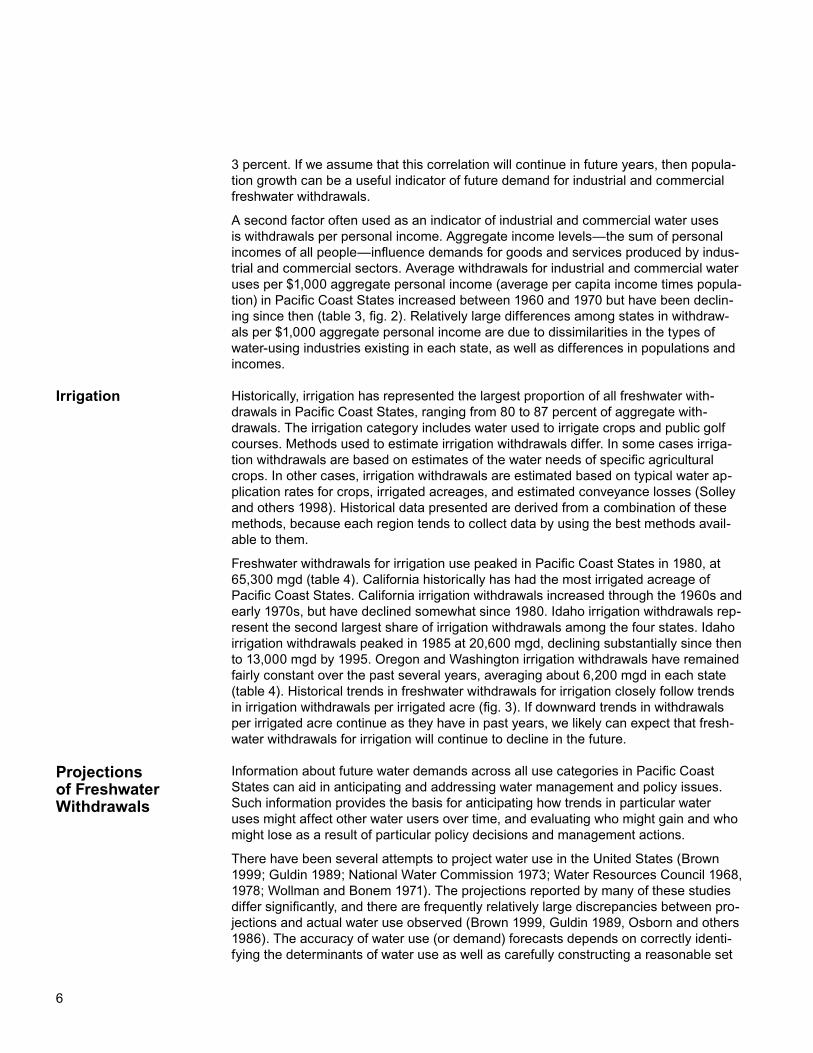
A second factor often used as an indicator of industrial and commercial water uses is withdrawals per personal income. Aggregate income levels—the sum of personal incomes of all people—influence demands for goods and services produced by indus-trial and commercial sectors. Average withdrawals for industrial and commercial water uses per $1,000 aggregate personal income (average per capita income times popula-tion) in Pacific Coast States increased between 1960 and 1970 but have been declin-ing since then (table 3, fig. 2). Relatively large differences among states in withdraw-als per $1,000 aggregate personal income are due to dissimilarities in the types of water-using industries existing in each state, as well as differences in populations and incomes.
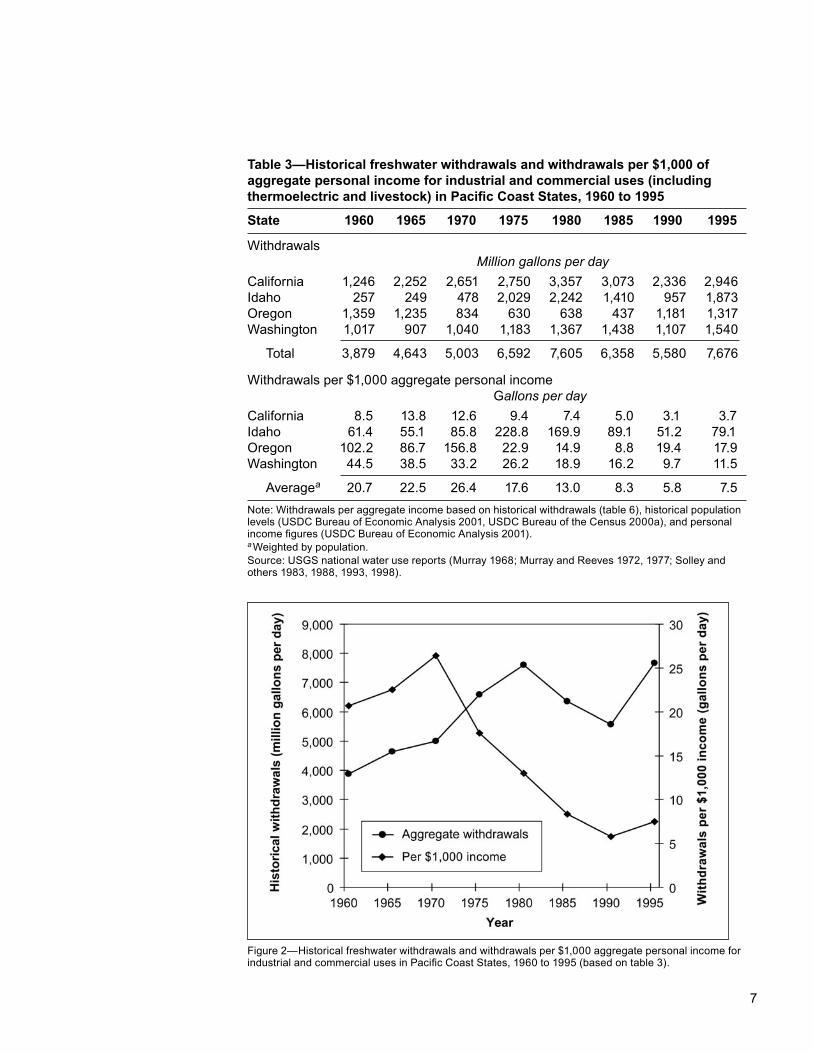
Historically, irrigation has represented the largest proportion of all freshwater with-drawals in Pacific Coast States, ranging from 80 to 87 percent of aggregate with-drawals. The irrigation category includes water used to irrigate crops and public golf courses. Methods used to estimate irrigation withdrawals differ. In some cases irriga-tion withdrawals are based on estimates of the water needs of specific agricultural crops. In other cases, irrigation withdrawals are estimated based on typical water ap-plication rates for crops, irrigated acreages, and estimated conveyance losses (Solley and others 1998). Historical data presented are derived from a combination of these methods, because each region tends to collect data by using the best methods avail-able to them.
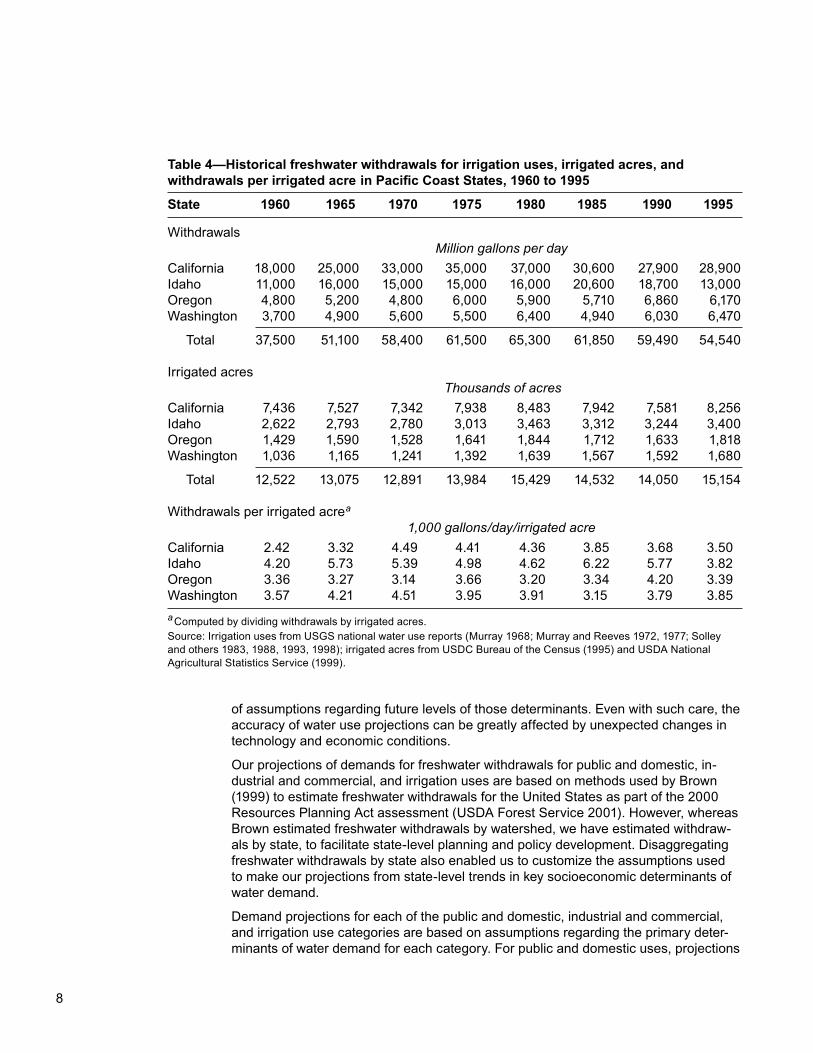
Freshwater withdrawals for irrigation use peaked in Pacific Coast States in 1980, at 65,300 mgd (table 4). California historically has had the most irrigated acreage of Pacific Coast States. California irrigation withdrawals increased through the 1960s and early 1970s, but have declined somewhat since 1980. Idaho irrigation withdrawals rep-resent the second largest share of irrigation withdrawals among the four states. Idaho irrigation withdrawals peaked in 1985 at 20,600 mgd, declining substantially since then to 13,000 mgd by 1995. Oregon and Washington irrigation withdrawals have remained fairly constant over the past several years, averaging about 6,200 mgd in each state (table 4). Historical trends in freshwater withdrawals for irrigation closely follow trends in irrigation withdrawals per irrigated acre (fig. 3). If downward trends in withdrawals per irrigated acre continue as they have in past years, we likely can expect that fresh-water withdrawals for irrigation will continue to decline in the future.
Information about future water demands across all use categories in Pacific Coast States can aid in anticipating and addressing water management and policy issues. Such information provides the basis for anticipating how trends in particular water uses might affect other water users over time, and evaluating who might gain and who might lose as a result of particular policy decisions and management actions.
There have been several attempts to project water use in the United States (Brown 1999; Guldin 1989; National Water Commission 1973; Water Resources Council 1968, 1978; Wollman and Bonem 1971). The projections reported by many of these studies differ significantly, and there are frequently relatively large discrepancies between pro-jections and actual water use observed (Brown 1999, Guldin 1989, Osborn and others 1986). The accuracy of water use (or demand) forecasts depends on correctly identi-fying the determinants of water use as well as carefully constructing a reasonable set
Irrigation
Projections of Freshwater Withdrawals
6 7
Table 3—Historical freshwater withdrawals and withdrawals per $1,000 of aggregate personal income for industrial and commercial uses (including thermoelectric and livestock) in Pacific Coast States, 1960 to 1995
State 1960 1965 1970 1975 1980 1985 1990 1995
Withdrawals Million gallons per dayCalifornia 1,246 2,252 2,651 2,750 3,357 3,073 2,336 2,946Idaho 257 249 478 2,029 2,242 1,410 957 1,873Oregon 1,359 1,235 834 630 638 437 1,181 1,317Washington 1,017 907 1,040 1,183 1,367 1,438 1,107 1,540
Total 3,879 4,643 5,003 6,592 7,605 6,358 5,580 7,676
Withdrawals per $1,000 aggregate personal income Gallons per dayCalifornia 8.5 13.8 12.6 9.4 7.4 5.0 3.1 3.7Idaho 61.4 55.1 85.8 228.8 169.9 89.1 51.2 79.1Oregon 102.2 86.7 156.8 22.9 14.9 8.8 19.4 17.9Washington 44.5 38.5 33.2 26.2 18.9 16.2 9.7 11.5
Averagea 20.7 22.5 26.4 17.6 13.0 8.3 5.8 7.5Note: Withdrawals per aggregate income based on historical withdrawals (table 6), historical population levels (USDC Bureau of Economic Analysis 2001, USDC Bureau of the Census 2000a), and personal income figures (USDC Bureau of Economic Analysis 2001).a Weighted by population.Source: USGS national water use reports (Murray 1968; Murray and Reeves 1972, 1977; Solley and others 1983, 1988, 1993, 1998).
Figure 2—Historical freshwater withdrawals and withdrawals per $1,000 aggregate personal income for industrial and commercial uses in Pacific Coast States, 1960 to 1995 (based on table 3).
8 9
Table 4—Historical freshwater withdrawals for irrigation uses, irrigated acres, and withdrawals per irrigated acre in Pacific Coast States, 1960 to 1995
State 1960 1965 1970 1975 1980 1985 1990 1995
Withdrawals Million gallons per dayCalifornia 18,000 25,000 33,000 35,000 37,000 30,600 27,900 28,900Idaho 11,000 16,000 15,000 15,000 16,000 20,600 18,700 13,000Oregon 4,800 5,200 4,800 6,000 5,900 5,710 6,860 6,170Washington 3,700 4,900 5,600 5,500 6,400 4,940 6,030 6,470
Total 37,500 51,100 58,400 61,500 65,300 61,850 59,490 54,540
Irrigated acres Thousands of acresCalifornia 7,436 7,527 7,342 7,938 8,483 7,942 7,581 8,256Idaho 2,622 2,793 2,780 3,013 3,463 3,312 3,244 3,400Oregon 1,429 1,590 1,528 1,641 1,844 1,712 1,633 1,818Washington 1,036 1,165 1,241 1,392 1,639 1,567 1,592 1,680
Total 12,522 13,075 12,891 13,984 15,429 14,532 14,050 15,154
Withdrawals per irrigated acre a 1,000 gallons/day/irrigated acreCalifornia 2.42 3.32 4.49 4.41 4.36 3.85 3.68 3.50 Idaho 4.20 5.73 5.39 4.98 4.62 6.22 5.77 3.82 Oregon 3.36 3.27 3.14 3.66 3.20 3.34 4.20 3.39 Washington 3.57 4.21 4.51 3.95 3.91 3.15 3.79 3.85 a Computed by dividing withdrawals by irrigated acres. Source: Irrigation uses from USGS national water use reports (Murray 1968; Murray and Reeves 1972, 1977; Solley and others 1983, 1988, 1993, 1998); irrigated acres from USDC Bureau of the Census (1995) and USDA National Agricultural Statistics Service (1999).
of assumptions regarding future levels of those determinants. Even with such care, the accuracy of water use projections can be greatly affected by unexpected changes in technology and economic conditions.
Our projections of demands for freshwater withdrawals for public and domestic, in-dustrial and commercial, and irrigation uses are based on methods used by Brown (1999) to estimate freshwater withdrawals for the United States as part of the 2000 Resources Planning Act assessment (USDA Forest Service 2001). However, whereas Brown estimated freshwater withdrawals by watershed, we have estimated withdraw-als by state, to facilitate state-level planning and policy development. Disaggregating freshwater withdrawals by state also enabled us to customize the assumptions used to make our projections from state-level trends in key socioeconomic determinants of water demand.
Demand projections for each of the public and domestic, industrial and commercial, and irrigation use categories are based on assumptions regarding the primary deter-minants of water demand for each category. For public and domestic uses, projections
8 9
are based on expected increases in population and expected per capita freshwater withdrawals. For industrial and commercial uses, projections are based on expected increases in population and per capita income, and expected withdrawals per dollar of income. For irrigation uses, projections are based on expected changes in irrigated acres and expected freshwater withdrawals per irrigated acre. The assumptions used in this analysis generally follow those made by Brown (1999) to project freshwater withdrawals nationwide. In some instances, however, we have made adjustments to Brown’s assumptions to more closely represent likely future trends in Pacific Coast States.
Assumptions about changes in the determinants of freshwater withdrawals will have a significant impact on water use projections for each use category. Projections for Pacific Coast States indicate that the region’s population will increase 44 to 153 per-cent by 2050, depending on which projection series is chosen (table 5). The actual impacts of population growth on freshwater withdrawals will be partially offset by an-ticipated reductions of irrigated acreages as agricultural lands are converted to urban uses to accommodate increasing populations. Increasing technological efficiencies, as well as water conservation measures, also will play a role. The specific assumptions regarding these additional determinants are described in the particular subsections describing each of the use categories. The influence of each determinant is evaluated in a sensitivity analysis.
Figure 3—Historical freshwater withdrawals and average withdrawals per irrigated acre for irrigation uses in Pacific Coast States, 1960 to 1995 (based on table 4).
10 11
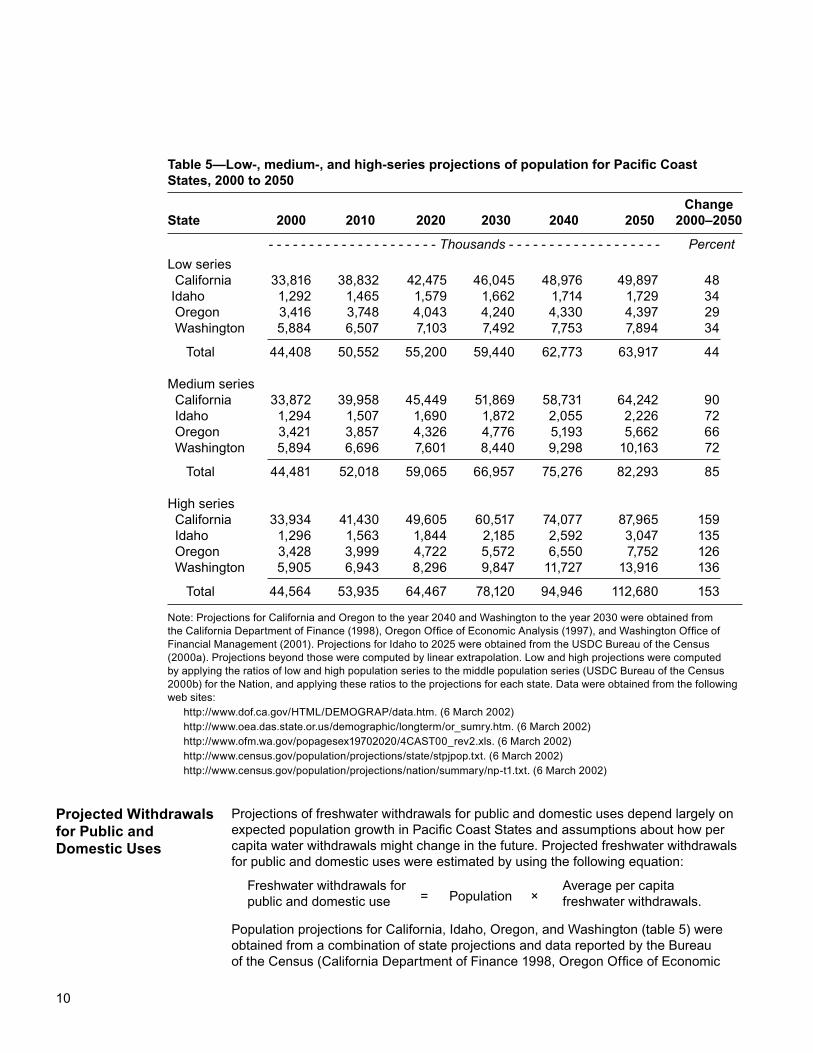
Table 5—Low-, medium-, and high-series projections of population for Pacific Coast States, 2000 to 2050
ChangeState 2000 2010 2020 2030 2040 2050 2000–2050
- - - - - - - - - - - - - - - - - - - - - Thousands - - - - - - - - - - - - - - - - - - - PercentLow series California 33,816 38,832 42,475 46,045 48,976 49,897 48 Idaho 1,292 1,465 1,579 1,662 1,714 1,729 34 Oregon 3,416 3,748 4,043 4,240 4,330 4,397 29 Washington 5,884 6,507 7,103 7,492 7,753 7,894 34
Total 44,408 50,552 55,200 59,440 62,773 63,917 44
Medium series California 33,872 39,958 45,449 51,869 58,731 64,242 90 Idaho 1,294 1,507 1,690 1,872 2,055 2,226 72 Oregon 3,421 3,857 4,326 4,776 5,193 5,662 66 Washington 5,894 6,696 7,601 8,440 9,298 10,163 72
Total 44,481 52,018 59,065 66,957 75,276 82,293 85
High series California 33,934 41,430 49,605 60,517 74,077 87,965 159 Idaho 1,296 1,563 1,844 2,185 2,592 3,047 135 Oregon 3,428 3,999 4,722 5,572 6,550 7,752 126 Washington 5,905 6,943 8,296 9,847 11,727 13,916 136
Total 44,564 53,935 64,467 78,120 94,946 112,680 153
Note: Projections for California and Oregon to the year 2040 and Washington to the year 2030 were obtained from the California Department of Finance (1998), Oregon Office of Economic Analysis (1997), and Washington Office of Financial Management (2001). Projections for Idaho to 2025 were obtained from the USDC Bureau of the Census (2000a). Projections beyond those were computed by linear extrapolation. Low and high projections were computed by applying the ratios of low and high population series to the middle population series (USDC Bureau of the Census 2000b) for the Nation, and applying these ratios to the projections for each state. Data were obtained from the following web sites:
http://www.dof.ca.gov/HTML/DEMOGRAP/data.htm. (6 March 2002) http://www.oea.das.state.or.us/demographic/longterm/or_sumry.htm. (6 March 2002) http://www.ofm.wa.gov/popagesex19702020/4CAST00_rev2.xls. (6 March 2002) http://www.census.gov/population/projections/state/stpjpop.txt. (6 March 2002) http://www.census.gov/population/projections/nation/summary/np-t1.txt. (6 March 2002)
Projections of freshwater withdrawals for public and domestic uses depend largely on expected population growth in Pacific Coast States and assumptions about how per capita water withdrawals might change in the future. Projected freshwater withdrawals for public and domestic uses were estimated by using the following equation:
Freshwater withdrawals for = Population ×
Average per capita public and domestic use freshwater withdrawals.
Population projections for California, Idaho, Oregon, and Washington (table 5) were obtained from a combination of state projections and data reported by the Bureau of the Census (California Department of Finance 1998, Oregon Office of Economic
Projected Withdrawals for Public and Domestic Uses
10 11
Projected Withdrawals for Industrial and Commercial Uses
Analysis 1997, USDC Bureau of the Census 2000a, Washington Office of Financial Management 2001). Baseline projections were computed by using the medium-series population projections, whereas low and high population projections were reserved for later sensitivity analysis. For all states, the medium-series population projections indicate increasing populations in future years, with California experiencing the largest increase in population and Oregon the smallest.
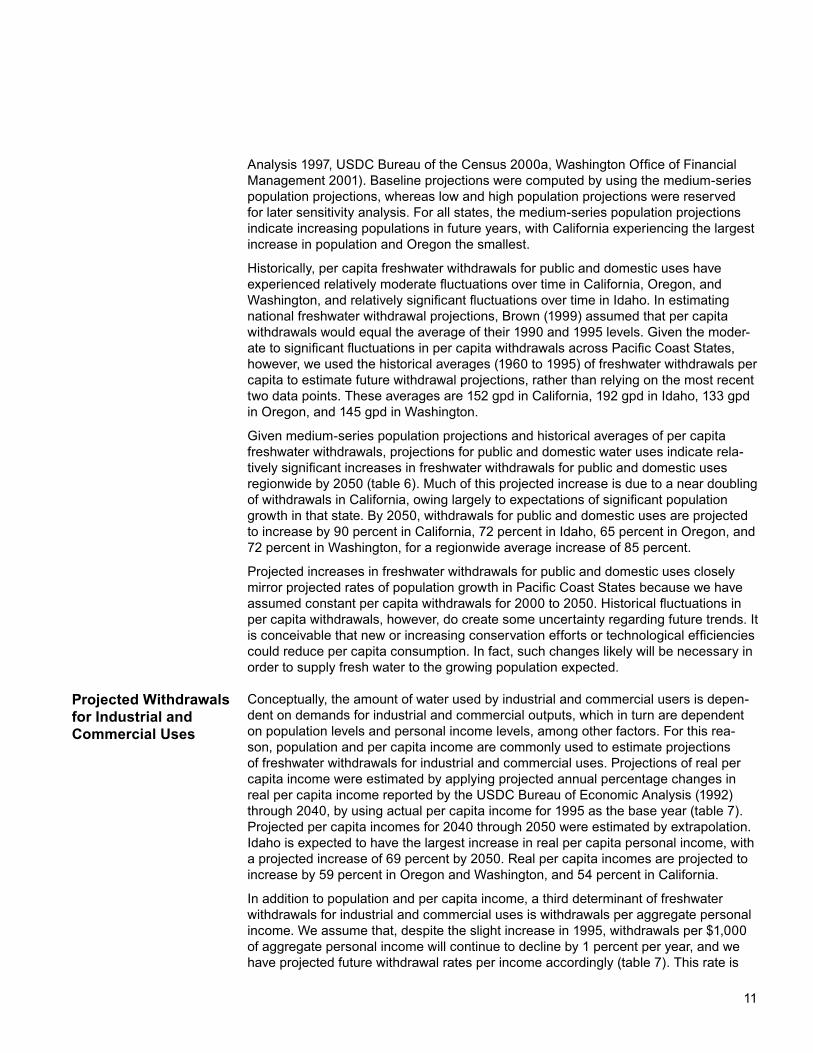
Historically, per capita freshwater withdrawals for public and domestic uses have experienced relatively moderate fluctuations over time in California, Oregon, and Washington, and relatively significant fluctuations over time in Idaho. In estimating national freshwater withdrawal projections, Brown (1999) assumed that per capita withdrawals would equal the average of their 1990 and 1995 levels. Given the moder-ate to significant fluctuations in per capita withdrawals across Pacific Coast States, however, we used the historical averages (1960 to 1995) of freshwater withdrawals per capita to estimate future withdrawal projections, rather than relying on the most recent two data points. These averages are 152 gpd in California, 192 gpd in Idaho, 133 gpd in Oregon, and 145 gpd in Washington.
Given medium-series population projections and historical averages of per capita freshwater withdrawals, projections for public and domestic water uses indicate rela-tively significant increases in freshwater withdrawals for public and domestic uses regionwide by 2050 (table 6). Much of this projected increase is due to a near doubling of withdrawals in California, owing largely to expectations of significant population growth in that state. By 2050, withdrawals for public and domestic uses are projected to increase by 90 percent in California, 72 percent in Idaho, 65 percent in Oregon, and 72 percent in Washington, for a regionwide average increase of 85 percent.
Projected increases in freshwater withdrawals for public and domestic uses closely mirror projected rates of population growth in Pacific Coast States because we have assumed constant per capita withdrawals for 2000 to 2050. Historical fluctuations in per capita withdrawals, however, do create some uncertainty regarding future trends. It is conceivable that new or increasing conservation efforts or technological efficiencies could reduce per capita consumption. In fact, such changes likely will be necessary in order to supply fresh water to the growing population expected.
Conceptually, the amount of water used by industrial and commercial users is depen-dent on demands for industrial and commercial outputs, which in turn are dependent on population levels and personal income levels, among other factors. For this rea-son, population and per capita income are commonly used to estimate projections of freshwater withdrawals for industrial and commercial uses. Projections of real per capita income were estimated by applying projected annual percentage changes in real per capita income reported by the USDC Bureau of Economic Analysis (1992) through 2040, by using actual per capita income for 1995 as the base year (table 7). Projected per capita incomes for 2040 through 2050 were estimated by extrapolation. Idaho is expected to have the largest increase in real per capita personal income, with a projected increase of 69 percent by 2050. Real per capita incomes are projected to increase by 59 percent in Oregon and Washington, and 54 percent in California.
In addition to population and per capita income, a third determinant of freshwater withdrawals for industrial and commercial uses is withdrawals per aggregate personal income. We assume that, despite the slight increase in 1995, withdrawals per $1,000 of aggregate personal income will continue to decline by 1 percent per year, and we have projected future withdrawal rates per income accordingly (table 7). This rate is
12 13
Table 6—Projected freshwater withdrawals for public and domestic uses in Pacific Coast States, 2000 to 2050
ChangeState 2000 2010 2020 2030 2040 2050 2000–2050
- - - - - - - - - - - - - - - Million gallons per day - - - - - - - - - - - - - - - PercentCalifornia 5,165 6,093 6,931 7,910 8,956 9,797 90Idaho 249 290 325 360 395 428 72Oregon 455 512 575 635 690 752 65Washington 856 972 1,103 1,225 1,350 1,475 72
Total 6,724 7,868 8,934 10,129 11,391 12,452 85
Note: Projected from 1995 base year. Projections based on medium-series population projections (table 5) and historical average per capita freshwater withdrawals (table 3).
Table 7—Projected per capita personal income and freshwater withdrawals per $1,000 of aggregate personal income for industrial and commercial uses (including livestock and thermoelectric uses) in Pacific Coast States, 2000 to 2050
ChangeState 2000 2010 2020 2030 2040 2050 2000–2050
Per capita personal income a - - - - - - - - - - - - - - - - - - - 1996 dollars - - - - - - - - - - - - - - - - - - PercentCalifornia 26,522 28,929 31,555 34,419 37,543 40,950 54Idaho 21,455 23,826 26,460 29,384 32,632 36,239 69Oregon 24,613 26,992 29,602 32,463 35,602 39,044 59Washington 25,935 28,461 31,234 34,276 37,614 41,278 59
Average c 26,150 28,577 31,225 34,121 37,284 40,732 56
Withdrawals per $1,000 aggregate personal income b - - - - - - - - - - - - - - - - Gallons per day - - - - - - - - - - - - - - - - - -California 3.51 3.17 2.87 2.59 2.35 2.12 —Idaho 75.22 68.02 61.52 55.64 50.32 45.51 —Oregon 16.98 15.36 13.89 12.56 11.36 10.27 —Washington 10.90 9.86 8.92 8.07 7.29 6.60 —
Average c 7.17 6.45 5.83 5.24 4.70 4.26 —
a Based on the projected average annual percentage of change (USDC Bureau of Economic Analysis 1992) applied to 1995 values. b Based on population (table 5) and assumed 1 percent decrease in withdrawals per $1,000 aggregate income, by state.c Weighted by population.
12 13
slightly less than the historical rate but is similar to Brown’s (1999) assumption that re-flects a continuation of past trends based on expectations of more efficient production processes and greater levels of water recycling in the future.
Given projections of population, per capita income, and withdrawals per aggregate personal income, projections of freshwater withdrawals for industrial and commercial water uses were estimated by using the following equation:
Freshwater withdrawal Per capita Withdrawals perfor industrial and = Population × income × $1,000 aggregate commercial uses income.
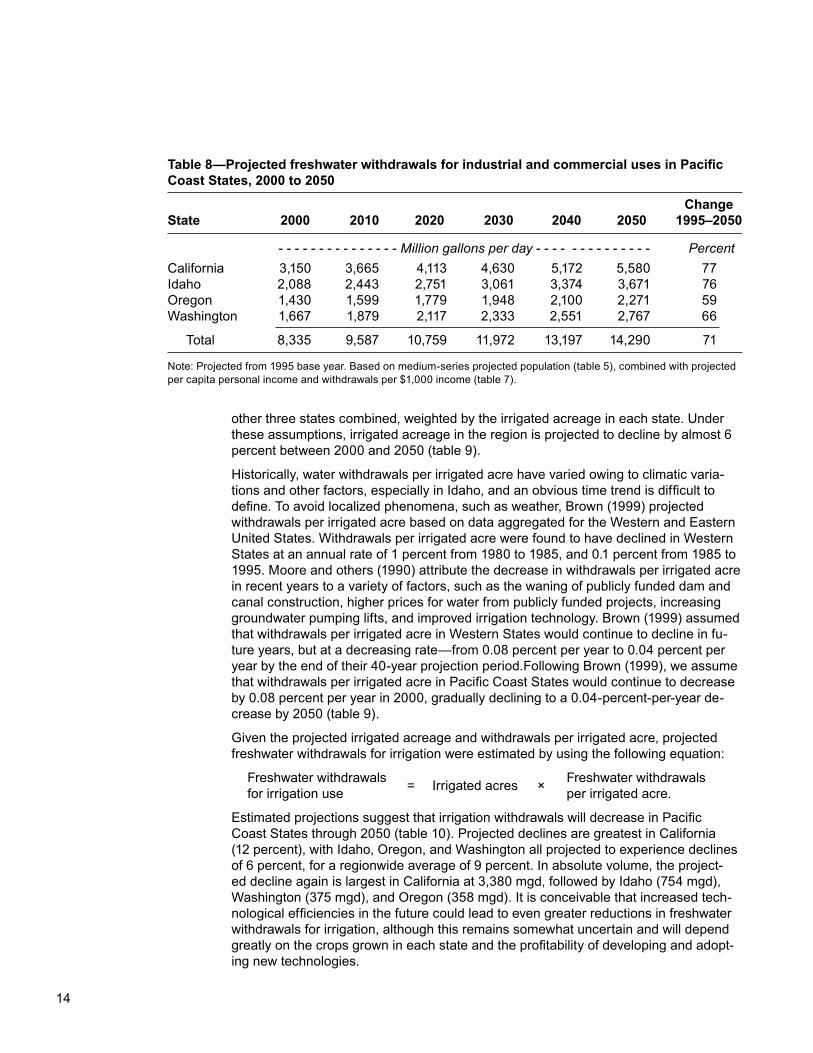
The projections indicate that all four states in the region will experience increases in freshwater withdrawals for industrial and commercial uses (table 8). The increases largely are due to projected increases in population and per capita incomes, which more than offset projected declines in withdrawals per aggregate income. Freshwater withdrawals for industrial and commercial uses are projected to increase most in California (77 percent by 2050), followed by Idaho (76 percent), Washington (66 percent), and Oregon (59 percent), making a 71-percent increase for the region as a whole. This is equivalent to an increase of 5,955 mgd over industrial and commercial freshwater withdrawal estimates for 2000. In percentage terms, however, this increase is less than the projected increase in the region’s population of 85 percent from 2000 to 2050 (table 5, medium series). Additional efficiency gains likely could be expected if some water use shifts from water-intensive manufacturing and other heavy industry to more service-oriented businesses, leading to lower rates of increase.
Irrigation water use is a complicated function of several factors. Population growth simultaneously increases demands for agricultural crops while decreasing the avail-ability of irrigable agricultural land because of the conversion of agricultural land to urban uses (Brown 1999). Other factors that affect irrigation water use include energy prices, irrigation technology, international markets, federal agricultural policies, and the increasing need to maintain instream flow for nonconsumptive uses such as recreation and wildlife habitat. Our irrigation withdrawal projections are based on a simplified set of two factors—the area of land under irrigation and freshwater withdrawals per irrigat-ed acre. These two determinants capture the effects of many of the factors mentioned.
Our expectations for trends in irrigated acreages are based on historical trends re-ported in the U.S. census of agriculture (USDA National Agricultural Statistics Service 1999, USDC Bureau of the Census 1995). Historical data show that irrigated acreages peaked in 1980 in all four states, and then declined until 1990 when they began to increase again. The relatively strong increase in 1995 suggests that recent declining trends may be slowing or reversing altogether.
We assume that irrigated acreage will continue a slow decline, largely because of ex-pectations of increasing conflicts between agriculture and urban land uses, increasing demands regarding maintenance of instream flow for endangered species, and declin-ing availability of water for irrigation. We assume that the rate of decline in irrigated acreage will be equivalent to the average annual percentage of change observed since 1980. Because in California both irrigated acres and percentage of change in ir-rigated acres have been so much larger than in other Pacific Coast States, we com-puted one average annual percentage of change for California and another for the
Projected Withdrawals for Irrigation
14 15
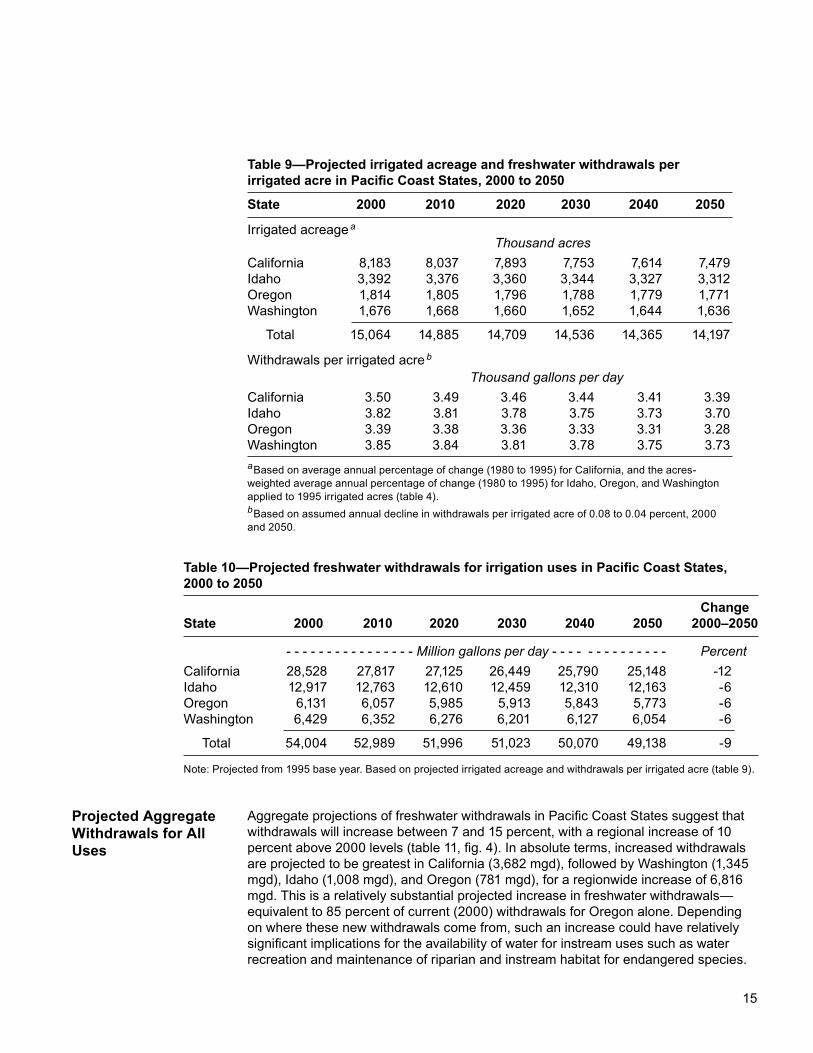
other three states combined, weighted by the irrigated acreage in each state. Under these assumptions, irrigated acreage in the region is projected to decline by almost 6 percent between 2000 and 2050 (table 9).
Historically, water withdrawals per irrigated acre have varied owing to climatic varia-tions and other factors, especially in Idaho, and an obvious time trend is difficult to define. To avoid localized phenomena, such as weather, Brown (1999) projected withdrawals per irrigated acre based on data aggregated for the Western and Eastern United States. Withdrawals per irrigated acre were found to have declined in Western States at an annual rate of 1 percent from 1980 to 1985, and 0.1 percent from 1985 to 1995. Moore and others (1990) attribute the decrease in withdrawals per irrigated acre in recent years to a variety of factors, such as the waning of publicly funded dam and canal construction, higher prices for water from publicly funded projects, increasing groundwater pumping lifts, and improved irrigation technology. Brown (1999) assumed that withdrawals per irrigated acre in Western States would continue to decline in fu-ture years, but at a decreasing rate—from 0.08 percent per year to 0.04 percent per year by the end of their 40-year projection period.Following Brown (1999), we assume that withdrawals per irrigated acre in Pacific Coast States would continue to decrease by 0.08 percent per year in 2000, gradually declining to a 0.04-percent-per-year de-crease by 2050 (table 9).
Given the projected irrigated acreage and withdrawals per irrigated acre, projected freshwater withdrawals for irrigation were estimated by using the following equation:
Freshwater withdrawals = Irrigated acres × Freshwater withdrawalsfor irrigation use per irrigated acre.
Estimated projections suggest that irrigation withdrawals will decrease in Pacific Coast States through 2050 (table 10). Projected declines are greatest in California (12 percent), with Idaho, Oregon, and Washington all projected to experience declines of 6 percent, for a regionwide average of 9 percent. In absolute volume, the project-ed decline again is largest in California at 3,380 mgd, followed by Idaho (754 mgd), Washington (375 mgd), and Oregon (358 mgd). It is conceivable that increased tech-nological efficiencies in the future could lead to even greater reductions in freshwater withdrawals for irrigation, although this remains somewhat uncertain and will depend greatly on the crops grown in each state and the profitability of developing and adopt-ing new technologies.
Table 8—Projected freshwater withdrawals for industrial and commercial uses in Pacific Coast States, 2000 to 2050
ChangeState 2000 2010 2020 2030 2040 2050 1995–2050
- - - - - - - - - - - - - - - Million gallons per day - - - - - - - - - - - - - - PercentCalifornia 3,150 3,665 4,113 4,630 5,172 5,580 77Idaho 2,088 2,443 2,751 3,061 3,374 3,671 76Oregon 1,430 1,599 1,779 1,948 2,100 2,271 59Washington 1,667 1,879 2,117 2,333 2,551 2,767 66
Total 8,335 9,587 10,759 11,972 13,197 14,290 71
Note: Projected from 1995 base year. Based on medium-series projected population (table 5), combined with projected per capita personal income and withdrawals per $1,000 income (table 7).
14 15
Table 9—Projected irrigated acreage and freshwater withdrawals per irrigated acre in Pacific Coast States, 2000 to 2050
State 2000 2010 2020 2030 2040 2050
Irrigated acreage a Thousand acresCalifornia 8,183 8,037 7,893 7,753 7,614 7,479Idaho 3,392 3,376 3,360 3,344 3,327 3,312Oregon 1,814 1,805 1,796 1,788 1,779 1,771Washington 1,676 1,668 1,660 1,652 1,644 1,636
Total 15,064 14,885 14,709 14,536 14,365 14,197
Withdrawals per irrigated acre b Thousand gallons per dayCalifornia 3.50 3.49 3.46 3.44 3.41 3.39Idaho 3.82 3.81 3.78 3.75 3.73 3.70Oregon 3.39 3.38 3.36 3.33 3.31 3.28Washington 3.85 3.84 3.81 3.78 3.75 3.73a Based on average annual percentage of change (1980 to 1995) for California, and the acres-weighted average annual percentage of change (1980 to 1995) for Idaho, Oregon, and Washington applied to 1995 irrigated acres (table 4).b Based on assumed annual decline in withdrawals per irrigated acre of 0.08 to 0.04 percent, 2000 and 2050.
Table 10—Projected freshwater withdrawals for irrigation uses in Pacific Coast States, 2000 to 2050
ChangeState 2000 2010 2020 2030 2040 2050 2000–2050
- - - - - - - - - - - - - - - - Million gallons per day - - - - - - - - - - - - - - PercentCalifornia 28,528 27,817 27,125 26,449 25,790 25,148 -12Idaho 12,917 12,763 12,610 12,459 12,310 12,163 -6Oregon 6,131 6,057 5,985 5,913 5,843 5,773 -6Washington 6,429 6,352 6,276 6,201 6,127 6,054 -6
Total 54,004 52,989 51,996 51,023 50,070 49,138 -9
Note: Projected from 1995 base year. Based on projected irrigated acreage and withdrawals per irrigated acre (table 9).
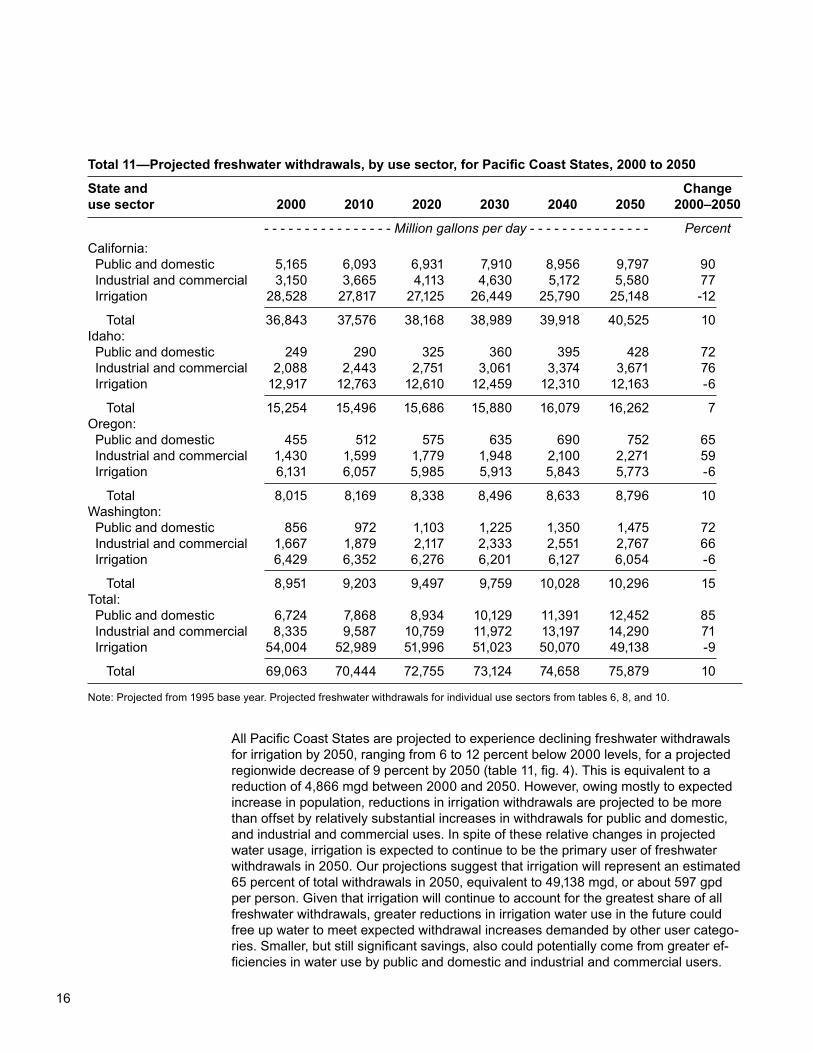
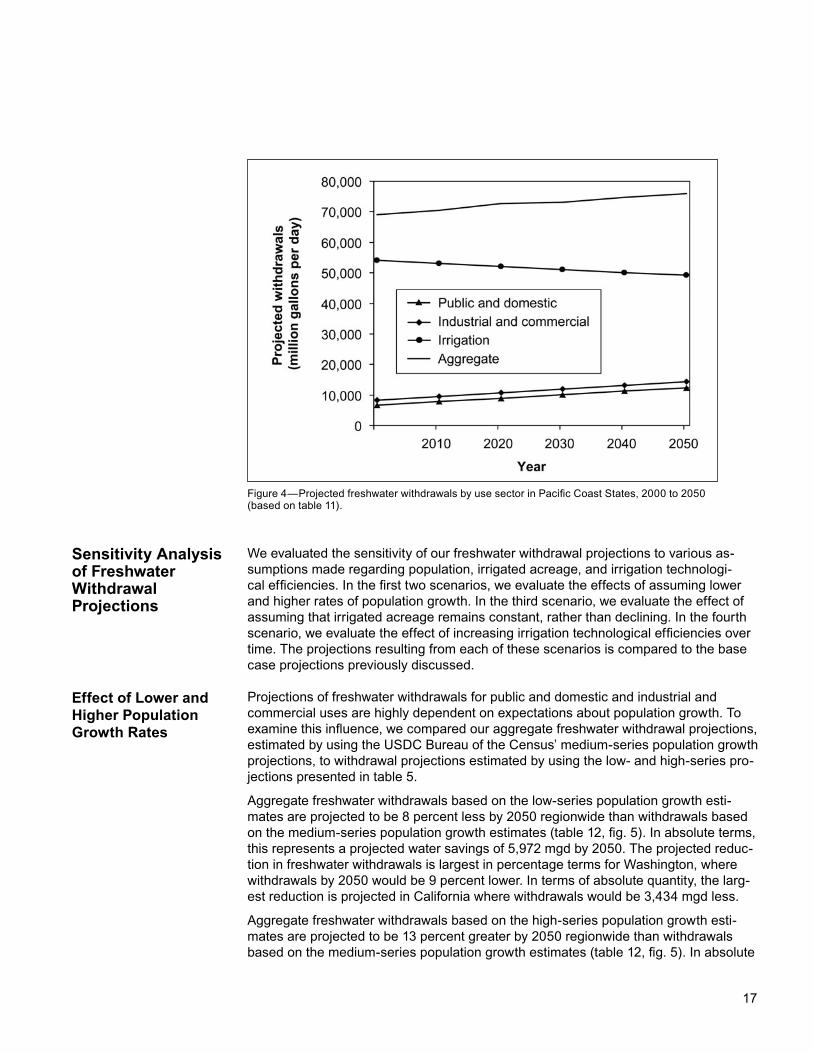
Aggregate projections of freshwater withdrawals in Pacific Coast States suggest that withdrawals will increase between 7 and 15 percent, with a regional increase of 10 percent above 2000 levels (table 11, fig. 4). In absolute terms, increased withdrawals are projected to be greatest in California (3,682 mgd), followed by Washington (1,345 mgd), Idaho (1,008 mgd), and Oregon (781 mgd), for a regionwide increase of 6,816 mgd. This is a relatively substantial projected increase in freshwater withdrawals—equivalent to 85 percent of current (2000) withdrawals for Oregon alone. Depending on where these new withdrawals come from, such an increase could have relatively significant implications for the availability of water for instream uses such as water recreation and maintenance of riparian and instream habitat for endangered species.
Projected Aggregate Withdrawals for All Uses
16 17
All Pacific Coast States are projected to experience declining freshwater withdrawals for irrigation by 2050, ranging from 6 to 12 percent below 2000 levels, for a projected regionwide decrease of 9 percent by 2050 (table 11, fig. 4). This is equivalent to a reduction of 4,866 mgd between 2000 and 2050. However, owing mostly to expected increase in population, reductions in irrigation withdrawals are projected to be more than offset by relatively substantial increases in withdrawals for public and domestic, and industrial and commercial uses. In spite of these relative changes in projected water usage, irrigation is expected to continue to be the primary user of freshwater withdrawals in 2050. Our projections suggest that irrigation will represent an estimated 65 percent of total withdrawals in 2050, equivalent to 49,138 mgd, or about 597 gpd per person. Given that irrigation will continue to account for the greatest share of all freshwater withdrawals, greater reductions in irrigation water use in the future could free up water to meet expected withdrawal increases demanded by other user catego-ries. Smaller, but still significant savings, also could potentially come from greater ef-ficiencies in water use by public and domestic and industrial and commercial users.
Total 11—Projected freshwater withdrawals, by use sector, for Pacific Coast States, 2000 to 2050
State and Changeuse sector 2000 2010 2020 2030 2040 2050 2000–2050
- - - - - - - - - - - - - - - - Million gallons per day - - - - - - - - - - - - - - - PercentCalifornia: Public and domestic 5,165 6,093 6,931 7,910 8,956 9,797 90 Industrial and commercial 3,150 3,665 4,113 4,630 5,172 5,580 77 Irrigation 28,528 27,817 27,125 26,449 25,790 25,148 -12
Total 36,843 37,576 38,168 38,989 39,918 40,525 10Idaho: Public and domestic 249 290 325 360 395 428 72 Industrial and commercial 2,088 2,443 2,751 3,061 3,374 3,671 76 Irrigation 12,917 12,763 12,610 12,459 12,310 12,163 -6
Total 15,254 15,496 15,686 15,880 16,079 16,262 7Oregon: Public and domestic 455 512 575 635 690 752 65 Industrial and commercial 1,430 1,599 1,779 1,948 2,100 2,271 59 Irrigation 6,131 6,057 5,985 5,913 5,843 5,773 -6
Total 8,015 8,169 8,338 8,496 8,633 8,796 10Washington: Public and domestic 856 972 1,103 1,225 1,350 1,475 72 Industrial and commercial 1,667 1,879 2,117 2,333 2,551 2,767 66 Irrigation 6,429 6,352 6,276 6,201 6,127 6,054 -6
Total 8,951 9,203 9,497 9,759 10,028 10,296 15Total: Public and domestic 6,724 7,868 8,934 10,129 11,391 12,452 85 Industrial and commercial 8,335 9,587 10,759 11,972 13,197 14,290 71 Irrigation 54,004 52,989 51,996 51,023 50,070 49,138 -9
Total 69,063 70,444 72,755 73,124 74,658 75,879 10
Note: Projected from 1995 base year. Projected freshwater withdrawals for individual use sectors from tables 6, 8, and 10.
16 17
We evaluated the sensitivity of our freshwater withdrawal projections to various as-sumptions made regarding population, irrigated acreage, and irrigation technologi-cal efficiencies. In the first two scenarios, we evaluate the effects of assuming lower and higher rates of population growth. In the third scenario, we evaluate the effect of assuming that irrigated acreage remains constant, rather than declining. In the fourth scenario, we evaluate the effect of increasing irrigation technological efficiencies over time. The projections resulting from each of these scenarios is compared to the base case projections previously discussed.
Projections of freshwater withdrawals for public and domestic and industrial and commercial uses are highly dependent on expectations about population growth. To examine this influence, we compared our aggregate freshwater withdrawal projections, estimated by using the USDC Bureau of the Census’ medium-series population growth projections, to withdrawal projections estimated by using the low- and high-series pro-jections presented in table 5.
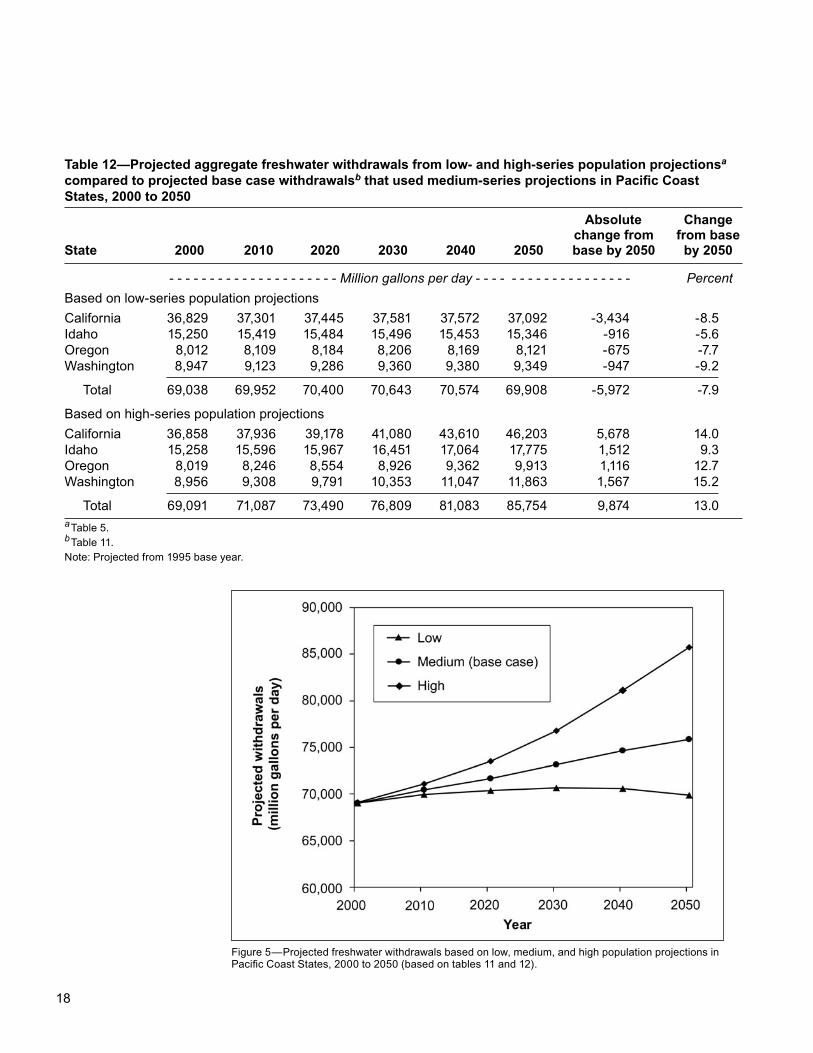
Aggregate freshwater withdrawals based on the low-series population growth esti-mates are projected to be 8 percent less by 2050 regionwide than withdrawals based on the medium-series population growth estimates (table 12, fig. 5). In absolute terms, this represents a projected water savings of 5,972 mgd by 2050. The projected reduc-tion in freshwater withdrawals is largest in percentage terms for Washington, where withdrawals by 2050 would be 9 percent lower. In terms of absolute quantity, the larg-est reduction is projected in California where withdrawals would be 3,434 mgd less.
Aggregate freshwater withdrawals based on the high-series population growth esti-mates are projected to be 13 percent greater by 2050 regionwide than withdrawals based on the medium-series population growth estimates (table 12, fig. 5). In absolute
Sensitivity Analysis of Freshwater Withdrawal Projections
Effect of Lower and Higher Population Growth Rates
Figure 4—Projected freshwater withdrawals by use sector in Pacific Coast States, 2000 to 2050 (based on table 11).
18 19
Table 12—Projected aggregate freshwater withdrawals from low- and high-series population projectionsa compared to projected base case withdrawalsb that used medium-series projections in Pacific Coast States, 2000 to 2050 Absolute Change change from from baseState 2000 2010 2020 2030 2040 2050 base by 2050 by 2050
- - - - - - - - - - - - - - - - - - - - - Million gallons per day - - - - - - - - - - - - - - - - - - - PercentBased on low-series population projectionsCalifornia 36,829 37,301 37,445 37,581 37,572 37,092 -3,434 -8.5Idaho 15,250 15,419 15,484 15,496 15,453 15,346 -916 -5.6Oregon 8,012 8,109 8,184 8,206 8,169 8,121 -675 -7.7Washington 8,947 9,123 9,286 9,360 9,380 9,349 -947 -9.2
Total 69,038 69,952 70,400 70,643 70,574 69,908 -5,972 -7.9
Based on high-series population projectionsCalifornia 36,858 37,936 39,178 41,080 43,610 46,203 5,678 14.0Idaho 15,258 15,596 15,967 16,451 17,064 17,775 1,512 9.3Oregon 8,019 8,246 8,554 8,926 9,362 9,913 1,116 12.7Washington 8,956 9,308 9,791 10,353 11,047 11,863 1,567 15.2
Total 69,091 71,087 73,490 76,809 81,083 85,754 9,874 13.0a Table 5.b Table 11.Note: Projected from 1995 base year.
Figure 5—Projected freshwater withdrawals based on low, medium, and high population projections in Pacific Coast States, 2000 to 2050 (based on tables 11 and 12).
18 19
terms, this represents a projected increase of 9,874 mgd by 2050. The projected in-crease in freshwater withdrawals again is largest in percentage terms for Washington, where withdrawals by 2050 would be 15 percent higher. In terms of absolute quantity, the largest increase is projected in California where withdrawals would be 5,678 mgd greater.
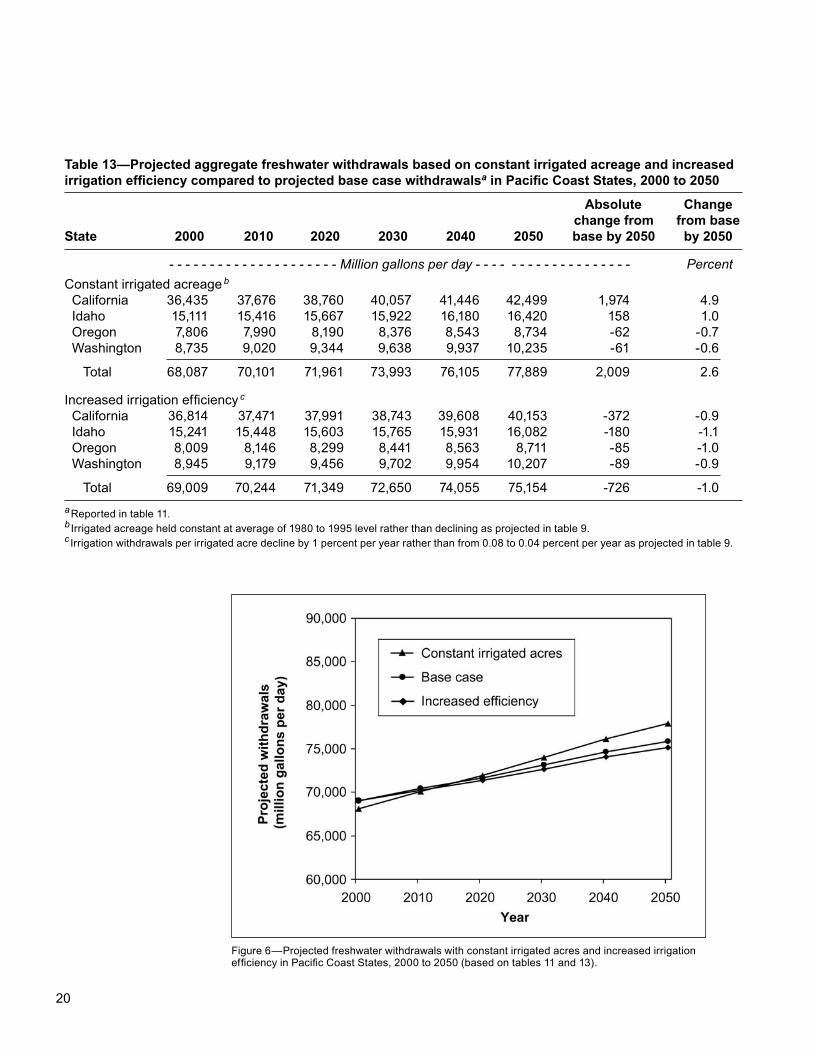
Our base case projections of freshwater withdrawals for irrigation assume that irrigat-ed acreage will decline in Pacific Coast States at a rate equal to the average annual decline observed between 1980 and 1995. However, 1995 data show that irrigated acreages actually have increased since 1990, indicating that irrigated acreages either could be increasing or at least may have stopped declining. We examined the influ-ence of irrigated acreage assumptions on our projected aggregate freshwater with-drawals by comparing our base case withdrawal projections, which assume annual declines in irrigated acres, to projections estimated by assuming irrigation acreage remains constant at the 1980 to 1995 average.
By 2050, aggregate freshwater withdrawals based on constant irrigation acreage are projected to be 2.6 percent greater than aggregate withdrawals based on declining ir-rigated acreage (table 13, fig. 6). In absolute terms, this represents a projected increase of 2,009 mgd by 2050. The projected increase occurs predominantly in California, reflecting that state’s large proportion of irrigated area in the region. The slight de-crease in projected water withdrawals relative to the base case scenario for Oregon and Washington is due to the relatively large jump in irrigated acres for 1990 to 1995; holding irrigated acreage constant at rates equivalent to averages for 1980 to 1995 as in this alternative projection, results in irrigated acreages in Oregon and Washington being slightly smaller than acreages projected in the base case, resulting in less water used.
Our base case projections of freshwater withdrawals for irrigation also assume that withdrawals per irrigated acre will gradually decrease each year from a 0.08-percent reduction in 2000 down to a 0.04-percent annual reduction by 2050. We examined the influence of potential water savings owing to even greater technological efficiencies by assuming that irrigation efficiency improves at a faster rate, with withdrawals per irrigated acre declining 1 percent per year. This is the highest annual rate of decline observed from historical data. Aggregate freshwater withdrawals based on a 1-percent annual decline in withdrawals per irrigated acreage are projected to be only 1 percent less regionwide by 2050 than projected aggregate withdrawals at 2050 in the base case (table 13, fig. 6). In absolute terms, projections of freshwater withdrawals would decline by only 726 mgd below base case projections by 2050.
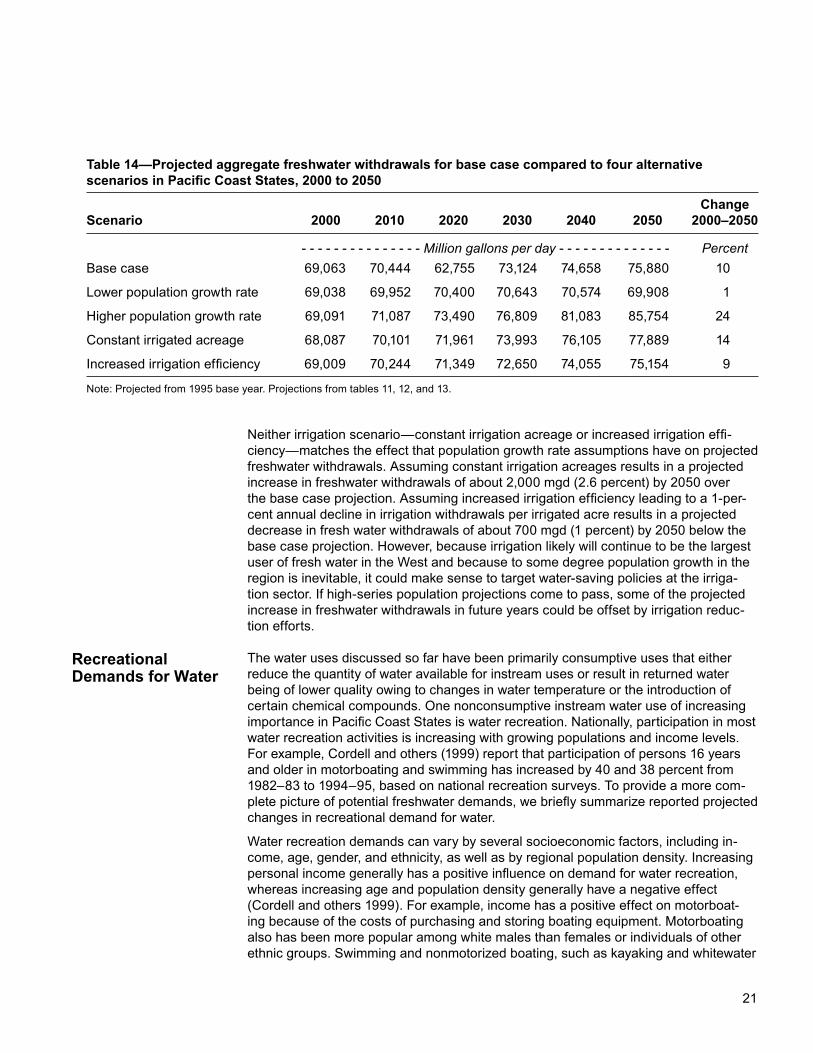
Projected increases in freshwater withdrawals resulting by 2050 under each sensitiv-ity analysis scenario range between 1 and 24 percent, with a base case increase of 10 percent (table 14). Adopting the high-population-series projections results in the great-est increase in withdrawals—9,874 mgd (13 percent) by 2050—when compared to the base case scenario. This is larger than the base case scenario projected aggregate withdrawals in 2050 for Oregon (8,796 mgd) and only slightly less than projected ag-gregate withdrawals in 2050 in Washington (10,296 mgd). On the other hand, adopting the low-population-series projections would result in a 6,000-mgd decrease in project-ed aggregate freshwater withdrawals by 2050, compared to the base case scenario (table 14). This potential savings is nearly equivalent to current freshwater withdrawals for public and domestic uses in California or current freshwater withdrawals for irriga-tion in either Oregon or Washington.
Effect of Constant Irrigated Acreage
Effect of Increased Irrigation Efficiency
Sensitivity Analysis Implications
20 21
Table 13—Projected aggregate freshwater withdrawals based on constant irrigated acreage and increased irrigation efficiency compared to projected base case withdrawalsa in Pacific Coast States, 2000 to 2050
Absolute Change change from from baseState 2000 2010 2020 2030 2040 2050 base by 2050 by 2050
- - - - - - - - - - - - - - - - - - - - - Million gallons per day - - - - - - - - - - - - - - - - - - - PercentConstant irrigated acreage b California 36,435 37,676 38,760 40,057 41,446 42,499 1,974 4.9 Idaho 15,111 15,416 15,667 15,922 16,180 16,420 158 1.0 Oregon 7,806 7,990 8,190 8,376 8,543 8,734 -62 -0.7 Washington 8,735 9,020 9,344 9,638 9,937 10,235 -61 -0.6
Total 68,087 70,101 71,961 73,993 76,105 77,889 2,009 2.6
Increased irrigation efficiency c California 36,814 37,471 37,991 38,743 39,608 40,153 -372 -0.9 Idaho 15,241 15,448 15,603 15,765 15,931 16,082 -180 -1.1 Oregon 8,009 8,146 8,299 8,441 8,563 8,711 -85 -1.0 Washington 8,945 9,179 9,456 9,702 9,954 10,207 -89 -0.9
Total 69,009 70,244 71,349 72,650 74,055 75,154 -726 -1.0a Reported in table 11.b Irrigated acreage held constant at average of 1980 to 1995 level rather than declining as projected in table 9.c Irrigation withdrawals per irrigated acre decline by 1 percent per year rather than from 0.08 to 0.04 percent per year as projected in table 9.
Figure 6—Projected freshwater withdrawals with constant irrigated acres and increased irrigation efficiency in Pacific Coast States, 2000 to 2050 (based on tables 11 and 13).
20 21
Neither irrigation scenario—constant irrigation acreage or increased irrigation effi-ciency—matches the effect that population growth rate assumptions have on projected freshwater withdrawals. Assuming constant irrigation acreages results in a projected increase in freshwater withdrawals of about 2,000 mgd (2.6 percent) by 2050 over the base case projection. Assuming increased irrigation efficiency leading to a 1-per-cent annual decline in irrigation withdrawals per irrigated acre results in a projected decrease in fresh water withdrawals of about 700 mgd (1 percent) by 2050 below the base case projection. However, because irrigation likely will continue to be the largest user of fresh water in the West and because to some degree population growth in the region is inevitable, it could make sense to target water-saving policies at the irriga-tion sector. If high-series population projections come to pass, some of the projected increase in freshwater withdrawals in future years could be offset by irrigation reduc-tion efforts.
The water uses discussed so far have been primarily consumptive uses that either reduce the quantity of water available for instream uses or result in returned water being of lower quality owing to changes in water temperature or the introduction of certain chemical compounds. One nonconsumptive instream water use of increasing importance in Pacific Coast States is water recreation. Nationally, participation in most water recreation activities is increasing with growing populations and income levels. For example, Cordell and others (1999) report that participation of persons 16 years and older in motorboating and swimming has increased by 40 and 38 percent from 1982–83 to 1994–95, based on national recreation surveys. To provide a more com-plete picture of potential freshwater demands, we briefly summarize reported projected changes in recreational demand for water.
Water recreation demands can vary by several socioeconomic factors, including in-come, age, gender, and ethnicity, as well as by regional population density. Increasing personal income generally has a positive influence on demand for water recreation, whereas increasing age and population density generally have a negative effect (Cordell and others 1999). For example, income has a positive effect on motorboat-ing because of the costs of purchasing and storing boating equipment. Motorboating also has been more popular among white males than females or individuals of other ethnic groups. Swimming and nonmotorized boating, such as kayaking and whitewater
Table 14—Projected aggregate freshwater withdrawals for base case compared to four alternative scenarios in Pacific Coast States, 2000 to 2050
ChangeScenario 2000 2010 2020 2030 2040 2050 2000–2050
- - - - - - - - - - - - - - - Million gallons per day - - - - - - - - - - - - - - PercentBase case 69,063 70,444 62,755 73,124 74,658 75,880 10
Lower population growth rate 69,038 69,952 70,400 70,643 70,574 69,908 1
Higher population growth rate 69,091 71,087 73,490 76,809 81,083 85,754 24
Constant irrigated acreage 68,087 70,101 71,961 73,993 76,105 77,889 14
Increased irrigation efficiency 69,009 70,244 71,349 72,650 74,055 75,154 9
Note: Projected from 1995 base year. Projections from tables 11, 12, and 13.
Recreational Demands for Water
22 23
rafting, generally are negatively affected by a region’s population density, which tends to be correlated with reduced access to suitable swimming and nonmotorized boating sites.
Periodic national and regional projections of participation in outdoor recreation are produced as part of the U.S. Department of Agriculture, Forest Service’s periodic assessments of the Nation’s forest resources, as mandated by the 1974 Resources Planning Act (USDA Forest Service 2001). To our knowledge, these are the only com-prehensive nationwide projections that characterize the potential demands for outdoor recreation activities of different types. The projections are based on assumptions regarding anticipated trends in key socioeconomic factors likely to affect recreation de-mands, including population, income, age, ethnicity, and gender. The projections also account for potential increases in the scarcity of recreation opportunities associated with increased congestion, reduction in site quality, loss of access, and loss of recre-ation sites because of their conversion to more developed uses as population densi-ties increase (Bowker and others 1999).
Regional projections of participation rates for several outdoor recreation categories prepared for the USDA Forest Service’s 2000 Resources Planning Act assessment are described in Bowker and others (1999). The regions include the North, South, Rocky Mountain, and Pacific. The Pacific region is the region most closely applicable to the Pacific Coast States discussed in this report, and includes California, Oregon, and Washington, as well as Alaska and Hawaii. Although the projected water recre-ation participation figures reported by Bowker and others (1999) for Pacific States are not directly comparable to the freshwater withdrawal figures we have projected for Pacific Coast States, they do provide a reasonable qualitative comparison of potential trends for the Pacific Coast States.
Bowker and others (1999) suggest that increases in population and real income over the next half century are expected to be the most important factors influencing rec-reation demands. Other factors, such as age, ethnicity, gender, education, and previ-ous recreation experience also can influence recreation behavior and likely also will play a role (Cordell and others 1990, Hof and Kaiser 1983, Walsh and others 1992). Increasing populations imply more recreationists, and rising personal incomes im-ply that people will have more disposable income to spend on recreation of all types. These increases in water recreation demand will place added pressure on water sup-pliers to maintain greater quantities of high-quality water instream for nonconsump-tive recreational uses, potentially benefiting other instream uses such as riparian and instream habitat for certain species.
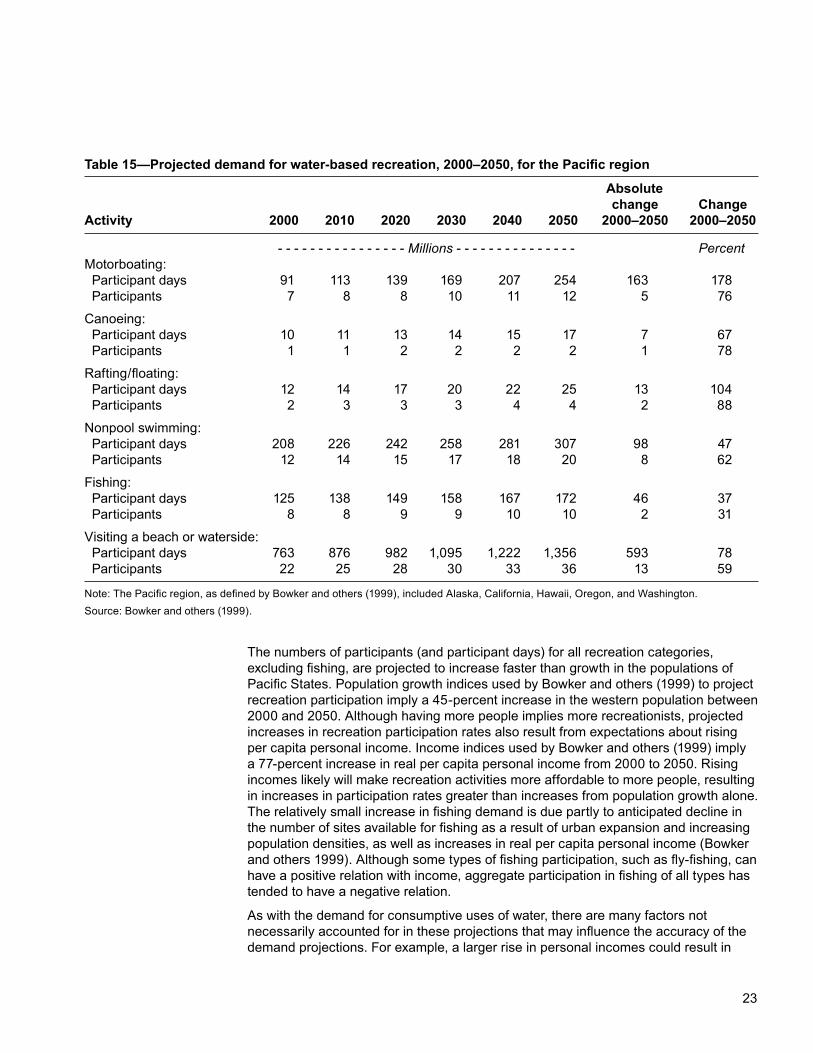
Projections of outdoor recreation participation reported by Bowker and others (1999) for Pacific States (Alaska, California, Hawaii, Oregon, and Washington) are presented for motorboating, canoeing, rafting and floating, nonpool swimming, fishing, and visit-ing a beach or waterside (table 15). Participation in all water recreation activities in the Pacific region is projected to increase by 2050 both in terms of number of participants and in number of participant days. The numbers of participant days spent motorboat-ing are projected to increase the most (178 percent), followed by rafting and floating (104 percent), canoeing (67 percent), nonpool swimming (47 percent), and fishing (37 percent). The order is slightly different when one considers projected numbers of participants, with rafting and floating projected to increase by 88 percent, followed by canoeing (78 percent), motorboating (76 percent), nonpool swimming (62 percent), and fishing (31 percent).
22 23
The numbers of participants (and participant days) for all recreation categories, excluding fishing, are projected to increase faster than growth in the populations of Pacific States. Population growth indices used by Bowker and others (1999) to project recreation participation imply a 45-percent increase in the western population between 2000 and 2050. Although having more people implies more recreationists, projected increases in recreation participation rates also result from expectations about rising per capita personal income. Income indices used by Bowker and others (1999) imply a 77-percent increase in real per capita personal income from 2000 to 2050. Rising incomes likely will make recreation activities more affordable to more people, resulting in increases in participation rates greater than increases from population growth alone. The relatively small increase in fishing demand is due partly to anticipated decline in the number of sites available for fishing as a result of urban expansion and increasing population densities, as well as increases in real per capita personal income (Bowker and others 1999). Although some types of fishing participation, such as fly-fishing, can have a positive relation with income, aggregate participation in fishing of all types has tended to have a negative relation.
As with the demand for consumptive uses of water, there are many factors not necessarily accounted for in these projections that may influence the accuracy of the demand projections. For example, a larger rise in personal incomes could result in
Table 15—Projected demand for water-based recreation, 2000–2050, for the Pacific region
Absolute change Change Activity 2000 2010 2020 2030 2040 2050 2000–2050 2000–2050
- - - - - - - - - - - - - - - - Millions - - - - - - - - - - - - - - - PercentMotorboating: Participant days 91 113 139 169 207 254 163 178 Participants 7 8 8 10 11 12 5 76Canoeing: Participant days 10 11 13 14 15 17 7 67 Participants 1 1 2 2 2 2 1 78Rafting/floating: Participant days 12 14 17 20 22 25 13 104 Participants 2 3 3 3 4 4 2 88Nonpool swimming: Participant days 208 226 242 258 281 307 98 47 Participants 12 14 15 17 18 20 8 62Fishing: Participant days 125 138 149 158 167 172 46 37 Participants 8 8 9 9 10 10 2 31Visiting a beach or waterside: Participant days 763 876 982 1,095 1,222 1,356 593 78 Participants 22 25 28 30 33 36 13 59
Note: The Pacific region, as defined by Bowker and others (1999), included Alaska, California, Hawaii, Oregon, and Washington.Source: Bowker and others (1999).
24 25
more disposable income, resulting in greater willingness to pay for water recreation activities in the future. Changes in the ethnic composition of the population could lead to demands for certain types of recreation over others. Changes in technologies could reduce the costs of recreation equipment and make certain activities more affordable to more individuals, or introduce entirely new recreation activities not yet foreseen. All of these factors contribute to uncertainty in anticipating what water recreation values and demand will be in the future.
At the same time, it is possible that the number of sites suitable for some water recre-ation activities could decline over time. Greater congestion at some water recreation sites, declines in site quality, and loss of some sites owing to their conversion to more intensive residential, commercial, or industrial uses, or changes in landowner objec-tives, could make other remaining sites more desirable. Although many water recre-ation sites receive some protection under Federal Wild and Scenic River, Wilderness Area, and National Recreation Area designations, whether these protections will be sufficient to meet all future demands is uncertain. Increased demands coupled with possible reductions in the supply of suitable or desirable water recreation sites imply a shortage of sites or reduction in the quality of water recreation experiences.
Although the likelihood and magnitude of these potential changes in water-based rec-reation demand remain somewhat uncertain, they will occur in the context of changing demands for water in other nonrecreational uses. Whether or not increased demands for various types of water recreation can be met is uncertain, especially in a future that is characterized by projected increases in freshwater withdrawals for public and domestic, industrial and commercial, and irrigation uses. The degree to which conflicts will arise between various uses and users of water will depend greatly on changes in water demands as well as the regional composition of interest groups, landowners, policymakers, and institutional structures already in place. Water management and policy will need to be based on sound evaluation of the socioeconomic and ecologi-cal tradeoffs involved in allocating limited water resources among multiple users and uses.
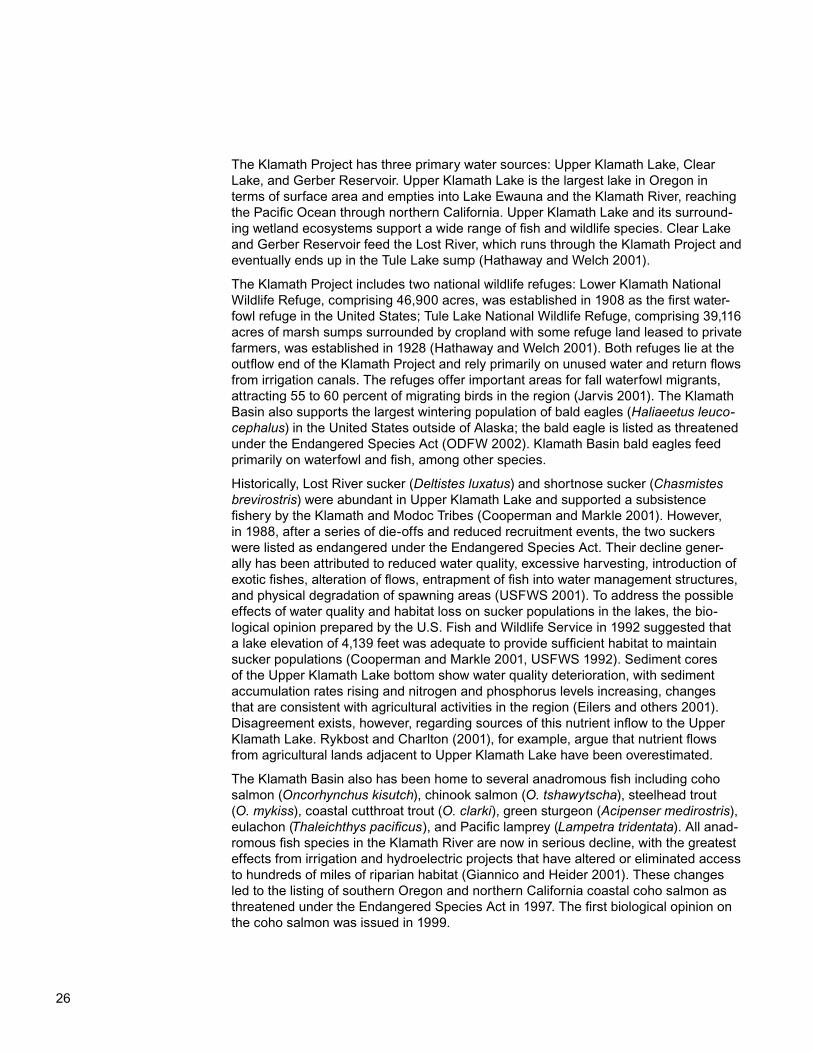
Changes in demands and supplies of water over time can lead to different manage-ment and policy needs. Because both the demand for and supply of water can depend on climate, relatively short-term fluctuations in weather patterns can result in relatively dramatic changes in the quantities of water demanded by and supplied to different us-ers. If such changes in water demands or supplies are sufficiently dramatic, conflicts among users can arise in the form of more direct competition among multiple users over a greatly diminished supply of water. Such circumstances can present difficult challenges to water resource managers and policymakers called upon to resolve these situations. Although these situations may call for swift and decisive action, the issues involved can be complex, the information needed to facilitate decisions may be lack-ing, and the tempers of those water users who suddenly find themselves with too little water may be severely taxed. Although we may be unable to predict where and when such crises may occur, we can anticipate some of the issues that may be involved.
An example of the conflicts that can arise among water users occurred during sum-mer 2001 in the Klamath River Basin in southern Oregon and northern California. Long-standing difficulties over allocating water resources in the basin reached critical levels when lower than average snow and rainfall during the winter and spring resulted in insufficient water to supply irrigators while also meeting the instream flow needs of endangered fish species. Water use restrictions imposed left about 1,200 farmers
Klamath Case Study
24 25
in the U.S. Bureau of Reclamation’s Klamath Project without their usual allocation of water for irrigation. The 2001 water crisis in the Klamath Basin illustrates the potential complexities water resource managers and policymakers can face as they attempt to allocate limited water resources among multiple users. In this section, we provide a brief history of water use in the Klamath Basin, summarize the 2001 water crisis, and examine the historical and potential water supply.
The Klamath Basin comprises 5,500 square miles in Oregon and California. We focus on the Upper Klamath Basin where the Klamath Project is located. The Upper Klamath Basin consists primarily of Oregon’s Klamath County and California’s Siskiyou and Modoc Counties. The population of the Upper Klamath Basin is about 120,000 people, of which Oregon’s Klamath County accounts for about half. The population of Klamath County increased rapidly during the first half of the 20th century from about 5,000 in 1900 to more than 40,000 around 1940 (Oregon Water Resources Board 1971). Since then the rate of increase has slowed, and in 1997 the population was about 63,000 (USDC Bureau of Economic Analysis 2002). The economic value of water in the Upper Klamath Basin was estimated at $2.3 billion in 1998, providing almost 60,000 jobs (Weber and Sorte 2001). Of these, agriculture, fishing, and forestry account for 10.4 percent of employment in the region.
Timber harvests in Klamath County increased rapidly during the first half of the 20th century from around 100 million board feet in the 1920s to more than 800 million board feet in the 1940s, stabilizing now near 400 million board feet (Eilers and others 2001). Cattle production in Klamath County also increased rapidly from about 40,000 head in the 1930s, peaking in 1960 with about 140,000 head, and stabilizing at about 100,000 head (Eilers and others 2001). Land use patterns in the Upper Klamath Basin have not changed much since 1982, when recording of consistent land use data began. In 1997, federal and nonfederal land accounted for 55 and 45 percent of the land. Of nonfederal land, forest land accounted for 61 percent, range and pasture lands accounted for 18 percent, and cropland accounted for 9 percent (USDA NRCS 2001).
The Klamath Project (the project) was initiated by the Bureau of Reclamation in 1906 to provide water to farmers for irrigation, and to wildlife refuges in Oregon and California. Located in the Upper Klamath Basin, the project was one of the earliest fed-eral reclamation projects. The Upper Klamath Basin includes the Williamson, Sprague, Upper Klamath Lake, Lost, Butte, and Upper Klamath watersheds (Oregon Water Resources Board 1971). In 1905, the Oregon and California State Legislatures ceded title of the Lower Klamath and Tule Lakes to the United States to develop the project. To provide and distribute this water, the project drains and reclaims lakebed lands of the Lower Klamath and Tule Lakes to store waters of the Klamath and Lost Rivers, and diverts irrigation water and controls flooding of the reclaimed lands (USDI Bureau of Reclamation 1998).
The draining of wetlands started around 1890, but under the project the cumula-tive drained acreage increased from about 40,000 acres in the 1920s, to 100,000 acres around 1930, and then to 190,000 acres in the early 1950s (USDI Bureau of Reclamation 1953). Today, the project provides irrigation water to 200,000 acres of agricultural land (Hathaway and Welch 2001). Primary products of agricultural lands in-cluded in the project are cereal grains, alfalfa hay, irrigated pastures for beef cattle, on-ions, potatoes, and grass seed (USDI Bureau of Reclamation 1998). As a result of the Klamath Project, about 80 percent of Klamath Basin wetlands are now gone (Portland Oregonian 2001a).
Background
26 27
The Klamath Project has three primary water sources: Upper Klamath Lake, Clear Lake, and Gerber Reservoir. Upper Klamath Lake is the largest lake in Oregon in terms of surface area and empties into Lake Ewauna and the Klamath River, reaching the Pacific Ocean through northern California. Upper Klamath Lake and its surround-ing wetland ecosystems support a wide range of fish and wildlife species. Clear Lake and Gerber Reservoir feed the Lost River, which runs through the Klamath Project and eventually ends up in the Tule Lake sump (Hathaway and Welch 2001).
The Klamath Project includes two national wildlife refuges: Lower Klamath National Wildlife Refuge, comprising 46,900 acres, was established in 1908 as the first water-fowl refuge in the United States; Tule Lake National Wildlife Refuge, comprising 39,116 acres of marsh sumps surrounded by cropland with some refuge land leased to private farmers, was established in 1928 (Hathaway and Welch 2001). Both refuges lie at the outflow end of the Klamath Project and rely primarily on unused water and return flows from irrigation canals. The refuges offer important areas for fall waterfowl migrants, attracting 55 to 60 percent of migrating birds in the region (Jarvis 2001). The Klamath Basin also supports the largest wintering population of bald eagles (Haliaeetus leuco-cephalus) in the United States outside of Alaska; the bald eagle is listed as threatened under the Endangered Species Act (ODFW 2002). Klamath Basin bald eagles feed primarily on waterfowl and fish, among other species.
Historically, Lost River sucker (Deltistes luxatus) and shortnose sucker (Chasmistes brevirostris) were abundant in Upper Klamath Lake and supported a subsistence fishery by the Klamath and Modoc Tribes (Cooperman and Markle 2001). However, in 1988, after a series of die-offs and reduced recruitment events, the two suckers were listed as endangered under the Endangered Species Act. Their decline gener-ally has been attributed to reduced water quality, excessive harvesting, introduction of exotic fishes, alteration of flows, entrapment of fish into water management structures, and physical degradation of spawning areas (USFWS 2001). To address the possible effects of water quality and habitat loss on sucker populations in the lakes, the bio-logical opinion prepared by the U.S. Fish and Wildlife Service in 1992 suggested that a lake elevation of 4,139 feet was adequate to provide sufficient habitat to maintain sucker populations (Cooperman and Markle 2001, USFWS 1992). Sediment cores of the Upper Klamath Lake bottom show water quality deterioration, with sediment accumulation rates rising and nitrogen and phosphorus levels increasing, changes that are consistent with agricultural activities in the region (Eilers and others 2001). Disagreement exists, however, regarding sources of this nutrient inflow to the Upper Klamath Lake. Rykbost and Charlton (2001), for example, argue that nutrient flows from agricultural lands adjacent to Upper Klamath Lake have been overestimated.
The Klamath Basin also has been home to several anadromous fish including coho salmon (Oncorhynchus kisutch), chinook salmon (O. tshawytscha), steelhead trout (O. mykiss), coastal cutthroat trout (O. clarki), green sturgeon (Acipenser medirostris), eulachon (Thaleichthys pacificus), and Pacific lamprey (Lampetra tridentata). All anad-romous fish species in the Klamath River are now in serious decline, with the greatest effects from irrigation and hydroelectric projects that have altered or eliminated access to hundreds of miles of riparian habitat (Giannico and Heider 2001). These changes led to the listing of southern Oregon and northern California coastal coho salmon as threatened under the Endangered Species Act in 1997. The first biological opinion on the coho salmon was issued in 1999.
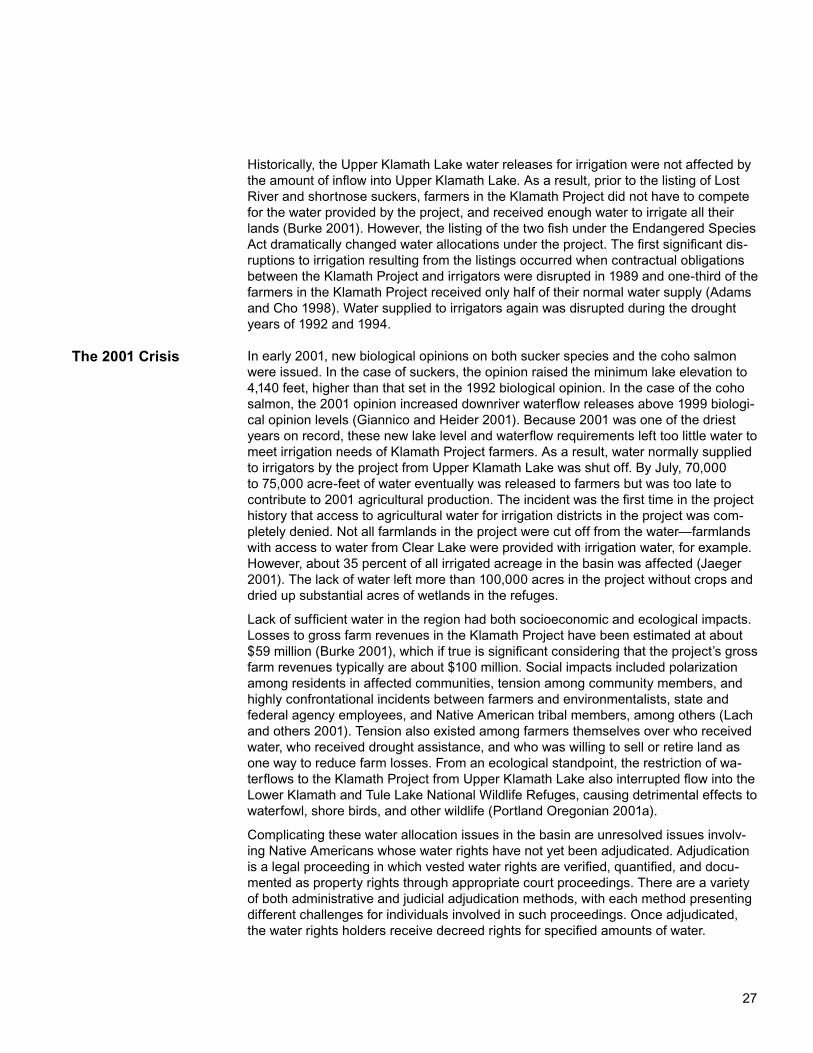
26 27
Historically, the Upper Klamath Lake water releases for irrigation were not affected by the amount of inflow into Upper Klamath Lake. As a result, prior to the listing of Lost River and shortnose suckers, farmers in the Klamath Project did not have to compete for the water provided by the project, and received enough water to irrigate all their lands (Burke 2001). However, the listing of the two fish under the Endangered Species Act dramatically changed water allocations under the project. The first significant dis-ruptions to irrigation resulting from the listings occurred when contractual obligations between the Klamath Project and irrigators were disrupted in 1989 and one-third of the farmers in the Klamath Project received only half of their normal water supply (Adams and Cho 1998). Water supplied to irrigators again was disrupted during the drought years of 1992 and 1994.
In early 2001, new biological opinions on both sucker species and the coho salmon were issued. In the case of suckers, the opinion raised the minimum lake elevation to 4,140 feet, higher than that set in the 1992 biological opinion. In the case of the coho salmon, the 2001 opinion increased downriver waterflow releases above 1999 biologi-cal opinion levels (Giannico and Heider 2001). Because 2001 was one of the driest years on record, these new lake level and waterflow requirements left too little water to meet irrigation needs of Klamath Project farmers. As a result, water normally supplied to irrigators by the project from Upper Klamath Lake was shut off. By July, 70,000 to 75,000 acre-feet of water eventually was released to farmers but was too late to contribute to 2001 agricultural production. The incident was the first time in the project history that access to agricultural water for irrigation districts in the project was com-pletely denied. Not all farmlands in the project were cut off from the water—farmlands with access to water from Clear Lake were provided with irrigation water, for example. However, about 35 percent of all irrigated acreage in the basin was affected (Jaeger 2001). The lack of water left more than 100,000 acres in the project without crops and dried up substantial acres of wetlands in the refuges.
Lack of sufficient water in the region had both socioeconomic and ecological impacts. Losses to gross farm revenues in the Klamath Project have been estimated at about $59 million (Burke 2001), which if true is significant considering that the project’s gross farm revenues typically are about $100 million. Social impacts included polarization among residents in affected communities, tension among community members, and highly confrontational incidents between farmers and environmentalists, state and federal agency employees, and Native American tribal members, among others (Lach and others 2001). Tension also existed among farmers themselves over who received water, who received drought assistance, and who was willing to sell or retire land as one way to reduce farm losses. From an ecological standpoint, the restriction of wa-terflows to the Klamath Project from Upper Klamath Lake also interrupted flow into the Lower Klamath and Tule Lake National Wildlife Refuges, causing detrimental effects to waterfowl, shore birds, and other wildlife (Portland Oregonian 2001a).
Complicating these water allocation issues in the basin are unresolved issues involv-ing Native Americans whose water rights have not yet been adjudicated. Adjudication is a legal proceeding in which vested water rights are verified, quantified, and docu-mented as property rights through appropriate court proceedings. There are a variety of both administrative and judicial adjudication methods, with each method presenting different challenges for individuals involved in such proceedings. Once adjudicated, the water rights holders receive decreed rights for specified amounts of water.
The 2001 Crisis
28 29
Historical and Future Water Supply
There are three tribes in the basin—Klamath, Modoc, and the Yahooskin Band of the Snake Indians—to which the two sucker species and the coho salmon are of particu-lar cultural significance. Historically, the fish were supported by water arising from or flowing through the tribes’ traditional hunting and fishing territories. The priority date of tribes’ reserved water right to support hunting and fishing lifestyles is “time imme-morial,” and essentially guarantees access to these species in quantities sufficient to meet tribal needs. Also, water use prior to 1909 is considered a vested right subject to adjudication. Although adjudication is ongoing, a vast majority of water rights have priority dates earlier than 1909 and likely will not be subject to transfer, which could be a significant obstacle to long-term resolution to water allocation issues in the basin.
Farmland in the project that was denied water in 2001 is relatively fertile and produces relatively high-value crops such as potatoes and onions. It has been estimated that if water rights could have been transferred from low-quality farmland outside the project to high-quality farmlands within the project before the crisis, more than 80 percent of the costs incurred in 2001 could have been avoided (Jaeger 2001). However, water right transfers from low- to high-quality land are not expected to take place in the near future because water rights to most low-quality land are under the adjudication pro-cess.
Short-term water supply in the Klamath Basin has varied greatly, but historically has been relatively stable. The historical annual precipitation at Klamath Falls has been 13.73 inches per water year with a standard deviation of 3.94 inches (fig. 7). The wa-ter year 2001 was one of the driest years in recent history, with annual precipitation of 7.26 inches—almost two standard deviations below average (Western Regional Climate Center 2002). However, such low-precipitation years are not uncommon. Historically, average monthly maximum temperatures also have fluctuated from year to year but have not necessarily indicated any long-term trend (fig. 8). Monthly maximum temperatures in the Klamath Basin averaged 48 °F in 2001, equivalent to the historical average since 1930 (Western Regional Climate Center 2002). However, climate mod-els do suggest long-term changes in precipitation and temperatures in the Klamath Basin in the future.
The climate may be changing in the Klamath Basin. To examine some potential climate scenarios, we look at the basin climate under two climate model forecasts. Long-term precipitation and temperature trends in the Klamath Basin were projected by using two global circulation models—the Canadian Climate Center model and the Hadley model (see, for example, National Assessment Synthesis Team 2001). The projections are based on emission scenario IS92a described by the Intergovernmental Panel on Climate Change (IPCC 2001). Average January temperatures are projected to increase from their historical average of 29.5 °F (1960 to 1993) to 36.7 °F according to the Canadian Climate Center model and to 36.5 °F according to the Hadley model. Average July temperatures are projected to increase from their historical average of 64.4°F (1960 to 1993), by 2.9 °F according to the Canadian Climate Center model, and by 4.7 °F according to the Hadley model. Both the Canadian Climate Center and Hadley models also project wetter winters. Monthly January precipitation is projected to increase from its historical average of 2.26 inches (1961 to 1990), to 3.4 inches according to the Canadian Climate Center model, and to 2.93 inches according to the Hadley model. Changes in summer precipitation, however, are ambiguous. The Canadian Climate Center model projects July precipitation of 0.6 inch by 2050—an increase above the 0.33 inch historical average. However, the Hadley model projects drier summers—only 0.30 inch precipitation by 2050.
28 29
Figure 7—Annual total precipitation in the Klamath Basin, 1930 to 2001 (Western Regional Climate Center 2002). The data reported for 1998 to 2001 were taken from Klamath Falls 2SSW. Data for all other years are taken from mean-adjusted data for Klamath Falls Agricultural Station.
Figure 8—Average monthly maximum temperature in the Klamath Basin, 1930 to 2001 (Western Regional Climate Center 2002). The data reported for 1998 to 2001 were taken from Klamath Falls 2SSW. Data for all other years are taken from mean-adjusted data for Klamath Falls Agricultural Station.
30 31
Most water use in the Klamath Basin relies on summer streamflow, which is highly dependent on snowmelt. Precipitation projections suggest winter precipitation will in-crease. However, if winter temperatures rise as also projected, precipitation may come as rain instead of snow, resulting in greater water availability in winter, but less in sum-mer. It is important to account for both precipitation and temperature when projecting changes in streamflow.
Runoff projections using the Canadian Climate Center model and the vegetation model MAPPS (see, for example, Bachelet and others 2001) suggest that an expected doubling of CO2 by the end of the 21st century could result in year-round increases in runoff. This could help to ease competition for water in the Klamath Basin by increas-ing water supply should climate change occur as expected. However, climate projec-tions, particularly those of precipitation, differ greatly across models, and both the Canadian Climate Center and the Hadley models tend to project wetter climatic condi-tions in the future than do other models. As a result, the future remains uncertain.
Many private and public entities in the Klamath Basin area claim water rights, includ-ing Crater Lake National Park, the USDA Forest Service, the Bureau of Reclamation, the Klamath Wildlife Refuge, tribes, irrigation districts, and individual farmers, among others. Although 2001 was one of the driest water years on record, with roughly 700 claims to water in the Upper Klamath watershed, even the wettest year would not pro-vide sufficient water to satisfy them all (Milstein 2001). Given the needs of irrigators and endangered species, it is obvious that water must be managed more effectively in the Klamath Basin. This includes focusing management and policy on alleviating con-flicts by manipulating the timing and quantity of diversions, especially during drought years, and transferring water rights among users.
Aiming to ease conflicts in the basin, a community-based approach has been pursued involving multiple stakeholders. One example is the Hatfield Klamath Basin Working Group formed in 1995 consisting of 27 public and private representatives. Their ob-jective is to reduce drought impacts by purchasing farmlands and restoring wetlands (Blake and others 2000). These types of collaborative efforts, in addition to public management, could facilitate equitable water resource reallocations in the Klamath Basin in the future.
The complex water resource issues that characterize the Klamath region are common to many of the water-dependent regions of the Western United States. Similar inci-dents can occur elsewhere, as the demands for all water uses, including those depen-dent on instream flows, increase. For example, as Oregon’s Governor Kitzhaber ob-served, “The same competing demands for water that caused the Klamath Basin crisis could trigger a similar, but much larger collapse in the Columbia River basin if those conflicts are not resolved” (Portland Oregonian 2001b). Better knowledge regarding current and projected demands for water in various uses is vital for anticipating and evaluating socioeconomic and ecological tradeoffs in the future, as well as devising appropriate water resource management and policies. Although this information will not avoid problems arising from changes in hydrological conditions, it can assist in designing policies to minimize costs and to ensure that costs are not disproportion-ately borne by specific groups. Management strategies and policies that reduce water demand through more efficient water use or establish water banks or markets to facili-tate transferring water rights from consumptive to instream uses when maintenance of riparian and instream habitat is a priority may be desirable.
Klamath Basin Future
30 31
Reliable natural science information also is needed. Biological opinions issued by the U.S. Fish and Wildlife Service and the National Marine Fisheries Service, which led to water restriction imposed on the Klamath Project, have been questioned by the National Academy of Science’s Committee on Endangered and Threatened Fishes in the Klamath River Basin (CETFKRB 2002). The committee was established by the Secretary of the Interior for the purpose of conducting an external review of the sci-entific basis for the biological opinions from a neutral point of view. It could be difficult to gain agreement among stakeholders on measures leading to any solution to future crises, without scientific information that all concerned groups agree on. Developing a body of accurate scientific information, with active involvement of federal and state agencies, academic researchers, farmers, environmentalists, and other relevant groups will be necessary to address the need for tradeoffs between natural resource management and increasing water demand in the future.
Freshwater withdrawals for public and domestic uses and industrial and commercial uses in the Pacific Coast States are projected to increase by 85 and 71 percent by 2050. This projected increase would exceed a projected 9-percent decline in with-drawals for irrigation, resulting in a 10-percent net increase in aggregate withdrawals by 2050. Estimated projections for freshwater withdrawals are greatly dependent on assumptions made regarding population change, irrigated acreage, and irrigation ef-ficiencies. Under different assumptions, projected increases in aggregate freshwater withdrawals for Pacific Coast States range from 1 to 24 percent by 2050. Projected reductions in withdrawals for irrigation range from 4 to 10 percent. In all scenarios test-ed, projected reductions in irrigation withdrawals are more than offset by projected in-creases in withdrawals for public and domestic uses (44 to 153 percent) and industrial and commercial uses (33 to 134 percent). If projections were to be made even further into the future and populations were expected to continue to grow, we might expect that irrigation efficiency gains and declines in irrigated acres eventually would level off, resulting in net increases in freshwater withdrawals even greater than amounts cur-rently projected.
Meanwhile, current trends suggest that demands for water recreation activities are increasing. Projections of water recreation demands suggest significant increases in participation in water recreation activities of all types by 2050. Participation rates in all water recreation activities, with the exception of fishing, are expected to grow faster than the population, owing in part to rising incomes. Projected increased demands for water recreation imply greater demands for maintaining instream flows that will bring water recreationists in more direct competition with consumptive uses of water in the future. The potential for conflict among different users exists if some users view their use as more important than others. Allocating our limited water resources across many diverse uses and users in an equitable manner will continue to challenge water resource managers and policymakers.
This report has considered only human uses of water, and has not considered the role of water as instream flow necessary in the maintenance of riparian habitat. All the uses of water discussed will have varying degrees of impacts on both the quantity and quality of instream flow in the future. Although consumptive uses of water can be in direct competition with instream uses, maintenance of riparian habitat for example, allocating water between consumptive and instream uses need not always involve
Summary and Conclusions
32 33
choices of who shall win and who shall lose. Sometimes multiple uses can be accom-modated by changing such factors as the timing or duration of water withdrawals in ways that avoid more difficult tradeoffs that exclude certain users or uses altogether. Finding such solutions, if they exist, requires the mutual cooperation of affected us-ers (or those who represent particular uses, as in the case of maintenance of riparian habitat) and scientific information that those users both agree on and trust.
The availability of water for both consumptive and instream uses will be determined in part by factors beyond the direct control of water resource managers and policymak-ers. Climatic conditions, drought cycles, and El Niño and La Niña ocean conditions, among other factors, will affect precipitation and water availability in the Western United States, and play a significant role in shaping necessary water resource alloca-tion decisions in the future. Although future demands for water in various uses can be estimated based on historical rates of use and past trends in key factors affecting use, the long-term effects of weather and climatic conditions on future water supply may be more difficult to predict.
Long-term trends in water consumption do suggest that allocating water resources could be even more challenging in the future. As seen by the 2001 water crisis in the Klamath Basin, short-term fluctuations in water supplies can significantly tax water re-source managers and policymakers in the near term as well. Such unforeseen events can call for relatively quick, but thoughtful allocation decisions on the part of manag-ers and policymakers, often with imperfect information about who will gain and lose as a result of management and policy actions. Socioeconomic and ecological research, conducted in the spirit of collaboration, could aid in such instances by increasing our understanding about how best to evaluate the tradeoffs involved in water resource al-location decisions. The body of knowledge about how people in Pacific Coast States would choose to resolve water resource allocation problems, such as those that oc-curred in the Klamath Basin in 2001, is relatively small. Increased research regarding the benefits and costs associated with alternative water resource allocations across multiple users and uses, both consumptive and instream, seems warranted. Investing in such research now would help to ensure that better information is available to meet the unforeseen water management and policy challenges of the future.
This study was funded by the Pacific Northwest Research Station’s Water Sustainability Initiative. We thank Richard Adams, Deborah Hennessy, Callie McConnell, and Deanna Stouder for helpful comments. We also thank Ray Drapek, U.S. Department of Agriculture, Forest Service, for providing long-term trend projec-tions of precipitation, temperature, and runoff in the Klamath Basin by using global circulation models.
When you know: Multiply by: To find:
Gallons 3.785 LitersAcres .405 HectaresAcre-feet .123 Hectare-metersInches 2.540 CentimetersFeet .305 MetersDegrees Fahrenheit Subtract 32, multiply by 0.556 Degrees Celsius
Acknowledgments
Metric Equivalents
32 33
Adams, R.M.; Cho, S.H. 1998. Agricultural and endangered species: an analysis of trade-offs in the Klamath Basin, Oregon. Water Resources Research. 34: 2741–2749.
Bachelet, D.; Neilson, R.P.; Lenihan, J.M.; Drapek, R.J. 2001. Climate change effects on vegetation distribution and carbon budget in the United States. Ecosystems. 4: 164–185.
Blake, T.A.; Blake, M.G.; Kittredge, W. 2000. Balancing water: restoring the Klamath Basin. Berkeley, CA: University of California Press. 175 p.
Bowker, J.M.; English, D.B.K.; Cordell, H.K. 1999. Projections of outdoor recreation participation. In: Cordell, H.K., principal investigator. Outdoor recreation in American life: a national assessment of demand and supply trends. Champaign, IL: Sagamore Publishing: 323–351. Chapter 6.
Brown, T.C. 1999. Past and future freshwater use in the United States: a technical document supporting the 2000 USDA Forest Service RPA assessment. Gen. Tech. Rep. RMRS-GTR-39. Fort Collins, CO: U.S. Department of Agriculture, Forest Service, Rocky Mountain Research Station. 47 p.
Burke, S. 2001. The effects of water allocation decisions on crop revenue in the Klamath Reclamation Project. In: Oregon State University and the University of California. Water allocation in the Klamath Reclamation Project, 2001: an assessment of natural resource, economic, social, and institutional issues with a focus on the Upper Klamath Basin. http://eesc.oregonstate.edu/agcomwebfile/edmat/html/sr/sr1037/sr1037.html. (18 April 2003).
California Department of Finance. 1998. Race/ethnic population with age and sex detail, 1970–2040. Sacramento, CA. http://www.dof.ca.gov/HTML/DEMOGRAP/data.htm. (6 March 2002).
Committee on Endangered and Threatened Fishes in the Klamath River Basin [CETFKRB]. 2002. Interim report: scientific evaluation of biological opinions on endangered and threatened fishes in the Klamath River Basin. Washington, DC: National Academy Press. 24 p.
Cooperman, M.S.; Markle, D.F. 2001. Relationship between Lost River and shortnose sucker biology and management of Upper Klamath Lake. In: Oregon State University and the University of California. Water allocation in the Klamath Reclamation Project, 2001: an assessment of natural resource, economic, social, and institutional issues. http://eesc.oregonstate.edu/agcomwebfile/edmat/html/sr/sr1037/sr1037.html. (18 April 2003).
Cordell, H.K.; Bergstrom, J.C.; Hartmann, L.A.; English, D.B.K. 1990. An analysis of the outdoor recreation and wilderness situation in the United States, 1989–2040. Gen. Tech. Rep. RM-GTR-189. Fort Collins, CO: U.S. Department of Agriculture, Forest Service, Rocky Mountain Forest and Range Experiment Station. 112 p.
Cordell, H.K.; McDonald, B.L.; Teasley, R.J. [and others]. 1999. Outdoor recreation participation trends. In: Cordell, H.K., principal investigator. Outdoor recreation in American life: a national assessment of demand and supply trends. Champaign, IL: Sagamore Publishing: 219–321. Chapter 5.
References
34 35
Eilers, J.; Kann, J.; Cornett, J. [and others]. 2001. Recent paleolimnology of Upper Klamath Lake, Oregon. Report to U.S. Bureau of Reclamation, Klamath Falls Office, Klamath Falls, OR.
Giannico, G.; Heider, C. 2001. Coho salmon and water management in the Klamath Basin. In: Oregon State University and the University of California. Water allocation in the Klamath Reclamation Project, 2001: an assessment of natural resource, economic, social, and institutional issues. http://eesc.oregonstate.edu/agcomwebfile/edmat/html/sr/sr1037/sr1037.html. (18 April 2003).
Guldin, R.W. 1989. An analysis of the water situation in the United States: 1989–2040. Gen. Tech. Rep. RM-GTR-177. Fort Collins, CO: U.S. Department of Agriculture, Rocky Mountain Forest and Range Experiment Station. 178 p.
Hathaway, R.; Welch, T. 2001. Background. In: Oregon State University and the University of California. Water allocation in the Klamath Reclamation Project, 2001: an assessment of natural resource, economic, social, and institutional issues. http://eesc.oregonstate.edu/agcomwebfile/edmat/html/sr/sr1037/sr1037.html. (18 April 2003).
Hof, J.G.; Kaiser, H.F. 1983. Long-term outdoor recreation participation projections for public land management agencies. Journal of Leisure Research. 15(1): 1–14.
Houston, L.L.; Kline, J.D.; Alig, R.J. 2002. Economics research supporting water resource stewardship in the Pacific Northwest. Gen. Tech. Rep. PNW-GTR-550. Portland, OR: U.S. Department of Agriculture, Forest Service, Pacific Northwest Research Station. 72 p.
Intergovernmental Panel on Climate Change [IPCC]. 2001. Climate change 2001: the scientific basis. Contribution of working group 1 to the third assessment report of the IPCC. New York: Cambridge University Press. 881 p.
Jaeger, W. 2001. Water allocation alternatives for the Upper Klamath Basin. In: Oregon State University and the University of California. Water allocation in the Klamath Reclamation Project, 2001: an assessment of natural resource, economic, social, and institutional issues. http://eesc.oregonstate.edu/agcomwebfile/edmat/html/sr/sr1037/sr1037.html. (18 April 2003).
Jarvis, R.L. 2001. Effects on waterfowl. In: Oregon State University and the University of California. Water allocation in the Klamath Reclamation Project, 2001: an assessment of natural resource, economic, social, and institutional issues. http://eesc.oregonstate.edu/agcomwebfile/edmat/html/sr/sr1037/sr1037.html. (18 April 2003).
Lach, D.; Richards, L.; Corson, C.; Case, P. 2001. Effects of the 2001 water allocation decisions on project-area communities. In: Oregon State University and the University of California. Water allocation in the Klamath Reclamation Project, 2001: an assessment of natural resource, economic, social, and institutional issues. http://eesc.oregonstate.edu/agcomwebfile/edmat/html/sr/sr1037/sr1037.html. (18 April 2003).
Milstein, M. 2001. Tensions flare over water rights. (Portland Oregonian.) May 6. http://www.oregonlive.com/special/klamath/index.ssf?/news/oregonian/lc_11klama06.frame. (5 October 2001).
34 35
Moore, M.R.; Crowhite, W.M.; Hosteler, J.E. 1990. Agricultural water use in the United States, 1950–85. In: Carr, J.E.; Chase, E.B.; Paulson, R.W.; Moody, D.W. National water summary 1987—hydrologic events and water supply use. Water Supply Paper 2350. Washington, DC: U.S. Geological Survey: 93-108.
Murray, C.R. 1968. Estimated use of water in the United States, 1965. Circular 556. Washington, DC: U.S. Geological Survey. 53 p.
Murray, C.R.; Reeves, E.B. 1972. Estimated use of water in the United States in 1970. Circular 676. Washington, DC: U.S. Geological Survey. 37 p.
Murray, C.R.; Reeves, E.B. 1977. Estimated use of water in the United States in 1975. Circular 765. Washington, DC: U.S. Geological Survey. 39 p.
National Assessment Synthesis Team. 2001. Climate change impacts on the United States: the potential consequences of climate variability and change. New York: Cambridge University Press. 612 p.
National Water Commission. 1973. Water policies for the future: final report to the Congress of the United States. Washington, DC: U.S. Government Printing Office. 579 p.
Oregon Department of Fish and Wildlife. 2002. Oregon list of threatened and endangered fish and wildlife species. http://www.dfw.state.or.us/ODFWhtml/Wildlife/t%26e.html. (22 May 2002).
Oregon Office of Economic Analysis. 1997. Long-term population and employment forecasts for Oregon components of population change, 1990-2040. Salem, OR. http://www.oea.das.state.or.us/demographic/longterm/or_sumry.htm. (6 March 2002).
Oregon Water Resources Board. 1971. Klamath Basin. Salem, OR. 288 p.
Osborn, C.T.; Schefter, J.E.; Shabman, L. 1986. The accuracy of water use forecasts: evaluation and implications. Water Resources Bulletin. 22(1): 101–109.
Portland Oregonian. 2001a. Klamath refuges go thirsty: critical wetland for migrating birds are drying up at alarming rates. July 13. http://www.oregonlive.com/environment/oregonian/index.ssf?/environment/oregonian/lc_61klama13.frame. (19 May 2003).
Portland Oregonian. 2001b. Kitzhaber: Columbia could mirror Klamath fight. August 17. http://www.oregonlive.com/news/oregonian/index.ssf?/xml/story.ssf/html_standard.xsl?/base/news/9980493323448133.xml. (19 May 2003).
Portland Oregonian. 2001c. The ecosystem of the Klamath Basin. August 29. http://www.oregonlive.com/news/oregonian/index.ssf?/xml/story.ssf/html_standard.xsl?/base/news/99908617217192308.xml. (19 May 2003).
Rykbost, K.A.; Charlton, B.A. 2001. Nutrient loading of surface waters in the Upper Klamath Basin: agricultural and natural sources. Special Report 1023. Corvallis, OR: Oregon State University, Agricultural Experiment Station. 14 p.
Solley, W.B.; Chase, E.B.; Mann, W.B. 1983. Estimated use of water in the United States in 1980. Circular 1001. Washington, DC: U.S. Geological Survey. 50 p.
Solley, W.B.; Merk, C.F.; Pierce, R.R. 1988. Estimated use of water in the United States in 1985. Circular 1004. Washington, DC: U.S. Geological Survey. 82 p.
36 37
Solley, W.B.; Pierce, R.R.; Pearlman, H.A. 1993. Estimated use of water in the United States in 1990. Circular 1081. Washington, DC: U.S. Geological Survey. 76 p.
Solley, W.B.; Pierce, R.R.; Pearlman, H.A. 1998. Estimated use of water in the United States in 1995. Circular 1200. Washington, DC: U.S. Geological Survey. 71 p.
U.S. Department of Agriculture, Forest Service. 2001. 2000 RPA assessment of forest and range lands. FS-687. Washington, DC. 78 p.
U.S. Department of Agriculture, National Agricultural Statistics Service. 1999. Census of agriculture 1997 [CD-ROM]. Washington, DC.
U.S. Department of Agriculture, Natural Resources Conservation Service [NRCS]. 2001. National resources inventory [CD-ROM] Version 1. Fort Worth, TX.
U.S. Department of Commerce, Bureau of the Census. 1995. Census of agriculture 1992 [CD-ROM]. Washington, DC.
U.S. Department of Commerce, Bureau of the Census. 2000a. Population projections for states by age, sex, race, and Hispanic origin, 1995 to 2025. Washington, DC. http://www.census.gov/population/projections/state/stpjpop.txt. (6 March 2002).
U.S. Department of Commerce, Bureau of the Census. 2000b. National population projections, annual projections of the total resident population as of July 1, 1999 to 2100. Washington, DC. http://www.census.gov/population/projections/nation/summary/np-t1.txt. (6 March 2002).
U.S. Department of Commerce, Bureau of Economic Analysis. 1992. County projections to 2040 [CD-ROM]. Washington, DC.
U.S. Department of Commerce, Bureau of Economic Analysis. 2001. Regional accounts data: annual state personal income. Washington, DC. http://www.bea.doc.gov/bea/regional/spi/. (19 August 2001).
U.S. Department of Commerce, Bureau of Economic Analysis. 2002. Regional accounts data: annual state personal income. Washington, DC. http://www.bea.doc.gov/bea/regional/reis/. (19 August 2002).
U.S. Department of Commerce, National Marine Fisheries Services [NMFS]. 2001. Biological opinion: ongoing Klamath Project operations. Long Beach, CA. 58 p.
U.S. Department of the Interior, Bureau of Reclamation. 1953. Reclamation accomplishments 1905–1953. Klamath Project Oregon-California. Washington, DC. 49 p.
U.S. Department of the Interior, Bureau of Reclamation. 1998. Klamath Project Oregon-California. Sacramento, CA: U.S. Government Printing Office. [Pages unknown].
U.S. Department of the Interior, Fish and Wildlife Service [USFWS]. 1992. Biological opinion on effects of long-term operation of the Klamath Project. Klamath Falls, OR. [Pages unknown].
36 37
U.S. Department of the Interior, Fish and Wildlife Service [USFWS]. 2001. Biological/conference opinion regarding the effects of operation of the Bureau of Reclamation’s Klamath Project on the endangered Lost River sucker (Deltistes luxatus), endangered shortnose sucker (Chasmistes brevirostris), threatened bald eagle (Haliaeetus leucocephalus), and proposed critical habitat for the Lost River/shortnose suckers. Klamath Falls, OR. 295 p.
Walsh, R.G.; Jon, K.H.; McKean, J.R.; Hof, J. 1992. Effect of price on forecasts of participation in fish and wildlife recreation: an aggregate demand model. Journal of Leisure Research. 21: 140–156.
Washington Office of Financial Management. 2001. Forecast of the state population by age and sex, 1990–2030. Olympia, WA. http://www.ofm.wa.gov/popagesex19702020/4CAST00_rev2.xls. (6 March 2002).
Water Resources Council. 1968. The Nation’s water resources. Washington, DC: U.S. Government Printing Office. [Pages unknown].
Water Resources Council. 1978. The Nation’s water resources. Washington, DC: U.S. Government Printing Office. [Pages unknown].
Weber, B.; Sorte, B. 2001. The Upper Klamath Basin economy and the role of agriculture. In: Oregon State University and the University of California. Water allocation in the Klamath Reclamation Project, 2001: an assessment of natural resource, economic, social, and institutional issues. http://eesc.oregonstate.edu/agcomwebfile/edmat/html/sr/sr1037/sr1037.html. (18 April 2003).
Western Regional Climate Center. 2002. Climatological data summaries, Klamath Falls Agricultural Station, Oregon (354511). http://www.wrcc.dri.edu/climsum.html. (19 May 2003).
Wollman, N.; Bonem, G.W. 1971. The outlook for water quality, quantity, and national growth. Baltimore, MD: Johns Hopkins University Press. 286 p.

The Forest Service of the U.S. Department of Agriculture is dedicated to the principle of multiple use management of the Nation’s forest resources for sustained yields of wood, water, forage, wildlife, and recreation. Through forestry research, cooperation with the States and private forest owners, and management of the National Forests and National Grasslands, it strives—as directed by Congress—to provide increasingly greater service to a growing Nation.
The U.S. Department of Agriculture (USDA) prohibits discrimination in all its programs and activities on the basis of race, color, national origin, gender, religion, age, disability, political beliefs, sexual orientation, or marital or family status. (Not all prohibited bases apply to all programs.) Persons with disabilities who require alternative means for communication of program information (Braille, large print, audiotape, etc.) should contact USDA’s TARGET Center at (202) 720-2600 (voice and TDD).
To file a complaint of discrimination, write USDA, Director, Office of Civil Rights, Room 326-W, Whitten Building, 14th and Independence Avenue, SW, Washington, DC 20250-9410 or call (202) 720-5964 (voice and TDD). USDA is an equal opportunity provider and employer.
Pacific Northwest Research Station Web site http://www.fs.fed.us/pnwTelephone (503) 808-2592Publication requests (503) 808-2138FAX (503) 808-2130E-mail [email protected] address Publications Distribution Pacific Northwest Research Station P.O. Box 3890 Portland, OR 97208-3890
U.S. Department of AgriculturePacific Northwest Research Station333 SW First AvenueP.O. Box 3890Portland, OR 97208-3890
Official BusinessPenalty for Private Use, $300