Embed Size (px)
Citation preview

Ref 4347
For GRS Roadstone Limited
c/o David L Walker Limited
Albion House
89 Station Road
Eckington
Sheffield
S21 4FW
Date 14 April 2015
Passenham Quarry
Southern Extension
Noise Assessment
Author Dr Robert Storey

Page 2 of 49
The Author
Robert Storey BEng PhD MIOA (Consultant) obtained his Bachelor of Engineering degree
in Mining Engineering from the University of Leeds in 1993 and gained his PhD in “The
Acoustic Response of Structures to Blast Induced Ground Vibration” from the University of
Leeds in 1998. He is a Member of the Institute of Acoustics and joined WBM in 2007 after
working in acoustic consultancy and Environmental Health since 1999.
Walker Beak Mason
Walker Beak Mason (WBM) is an established independent acoustic consultancy
specialising in architectural & building acoustics and environmental noise. WBM is a
member of the Association of Noise Consultants and is also an Associate Assessor
Member of the Institute of Environmental Management & Assessment. The Consultants
are Members or Fellows of the Institute of Acoustics.
Page 3 of 49
Contents
The Author .......................................................................................................................... 2
Walker Beak Mason ........................................................................................................... 2
1 Introduction ................................................................................................................. 4
2 Assessment Methodology .......................................................................................... 4
2.1 National Planning Policy Framework ............................................................................... 4
2.2 Local Authority ................................................................................................................. 8
3 Site Description ......................................................................................................... 11
4 Measurement Methodology ...................................................................................... 12
4.1 Measurement Description .............................................................................................. 12
4.2 Results .......................................................................................................................... 13
5 Evaluation and Analysis of Noise Data ................................................................... 14
6 Calculated Site Noise Levels .................................................................................... 15
6.1 Calculated Site Noise Levels ......................................................................................... 15
6.2 Noise Calculation Methodology ..................................................................................... 16
6.3 Noise Sources and Sound Power Levels ....................................................................... 17
6.4 Site Operation Assumptions .......................................................................................... 18
6.5 Effects on Assessment Locations .................................................................................. 19
6.6 Out of Hours Operations ................................................................................................ 20
6.7 Temporary Operations ................................................................................................... 21
7 Assessment of Residual Impacts ............................................................................ 22
8 Summary and Conclusions ...................................................................................... 26
Appendix A – Glossary of Acoustic Terms ................................................................... 28
Appendix B – Site Location Plan & Measurement Locations ...................................... 30
Appendix C – Instrumentation and Calibration Details ................................................ 31
Appendix D – Daytime Weather Conditions .................................................................. 36
Appendix E – Baseline Survey Results (Samples)........................................................ 37
Appendix F – Baseline Survey Results (Installation).................................................... 41
Appendix G – Plant Noise Survey Results .................................................................... 46
Appendix H – Noise Calculation Method and Calculation Sheet ................................. 48
Page 4 of 49
1 Introduction
GRS Roadstone Limited proposes a southern extension to the existing Passenham Quarry
in Northamptonshire to extract an estimated 600,000 tonnes of sand and gravel over a four
and a half to five and a half year period from an area located to the south of the existing
quarry plant site. The mineral is to be stockpiled and then processed on site by means of
the existing processing plant before being transported off site by road going HGVs using
the existing site access. It is also proposed that the void is infilled with imported inert
materials and restored to near original ground levels.
This report sets out the findings of baseline noise surveys conducted in January, February
and March 2015 at positions representative of the closest dwellings to the proposed
extension area and discusses noise criteria in relation to the background noise levels
observed in January, February and March 2015, for mineral extraction and infilling in the
proposed southern extension.
It sets out the calculated noise levels arising from the workings and compares those
calculated noise levels with suggested site noise limits at the nearest dwellings to the site.
The noise criteria are based on current advice from the government contained in the web
document “Planning Practice Guidance”, dated March 2014, which was published to
complement the National Planning Policy Framework (NPPF), dated March 2012.
Reference is specifically made to the “Minerals” and “Noise emissions” elements of the
guidance.
To aid comprehension, a glossary of acoustic terms is presented in Appendix A.
2 Assessment Methodology
The various relevant noise guidance documents used in this assessment are detailed
below.
2.1 National Planning Policy Framework
The National Planning Policy Framework (NPPF) was published in March 2012 with
immediate effect and sets out the Government‟s planning policies for England. At the heart
of the National Planning Policy Framework is a presumption in favour of sustainable
development.

Page 5 of 49
The NPPF revoked and replaced a number of Planning Policy Statements (PPS), Planning
Policy Guidance (PPG) and other guidance documents, including Planning Policy
Guidance 24: Planning and Noise.
With regard to noise there are various aims, including that noise from a new development
should avoid giving rise to significant adverse impacts on health and quality of life, and that
other adverse impacts should be mitigated and reduced to a minimum including through
the use of conditions.
Section 11 of the NPPF (Conserving and enhancing the natural environment) refers
specifically to noise in the following paragraphs:
“109. The planning system should contribute to and enhance the natural and local environment
by…preventing both new and existing development from contributing to or being put at
unacceptable risk from, or being adversely affected by unacceptable levels of soil, air, water
or noise pollution or land instability...”
“123. Planning policies and decisions should aim to:
avoid noise from giving rise to significant adverse impacts on health and quality of life as a
result of new development;
mitigate and reduce to a minimum other adverse impacts on health and quality of life arising
from noise from new development, including through the use of conditions;
recognise that development will often create some noise and existing businesses wanting to
develop in continuance of their business should not have unreasonable restrictions put on
them because of changes in nearby land uses since they were established (subject to the
provisions of the Environmental Protection Act 1990 and other relevant law); and
identify and protect areas of tranquillity which have remained relatively undisturbed by noise
and are prized for their recreational and amenity value for this reason.”
Technical guidance on noise was provided in more detail in the accompanying document
“Technical Guidance to the National Planning Policy Framework”, dated March 2012, which
was superseded in March 2014 by the Planning Practice Guidance.
Paragraphs 19 to 22 inclusive of the “Minerals” chapter of the Planning Practice Guidance
are under the heading “Noise emissions” within the section “Assessing environmental
impacts from mineral extraction”.

Page 6 of 49
Paragraph 19 states:
“How should minerals operators seek to control noise emissions?
Those making mineral development proposals, including those for related similar
processes such as aggregates recycling and disposal of construction waste, should carry
out a noise impact assessment, which should identify all sources of noise and, for each
source, take account of the noise emission, its characteristics, the proposed operating
locations, procedures, schedules and duration of work for the life of the operation, and its
likely impact on the surrounding neighbourhood.
Proposals for the control or mitigation of noise emissions should:
consider the main characteristics of the production process and its environs,
including the location of noise-sensitive properties and sensitive environmental
sites;
assess the existing acoustic environment around the site of the proposed
operations, including background noise levels at nearby noise-sensitive properties;
estimate the likely future noise from the development and its impact on the
neighbourhood of the proposed operations;
identify proposals to minimise, mitigate or remove noise emissions at source;
monitor the resulting noise to check compliance with any proposed or imposed
conditions.”
Paragraph 20 states:
“How should mineral planning authorities determine the impact of noise?
Mineral planning authorities should take account of the prevailing acoustic environment and
in doing so consider whether or not noise from the proposed operations would:
give rise to a significant adverse effect;
give rise to an adverse effect; and
enable a good standard of amenity to be achieved.

Page 7 of 49
In line with the Explanatory Note of the Noise Policy Statement for England, this would
include identifying whether the overall effect of the noise exposure would be above or
below the significant observed adverse effect level and the lowest observed adverse effect
level for the given situation. As noise is a complex technical issue, it may be appropriate to
seek experienced specialist assistance when applying this policy.”
Paragraph 21 of the Planning Practice Guidance states:
“What are the appropriate noise standards for mineral operators for normal operations?
Mineral planning authorities should aim to establish a noise limit, through a planning
condition, at the noise-sensitive property that does not exceed the background noise level
(LA90,1h) by more than 10dB(A) during normal working hours (0700-1900). Where it will be
difficult not to exceed the background level by more than 10dB(A) without imposing
unreasonable burdens on the mineral operator, the limit set should be as near that level as
practicable. In any event, the total noise from the operations should not exceed 55dB(A)
LAeq, 1h (free field). For operations during the evening (1900-2200) the noise limits should
not exceed the background noise level (LA90,1h) by more than 10dB(A) and should not
exceed 55dB(A) LAeq, 1h (free field ). For any operations during the period 22.00 – 07.00
noise limits should be set to reduce to a minimum any adverse impacts, without imposing
unreasonable burdens on the mineral operator. In any event the noise limit should not
exceed 42dB(A) LAeq,1h (free field) at a noise sensitive property.
Where the site noise has a significant tonal element, it may be appropriate to set specific
limits to control this aspect. Peak or impulsive noise, which may include some reversing
bleepers, may also require separate limits that are independent of background noise (e.g.
Lmax in specific octave or third-octave frequency bands – and that should not be allowed
to occur regularly at night.)
Care should be taken, however, to avoid any of these suggested values being implemented
as fixed thresholds as specific circumstances may justify some small variation being
allowed.”
Paragraph 22 of the Planning Practice Guidance states:
“What type of operations may give rise to particularly noisy short-term activities and what
noise limits may be appropriate?

Page 8 of 49
Activities such as soil-stripping, the construction and removal of baffle mounds, soil storage
mounds and spoil heaps, construction of new permanent landforms and aspects of site
road construction and maintenance.
Increased temporary daytime noise limits of up to 70dB(A) LAeq 1h (free field) for periods
of up to eight weeks in a year at specified noise-sensitive properties should be considered
to facilitate essential site preparation and restoration work and construction of baffle
mounds where it is clear that this will bring longer-term environmental benefits to the site or
its environs.
Where work is likely to take longer than eight weeks, a lower limit over a longer period
should be considered. In some wholly exceptional cases, where there is no viable
alternative, a higher limit for a very limited period may be appropriate in order to attain the
environmental benefits. Within this framework, the 70 dB(A) LAeq 1h (free field) limit
referred to above should be regarded as the normal maximum.”
2.2 Local Authority
The extension falls under the jurisdiction of Northamptonshire County Council and South
Northamptonshire Council. The site currently operates under planning permissions from
Northamptonshire County Council dated 22 June 2012 (Refs. 12/00025/MIN and
12/00026/MIN) for the retention of the processing plant facility and the retention of an
access roadway respectively. Neither of these permissions contain any specific noise
limits, but reference is made to “a scheme of measures to control noise” in the former and
“a scheme for noise attenuation, in conjunction with any such measures to be submitted to
Milton Keynes Council for the Calverton working site“ in the latter.
The current extraction area near Calverton is covered by a planning permission from Milton
Keynes Council dated 20 December 2012 (Ref. 12/00786/MIN), Conditions 23 to 27 of
which relate to noise as follows:
“(23) With the exception of soil stripping and bund formation operations, and the bund
removal and soil replacement operations, the LAeq (60 mins) specific noise levels at the
noise sensitive properties shall not exceed 55 dB Laeq 1 hour.”

Page 9 of 49
“(24) For temporary operations, the free field noise level at noise sensitive properties shall
not exceed 70dB LAeq, 1 hour. Temporary operations shall not exceed eight weeks in any
continuous 12 month period for work affecting any noise sensitive property. Temporary
operations shall comprise site preparation bund formation and removal, site stripping and
restoration and other temporary activities agreed beforehand with the Mineral Planning
Authority.”
“(25) Within 6 months of the date of this permission a scheme for the monitoring of noise
levels at the noise sensitive premises shall be submitted to the Mineral Planning Authority
for approval. The approved scheme shall be implemented prior to commencement of and
for the life of the proposed development.
The noise sensitive properties and areas:-
1. Manor Farm Cottages
2. Dwellings adjacent to the churchyard within Passenham.
3. Mill farm, and
4. Kingfisher Dwelling (at Kingfisher Country Club)
As shown on Fig 28 in Section 5 of the submitted environmental assessment.
The scheme shall inter alia provide for the following:-
(a) the measurement of the noise levels at the noise sensitive premises and areas taken at
LAeg(60 mins) and measured at least 3.5 metres from the façade of the premises and
areas facing the mineral workings and at a height of between 1.2 and 1.5 metres from the
ground. The noise measurements shall be taken at time of the day and on days of the week
when the development hereby permitted is proposed to be operational.
(b) measurements and all future monitoring shall be undertaken in accordance with the
relevant British Standards and Policy Guidance and must be agreed in writing by the
Mineral Planning Authority.

Page 10 of 49
“(26) Except as may otherwise be agreed in writing by the Mineral Planning Authority,
monitoring of noise levels at the noise sensitive properties identified shall be carried out
every 12 months for the life of the site. The results of noise monitoring shall be submitted to
the Mineral Planning Authority within 1 month of such monitoring having taken place and
shall be set out in the recognised reporting format prescribed in the approved noise
monitoring scheme.
“(27) All vehicles, plant and machinery operated within the site shall be fitted with and use
effective silencers in accordance with manufacturers standard specifications.”
In a memorandum to Daniel Callis, Planning Officer at South Northamptonshire Council
dated 15 August 2014, the Senior Environmental Protection Officer, John Penny, relating to
“Noise and Planning Policy”.
Referencing this memorandum, Matthew Sweet of WBM wrote in an email to John Penny
dated 15 January 2015:
“For our assessment for Passenham Quarry WBM intend to refer to Paragraphs 19 to 22
inclusive of the “Minerals” chapter of the Planning Practice Guidance published by the
Government which came into effect in March 2014. These paragraphs are under the
heading “Noise emissions” within the section “Assessing environmental impacts from
mineral extraction.”
In an email to WBM dated 19 January 2015, John Penny stated:
“I can confirm that I agree with the approach you have proposed since the Planning
Practice Guidance makes it clear that the Government wants the assessment criteria
detailed in paragraphs 19 to 22 to be used albeit does advise care should be taken to avoid
any suggested limits being implemented as fixed thresholds and that these can be tailored
to suit the (sic-acoustic) circumstances at the site. An explanation should be provided in
noise report if there is any deviation from the recommended criteria. The only question I
have relates to how any acoustic characteristics in the noise sources being considered will
be assessed bearing in mind the revised version of BS4142:2014 suggest three methods
depending on context (read Section 9 & Annex C & D of BS4142:2014 Methods for Rating
and Assessing Industrial and Commercial Sound”.

Page 11 of 49
3 Site Description
The proposed extension to the Passenham Quarry site is located to the south of the
existing quarry plant site.
The currently permitted hours of operation for the site are:
07:00 to 18:00 hours Monday to Friday;
08:00 to 13:00 hours on Saturdays
No working is permitted on Sundays or Public/Bank Holidays. Operations outside these
hours are restricted to pumping and emergency repairs.
It is proposed to operate the southern extension area within the same hours.
The proposed extension is over 550 metres to the south-west of the village of Passenham
in Northamptonshire and over 350 metres to the south-east of Deanshanger which are the
nearest concentrations of residential properties to the site. There are other isolated
properties in the vicinity of the proposed extension area.
It is proposed that extracted mineral from the extension will be stockpiled and processed on
site by means of the existing processing plant and then transported off site by road going
HGVs.
Following extraction of mineral from the extension area, inert materials will be imported for
infilling via the same access and using the same internal haul routes.
The nearest residential properties to the proposed extension are Kingfisher House,
properties in Deanshanger to the north-west, the village of Passenham to the north-east
and Mill Farm to the south. The Kingfisher Country Club and Hotel is located to the south of
the proposed southern extension. There is also the Milton Keynes Hotel and the Manager‟s
Bungalow located on the A422 to the west of the proposed extension area and west of the
A422.
There is a traveller encampment by the site entrance, but due to their close proximity to the
existing processing operation it is not expected that the proposed extension will result in
any significant changes to the noise environment for the encampment.

Page 12 of 49
A site location plan including the baseline noise survey measurement locations and the
location of the sound level meter installation is included in this report as Appendix B.
4 Measurement Methodology
4.1 Measurement Description
The dwellings at which baseline measurements have been made were chosen as being
representative of the nearest properties to the proposed extension area.
Baseline noise surveys were conducted on four days at six locations representative of the
nearest noise sensitive properties to the site. Forty one sample measurements were made
over the four visits which took place on Monday 19 January 2015, Monday 02 February
2015, Tuesday 10 March 2015 and Tuesday 17 March 2015.
The measurements were undertaken between about 12:25 and 17:30 on Monday 19
January 2015, between about 11:50 and 16:30 on Monday 02 February 2015, between
around 09:15 and 16:00 on Tuesday 10 March 2015 and between around 09:15 and 14:30
on Tuesday 17 March 2015.
The first two surveys were conducted with a light westerly wind. The survey on Tuesday 10
March 2015 was conducted with a light westerly wind for the first round of measurements,
a light northerly wind for the second round of measurements and a light easterly wind for
the third round of measurements. The final survey on Tuesday 25 March 2015 was
conducted with a light easterly wind.
The measurements were taken at a microphone height of approximately 1.4 metres above
local ground level away from reflecting surfaces other than the ground, with a wind shield
used throughout each measurement. The sample measurements were of 15 minute
duration.
The parameters reported are the statistical indices LA10,T and the Background Noise Level,
LA90,T as well as the Equivalent Continuous Noise Level, LAeq,T. An explanation of the noise
units presented is given in Appendix A.
A data logging sound level meter was also installed at around 11:00 on Tuesday 10 March
2015 in the grounds of Mill Farm. The meter was collected at around 13:00 on Tuesday 17
March 2015.

Page 13 of 49
Plant measurements of the normal operation of the processing plant at Passenham Quarry
were undertaken during the visit on Tuesday 10 March 2015 between 12:20 and 13:00 and
measurements of the dewatering pump were conducted on Tuesday 17 March 2015
between 14:50 and 15:10
The instrumentation and calibration details used for the sample measurements and plant
measurements and for the installation are shown in Appendix C.
A summary of the daytime weather conditions during the period the sound level meter was
installed at Mill Farm is presented in Appendix D.
4.2 Results
The detailed results of the sample measurements are set out in Appendix E.
A summary of the sample measurement results is presented below.
Position Average dB
LAeq,15min
Average dB
LA90,15min
Range dB
LA90,15min
Deanshanger 54 43 40-48
Passenham Church Yard 48 40 36-43
Mill Cottages, Passenham 52 43 40-46
Mill Farm 45 39 36-42
Kingfisher House 57 50 44-57
Kingfisher Country Club 49 42 35-50
Noise levels were generally controlled by distant and local road traffic noise, birdsong,
breeze in the trees and aircraft movements. Some distant site activity was also noted at
most survey locations.
Detailed results from the data logging sound level meter installed at Mill Farm are
presented in Appendix F with the data used in calculation of the average LAeq,1 hour and
LA90,1 hour displayed in bold. The average LAeq,1 hour and LA90,1 hour values for the currently
permitted and proposed operating hours of the site are presented in the following table.

Page 14 of 49
Position Average dB LAeq,1hour Average dB LA90,1hour Range dB LA90,1hour
Mill Farm 49 37 33-43
Appendix G presents the results of the processing plant noise survey conducted on
Tuesday 10 March 2015 and the pump noise survey conducted on Tuesday 17 March
2015.
5 Evaluation and Analysis of Noise Data
The current planning permissions for Passenham Quarry reference existing noise limits in
the permission from Milton Keynes Council for the current extraction area dated
20 December 2012 (Ref. 12/00786/MIN), Condition 23 of which states:
“(23) With the exception of soil stripping and bund formation operations, and the bund
removal and soil replacement operations, the LAeq (60 mins) specific noise levels at the
noise sensitive properties shall not exceed 55 dB Laeq 1 hour.”
It was agreed with John Penny of South Northamptonshire Council that the assessment for
the proposed southern extension would be in line with the advice contained in the “Noise
emissions” section of the “Minerals” Planning Practice Guidance (see section 2.1 of this
report) and therefore site noise limits have been suggested based on that guidance for the
nearest noise sensitive properties to the proposed extension area.

Page 15 of 49
As a result the suggested noise limits for the proposed operations at the site based on the
web document “Planning Practice Guidance” paragraph 21 are as follows:
Position Average Measured
dB LA90,T (*)
Suggested Site
Noise Limit
dB LAeq, 1 hour, free field
Deanshanger 43 53
Passenham Church Yard 40 50
Mill Cottages, Passenham 43 53
Mill Farm 37 (**) 47
Kingfisher House 50 55
Kingfisher Country Club 42 52
Milton Keynes Hotel (***) N/A 55
(*) T=15 minutes for attended samples, 1 hour for the installed meter (**) The average measured background noise level from the installed sound level meter at Mill Farm was used (***) An additional assessment location representative of the Manager‟s Bungalow at Milton Keynes Hotel was included, with a suggested noise limit the same as Kingfisher House due to the bungalow‟s close proximity to the A422.
As the site will require dewatering in the proposed extension area and the operation of a
pump for this purpose will be expected to take place outside the normal daytime working
hours of the site, a night-time noise limit of 42 dB LAeq, 1 hour free field should not be exceeded,
in line with the night-time noise limits suggested in the Planning Practice Guidance.
6 Calculated Site Noise Levels
6.1 Calculated Site Noise Levels
The Equivalent Continuous Noise Level, LAeq, T, is the preferred unit for assessing noise
sources. It is the value of a continuous level that would have equivalent energy to the
continuously varying noise over the specified period "T". This unit is recommended
internationally for the description of environmental noise and is in general use. It is the
chosen unit of BS 5228 for Construction and Open site noise; Planning Practice Guidance
to the National Planning Policy Framework and BS 7445 for the Description and
Measurement of Environmental noise.
Page 16 of 49
The noise levels likely to arise at dwellings depend on the method of working and the
sound power levels of the plant chosen to work a site as much as on the distance to the
properties and the effects of intervening ground. Proper allowance can be made for these
variables in order to calculate site noise levels.
6.2 Noise Calculation Methodology
The Planning Practice Guidance for the NPPF in paragraph 19 states those making
development proposals should consider “estimating the likely future noise from the
development and its impact on the neighbourhood of the proposed operations”.
The Planning Practice Guidance published in March 2014 does not contain details of noise
prediction methods and in the absence of detailed guidance in the NPPF, the calculations
in this report are based on the methods contained in BS5228-1: 2009 “Code of practice for
noise and vibration control on construction and open sites – Part 1: Noise” + A:
2014, Annex F.
Further details of the calculation methods are set out in Appendix H to this report. A
summary site noise calculation sheet for one of the seven dwellings considered is included
in Appendix H.
For the purposes of examining a reasonable worst case, the various items have been
assumed to operate at the closest practical position of the proposed simultaneous
extraction/infilling areas to each dwelling with the assumption that the plant for extraction
and/or infilling is not located within 10 metres of the extraction boundary. It has also been
assumed that the plant items work 100% of each hour apart from the tipping of imported
infill into the extraction void which is assumed to take place 25% of each hour.
A set back distance of 50 metres from the extraction boundary has been included for the
dewatering pump as the pump is not expected to be located close to the limits of the
extraction area.

Page 17 of 49
6.3 Noise Sources and Sound Power Levels
The sand and gravel from the proposed extension site will be extracted by excavator,
hauled to the plant site using articulated dump trucks, stockpiled and processed by the
existing processing plant at the current plant site and loaded into road going HGVs for
transport off site.
The infilling of the subsequent void with inert material imported into the site will involve
tipping of material direct from road going HGVs and grading with a dozer.
Sound Power Levels of the machinery to be used in the proposed extension area are
based on measurements of the processing plant and dewatering pump at Passenham
Quarry and typical measurements elsewhere which are contained on the WBM plant noise
database.
The plant items used in the calculations are listed in the table below along with the Sound
Power Levels used in the calculations.
Plant Item dB LWA
Routine Extraction Operations
360o Excavator for mineral extraction 104
Dump Trucks 104
Processing Plant 104
Loading Shovels 103
Dewatering
Electric Pump 80
Routine Infilling Operations
HGVs 106
Dozer for grading 106
Temporary Operations
Excavator on overburden / soils 104
Dump trucks on overburden / soils 104
Dozer 106

Page 18 of 49
6.4 Site Operation Assumptions
In order to assess the noise levels for the proposed site operations, the contribution from
each significant specific noise source has been evaluated separately and then combined
together to give the overall noise level.
The activities that will take place on the site are:
Soil and overburden stripping operations considered a temporary operation as defined in the Technical Guidance to the National Planning Policy Framework;
Extraction of approximately 600,000 tonnes of sand and gravel over a period of four and a half to five and a half years;
Stockpiling and processing of the extracted mineral by means of the existing processing plant in the current plant area;
Transportation of processed mineral off site by road going HGVs;
Infilling of the void with imported inert material at a rate of up to 150,000 tonnes per annum;
Restoration of the extraction area after completion of extraction.
In order to assess the noise levels for the proposed site operations, the contribution from
each significant specific noise source has been evaluated separately and then combined to
give the overall noise level. The activities that will take place on the site during the daytime
are sand and gravel extraction in the extension area and stockpiling/processing at the
existing plant site, with transportation of extracted material off site by means of road going
HGVs.
Once part of the extraction is complete, the activities taking place in the extraction area
during the daytime will also include the importation and tipping of inert material into the
previous phase by means of road going HGVs and grading of the tipped material by a
dozer.
The soils and overburden are about 1 metre in thickness across the site. An initial working
depth of 1 metre was therefore assumed for the extraction area as this would represent the
highest elevation of working.

Page 19 of 49
6.5 Effects on Assessment Locations
Site noise limits have been suggested, in line with the provisions of the “Minerals” and
“Noise emissions” elements of the web document “Planning Practice Guidance” to the
National Planning Policy Framework, based on the average background noise level plus
10 dB(A) and not to exceed 55 dB LAeq, 1 hour, free field at dwellings. Site noise calculations have
been undertaken for the seven receiver locations corresponding to where baseline noise
measurements were made and an additional location representative of the Manager‟s
Bungalow at Milton Keynes Hotel.
A comparison of the calculated site noise levels at the nearest dwellings and the suggested
site noise limits is shown in the following table. The calculated site noise levels and the
suggested site noise limits in the tables below are all in terms of dB LAeq, 1 hour, free field.
Calculated site noise levels are presented for the sand and gravel extraction and the
subsequent infilling of the void associated with the previous extraction phase with inert
material. The combined site noise level for both operations is presented, as these two
operations are likely to be occurring simultaneously.
Site Noise Calculation Receiver Location
Calculated Site Noise Level
dB LAeq, T, free field
Suggested Site Noise Limit
dB LAeq, 1 hr free field
Manor Farm Court, Deanshanger 47 53
Manor House, Passenham 43 50
Mill Cottages, Passenham 40 53
Mill Farm 44 47
Kingfisher House 55 55
Kingfisher Country Club 50 52
Milton Keynes Hotel 52 55
Noise Limits for these properties are based on those for the nearest measurement
locations to each property.
Page 20 of 49
The calculations assume that all plant for extraction and infilling is operating simultaneously
in the closest practical area of the site to each receiver location and that the closest haul
route to each receptor is used at that time.
The calculated site noise levels for routine extraction, infilling and processing comply with
the suggested site noise limits at all seven of the chosen assessment locations.
It is noted that all of the above calculated levels are at or below those required by the
assessment guidelines in the Planning Practice Guidance.
6.6 Out of Hours Operations
The site will require the use of a dewatering pump and this is expected to be the only site
activity expected outside the proposed working hours.
Site noise levels at the assessment locations due to operation of the pump overnight are
presented for comparison with the suggested site noise limit for night-time of 42 dB LAeq,
1hour free field.
Location Calculated Site Noise Level
dB LAeq, 1 hour, free field
Suggested Site Noise Limit
dB LAeq, 1 hour, free field
Manor Farm Court, Deanshanger 15 42
Manor House, Passenham 11 42
Mill Cottages, Passenham <10 42
Mill Farm 12 42
Kingfisher House 23 42
Kingfisher Country Club 19 42
Milton Keynes Hotel 20 42
Note: The lowest measured background noise level during the night-time on the installed sound level meter at Mill Farm was 31 dB LA90, 1 hour free field.
Page 21 of 49
6.7 Temporary Operations
The operations of topsoil and overburden stripping, bund formation and the final restoration
processes are often noisier than extraction, as noted in Paragraph 22 of the “Noise
emissions” part of the “Minerals” section of the Planning Practice Guidance to the NPPF,
as they tend to be closer and are usually unscreened. They are relatively short duration
operations that are capable of completion in a total period of no more than eight weeks in
any twelve month period.
The construction of a bund is a brief operation taking typically a matter of two or three
weeks to complete. For each dwelling the highest noise level that is calculated for storage
bund formation would be reached only on a few days.
Temporary operations are exempted from the nominal daytime noise limit in the of the
“Noise emissions” part of the “Minerals” section of the Planning Practice Guidance to NPPF
but should conform with a site noise limit of 70 dB LAeq, 1 hour, free field at dwellings. The
operations should not exceed a total of eight weeks duration at any noise sensitive
properties in any twelve month period when the noise levels exceed the corresponding
daytime noise limit for routine operations.
No soil stripping or amenity bund construction will take place within 200 metres of any
occupied residential property before 08:00 hours Monday to Saturday and no such activity
will take place on Sundays or Public/Bank Holidays.
The highest LAeq,T noise levels expected from the closest temporary operations in the
proposed extension to Passenham Quarry, with one set of equipment as set out in the
calculation sheet, are shown in the table below.

Page 22 of 49
Location Noise Level
dB LAeq, 1 hour, free field
Noise Limit
dB LAeq, 1 hour, free field
Manor Farm Court, Deanshanger 47 70
Manor House, Passenham 43 70
Mill Cottages, Passenham 40 70
Mill Farm 44 70
Kingfisher House 63 70
Kingfisher Country Club 50 70
Milton Keynes Hotel 56 70
The proposals comply with a 70 dB LAeq, 1 hour, free field noise limit for temporary works in line
with current Government guidance.
The proposals should also comply with the total of eight weeks duration for temporary
works near to any individual property where the suggested noise limit for routine operations
is likely to be exceeded.
7 Assessment of Residual Impacts
The calculated overall “reasonable worst case” site noise levels for routine and temporary
operations in the proposed extraction area, with the suggested mitigation measures in
place, are at or below the suggested site noise limits at all dwellings considered.
In an email to WBM dated 19 January 2015 in which he agreed with the WBM approach to
the assessment in line with the Planning Practice Guidance, the Senior Environmental
Protection Officer, John Penny, wrote:
“The only question I have relates to how any acoustic characteristics in the noise sources
being considered will be assessed bearing in mind the revised version of BS4142:2014
suggest three methods depending on context (read Section 9 & Annex C & D of
BS4142:2014 Methods for Rating and Assessing Industrial and Commercial Sound”.
Although BS 4142: 2014 is not appropriate for the assessment of mineral extraction noise
and, as agreed, the use of the advice in the Planning Practice Guidance has been used,
John Penny‟s concerns over tonal and impulsive noise have been considered.

Page 23 of 49
BS4142:2014 which came into force in October 2014 includes the following text regarding
the assessment of acoustic features tonality and impulsive noise.
Tonal Noise
Annex C of BS4142 relates to audibility of tones and is as follows:
“Annex C (normative)
Objective method of assessing the audibility of tones in sound: One-third octave
method
The test for the presence of a prominent, discrete-frequency spectral component (tone)
typically compares the LZeq,T sound pressure level averaged over time when the tone is
present in a one-third-octave band with the time-average linear sound pressure levels in
the adjacent two one-third-octave bands. For a prominent, discrete tone to be identified as
present, the time-averaged sound pressure level in the one-third-octave band of interest is
required to exceed the time-averaged sound pressure levels of both adjacent one-third-
octave bands by some constant level difference.
The level differences between adjacent one-third-octave bands that identify a tone are:
15 dB in the low-frequency one-third-octave bands (25 Hz to 125 Hz);
8 dB in the middle-frequency bands (160 Hz to 400 Hz);
5 dB in the high-frequency bands (500 Hz to 10 000 Hz).”
The majority of the proposed plant items to be used on site are mobile plant such as dump
trucks, loading shovels, HGVs, excavators, dozers where the main noise source is engine
noise.
The processing plant sound power level data was based on actual measurements at the
site at a variety of distances up to about 25 metres. The frequency spectrum for that data
indicates was little variation between third-octave band frequencies in comparison to the
level differences described in Annex C of BS4142:2014.
The pump/generator referred to earlier in this report and measured on site by WBM at
distances of between 1 and 10 metres did not exhibit any tonal characteristics based on the
definition described above.
Page 24 of 49
Impulsive Noise
Annex E to BS4142:2014 contains an informative derived from DIN 45681 for an objective
method of measuring the prominence of impulsive sounds and for the adjustment of the
LAeq which includes the following text:
“E.10 Predicted Prominence, P
In periods of half an hour a number of impulses with the apparently highest onset rates and level differences are selected. For sound with shorter duration the impulses are selected during the whole period. For each selected impulse the predicted prominence, P, is calculated from:
P = 3lg (onset rate/[dBs])+ 2lg (level difference/[dB])
where the “onset rate” in dBs and the “level difference” in dB are defined earlier in E.6 and E.5 respectively. The impulse with the highest value of P gives the final result.
NOTE The general form of the expression for P is P = k1lg (onset rate) + k2lg (level difference). The constants k1 and k2 have been estimated from the results of listening tests. It is also taken into account that the relation between P for very sudden and loud impulses and P for slow level changes is large. P was furthermore designed to give a maximum around 15.
E.11 Adjustment to LAeq
For sounds with onset rates larger than 10 dB/s-1 the following adjustment KI, based in the predicted prominence P, may be applied:
KI = 1.8 (P - 5) for P > 5; and
KI = 0 for P < 5.”
The onset of a sound is defined as the part of the positive slope of the time history of LpAF
where the gradient exceeds 10 dB/s. The starting point of an onset is the point where the
gradient first exceeds 10 dB/s. The end point of an onset is the first point after the starting
point where the gradient decreases to less than 10 dB/s.
The onset rate is defined as the slope in dB/s of the straight line that gives the best
approximation to the onset.
The level difference of an impulse is defined as the difference in dB of LpAF between the
level of the end of the point Le and the level of the starting point LS of the onset.
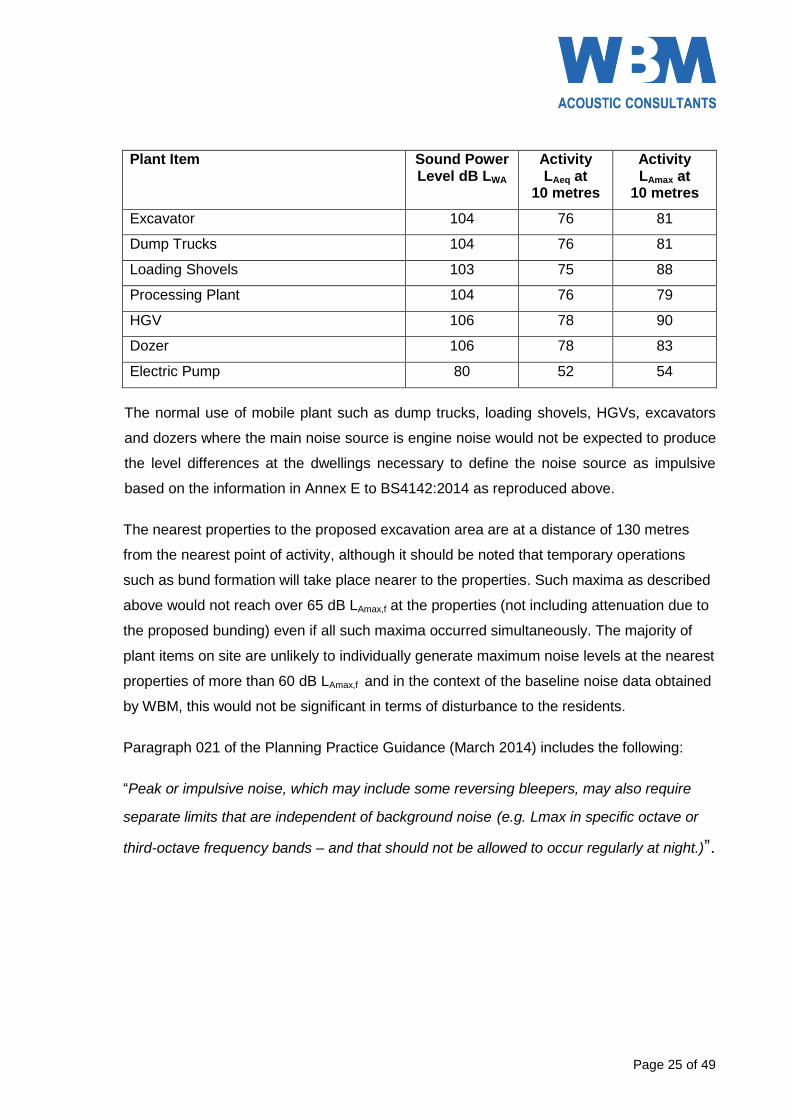
The data from which the sound power level data used in the calculations was derived are
included in the following table:
Page 25 of 49
Plant Item Sound Power Level dB LWA
Activity LAeq at
10 metres
Activity LAmax at
10 metres
Excavator 104 76 81
Dump Trucks 104 76 81
Loading Shovels 103 75 88
Processing Plant 104 76 79
HGV 106 78 90
Dozer 106 78 83
Electric Pump 80 52 54
The normal use of mobile plant such as dump trucks, loading shovels, HGVs, excavators
and dozers where the main noise source is engine noise would not be expected to produce
the level differences at the dwellings necessary to define the noise source as impulsive
based on the information in Annex E to BS4142:2014 as reproduced above.
The nearest properties to the proposed excavation area are at a distance of 130 metres
from the nearest point of activity, although it should be noted that temporary operations
such as bund formation will take place nearer to the properties. Such maxima as described
above would not reach over 65 dB LAmax,f at the properties (not including attenuation due to
the proposed bunding) even if all such maxima occurred simultaneously. The majority of
plant items on site are unlikely to individually generate maximum noise levels at the nearest
properties of more than 60 dB LAmax,f and in the context of the baseline noise data obtained
by WBM, this would not be significant in terms of disturbance to the residents.
Paragraph 021 of the Planning Practice Guidance (March 2014) includes the following:
“Peak or impulsive noise, which may include some reversing bleepers, may also require
separate limits that are independent of background noise (e.g. Lmax in specific octave or
third-octave frequency bands – and that should not be allowed to occur regularly at night.)”.

Page 26 of 49
Impulsive noise from the proposed operations on site during the daytime should not be
significant or frequent enough to warrant a noise limit based on the LAmax. Such a limit
would be almost impossible to enforce in the context of the existing maximum noise levels
in the vicinity of the site which range from 58 to 85 dB LAmax,f. Night-time site noise levels
will be solely due to the operation of the dewatering pump and are expected to remain fairly
constant based on the data provided in the table above.
At a distance, noise from machinery used at mineral workings does not usually contain a
distinguishable tone nor does it tend to be impulsive. The use of reversing bleepers on site
plant is a separate matter. Where reversing sirens or bleepers are used on mobile site
plant and give rise to noise problems, the use of quieter or silent types of alarm or warning
devices that are more environmentally acceptable should be explored.
It is the intention of GRS Roadstone Limited to minimise the noise impact on the residents
using the mitigation measures described in this report and selecting appropriate modern
plant and equipment and to demonstrate compliance with guidance and planning
conditions in place to protect the amenity of the area.
8 Summary and Conclusions
This report sets out the findings of a noise assessment for sand and gravel extraction and
infilling with imported inert material in a proposed extension to Passenham Quarry in
Northamptonshire.
Current guidelines on noise are contained in the “Minerals” and “Noise emissions” sections
of the Planning Practice Guidance, dated March 2014 that was published to replace the
“Technical Guidance to the National Planning Policy Framework” dated March 2012.
Noise limits at dwellings for site noise are suggested, based on the guidance contained
within the Planning Practice Guidance and having regard to the measured background
noise levels at locations taken to be representative of the dwellings selected for this
assessment.
Site noise calculations have been undertaken for seven locations, taken to be
representative of the nearest dwellings to the proposed extension. The calculated site
noise levels are presented for inspection and comparison with the suggested site noise
limits at the dwellings.

Page 27 of 49
The calculated site noise levels for routine, temporary and night-time dewatering operations
in the proposed extension area comply with the suggested site noise limits at all the
assessment locations.
Since the proposed operations conform to the advice set out in the aforementioned
Planning Practice Guidance with regard to both routine and temporary operations, it is
considered that the site can be worked while keeping noise emissions to within
environmentally acceptable limits.
Dr Robert Storey BEng PhD MIOA
Consultant
(This document has been generated electronically and therefore bears no signature)

Page 28 of 49
Appendix A – Glossary of Acoustic Terms
The following section describes some of the parameters that are used to quantify noise.
Decibels dB
Noise levels are measured in decibels. The decibel is the logarithmic ratio of the sound pressure to a reference pressure (2x10⁻⁵ Pascals). The decibel scale gives a reasonable approximation to the human perception of relative loudness. In terms of human hearing, audible sounds range from the threshold of hearing (0 dB) to the threshold of pain (140 dB).
A-weighted Decibels dB(A)
The „A‟-weighting filter emulates human hearing response for low levels of sound. The filter network is incorporated electronically into sound level meters. Sound pressure levels measured using an „A‟-weighting filter have units of dB(A) which is a single figure value to represent the overall noise level for the entire frequency range.
A change of 3 dB(A) is the smallest change in noise level that is perceptible under normal listening conditions. A change of 10 dB(A) corresponds to a doubling or halving of loudness of the sound. The background noise level in a quiet bedroom may be around 20 –30 dB(A); normal speech conversation around 60 dB(A) at 1 m; noise from a very busy road around 70-80 dB(A) at 10m; the level near a pneumatic drill around 100 dB(A).
Façade Noise Level
Façade noise measurements are those undertaken near to reflective surfaces such as walls, usually at a distance of 1m from the surface. Façade noise levels at 1m from a reflective surface are normally around 3 dB greater than those obtained under freefield conditions.
Freefield Noise Level
Freefield noise measurements are those undertaken away from any reflective surfaces other than the ground
Frequency Hz
The frequency of a noise is the number of pressure variations per second, and relates to the “pitch” of the sound. Hertz (Hz) is the unit of frequency and is the same as cycles per second. Normal, healthy human hearing can detect sounds from around 20 Hz to 20 kHz.
Octave and Third-Octave Bands
Two frequencies are said to be an octave apart if the frequency of one is twice the frequency of the other. The octave bandwidth increases as the centre frequency increases. Each bandwidth is 70% of the band centre frequency.
Two frequencies are said to be a third-octave apart if the frequency of one is 1.26 times the other. The third octave bandwidth is 23% of the band centre frequency.
There are recognised octave band and third octave band centre frequencies. The octave or third-octave band sound pressure level is determined from the energy of the sound which falls within the boundaries of that particular octave of third octave band.
Page 29 of 49
Appendix A (continued)
Equivalent Continuous Sound Pressure Level LAeq,T
The „A‟-weighted equivalent continuous sound pressure level LAeq,T, is a notional steady level which has the same acoustic energy as the actual fluctuating noise over the same time period T. The LAeq,T unit is dominated by higher noise levels, for example, the LAeq,T average of two equal time periods at, for example, 70 dB(A) and 50 dB(A) is not 60 dB(A) but 67 dB(A).
The LAeq, is the chosen unit of BS 7445-1:2003 “Description and Measurement of Environmental noise”.
Maximum Sound Pressure Level LAmax
The LAmax value describes the overall maximum „A‟-weighted sound pressure level over the measurement interval. Maximum levels are measured with either a fast or slow time weighted, denoted as LAmax,f or LAmax,s respectively.
Sound Exposure Level LAE or SEL
The sound exposure level is a notional level which contains the same acoustic energy in 1 second as a varying „A‟-weighted noise level over a given period of time. It is normally used to quantify short duration noise events such as aircraft flyover or train passes.
Statistical Parameters LN
In order to cover the time variability aspects, noise can be analysed into various statistical parameters, i.e. the sound level which is exceeded for N% of the time. The most commonly used are the LA01,T, LA10,T and the LA90,T.
LA01,T is the „A‟-weighted level exceeded for 1% of the time interval T and is often used to gives an indication of the upper maximum level of a fluctuating noise signal.
LA10,T is the „A‟-weighted level exceeded for 10% of the time interval T and is often used to describe road traffic noise. It gives an indication of the upper level of a fluctuating noise signal. For high volumes of continuous traffic, the LA10,T unit is typically 2–3 dB(A) above the LAeq,T value over the same period.
LA90,T is the „A‟-weighted level exceeded for 90% of the time interval T, and is often used to describe the underlying background noise level.
Page 30 of 49
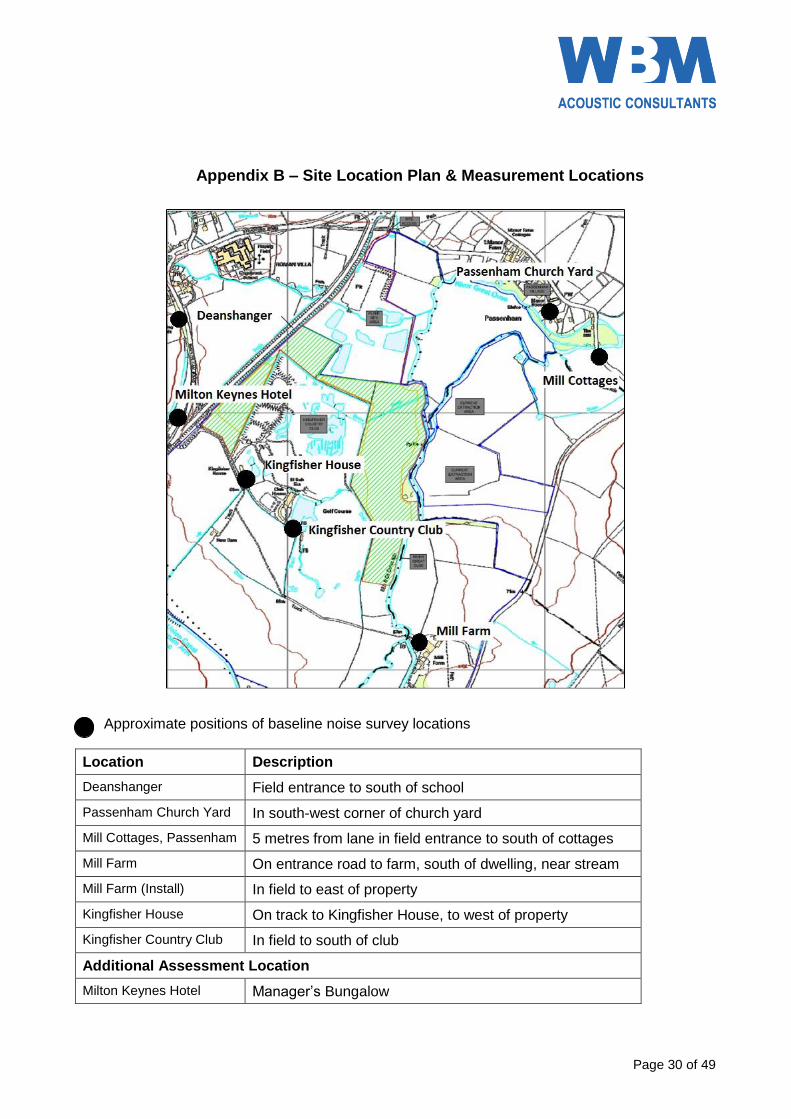
Appendix B – Site Location Plan & Measurement Locations
Approximate positions of baseline noise survey locations
Location Description
Deanshanger Field entrance to south of school
Passenham Church Yard In south-west corner of church yard
Mill Cottages, Passenham 5 metres from lane in field entrance to south of cottages
Mill Farm On entrance road to farm, south of dwelling, near stream
Mill Farm (Install) In field to east of property
Kingfisher House On track to Kingfisher House, to west of property
Kingfisher Country Club In field to south of club
Additional Assessment Location
Milton Keynes Hotel Manager‟s Bungalow

Page 31 of 49
Appendix C – Instrumentation and Calibration Details
Date and Location of Survey
Monday 19 January 2015
In vicinity of Passenham Quarry, Northamptonshire
Survey carried out by
Matthew Sweet
Weather Conditions
Dry, clear, ~2oC, very light W wind <1 m/s
Instrumentation used (Serial Number)
Norsonic 140 Sound Level Meter (1403136)
Norsonic 1251 Calibrator (31992)
Calibration
The sensitivity of the meter was verified on site immediately before and after the survey. The
measured calibration levels were as follows:
Survey Date Start Cal End Cal
Monday 19 January 2015
(Between 12:25 and 17:35) 114.0 dB(A) 114.0 dB(A)
The meter and calibrator are tested monthly against a Brüel and Kjær Pistonphone, type 4220
(serial number 375806) and a Norsonic Calibrator, type 1253 (serial number 22906) with UKAS
approved laboratory certificate of calibration.
Survey Details
Attended sample measurements of 15 minute duration were taken at each of the chosen locations.
The microphone was at a height of approximately 1.4 metres above local ground level, with a
windshield used throughout.
The start times of each sample are tabulated with the results in Appendix D.

Page 32 of 49
Appendix C – Instrumentation and Calibration Details (continued)
Date and Location of Survey
Monday 02 February 2015
In vicinity of Passenham Quarry, Northamptonshire
Survey carried out by
Dr Robert Storey
Weather Conditions
Dry, cloudy, 2-4oC, light W breeze 0-2 m/s
Instrumentation used (Serial Number)
Norsonic 140 Sound Level Meter (1404819)
Norsonic 1251 Calibrator (33321)
Calibration
The sensitivity of the meter was verified on site immediately before and after the survey. The
measured calibration levels were as follows:
Survey Date Start Cal End Cal
Monday 02 February 2015
(Between 11:45 and 16:30) 113.9 dB(A) 114.0 dB(A)
The meter and calibrator are tested monthly against a Brüel and Kjær Pistonphone, type 4220
(serial number 375806) and a Norsonic Calibrator, type 1253 (serial number 22906) with UKAS
approved laboratory certificate of calibration.
Survey Details
Attended sample measurements of 15 minute duration were taken at each of the chosen locations.
The microphone was at a height of approximately 1.4 metres above local ground level, with a
windshield used throughout.
The start times of each sample are tabulated with the results in Appendix D.

Page 33 of 49
Appendix C – Instrumentation and Calibration Details (continued)
Date and Location of Survey
Tuesday 10 March 2015
In vicinity of Passenham Quarry, Northamptonshire
Survey carried out by
Dr Robert Storey
Weather Conditions
Dry, sunny, some very light cloud, 8-12oC, light breeze 0-2 m/s (westerly in the morning, northerly in the middle of the day, easterly in the afternoon)
Instrumentation used (Serial Number)
Norsonic 140 Sound Level Meter (1404819)
Norsonic 1251 Calibrator (33321)
Calibration
The sensitivity of the meter was verified on site immediately before and after the survey. The
measured calibration levels were as follows:
Survey Date Start Cal End Cal
Tuesday 10 March 2015
(Between 09:15 and 16:00) 114.1 dB(A) 113.8 dB(A)
The meter and calibrator are tested monthly against a Brüel and Kjær Pistonphone, type 4220
(serial number 375806) and a Norsonic Calibrator, type 1253 (serial number 22906) with UKAS
approved laboratory certificate of calibration.
Survey Details
Attended sample measurements of 15 minute duration were taken at each of the chosen locations.
The microphone was at a height of approximately 1.4 metres above local ground level, with a
windshield used throughout.
The start times of each sample are tabulated with the results in Appendix D.

Page 34 of 49
Appendix C – Instrumentation and Calibration Details (continued)
Date and Location of Survey
Tuesday 17 March 2015
In vicinity of Passenham Quarry, Northamptonshire
Survey carried out by
Dr Robert Storey
Weather Conditions
Dry, cloudy with light mist clearing, some sun, 9-12oC, light E breeze 0-2 m/s
Instrumentation used (Serial Number)
Norsonic 140 Sound Level Meter (1404819)
Norsonic 1251 Calibrator (33321)
Calibration
The sensitivity of the meter was verified on site immediately before and after the survey. The
measured calibration levels were as follows:
Survey Date Start Cal End Cal
Tuesday 17 March 2015
(Between 09:15 and 14:30) 114.1 dB(A) 113.9 dB(A)
The meter and calibrator are tested monthly against a Brüel and Kjær Pistonphone, type 4220
(serial number 375806) and a Norsonic Calibrator, type 1253 (serial number 22906) with UKAS
approved laboratory certificate of calibration.
Survey Details
Attended sample measurements of 15 minute duration were taken at each of the chosen locations.
The microphone was at a height of approximately 1.4 metres above local ground level, with a
windshield used throughout.
The start times of each sample are tabulated with the results in Appendix D.

Page 35 of 49
Appendix C – Instrumentation and Calibration Details (continued)
Date and Location of Installation Survey
Tuesday 10 March 2015 to Tuesday 17 March 2015
In the grounds of Mill Farm
Meter Installed & Collected by
Dr Robert Storey
Instrumentation used (Serial Number)
RION NL-52 Sound Level Meter (420716)
RION NC-74 Calibrator (34425557)
Calibration
The sensitivity of the meter was verified on site immediately before and after the measurements
with readings as follows:
Dates Start Calibration End Calibration
10/03/2015 to 17/03/2015 94.3 dB(A) 94.1 dB(A)
The meter and calibrator are tested monthly against a Brüel and Kjær Pistonphone, type 4220
(serial number 375806) and a Norsonic Calibrator, type 1253 (serial number 22906) with UKAS
approved laboratory certificate of calibration.
Survey Details
Continuous measurements of 1 hour duration were taken at the chosen location over the specified
period. The microphone was fitted with a RION WS-15 windshield which was used throughout the
measurements.

Page 36 of 49
Appendix D – Daytime Weather Conditions
Day and Date Indicative Weather Details
Tuesday 10 March 2015 Dry, partly cloudy, 7-11oC, variable wind 0-4 m/s
Wednesday 11 March 2015 Dry, clear, some rain at night, 3-13oC, ~S wind 4-9 m/s
Thursday 12 March 2015 Dry, clear, 7-15oC, SSE wind 5-8 m/s
Friday 13 March 2015 Dry, mainly clear, some cloud, 5-12oC, E/NE wind 3-7 m/s
Saturday 14 March 2015 Mainly dry, some drizzle, cloudy, 4-8oC, NE wind 6-9 m/s
Sunday 15 March 2015 Mainly dry, some rain, cloudy, 5-7oC, NE wind 5-7 m/s
Monday 16 March 2015 Dry, mostly cloudy, 5-8oC, E 3-6 m/s
Tuesday 17 March 2015 Dry, haze, 4-9oC, ENE wind 2-4 m/s
Source: Weather Underground website.
Nearest weather station at Cranfield Airport.

Page 37 of 49
Appendix E – Baseline Survey Results (Samples)
Results and Observations
Monday 19 January 2015, 12:25 to 17:35
Dry, clear, ~2oC, very light W wind <1 m/s
Position
Start
Time
Results dB
(T = 15 minutes)
Comments
LAeq,T LA10,T LA90,T
Deanshanger 12:27 49 49 42 Road traffic on A422. Occasional car on Buckingham Road. Children in playground at school. Aircraft.
Passenham Church Yard
12:49 51 49 36 Distant road traffic. Occasional passing car on lane through village. Birdsong.
Mill Cottages 13:11 51 55 40
Distant road traffic. Occasional passing car on lane through village. Birdsong. Activity at quarry site barely audible.
Mill Farm 14:12 41 43 38 Distant road traffic. Birdsong. Water noise from river. Aircraft.
Kingfisher House
14:36 59 61 54 Road traffic on A422. Aircraft. Birdsong. Passing cars on lane paused out of sample.
Kingfisher Country Club
14:56 49 51 46 Road traffic on A422. Birdsong. Aircraft. Brief roadwork activity in distance to south.
Passenham Church Yard
15:19 48 51 41 Distant road traffic. Vehicles on lane. Birdsong. Aircraft.
Mill Cottages 15:45 54 57 46 Distant road traffic. Passing vehicles on lane. Birdsong. Activity at quarry just audible.
Mill Farm 16:27 44 44 41 Distant road traffic. Birdsong. Aircraft.
Kingfisher House
16:50 61 63 57 Road traffic dominant. Passing vehicle paused out of sample.
Kingfisher Country Club
17:11 53 56 50 Road traffic on A422 dominant. Aircraft.

Page 38 of 49
Appendix E – Baseline Survey Results (Samples) continued
Results and Observations
Monday 02 February 2015, 11:45 to 16:30
Dry, cloudy, 2-4oC, light W breeze 0-2 m/s
Position
Start
Time
Results dB
(T = 15 minutes)
Comments
LAeq,T LA10,T LA90,T
Mill Cottages 11:53 51 53 43
Distant road traffic, birdsong, aircraft, river, some local cars, distant sheep, distant cutting tools, distant clanks and white noise reversing alarms from site
Mill Farm 12:38 43 45 40 Distant road traffic, birdsong, aircraft, river, distant clanks and reversing bleeper from site
Passenham Church Yard
12:59 42 45 38 Distant and local road traffic, aircraft, birdsong, breeze in trees, distant alarm
Kingfisher House
13:31 59 62 54 Road traffic (A422), aircraft, birdsong, Chinook helicopter
Kingfisher Country Club
13:50 50 52 46 Distant road traffic (A422), birdsong, aircraft, distant cutting tool, distant reversing bleeper
Deanshanger 14:13 55 52 41
Road traffic (A422), some local cars including large tractor, children‟s voices, birdsong, aircraft, reversing bleeper and clatter in village, distant voices
Mill Cottages 14:35 50 53 43
Distant and local road traffic, birdsong, aircraft, river, distant reversing bleeper, distant plant noise and distant clanks from site
Mill Farm 15:18 46 47 42 Distant road traffic, birdsong, aircraft, activity at farm, distant impact noise, distant reversing bleeper from site
Passenham Church Yard
15:52 49 52 43 Distant and local road traffic, aircraft, birdsong, breeze in trees
Deanshanger 16:12 56 56 42 Road traffic (A422), some local cars, birdsong, aircraft, distant reversing bleeper in village
Page 39 of 49
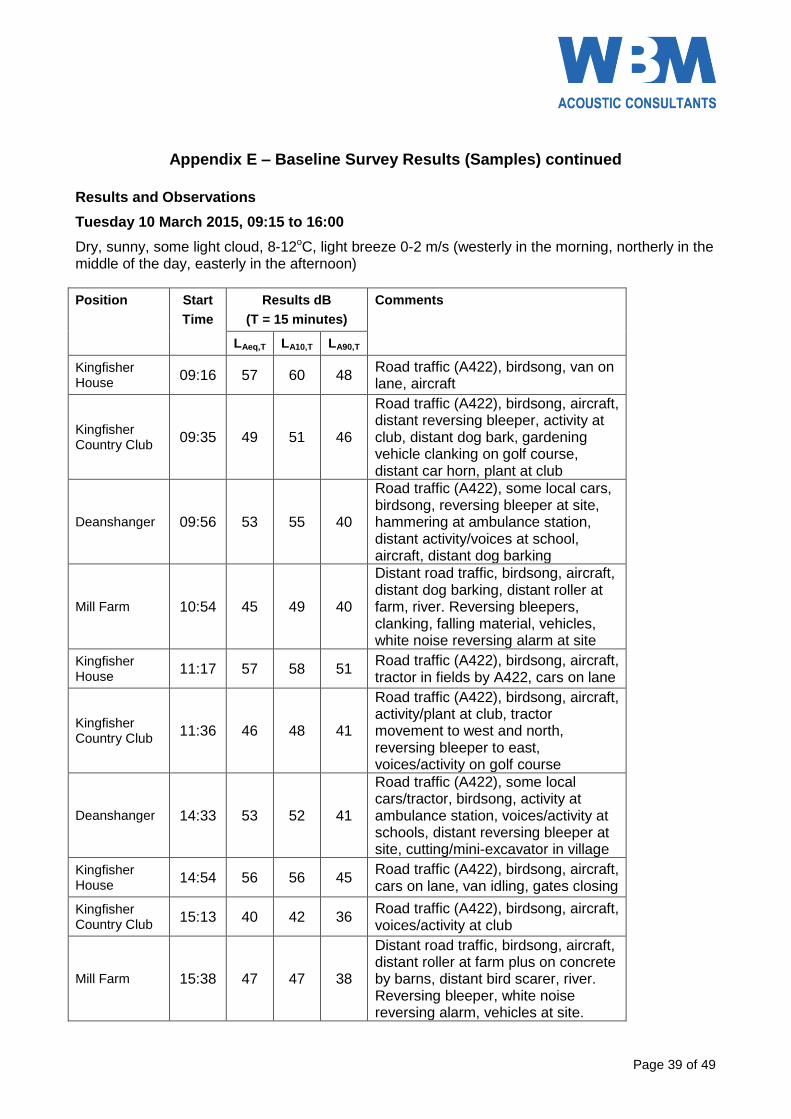
Appendix E – Baseline Survey Results (Samples) continued
Results and Observations
Tuesday 10 March 2015, 09:15 to 16:00
Dry, sunny, some light cloud, 8-12oC, light breeze 0-2 m/s (westerly in the morning, northerly in the middle of the day, easterly in the afternoon)
Position
Start
Time
Results dB
(T = 15 minutes)
Comments
LAeq,T LA10,T LA90,T
Kingfisher House
09:16 57 60 48 Road traffic (A422), birdsong, van on lane, aircraft
Kingfisher Country Club
09:35 49 51 46
Road traffic (A422), birdsong, aircraft, distant reversing bleeper, activity at club, distant dog bark, gardening vehicle clanking on golf course, distant car horn, plant at club
Deanshanger 09:56 53 55 40
Road traffic (A422), some local cars, birdsong, reversing bleeper at site, hammering at ambulance station, distant activity/voices at school, aircraft, distant dog barking
Mill Farm 10:54 45 49 40
Distant road traffic, birdsong, aircraft, distant dog barking, distant roller at farm, river. Reversing bleepers, clanking, falling material, vehicles, white noise reversing alarm at site
Kingfisher House
11:17 57 58 51 Road traffic (A422), birdsong, aircraft, tractor in fields by A422, cars on lane
Kingfisher Country Club
11:36 46 48 41
Road traffic (A422), birdsong, aircraft, activity/plant at club, tractor movement to west and north, reversing bleeper to east, voices/activity on golf course
Deanshanger 14:33 53 52 41
Road traffic (A422), some local cars/tractor, birdsong, activity at ambulance station, voices/activity at schools, distant reversing bleeper at site, cutting/mini-excavator in village
Kingfisher House
14:54 56 56 45 Road traffic (A422), birdsong, aircraft, cars on lane, van idling, gates closing
Kingfisher Country Club
15:13 40 42 36 Road traffic (A422), birdsong, aircraft, voices/activity at club
Mill Farm 15:38 47 47 38
Distant road traffic, birdsong, aircraft, distant roller at farm plus on concrete by barns, distant bird scarer, river. Reversing bleeper, white noise reversing alarm, vehicles at site.

Page 40 of 49
Appendix E – Baseline Survey Results (Samples) continued
Results and Observations
Tuesday 17 March 2015, 09:15 to 14:30
Dry, cloudy with light mist clearing, some sun, 9-12oC, light E breeze 0-2 m/s
Position
Start
Time
Results dB
(T = 15 minutes)
Comments
LAeq,T LA10,T LA90,T
Kingfisher House
09:18 58 59 50 Road traffic (A422), birdsong, aircraft, plant and engine noise from site, vehicles on lane
Kingfisher Country Club
09:38 48 51 40
Road traffic (A422), birdsong, aircraft, activity at club, mower, bird scarers, distant plant noise and impact noise from site, reversing bleeper at club
Deanshanger 09:59 55 57 47
Road traffic (A422 and some local), birdsong, aircraft, voices, vehicles, clanking from site, children‟s voices at school, bird scarers
Mill Farm 10:24 46 50 36 Distant road traffic, birdsong, aircraft, tractor to north, river, sheep, clanks and vehicle movements at site
Kingfisher House
10:51 52 52 44
Road traffic (A422), birdsong, aircraft, plant/vehicle/impact/clanking noise, white noise reversing alarm from site, vehicles on lane, distant police siren
Kingfisher Country Club
11:11 40 43 35
Road traffic (A422), aircraft, birdsong, tractor to south, activity at club, distant plant/vehicle/impact noise, reversing bleeper and white noise reversing alarm from site
Deanshanger 11:33 56 57 48
Road traffic (A422 and some local) birdsong, aircraft, impact/plant noise and reversing bleepers from site, distant bird scarers,
Mill Farm 12:24 43 46 36
Distant road traffic, birdsong, aircraft, river, distant sheep, farm vehicles to north, vehicle noise, white noise reversing alarms and clanks from site
Kingfisher House
13:56 51 51 44
Road traffic (A422), birdsong, aircraft, car on lane, distant police siren, clanks, impact noise, vehicle noise, reversing bleepers and white noise reversing alarm from site
Kingfisher Country Club
14:16 50 51 36
Road traffic (A422), aircraft, birdsong, plant/vehicle noise, white noise reversing alarms, impact noise and reversing bleepers from site

Page 41 of 49
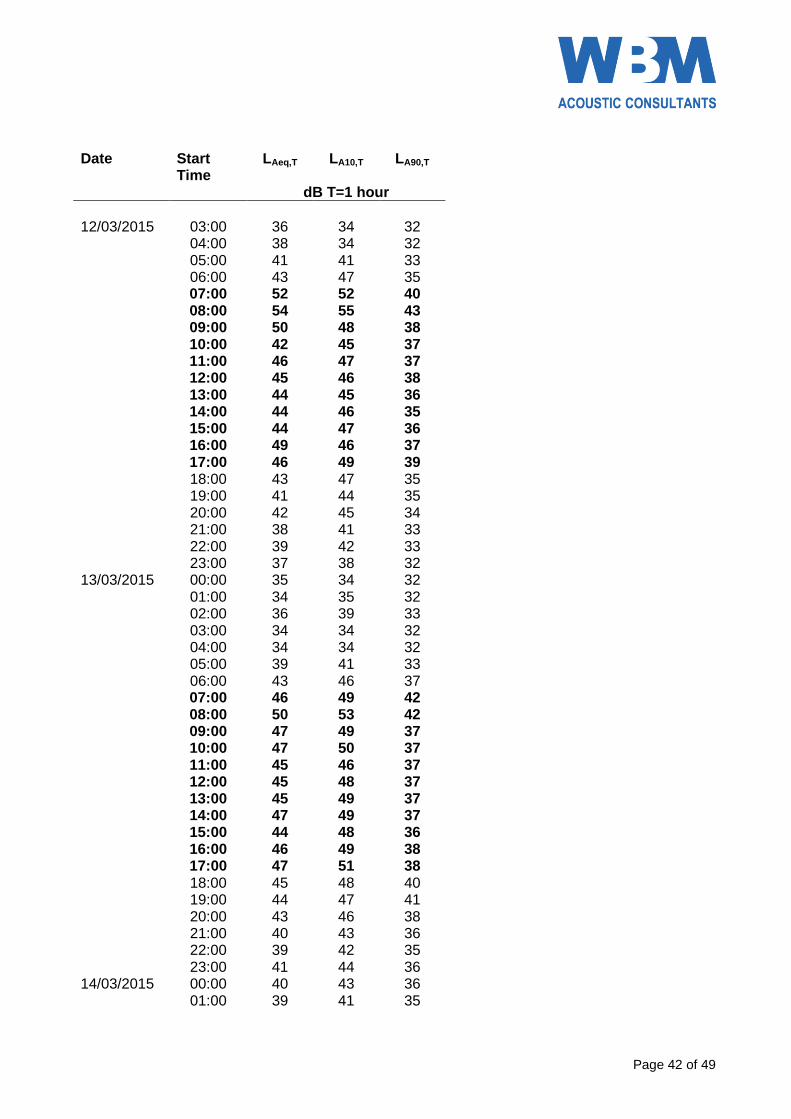
Appendix F – Baseline Survey Results (Installation)
Position – In the grounds of Mill Farm
Tuesday 10 March 2015 to Tuesday 17 March 2015
Date Start
Time LAeq,T LA10,T LA90,T
dB T=1 hour
10/03/2015 11:00 45 48 36 12:00 46 49 37 13:00 48 44 33 14:00 59 64 35 15:00 55 58 35 16:00 47 46 34 17:00 45 48 38 18:00 46 49 37 19:00 44 48 36 20:00 42 46 35 21:00 43 46 35 22:00 39 42 34 23:00 37 37 33 11/03/2015 00:00 35 34 32 01:00 35 34 33 02:00 34 34 32 03:00 35 34 33 04:00 34 35 33 05:00 39 43 34 06:00 45 48 37 07:00 49 52 41 08:00 51 53 43 09:00 50 54 39 10:00 44 45 37 11:00 53 57 38 12:00 49 46 36 13:00 45 45 37 14:00 45 47 36 15:00 44 45 36 16:00 43 45 37 17:00 43 45 38 18:00 45 45 35 19:00 41 42 33 20:00 37 39 32 21:00 36 38 32 22:00 36 38 32 23:00 35 37 32 12/03/2015 00:00 34 33 31 01:00 34 34 32 02:00 33 33 32
Page 42 of 49
Date Start Time
LAeq,T LA10,T LA90,T
dB T=1 hour
12/03/2015 03:00 36 34 32 04:00 38 34 32 05:00 41 41 33 06:00 43 47 35 07:00 52 52 40 08:00 54 55 43 09:00 50 48 38 10:00 42 45 37 11:00 46 47 37 12:00 45 46 38 13:00 44 45 36 14:00 44 46 35 15:00 44 47 36 16:00 49 46 37 17:00 46 49 39 18:00 43 47 35 19:00 41 44 35 20:00 42 45 34 21:00 38 41 33 22:00 39 42 33 23:00 37 38 32 13/03/2015 00:00 35 34 32 01:00 34 35 32 02:00 36 39 33 03:00 34 34 32 04:00 34 34 32 05:00 39 41 33 06:00 43 46 37 07:00 46 49 42 08:00 50 53 42 09:00 47 49 37 10:00 47 50 37 11:00 45 46 37 12:00 45 48 37 13:00 45 49 37 14:00 47 49 37 15:00 44 48 36 16:00 46 49 38 17:00 47 51 38 18:00 45 48 40 19:00 44 47 41 20:00 43 46 38 21:00 40 43 36 22:00 39 42 35 23:00 41 44 36 14/03/2015 00:00 40 43 36 01:00 39 41 35

Page 43 of 49
Date Start Time
LAeq,T LA10,T LA90,T
dB T=1 hour
14/03/2015 02:00 38 41 34 03:00 36 37 34 04:00 37 37 34 05:00 37 38 34 06:00 42 41 36 07:00 42 43 38 08:00 48 48 39 09:00 45 47 38 10:00 45 48 39 11:00 44 47 38 12:00 46 48 38 13:00 45 48 38 14:00 45 49 38 15:00 44 47 38 16:00 45 48 40 17:00 45 47 39 18:00 43 46 39 19:00 42 45 38 20:00 40 42 37 21:00 39 42 37 22:00 40 43 36 23:00 38 40 36 15/03/2015 00:00 37 38 35 01:00 36 38 34 02:00 36 38 34 03:00 35 36 33 04:00 35 37 34 05:00 38 39 34 06:00 38 39 35 07:00 39 40 36 08:00 41 43 37 09:00 43 46 38 10:00 44 47 36 11:00 44 47 37 12:00 44 47 37 13:00 44 46 37 14:00 42 45 37 15:00 43 46 38 16:00 43 46 38 17:00 44 47 38 18:00 42 45 38 19:00 41 44 36 20:00 40 42 35 21:00 38 41 35 22:00 38 39 35 23:00 35 35 33 16/03/2015 00:00 34 34 33

Page 44 of 49
(the currently permitted and proposed working hours of the site)
Date Start Time
LAeq,T LA10,T LA90,T
dB T=1 hour
16/03/2015 01:00 33 34 32 02:00 33 34 33 03:00 34 34 33 04:00 34 35 33 05:00 38 39 34 06:00 45 46 37 07:00 47 50 42 08:00 52 55 43 09:00 48 51 38 10:00 45 49 36 11:00 44 46 35 12:00 47 49 34 13:00 50 55 36 14:00 46 49 35 15:00 47 50 40 16:00 44 47 38 17:00 49 53 40 18:00 49 52 38 19:00 44 48 34 20:00 42 46 33 21:00 38 41 33 22:00 38 40 32 23:00 36 37 32 17/03/2015 00:00 36 34 32 01:00 32 33 32 02:00 33 33 32 03:00 33 33 32 04:00 35 36 32 05:00 39 40 33 06:00 41 43 36 07:00 49 53 38 08:00 47 51 42 09:00 50 47 41 10:00 43 46 34 11:00 45 49 34 12:00 41 44 34
Note: The data in bold is that for the period 0700 to 1800 hours Monday to Friday and 0700 to 1300 hours on Saturday

Page 45 of 49

Page 46 of 49
Appendix G – Plant Noise Survey Results
Plant Measurements (Passenham Quarry)
Tuesday 10 March 2015
Dry, sunny, some light cloud, 8-12°C, light N breeze 0-2m/s
Comments Measurement Distance to
Plant, m
Measured Activity Noise Level LAeq,T
Measured Activity Noise Level LA90,T
To north of plant 5 79 78
(main screen/conveyors) 5 79 78
10 74 73
10 74 73
20 69 69
20 69 69
To east of plant 10 73 73
(main screen/hopper/conveyors) 10 73 73
8 76 75
8 76 75
To west of plant 10 73 72
(main screen/generator/conveyors) 10 72 72
20 69 68
20 69 68
25 73 66
25 68 67
To south of plant 5 79 79
(second screen/conveyors) 5 79 78
10 75 74
10 75 74
15 73 71
15 73 71

Page 47 of 49
Appendix G – Plant Noise Survey Results (Samples) continued
Pump Measurements (Passenham Quarry)
Tuesday 17 March 2015
Dry, cloudy, some sun, 9-12°C, light E breeze 0-2m/s
Comments Measurement Distance to
Plant, m
Measured Activity Noise Level LAeq,T
Measured Activity Noise Level LA90,T
On generator door end of pump 1 66 65
Away from hose
1 66 65
5 58 58
5 58 58
Aircraft overhead 8 56 54
Dump truck movement 8 57 53
8 53 53
8 54 53
10 52 51
10 52 52
Excavator operation 5 59 58
Excavator operation 5 59 58
Excavator operation 1 66 65
Excavator operation 1 66 65

Page 48 of 49
Appendix H – Noise Calculation Method and Calculation Sheet
Specific noise levels are predicted or measured in terms of the Equivalent Continuous Noise Level,
LAeq,T over a given reference time interval, T. In the Planning Practice Guidance for the NPPF the
time interval for daytime, evening and night the reference time interval is 1 hour.
The calculation method for any plant which is relatively fixed in location is that set out in BS 5228-
1: 2009 + A: 2014, Annex F, and is the “Method for activity LAeq” described in section F.2.2 or the
“Method for plant sound power level” described in section F.2.3.
The calculation method for site mobile plant such as lorries and dump trucks is that set out in
BS 5228-1: 2009 + A: 2014, Annex F, and is the “Method for mobile plant using a regular well
defined route (e. g. haul roads)” described in section F. 2. 5.
Ground Absorption has been calculated using the technique set out in BS 5228-1: 2009 + A:
2014, Annex F, assuming 80% soft ground between the extraction area and the receiver locations.
The method of assessing screening is that attributed to Maekawa as used in BS 5228-1: 2009 + A:
2014, Annex F and various other Government published documents. This method uses the
calculated path difference and octave band noise data for each noise source over the frequency
range stated in BS 5228-1: 2009 + A: 2014, Annex F.
The effects of ground absorption are not used in the calculations if screening has been assessed
and offers a higher attenuation.
The nearest distances to the respective dwellings, from the various items of plant, have been used
in an acoustic model for the site to calculate the reasonable worst case LAeq,T site noise levels.
A summary site noise calculation sheet for one of the receiver locations is included below.

Page 49 of 49
GR
S R
oa
ds
ton
e L
imit
ed
43
47
23
-Ma
r-1
5R
S
Re
ce
ive
r H
eig
ht :
1.5
m
Pa
ss
en
ha
m Q
ua
rry
So
uth
ern
Ex
ten
sio
n (
NC
C)
Activi
tyP
ow
er
LW
A1
ho
ur
Ca
pa
city
So
urc
e2
wa
y flo
wS
pe
ed
BS
52
28
Re
fP
lant Ite
mC
om
me
nts
on P
lant
LA
eq
@ 1
0 m
or
LW
A / m
On-t
ime
%T
onne
sH
eig
ht
Q p
er
ho
ur
V k
ph
Pla
nt S
et b
ack(m
)m
eth
od
1E
xca
vato
r fo
r sa
nd
and
gra
vel
Vo
lvo
30
to
nne
76
10
41
00
21
0m
ba
ck
1A
ctivi
ty
2D
um
p tru
cks fo
r sa
nd
and
gra
vel
Be
ll B
30
E7
61
04
10
02
52
15
15
0m
ba
ck
4H
aul R
oa
d
3T
ipp
ing
of In
fill
Ma
teri
al
72
10
02
52
10
m b
ack
1A
ctivi
ty
4L
orr
ies fo
r im
po
rte
d ine
rt fill
Ro
ad
go
ing
ve
hic
les
78
10
61
00
16
21
21
51
0m
ba
ck
4H
aul R
oa
d
5D
oze
r fo
r im
po
rte
d ine
rt fill
78
10
61
00
20
m b
ack
1A
ctivi
ty
6E
xca
vato
r fo
r te
mp
ora
ry o
pe
ratio
ns (
bund
s)
Vo
lvo
30
to
nne
76
10
41
00
21
0m
ba
ck
1A
ctivi
ty
7D
um
p tru
cks fo
r te
mp
ora
ry o
pe
ratio
ns
Be
ll B
30
E7
61
04
10
02
52
15
15
0m
ba
ck
4H
aul R
oa
d
8D
oze
r fo
r te
mp
ora
ry o
pe
ratio
ns (
fina
l re
sto
ratio
n)
78
10
61
00
20
m b
ack
1A
ctivi
ty
9S
pa
re-1
02
7-9
99
10
02
0m
ba
ck
1A
ctivi
ty
10
Sp
are
-10
27
-99
91
00
20
m b
ack
1A
ctivi
ty
11
Pro
ce
ssin
g p
lant
Me
asure
d o
n s
ite
10
.03
.15
76
10
41
00
40
m b
ack
1A
ctivi
ty
12
Whe
ele
d lo
ad
ers
Hita
chi Z
W2
50
/ZW
31
07
51
03
10
02
0m
ba
ck
1A
ctivi
ty
13
So
urc
e 1
3-1
02
7-9
99
10
02
0m
ba
ck
1A
ctivi
ty
14
Ele
ctr
ic s
ub
me
rsib
le p
um
p/d
iese
l ge
ne
rato
rM
ea
sure
d o
n s
ite
17
.03
.15
52
80
10
01
50
m b
ack
1A
ctivi
ty
15
So
urc
e 1
5-1
02
7-9
99
10
02
0m
ba
ck
1A
ctivi
ty
Lo
ca
tio
n N
o.
6K
ing
fis
he
r H
ou
se
Ave
rag
e B
ackg
round
No
ise
leve
l
50
dB
LA
90
, 1
5 m
inu
te, fr
ee
fie
ld
Re
ce
ive
r H
eig
ht
69
.5m
AO
D
Sug
ge
ste
d S
ite
No
ise
Lim
it
Site
No
ise
Le
vel f
or
Item
s 1
to
5 a
nd
11
, 1
2 &
14
55
dB
LA
eq
, 1
ho
ur,
fre
e f
ield
Ro
utine
Op
era
tio
ns
55
dB
LA
eq
, 1
ho
ur,
fre
e f
ield
Site
No
ise
Le
vel f
or
Item
14
23
dB
LA
eq
, 1
ho
ur,
fre
e f
ield
Nig
ht-
tim
e O
pe
ratio
ns
42
dB
LA
eq
, 1
ho
ur,
fre
e f
ield
Site
No
ise
Le
vel f
or
Item
s 6
to
86
3d
B L
Ae
q, 1
ho
ur,
fre
e f
ield
Te
mp
ora
ry O
pe
ratio
ns
70
dB
LA
eq
, 1
ho
ur,
fre
e f
ield
Re
fP
lan
t It
em
Pla
nW
ork
ing
Gro
und
Wo
rkin
gS
ourc
eA
ng
leR
ang
eB
arr
ier
Ba
rrie
rP
ath
B
arr
ier
So
ftG
round
Re
sulta
nt
Dis
tance
Dis
tance
He
ight
He
ight/d
ep
thH
eig
ht
De
gre
es
Me
tre
s-R
ece
ive
rH
eig
ht
Diff.
Atte
n.
Gro
und
%A
tte
n.
LA
eq
1E
xc
av
ato
r fo
r s
an
d a
nd
gra
ve
l1
30
14
06
8.0
-1.0
69
.00
00
0.0
-1.0
00
0.0
80
.03
.05
0.1
2D
um
p t
ruc
ks
fo
r s
an
d a
nd
gra
ve
l1
50
15
06
8.0
0.0
70
.07
00
00
.0-1
.00
00
.08
0.0
3.1
42
.0
3T
ipp
ing
of
Infi
ll M
ate
ria
l1
30
14
06
8.0
0.0
70
.00
00
0.0
-1.0
00
0.0
80
.03
.04
0.1
4L
orr
ies
fo
r im
po
rte
d in
ert
fill
15
01
60
68
.00
.07
0.0
70
00
0.0
-1.0
00
0.0
80
.03
.24
2.7
5D
oz
er
for
imp
ort
ed
in
ert
fill
13
01
30
68
.00
.07
0.0
00
00
.0-1
.00
00
.08
0.0
2.9
52
.9
6E
xc
av
ato
r fo
r te
mp
ora
ry o
pe
rati
on
s (
bu
nd
s)
60
70
68
.00
.07
0.0
00
00
.0-1
.00
00
.08
0.0
1.8
57
.3
7D
um
p t
ruc
ks
fo
r te
mp
ora
ry o
pe
rati
on
s1
50
15
06
8.0
0.0
70
.07
00
00
.0-1
.00
00
.08
0.0
3.1
42
.0
8D
oz
er
for
tem
po
rary
op
era
tio
ns
(fi
na
l re
sto
rati
on
)6
06
06
8.0
0.0
70
.00
00
0.0
-1.0
00
0.0
80
.01
.56
0.9
9S
pa
re1
00
00
10
00
00
.00
.02
.00
00
0.0
-1.0
00
0.0
0.0
0.0
-10
87
.0
10
Sp
are
10
00
01
00
00
0.0
0.0
2.0
00
00
.0-1
.00
00
.00
.00
.0-1
08
7.0
11
Pro
ce
ss
ing
pla
nt
80
08
00
68
.00
.07
2.0
00
00
.0-1
.00
00
.08
0.0
5.1
32
.9
12
Wh
ee
led
lo
ad
ers
80
08
00
68
.00
.07
0.0
00
00
.0-1
.00
00
.08
0.0
6.0
30
.9
13
So
urc
e 1
31
00
00
10
00
00
.00
.02
.00
00
0.0
-1.0
00
0.0
0.0
0.0
-10
87
.0
14
Ele
ctr
ic s
ub
me
rsib
le p
um
p/d
ies
el g
en
era
tor
13
01
80
68
.00
.06
9.0
00
00
.0-1
.00
00
.08
0.0
3.4
23
.5
15
So
urc
e 1
51
00
00
10
00
00
.00
.02
.00
00
0.0
-1.0
00
0.0
0.0
0.0
-10
87
.0