Embed Size (px)
Citation preview
Particle Size Determination and Raman Spectroscopic Evaluation ofRaman Spectroscopic Evaluation of a Semi-solid Vaginal Dosage Form
2011 Horiba Webinar
Philo Morse and Robert W. Lee
07-Dec-2011

What We Do
• Complete post-discovery CMC developmentWorld leader in BCS II formulation based on data driven– World leader in BCS II formulation based on data driven systematic approach
• API characterization• Analytical methods development• Drug product formulation
Leveraging physicochemical properties against array of drug– Leveraging physicochemical properties against array of drug delivery technologies across all dosage forms and routes of administration
• Preclinical and clinical trial material manufacture– Highly potent, sterile and non-sterile
• cGLP/cGMP analytic and bioanalytic supportcGLP/cGMP analytic and bioanalytic support• Full ICH compliant stability programs
Corporate
• Founded in 1991, privately held, profitable• Bethlehem, PA, 25,000 sqft, 40+ employees• State-of-the-art cGLP/cGMP analytical/
bi l ti l d h i l h t i tibioanalytical and physical characterization • Sterile, non-sterile and high potency cGMP
production suites
• CRO servicing Pharmaceutic
l d Bi t h
p oduc o su es• Full ICH compliant stability programs• Dedicated highly potent compound handling
al and Biotech companies
infrastructure• DEA licensed, FDA registered
Staff
• Decades of experienceZ t f i t l t 6 th• Zero turnover of senior management over last 6 years other than additions
• Advanced degrees ranging from Medicine to PeptideAdvanced degrees ranging from Medicine to Peptide Chemistry to Colloid and Polymer Sciences
• Previous Director level oversight of analytical, quality, f l ti li i l d GMP d tiformulation, clinical and cGMP production groups
• Experience in international, large/small/startup pharma, biotech government and not-for-profitbiotech, government and not for profit
• Multiple commercialized technologies• > 100 patents pending / issued ranging from nanoparticles to
NCE’s to medical devices, well published
Approach
P id li t ith th b t ibl l ti• Provide our clients with the best possible solutions• We do this by consolidating technologies across disciplines
and industries• PSI-originated and in-licensed technologies• Partnerships with industry leading equipment manufacturers
P hi i h API li• Partnerships with API suppliers• Partnerships with industry leading key excipient suppliers
Our Work
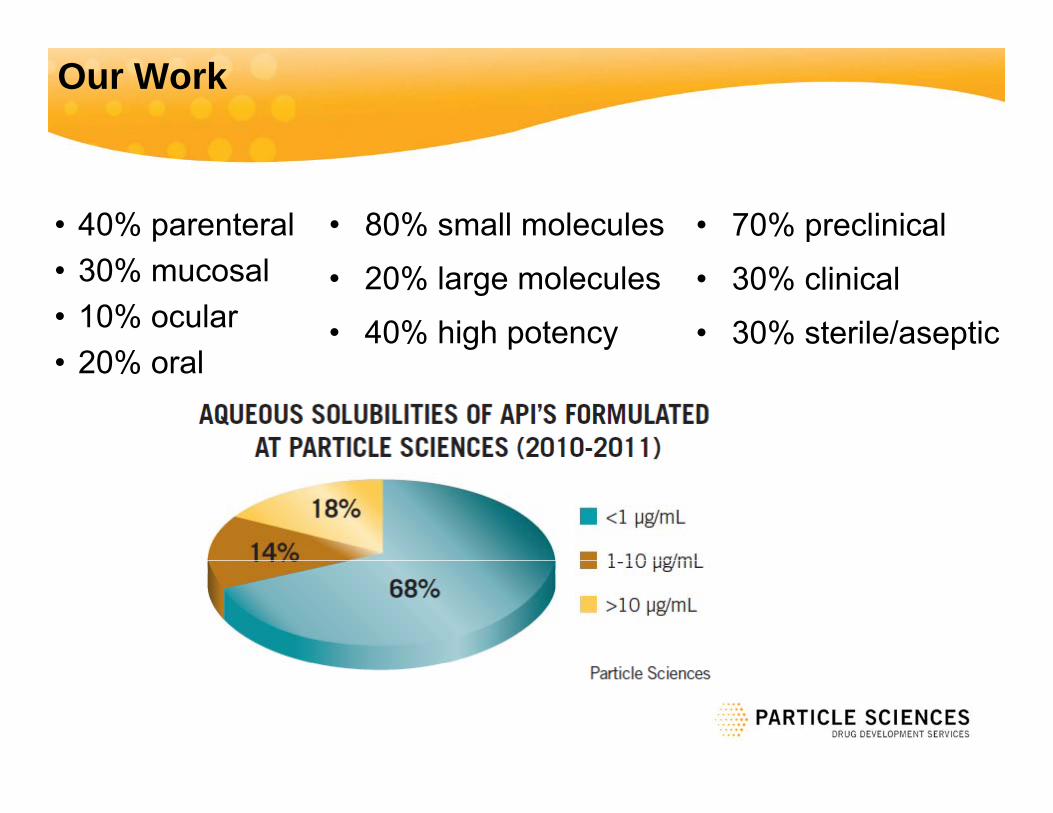
• 40% parenteral • 80% small molecules • 70% preclinical• 30% mucosal• 10% ocular
20% l
• 20% large molecules
• 40% high potency
• 30% clinical
• 30% sterile/aseptic• 20% oral
Our Role
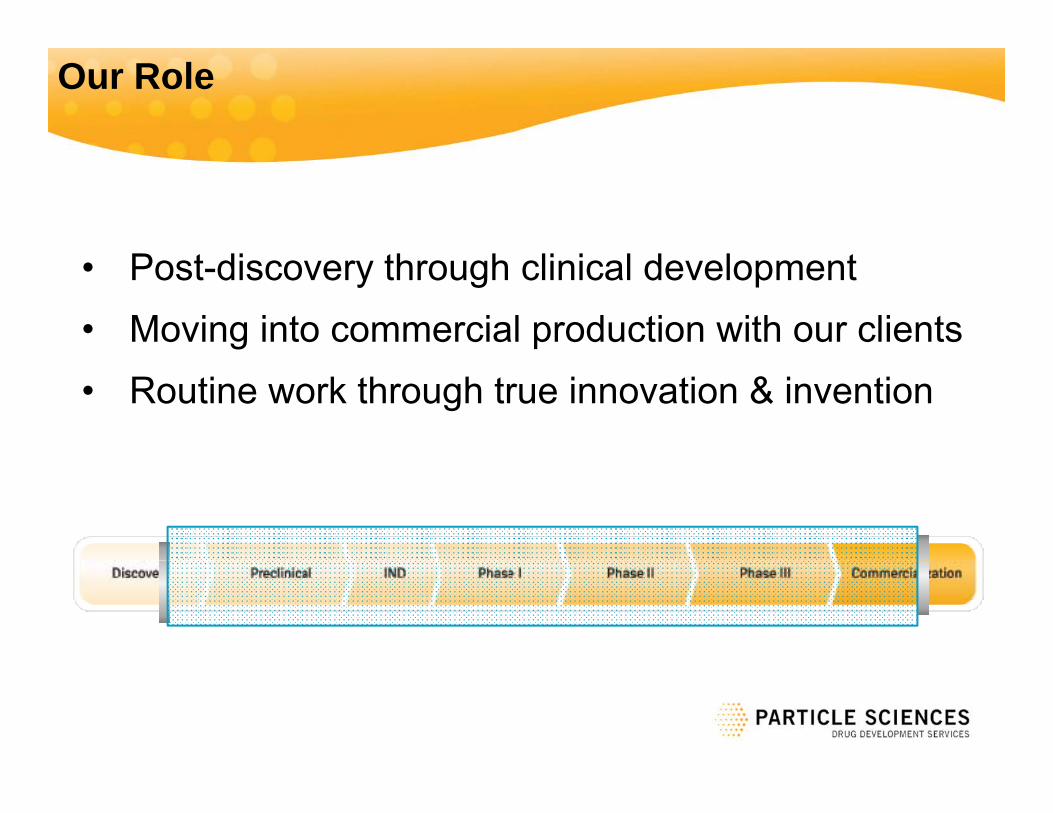
• Post-discovery through clinical development• Moving into commercial production with our clients• Routine work through true innovation & invention
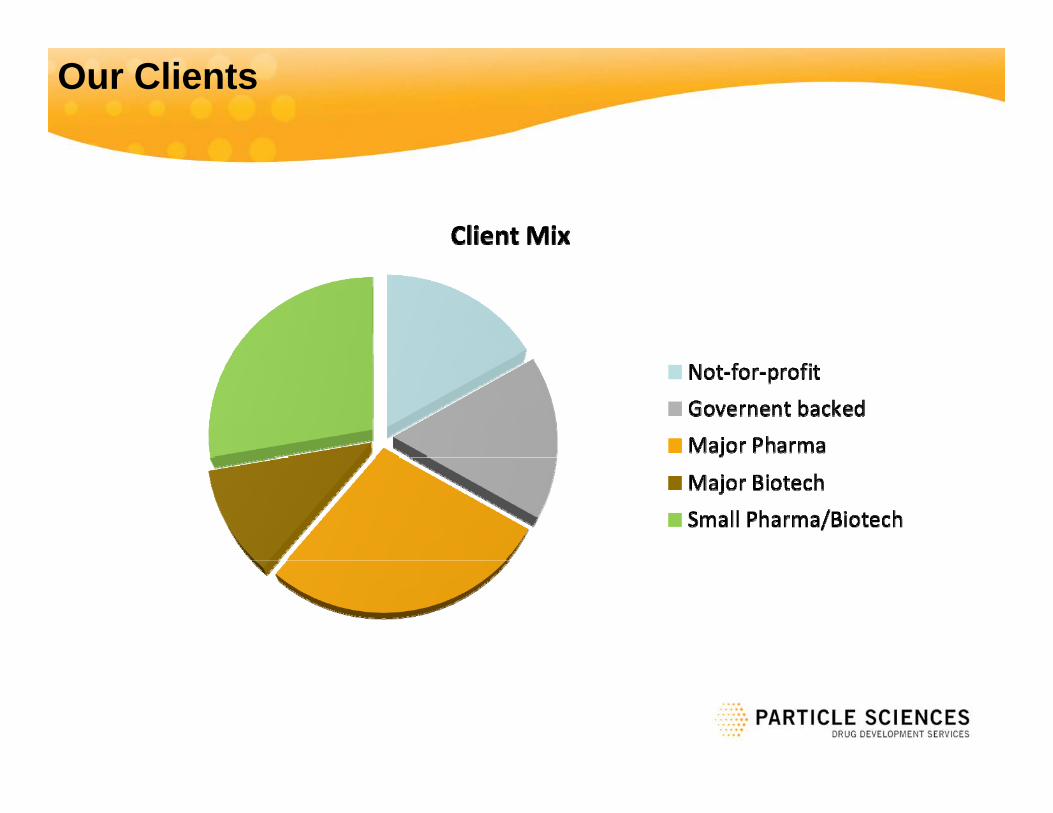
Our Clients

Special Expertise
• Drug Delivery across variety of dosage formsforms– Micro / Nano-particulates– Solid solutions
• DEA licensed
Solid solutions – Solvent systems– Drug/device combinations
licensed with full containment f hi h
• Analysis, characterization & cGMP production of particulate systems
• Analysis characterization & cGMP for high potency compounds
• Analysis, characterization & cGMP production of combination (drug/device) products
• Highly potent compounds
Industry leading
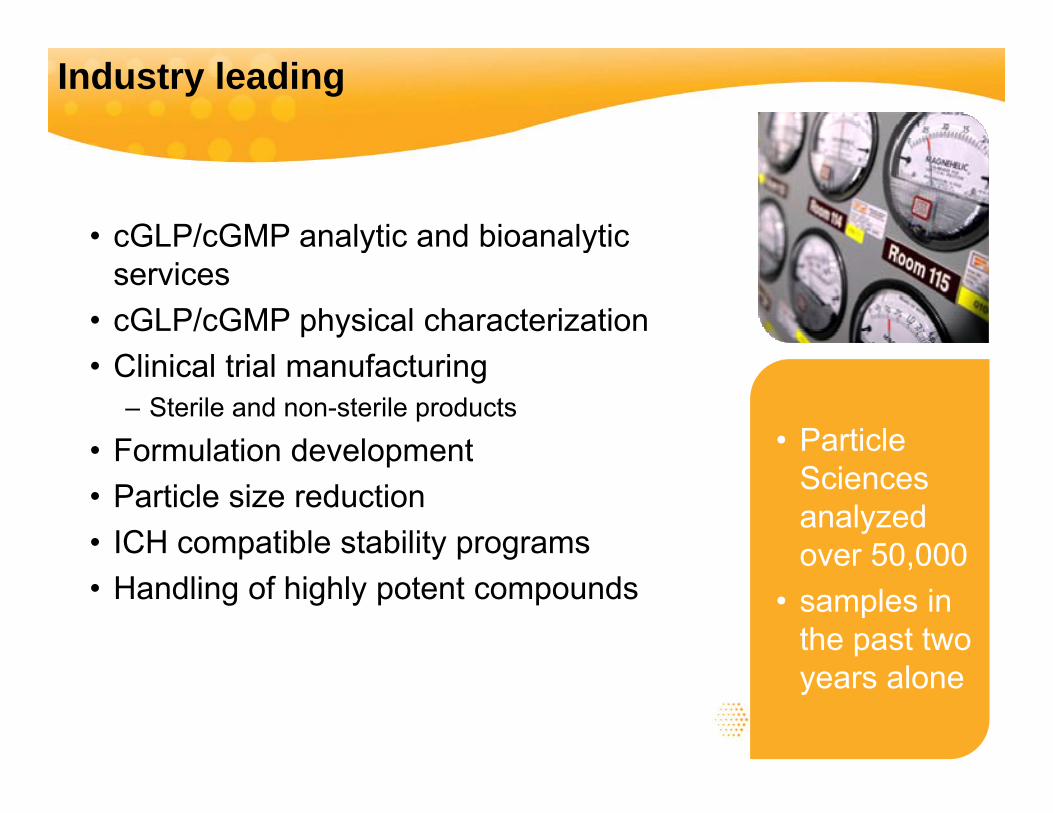
• cGLP/cGMP analytic and bioanalytic y yservices
• cGLP/cGMP physical characterizationCli i l t i l f t i
• Particle
• Clinical trial manufacturing– Sterile and non-sterile products
• Formulation developmentSciences analyzed over 50 000
Formulation development• Particle size reduction• ICH compatible stability programs over 50,000
• samples in the past two
• Handling of highly potent compounds
years alone
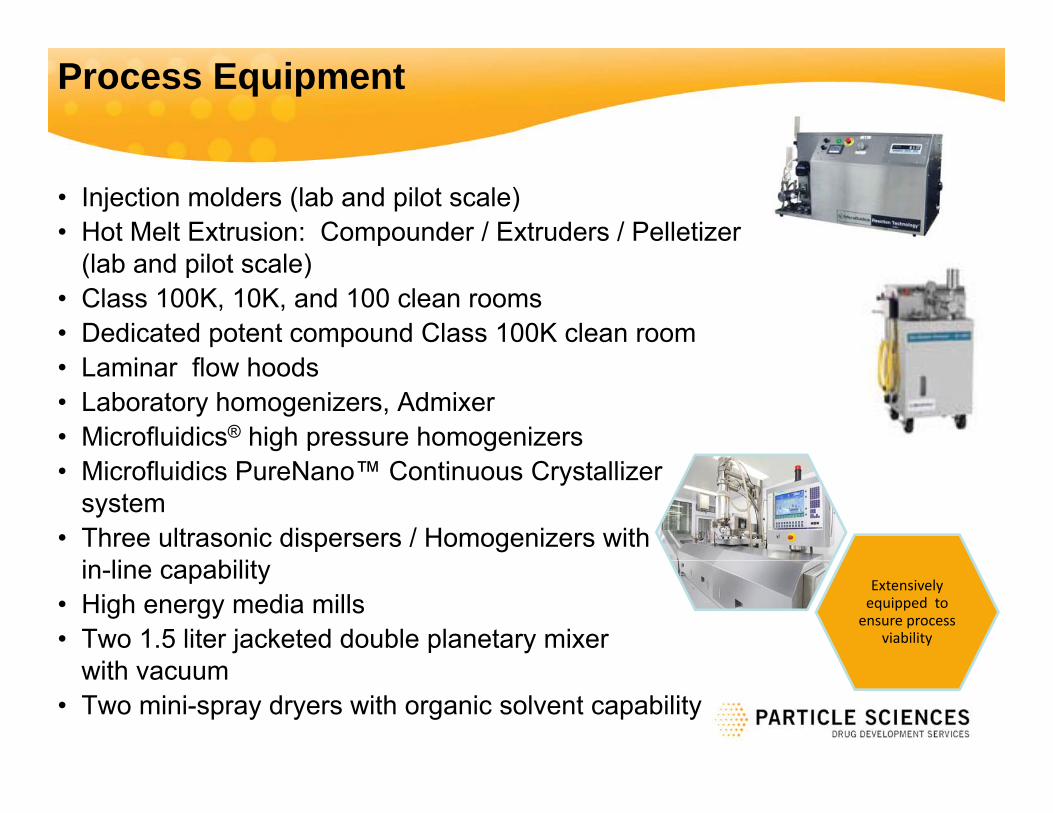
Process Equipment
• Injection molders (lab and pilot scale)• Hot Melt Extrusion: Compounder / Extruders / Pelletizer
(lab and pilot scale)• Class 100K, 10K, and 100 clean rooms• Dedicated potent compound Class 100K clean room• Laminar flow hoods• Laboratory homogenizers, Admixer• Microfluidics® high pressure homogenizers• Microfluidics PureNano™ Continuous Crystallizer
system• Three ultrasonic dispersers / Homogenizers with
i li bilitin-line capability• High energy media mills• Two 1.5 liter jacketed double planetary mixer
ith
Extensively equipped to ensure process
viability
with vacuum • Two mini-spray dryers with organic solvent capability
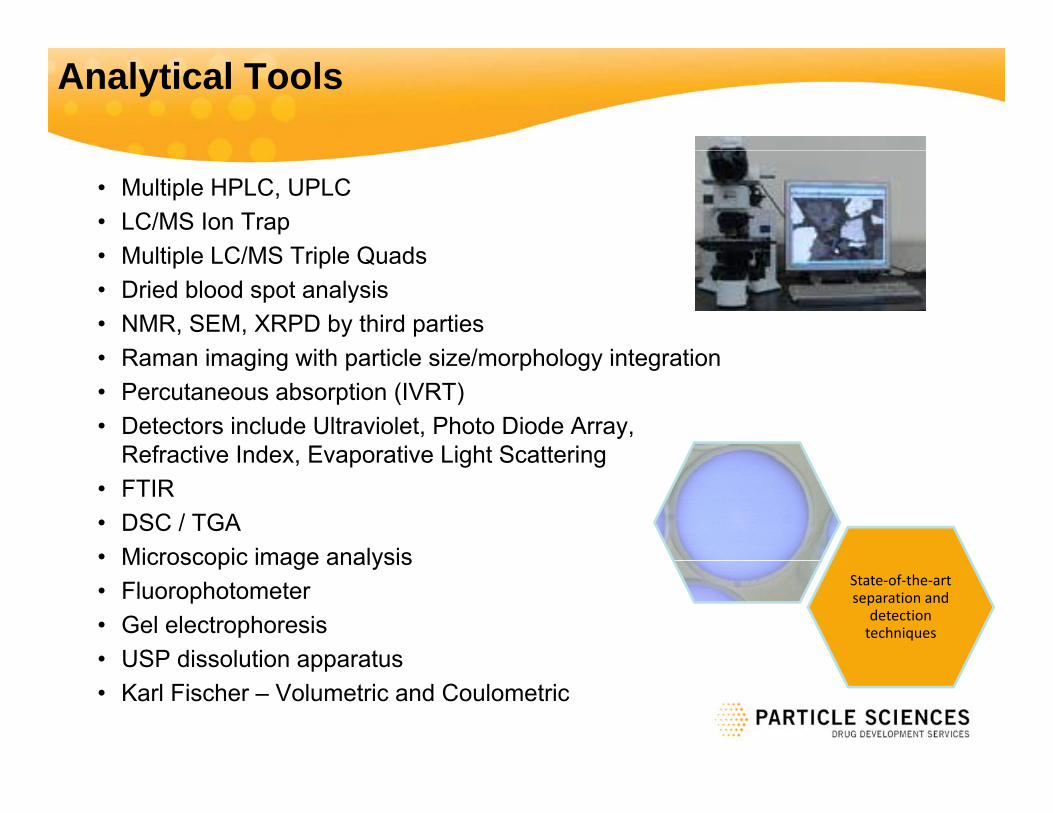
Analytical Tools
• Multiple HPLC, UPLC• LC/MS Ion Trap• Multiple LC/MS Triple Quads• Multiple LC/MS Triple Quads• Dried blood spot analysis• NMR, SEM, XRPD by third parties• Raman imaging with particle size/morphology integration• Raman imaging with particle size/morphology integration • Percutaneous absorption (IVRT)• Detectors include Ultraviolet, Photo Diode Array,
Refractive Index Evaporative Light ScatteringRefractive Index, Evaporative Light Scattering • FTIR• DSC / TGA• Microscopic image analysisMicroscopic image analysis• Fluorophotometer• Gel electrophoresis • USP dissolution apparatus
State‐of‐the‐art separation and
detection techniques
USP dissolution apparatus• Karl Fischer – Volumetric and Coulometric
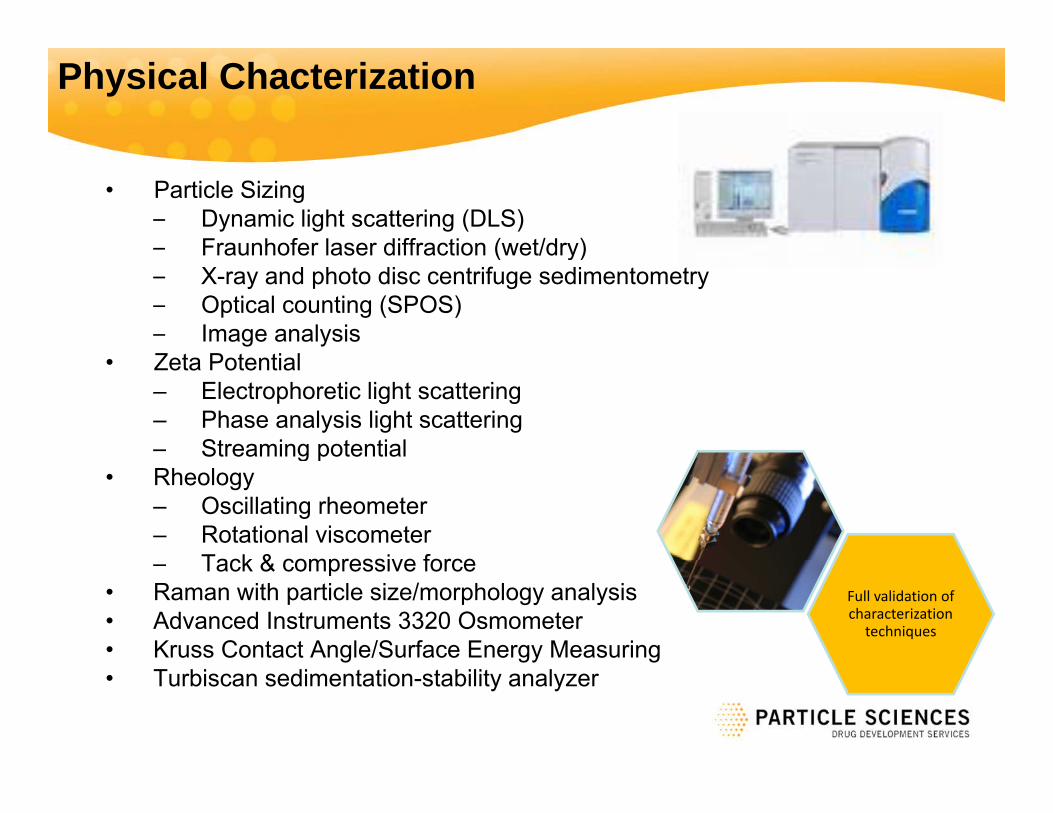
Physical Chacterization
• Particle Sizing– Dynamic light scattering (DLS)– Fraunhofer laser diffraction (wet/dry)Fraunhofer laser diffraction (wet/dry)– X-ray and photo disc centrifuge sedimentometry– Optical counting (SPOS)– Image analysisZ t P t ti l• Zeta Potential– Electrophoretic light scattering– Phase analysis light scattering– Streaming potentialg p
• Rheology– Oscillating rheometer– Rotational viscometer
Tack & compressive force– Tack & compressive force• Raman with particle size/morphology analysis• Advanced Instruments 3320 Osmometer• Kruss Contact Angle/Surface Energy Measuring
Full validation of characterization
techniques
• Turbiscan sedimentation-stability analyzer
Intravaginal Dosage Forms
• Intravaginal Rings (IVRs): drug-eluting polymeric rings
• Creams: semi solid emulsions typically applied topically to• Creams: semi-solid emulsions typically applied topically to skin
• Pessaries: vaginal suppositoriesPessaries: vaginal suppositories
• Ovules : oval vaginal suppositories that are applied using an applicator
• Inserts: tablet vaginal suppositories that are applied using an applicator
• Strips: dissolvable filmstrips
• GELS: semi-solid, jelly-like materials which exhibit no flow on standing
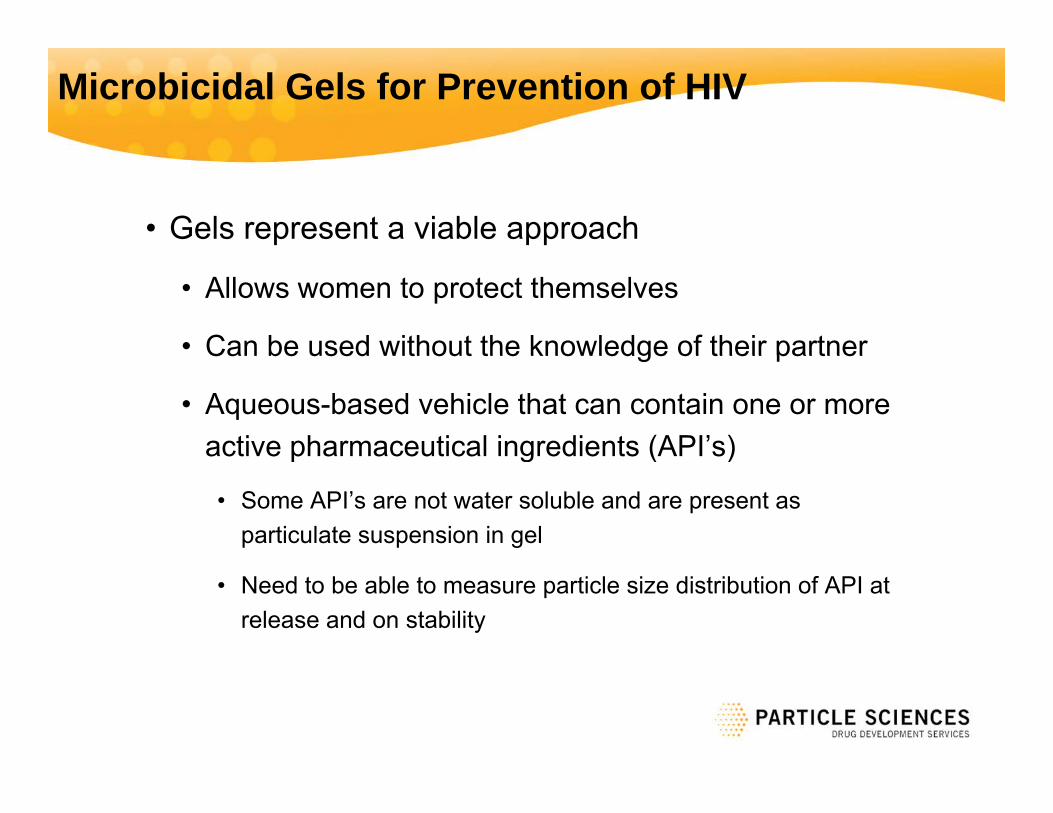
Microbicidal Gels for Prevention of HIV
• Gels represent a viable approach
• Allows women to protect themselves
• Can be used without the knowledge of their partnerCan be used without the knowledge of their partner
• Aqueous-based vehicle that can contain one or more active pharmaceutical ingredients (API’s)p g ( )
• Some API’s are not water soluble and are present as particulate suspension in gel
• Need to be able to measure particle size distribution of API at release and on stability
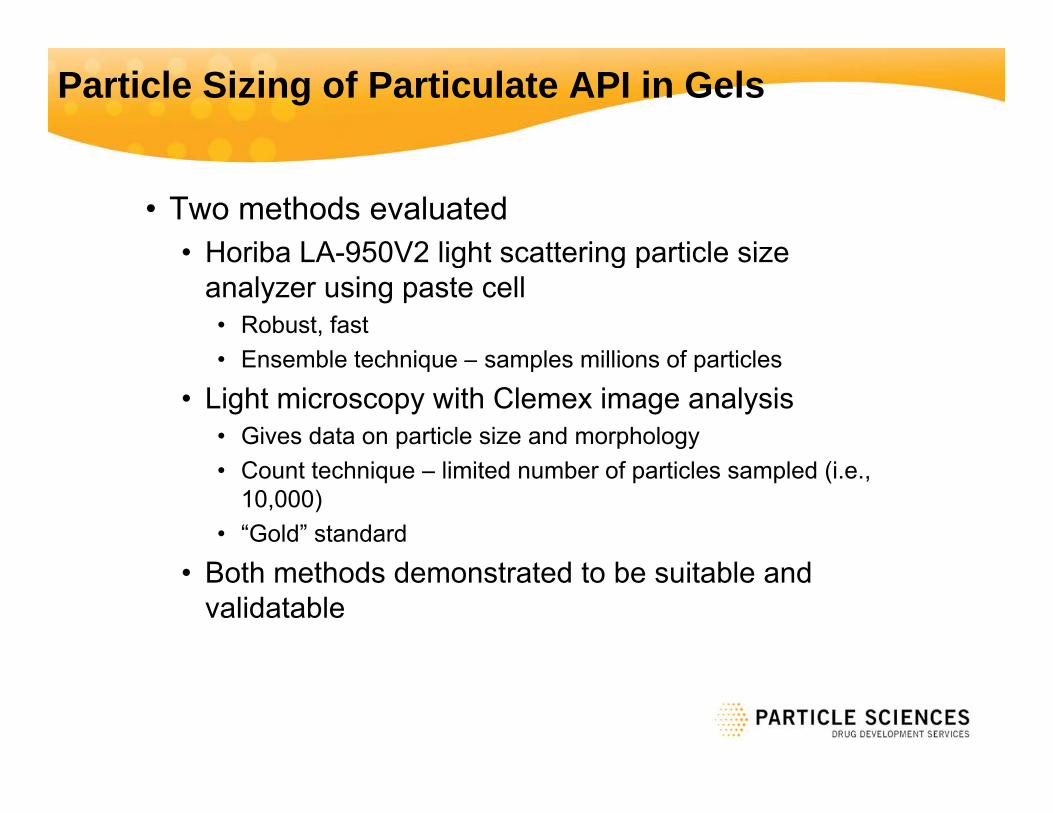
Particle Sizing of Particulate API in Gels
• Two methods evaluated• Horiba LA 950V2 light scattering particle size• Horiba LA-950V2 light scattering particle size
analyzer using paste cell• Robust, fast
Ensemble technique samples millions of particles• Ensemble technique – samples millions of particles
• Light microscopy with Clemex image analysis• Gives data on particle size and morphology• Count technique – limited number of particles sampled (i.e.,
10,000)• “Gold” standard
• Both methods demonstrated to be suitable and validatable
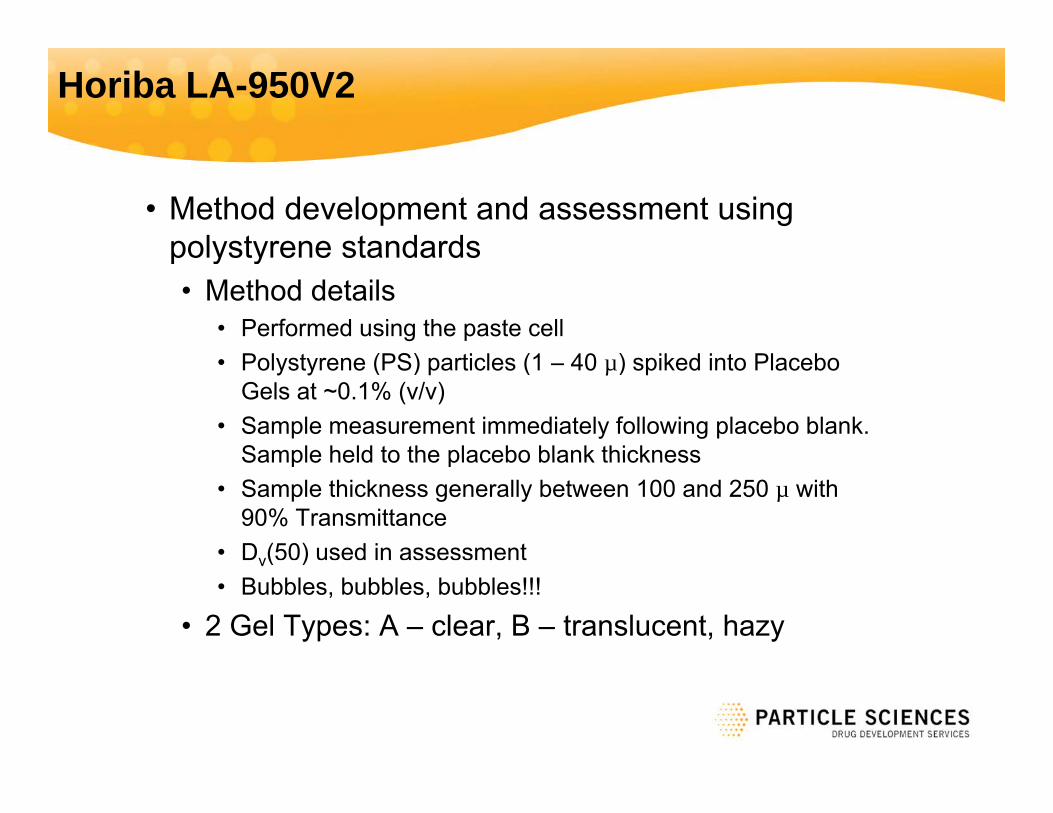
Horiba LA-950V2
• Method development and assessment using polystyrene standardspolystyrene standards• Method details
• Performed using the paste cell P l t (PS) ti l (1 40 ) ik d i t Pl b• Polystyrene (PS) particles (1 – 40 µ) spiked into Placebo Gels at ~0.1% (v/v)
• Sample measurement immediately following placebo blank. Sample held to the placebo blank thicknessSample held to the placebo blank thickness
• Sample thickness generally between 100 and 250 µ with 90% Transmittance
• Dv(50) used in assessment v( )• Bubbles, bubbles, bubbles!!!
• 2 Gel Types: A – clear, B – translucent, hazy
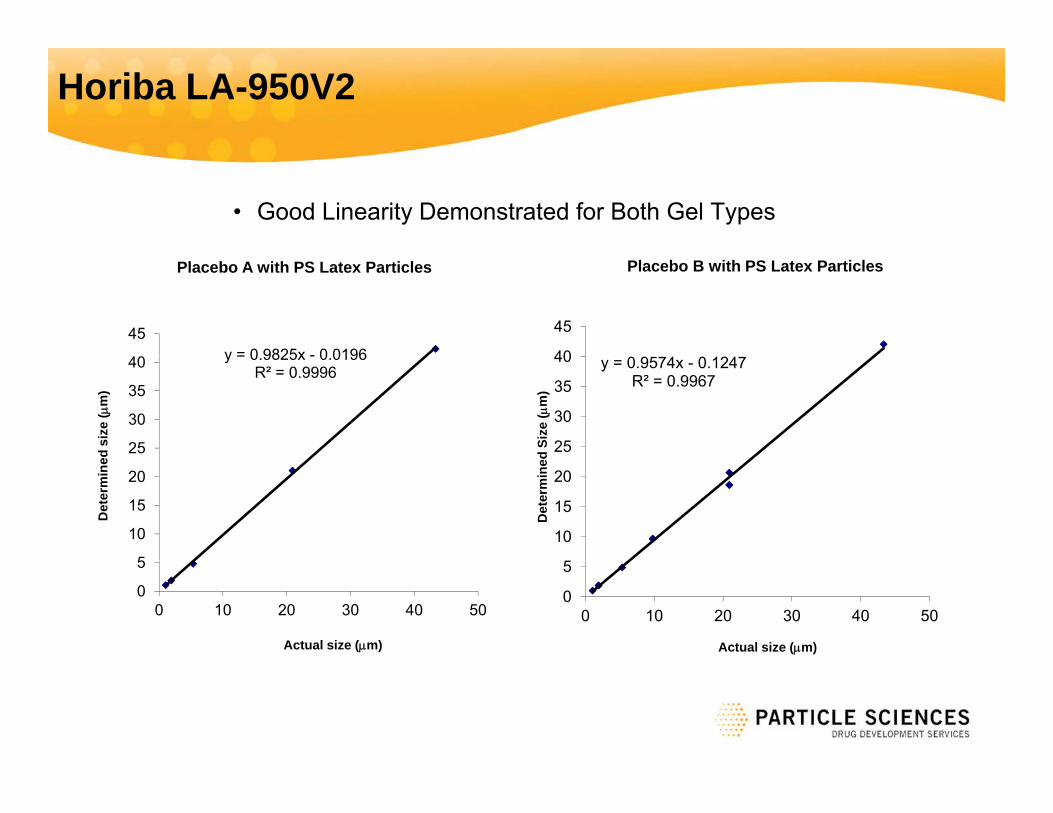
Horiba LA-950V2
• Good Linearity Demonstrated for Both Gel Types
40
45
Placebo B with PS Latex Particles
y = 0 9825x - 0 019645
Placebo A with PS Latex Particles
y = 0.9574x - 0.1247R² = 0.9967
25
30
35
40
d Si
ze (
m)
y = 0.9825x - 0.0196R² = 0.9996
25
30
35
40
ed s
ize
(m
)
10
15
20
Det
erm
ined
5
10
15
20
Det
erm
ine
0
5
0 10 20 30 40 50
Actual size (m)
0
5
0 10 20 30 40 50
Actual size (m)
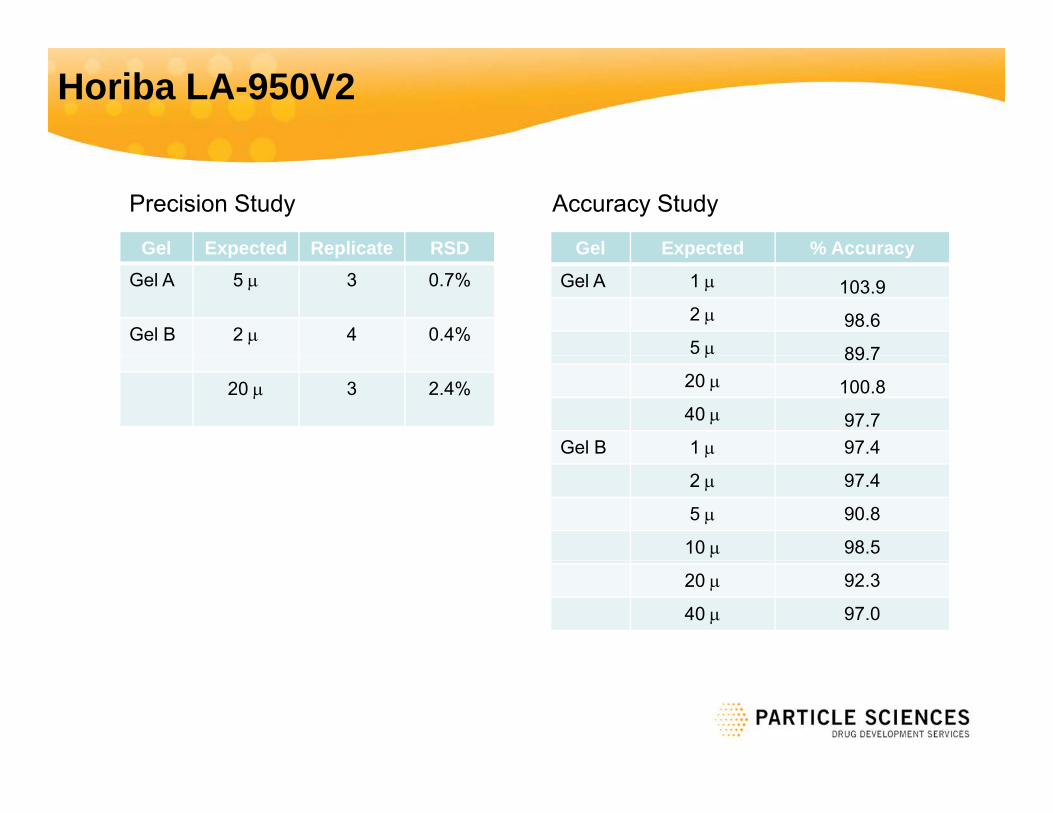
Horiba LA-950V2
Gel Expected Replicate RSD
Precision Study Accuracy Study
Gel Expected % AccuracyGel Expected Replicate RSDGel A 5 3 0.7%
Gel B 2 4 0.4%
Gel Expected % Accuracy
Gel A 1 103.92 98.65 89 7
20 3 2.4%
89.720 100.840 97.7
Gel B 1 97.4
2 97.4
5 90.8
10 98.5
20 92.3
40 97.0

Horiba LA-950V2
• Conclusions• Particle size determination of aqueous gels using laser
diffraction is possible• Sample preparation critical – need to eliminate/minimizeSample preparation critical need to eliminate/minimize
bubbles • Linear response for a range of polystyrene standards
demonstrateddemonstrated• Excellent precision can be obtained • Good to excellent accuracy can be obtained
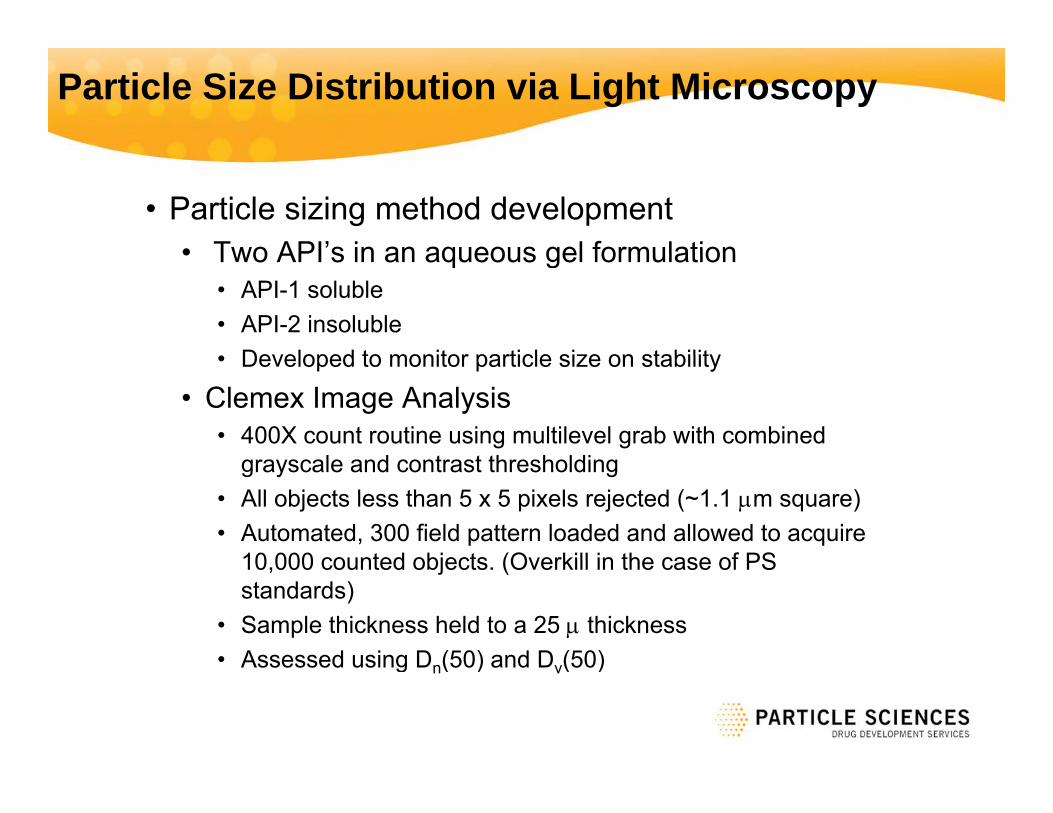
Particle Size Distribution via Light Microscopy
• Particle sizing method development• Two API’s in an aqueous gel formulation• Two API s in an aqueous gel formulation
• API-1 soluble• API-2 insoluble • Developed to monitor particle size on stability• Developed to monitor particle size on stability
• Clemex Image Analysis • 400X count routine using multilevel grab with combined
l d t t th h ldigrayscale and contrast thresholding • All objects less than 5 x 5 pixels rejected (~1.1 m square)• Automated, 300 field pattern loaded and allowed to acquire
10 000 counted objects (Overkill in the case of PS10,000 counted objects. (Overkill in the case of PS standards)
• Sample thickness held to a 25 thickness• Assessed using D (50) and D (50)Assessed using Dn(50) and Dv(50)
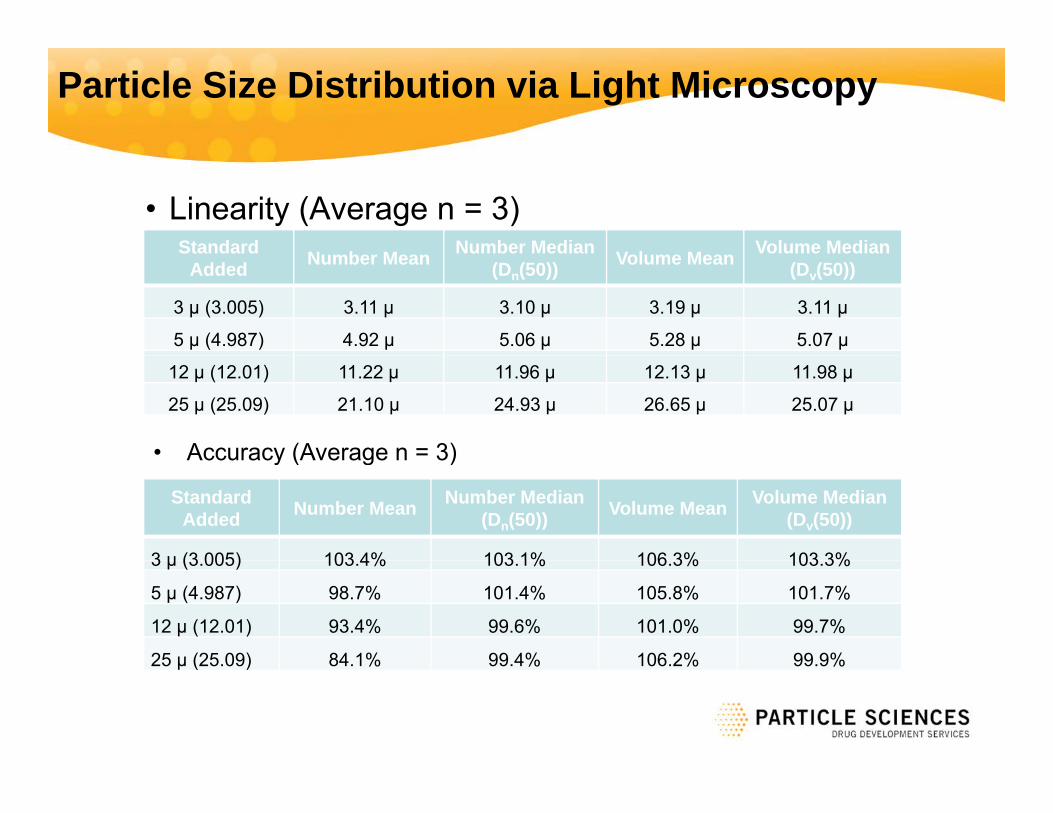
Particle Size Distribution via Light Microscopy
• Linearity (Average n = 3)Standard N b M Number Median V l M Volume MedianStandard
Added Number Mean Number Median (Dn(50)) Volume Mean Volume Median
(Dv(50))
3 µ (3.005) 3.11 µ 3.10 µ 3.19 µ 3.11 µ
5 µ (4.987) 4.92 µ 5.06 µ 5.28 µ 5.07 µ
12 µ (12.01) 11.22 µ 11.96 µ 12.13 µ 11.98 µ
25 µ (25.09) 21.10 µ 24.93 µ 26.65 µ 25.07 µ
• Accuracy (Average n = 3)Accuracy (Average n 3)
Standard Added Number Mean Number Median
(Dn(50)) Volume Mean Volume Median (Dv(50))
3 µ (3 005) 103 4% 103 1% 106 3% 103 3%3 µ (3.005) 103.4% 103.1% 106.3% 103.3%
5 µ (4.987) 98.7% 101.4% 105.8% 101.7%
12 µ (12.01) 93.4% 99.6% 101.0% 99.7%
25 µ (25 09) 84 1% 99 4% 106 2% 99 9%25 µ (25.09) 84.1% 99.4% 106.2% 99.9%
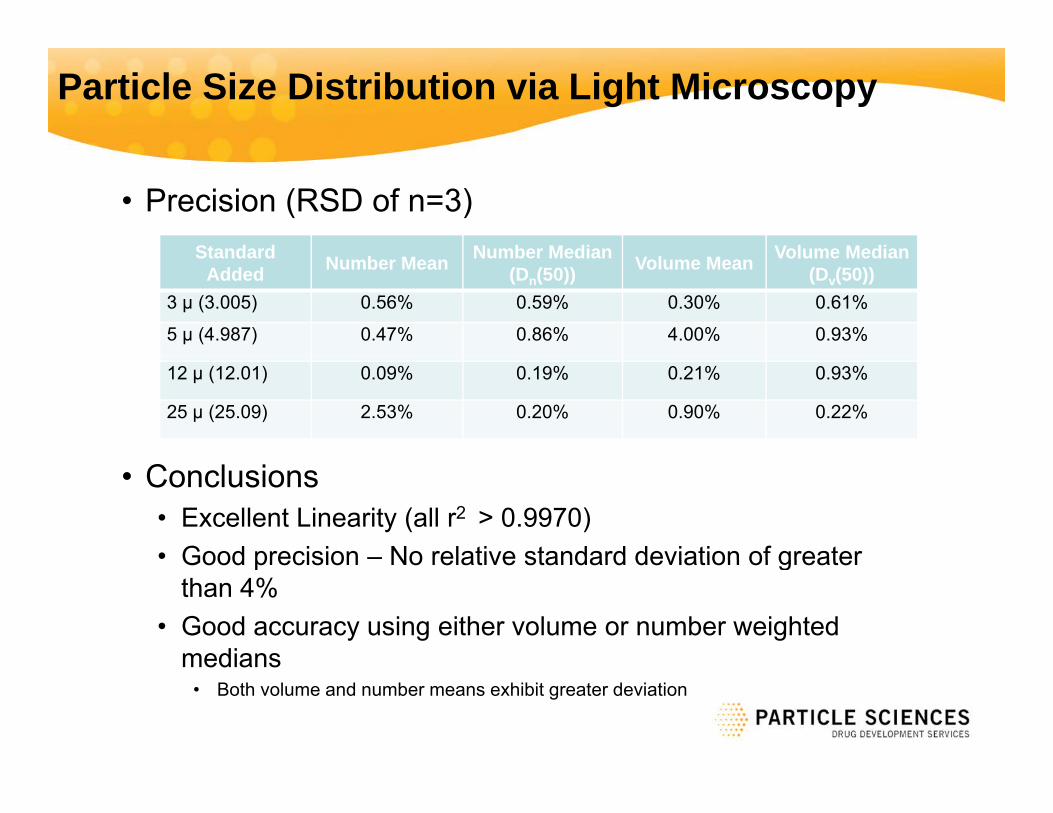
Particle Size Distribution via Light Microscopy
• Precision (RSD of n=3)Standard Number Median Volume MedianStandard
Added Number Mean Number Median (Dn(50)) Volume Mean Volume Median
(Dv(50))3 µ (3.005) 0.56% 0.59% 0.30% 0.61%
5 µ (4.987) 0.47% 0.86% 4.00% 0.93%
12 µ (12.01) 0.09% 0.19% 0.21% 0.93%
25 µ (25.09) 2.53% 0.20% 0.90% 0.22%
• Conclusions• Excellent Linearity (all r2 > 0.9970)• Good precision – No relative standard deviation of greaterGood precision No relative standard deviation of greater
than 4%• Good accuracy using either volume or number weighted
mediansmedians• Both volume and number means exhibit greater deviation
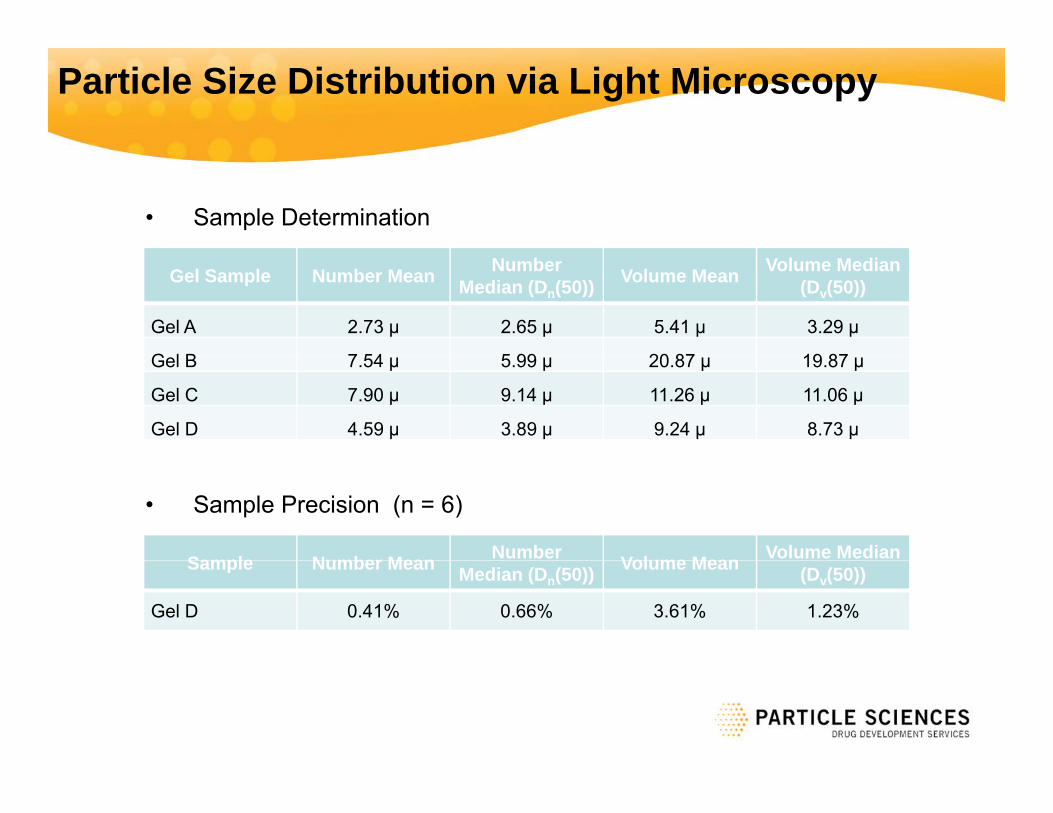
Particle Size Distribution via Light Microscopy
• Sample Determination
Gel Sample Number Mean Number Median (Dn(50)) Volume Mean Volume Median
(Dv(50))
Gel A 2.73 µ 2.65 µ 5.41 µ 3.29 µ
G l B 7 54 5 99 20 87 19 87Gel B 7.54 µ 5.99 µ 20.87 µ 19.87 µ
Gel C 7.90 µ 9.14 µ 11.26 µ 11.06 µ
Gel D 4.59 µ 3.89 µ 9.24 µ 8.73 µ
• Sample Precision (n = 6)
Sample Number Mean Number Volume Mean Volume Median Sample Number Mean Median (Dn(50)) Volume Mean (Dv(50))
Gel D 0.41% 0.66% 3.61% 1.23%
Light Microscopy with Image Analysis and Laser Diffraction Comparisonp
• Spiked Whitehouse glass standards into placebo gel and measured using Clemex image analysisgel and measured using Clemex image analysis package and Horiba LA-950V2• Mixed Whitehouse Scientific PS 192 (polydisperse 1-
10 ) standard at @ 0.1% v/v (full 0.1 g vial) with Placebo A
• Sample analyzed via Clemex image analysisSample analyzed via Clemex image analysis• Particle size distribution (by number) imported into
Excel• Sample analyzed via Horiba using paste cell• Sample analyzed via Horiba using paste cell
• Particle size distribution (by number) imported into Excel (150 iterations)
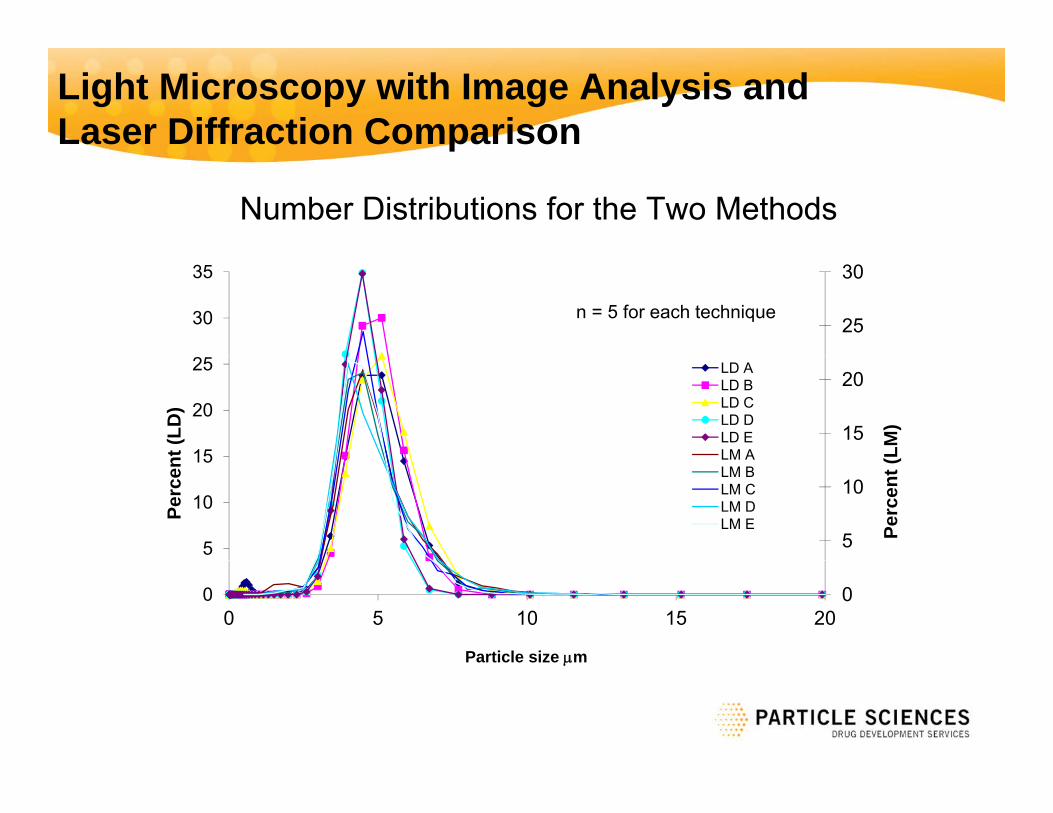
Light Microscopy with Image Analysis and Laser Diffraction Comparisonp
Number Distributions for the Two Methods
25
30
30
35
n = 5 for each technique
15
20
15
20
25
LM)
nt (L
D)
LD ALD BLD CLD DLD ELM A
5
10
5
10
15
Perc
ent (
Perc
e n
LM ALM BLM CLM DLM E
000 5 10 15 20
Particle size m
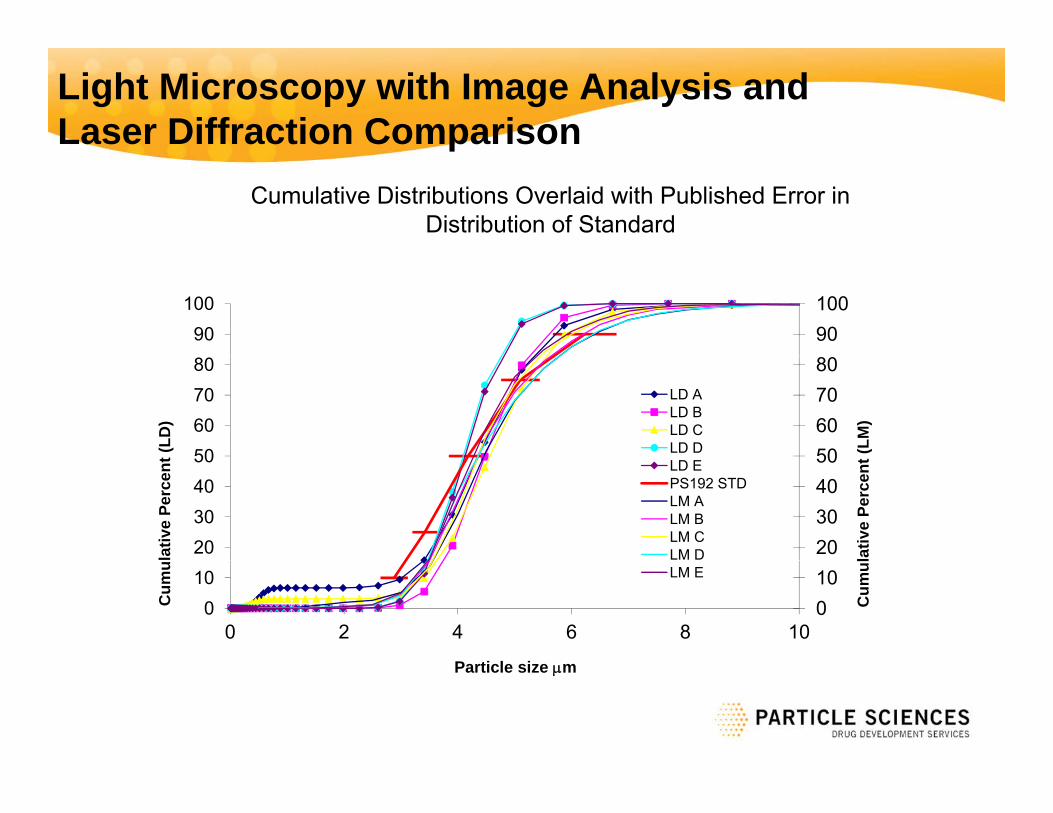
Light Microscopy with Image Analysis and Laser Diffraction Comparisonp
Cumulative Distributions Overlaid with Published Error in Distribution of Standard
90100
90100
50607080
50607080
(LM
)
t (LD
)
LD ALD BLD CLD D
20304050
20304050
lativ
e Pe
rcen
t
lativ
e Pe
rcen
t LD EPS192 STDLM ALM BLM CLM D
010
010
0 2 4 6 8 10
Cum
ul
Cum
u
P ti l i
LM E
Particle size m
Light Microscopy with Image Analysis and Laser Diffraction Comparisonp
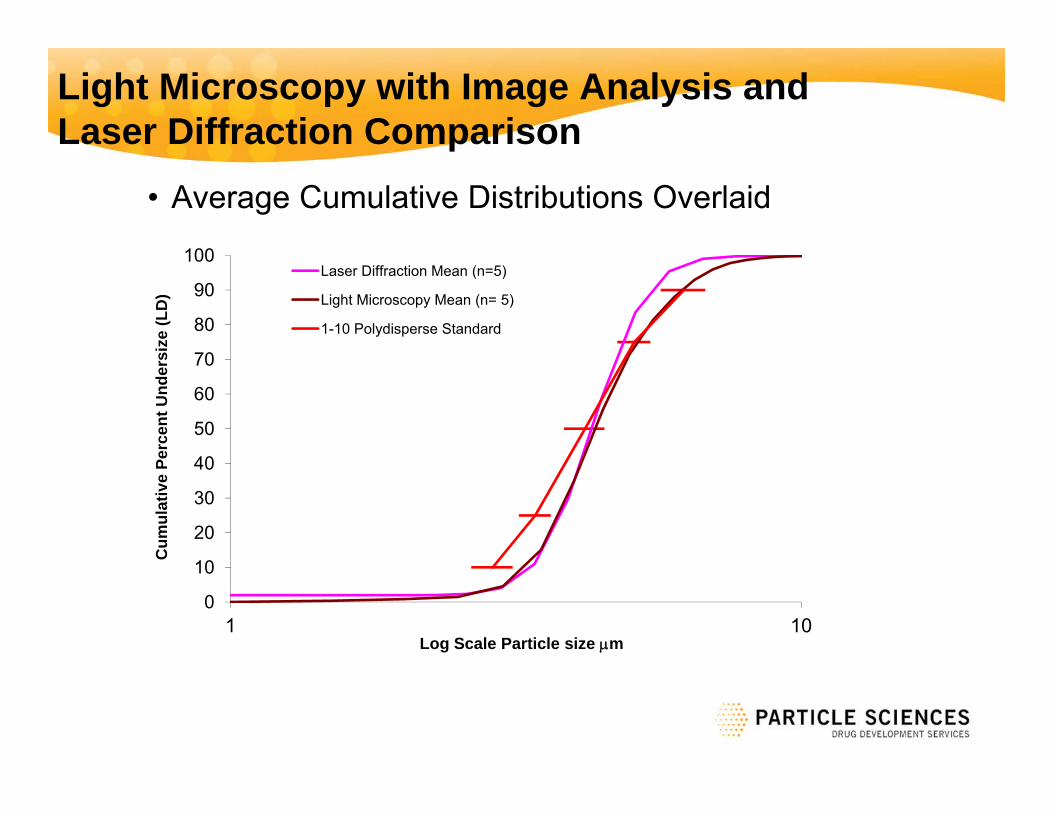
• Average Cumulative Distributions Overlaid
100
70
80
90
100
size
(LD
)
Laser Diffraction Mean (n=5)
Light Microscopy Mean (n= 5)
1-10 Polydisperse Standard
40
50
60
70
erce
nt U
nder
s
10
20
30
40
Cum
ulat
ive
Pe
0
10
1 10Log Scale Particle size m
Light Microscopy with Image Analysis and Laser Diffraction Comparisonp
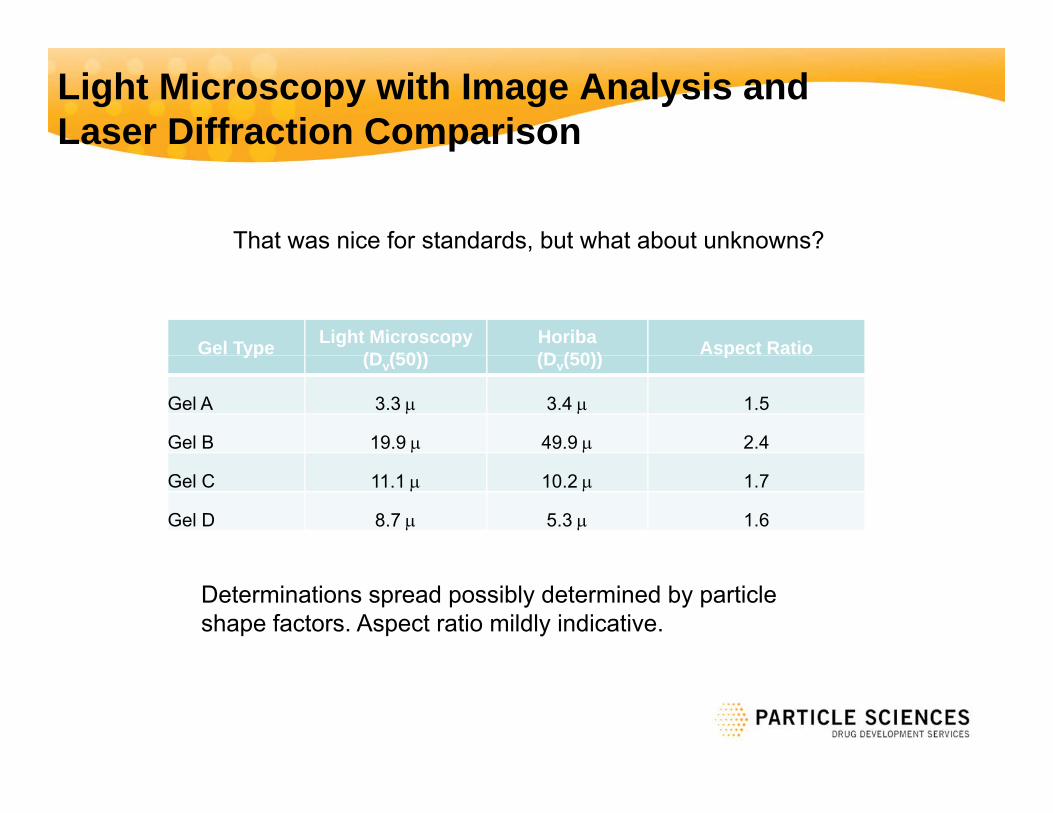
That was nice for standards, but what about unknowns?
Gel Type Light Microscopy(D (50))
Horiba (D (50)) Aspect Ratio yp (Dv(50)) (Dv(50)) p
Gel A 3.3 3.4 1.5
Gel B 19.9 49.9 2.4
Gel C 11.1 10.2 1.7
Gel D 8.7 5.3 1.6
Determinations spread possibly determined by particle shape factors. Aspect ratio mildly indicative.
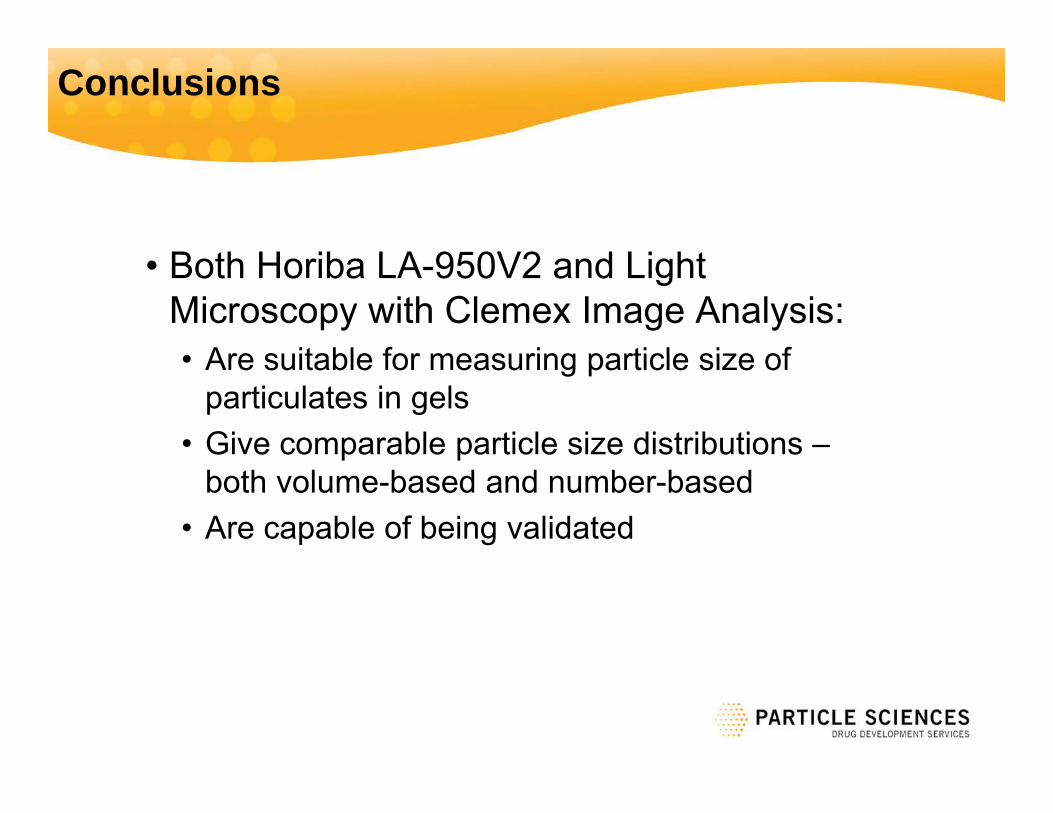
Conclusions
B th H ib LA 950V2 d Li ht• Both Horiba LA-950V2 and Light Microscopy with Clemex Image Analysis:• Are suitable for measuring particle size of• Are suitable for measuring particle size of
particulates in gels• Give comparable particle size distributions –p p
both volume-based and number-based• Are capable of being validated
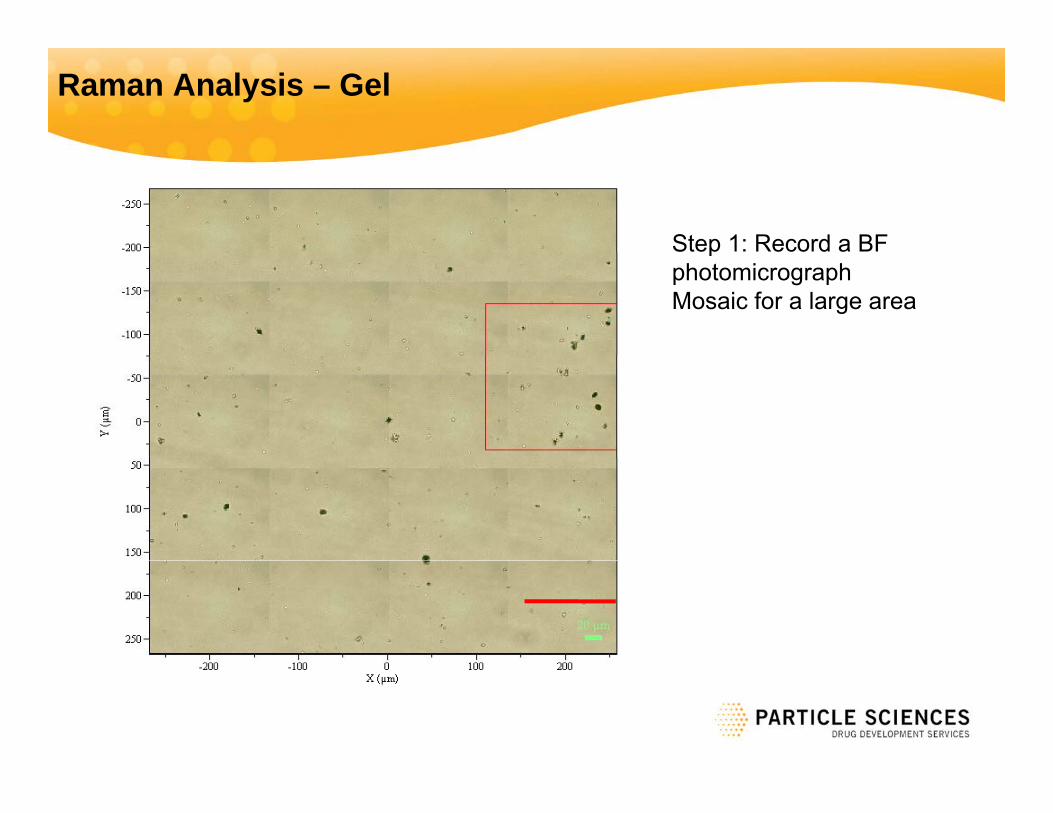
Raman Analysis – Gel
Step 1: Record a BF pphotomicrographMosaic for a large area
Raman Analysis – Gel
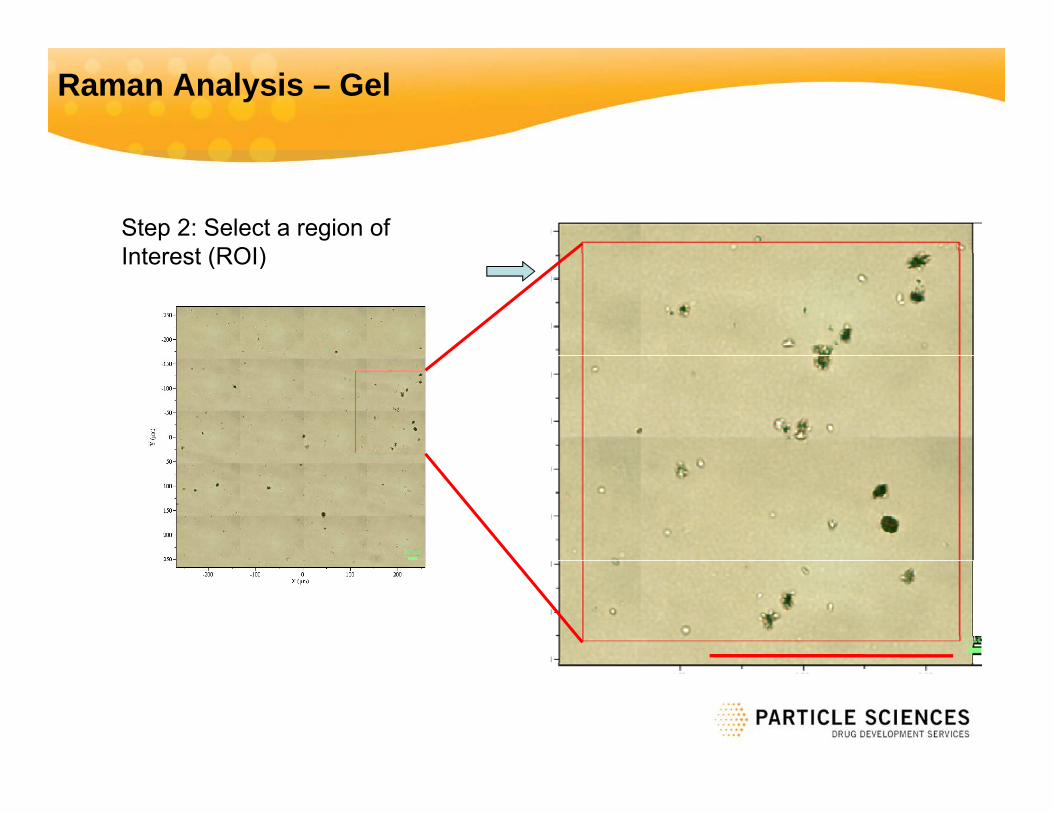
Step 2: Select a region of Interest (ROI)Interest (ROI)
Raman Analysis - Gel
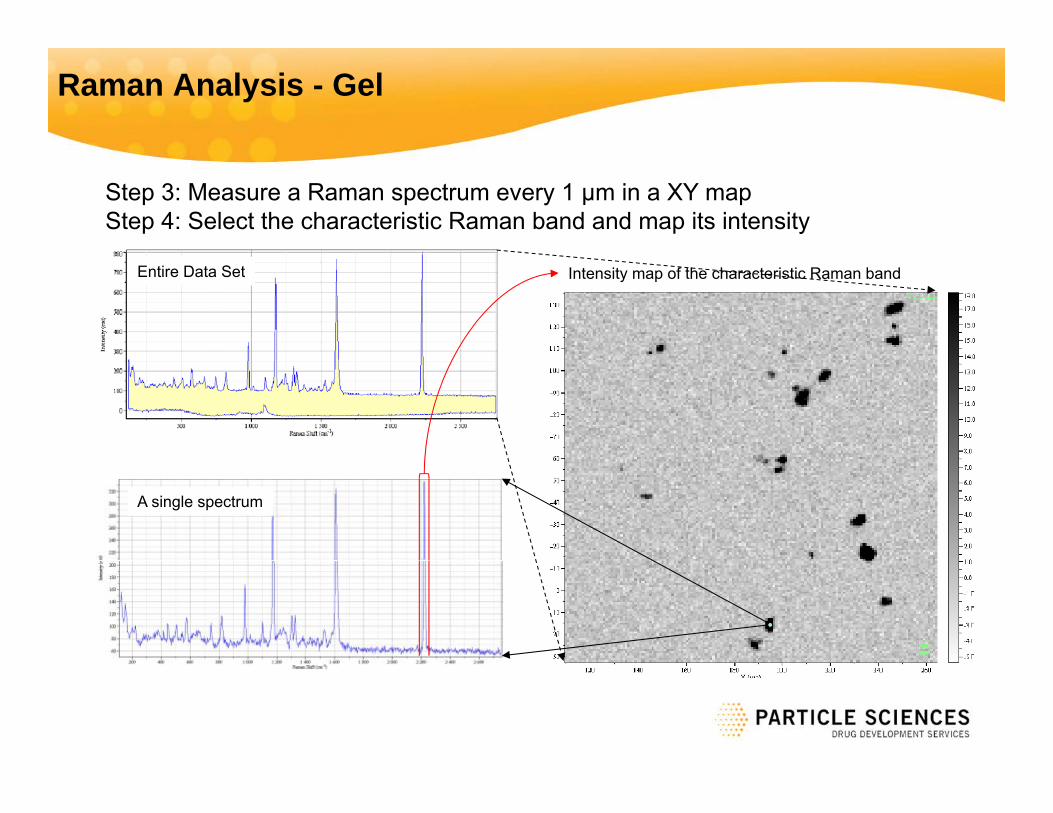
Step 3: Measure a Raman spectrum every 1 μm in a XY mapStep 4: Select the characteristic Raman band and map its intensity
Entire Data Set Intensity map of the characteristic Raman band
A single spectrum

Raman Analysis – GelAdvantage
Objects selected by image analysis and confirmed by Raman as NOT API
Object NOT selected by particle analysis as API but proved to be API by Raman. Objects selected by particle analysis as API and confirmed by Raman as API
Raman Analysis – Intravaginal Ring
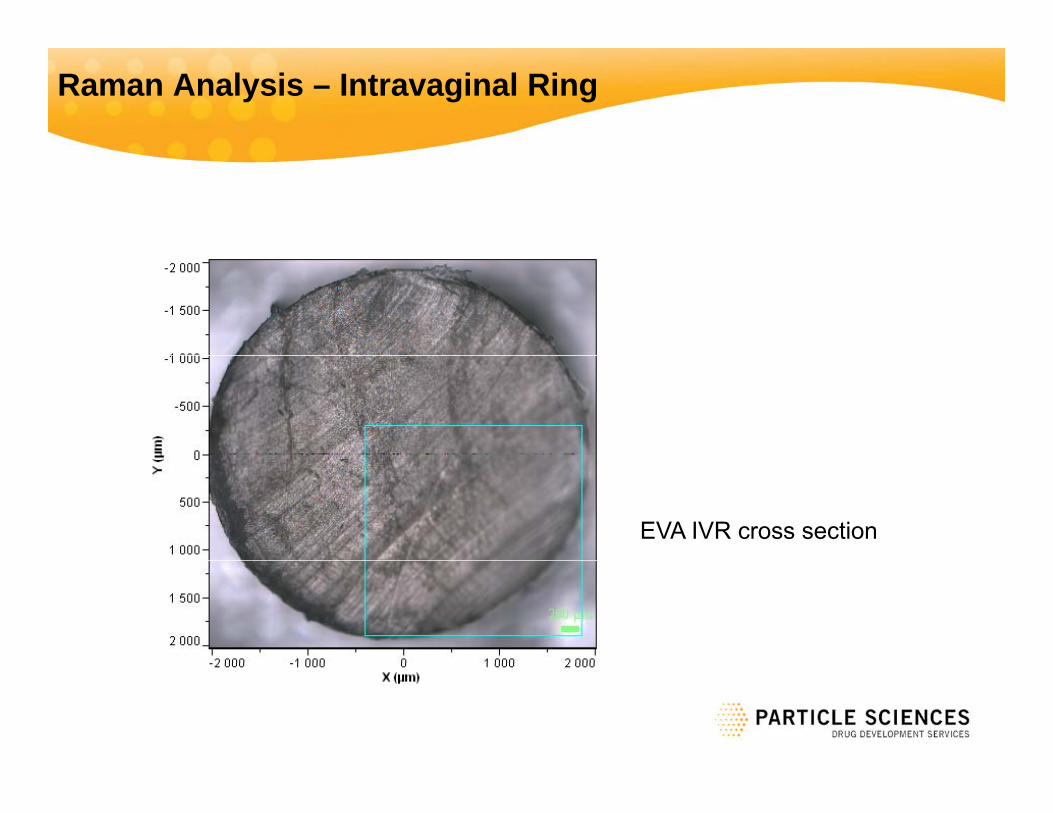
EVA IVR cross section
Raman Analysis – Intravaginal Ring
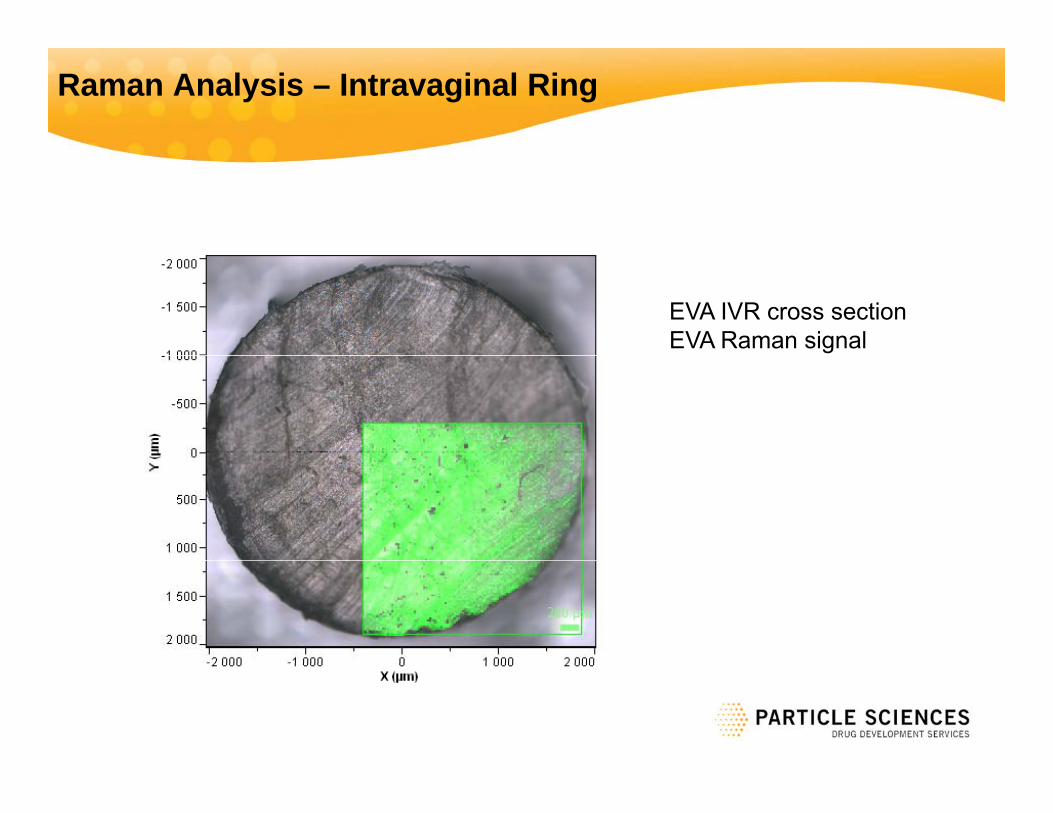
EVA IVR cross section EVA Raman signal
Raman Analysis – Intravaginal Ring
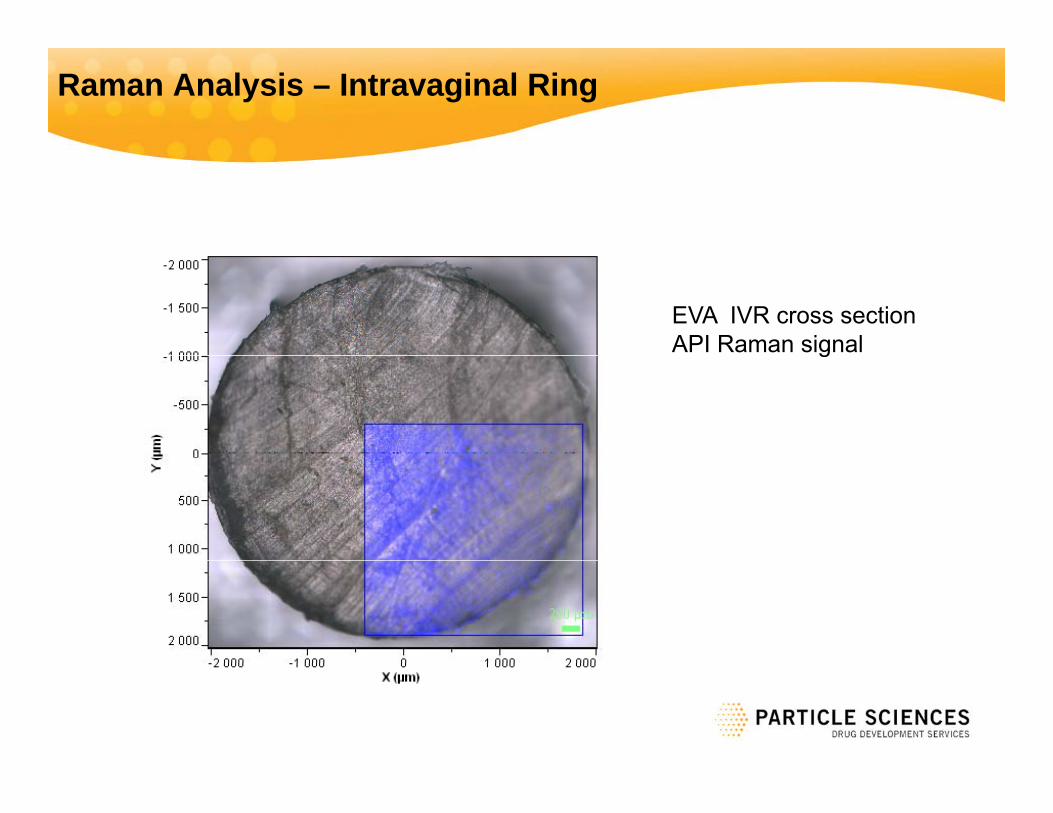
EVA IVR cross section API Raman signalg
Raman Analysis – Intravaginal Ring
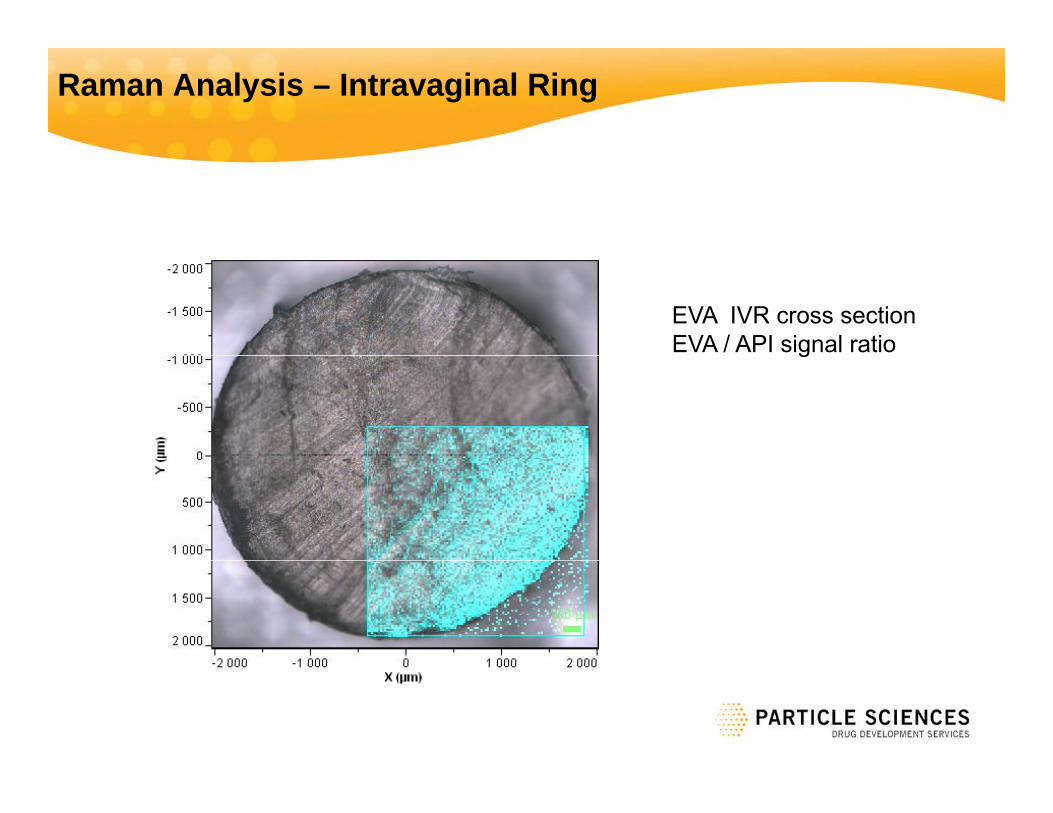
EVA IVR cross section EVA / API signal ratiog