Embed Size (px)
Citation preview
Eur Resplr J 1991, 4, 694-702
Particle deposition and resistance in the noses of adults and children
M.H. Becquemin*, D.L. Swift**, A Bouchikhi*, M. Roy***, A. Teillac*
Particle deposition and resistance in the noses of adults and children. M.H. Becquemin, D.L. Swift, A. Bouchikhi, M. Roy, A. Teillac. ABSTRACT: Nasal filter efficiency for particles has been described by several authors as showing large individual variations, probably somehow related to airflow resistance.
Twelve children, aged 5.5-11.5 yrs and 8 aged 12-15 yrs were compared to a group of ten adults. Deposition of polystyrene beads (1, 2.05, 2.8 llm mass median aerodynamic diameter (MMAD)) was measured by comparing Inhaled aerosols and exhaled air concentrations, for both nose and mouth breathing. Ventilation was controlled to scale breathing patterns appropriate for each age either at rest or during moderate exercise to allow comparison between subjects Jn similar physiological conditions. Anterior nasal resistance (as a function of flow rate) and standard lung function were measured for each subject.
For the same inhalation flow rate of 0.300 l·s·1, children bad much higher nasal resistances than the adults, 0.425:~:0.208 kPa·/'1·s under 12 yrs, 0.243:~:0.080 kPa·l·1·s over 12 yrs and 0.145:~:0.047 kPa•/'1•s in adults. Individually, nasal deposition increased with particle size, ventilation flow rate and nasal resistance, from rest to exercise.
The average nasal deposition percentages were lower in children than In adults, In similar conditions: at rest, 12 .. 9 and 11.7 versus 15.6 for 1 !J.m; 13.3 and 15 .. 9 versus 21.6 for 2.05 ).lm; 11 and 17.7 versus 20 for 2.8 !J.m. This was even more significant during exercise, 17.8 and 15.9 versus 29.2 for 1 !J.m; 21.3 and 18.4 versus 34.7 for 2.05 !J.m; 16 and 16.1 versus 36.8 for 2.8 14m.
At rest and during moderate exercise, for these particle sizes, the average nasal deposition percentages in children and in adults were better correlated with inspiratory airflows (r•0.357, 0.473 and 0.435 for 1, 2.05 and 2.8 !J.m, respectively) than with resistances (r=0.066, -0.148 and -0.254) or pressure drops (r•0.156, 0.199 and 0.107). Eur Respir J., 1991, 4, 694-702.
• Service Central d'EFR: H~pital Piti~-Salp~triere, Universit~ Lariboisiere Saint-Louis, Paris, France.
•• Johns Hopkins University School of Hygiene and Public Health, Baltimore, MD 21205, USA.
••• IPSN/DPS • CEN/FAR, B.P. no. 6- 62265 Fontenay-aux-Roses Cedex, France.
Correspondence: Dr M. Roy, CEAIIPSN/DPS/SEAPS, B.P. no. 6, F-92265 Fontenay-aux-Roses, Cedex, France.
Keywords: Adults and children; dosimet.ry models; nasal airways; particle deposition; rhinomanometry.
Received: March 1990; accepted after revision March 7, 1991.
This work was partiaUy supported by the CEC, under contract B16-D·l01-F (CD). D.L.S was partially supported by Aibejdsmiljoinstituttet, Copenhagen, Denmark.
The regional distributions of airborne particles within the nasal airways is probably dependent on particle size, breathing rate and morphological parameters, as it is in the bronchial airways. It is difficult to get a good idea as to which of the two latter sets of parameters would be predictive of aerosol deposition in the nose. In order to determine, for example, the important regions of the nose and presumably the effects of their dimensions and anatomy on deposition, one needs to measure particle deposition in the real nose experimentally. Valuable data have been obtained on realistic cast models of nasal airways [1]; however, the high sensitivity of the nasal mucosa to ambient air features, and the frequent existence in normal physiological conditions of a nasal cycle that alternates higher and lower flow rates in right and left passages [2], makes it necessary to obtain deposition data in vivo. Such data exist for adults,
measured either passively during breath holding (3], or by active breathing [ 4 ], but they are missing for children, so far as we know.
A summary of in vivo nasal deposition studies was presented by Yu et al. [5]. All seven investigations were carried out on normal adult male subjects and several techniques for measuring nasal deposition were employed. The correlation of these studies using a modified inertial parameter showed wide intersubject variability. Theoretical models of nasal deposition, including age dependency [ 6] have been developed, but the dimensional extrapolations are not firmly based.
The changing with age of the nose dimensions and geometry, and of the ventilation is usually assumed to result in changes of particle deposition values. An assessment of these values in the growing airways is of special interest, not only for toxicological hazards in
PARTICLE DEPOSmON IN TilE NOSE 695
children, but also for the estimate of accumulated doses during a whole life-span.
The purpose of this work was to measure in vivo particle deposition at inhalation in the noses of children during controlled breathing. Comparison wouJd be made with the deposition measured in the adult nose in similar conditions, breathing patterns being scaled according to body sizes and weights. It was also intended to relate the deposition data to the observed inhalation airflows, nasal resistance and nasal pressure drop.
Methodology
Deposition of monodisperse aerosols has been measured in the airways for both nose- and mouth-breathing, by comparing inhaled and exhaled aerosol concentrations, measured by laser velocimetry. The ventilation was controlled, and the tidal volumes (VT) and frequencies (JP)' selected according to age, body size, and sex, in order to standardize the physiological parameters at rest, and under light exercise.
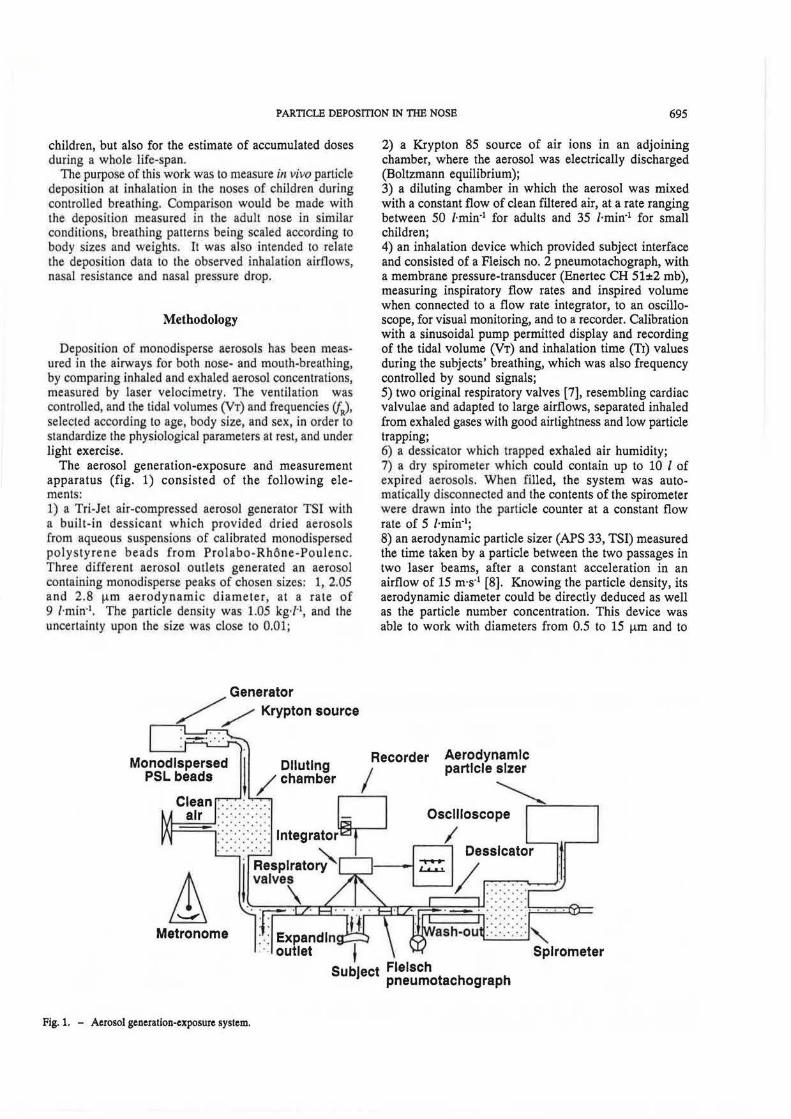
The aerosol generation-exposure and measurement apparatus (fig. 1) consisted of the following elements: 1) a Tri-Jet air-compressed aerosol generator TSI with a built-in dessicant which provided dried aerosols from aqueous suspensions of calibrated monodispersed polystyrene beads from Prolabo-Rhone-Poulenc. Three different aerosol outlets generated an aerosol contain.ing monodisperse peaks of chosen sizes: 1, 2.05 and 2.8 f!m aerodynamic diameter, at a rate of 9 /·min·1• The particle density was 1.05 kg·/·1, and the uncertainty upon the size was close to 0.01;
Generator // Krypton source
Metronome
Fig. 1. - Aerosol generation-exposure system.
2) a Krypton 85 source of air ions in an adjoining chamber, where the aerosol was electrically discharged (Boltzmann equilibrium); 3) a diluting chamber in which the aerosol was mixed with a constant flow of clean filtered air, at a rate ranging between 50 i·rnin·1 for adults and 35 l·min·1 for small children; 4) an inhalation device which provided subject interface and consisted of a Fleisch no. 2 pneumotachograph, with a membrane pressure-transducer (Enertec CH 51±2 rob), measuring inspiratory flow rates and inspired volume when connected to a flow rate integrator, to an oscilloscope, for visual monitoring, and to a recorder. Calibration with a sinusoidal pump permitted display and recording of the tidal volume (VT) and inhalation time (TJ) values during the subjects' breathing, which was also frequency controlled by sound signals; 5) two original respiratory valves [7], resembling cardiac valvulae and adapted to large airflows, separated inhaled from exhaled gases with good airtightness and low particle trapping; 6) a dessicalor which trapped exhaled air humidity; 7) a dry spirometer which could contain up to 10 1 of expired aerosols. When filled, the system was automatically disconnected and the contents of the spirometer were drawn into the particle counter at a constant flow rate of 5 i·min·1;
8) an aerodynamic particle sizer (APS 33, TSI) measured the time taken by a particle between the two passages in two laser beams, after a constant acceleration in an airflow of 15 m·s·1 [8]. Knowing the particle density, its aerodynamic diameter could be directly deduced as well as the particle number concentration. This device was able to work with diameters from 0.5 to 15 f!m and to
Aerodynamic particle slzer
~,_....;::-----, Oscilloscope
.·.·.·.· .· , ••• 0 • "
Spirometer
696 M.H. BECQUEMIN ET AL.
classify them into 50 calibrated intervals of size or channels. In our case, where particle diameters were already known from the primary polystyrene suspension, the task was limited to identifying the channels corresponding to each of the three peaks of monodisperse particles and to noting the concentrations in each one. We assumed that the diameters would not change during the experiment provided the aerosols were well dessicated after expiration to eliminate expired water droplets. During nebulization triplets or other multiple particles could form. However, in the chosen counting channels, only the doublets and triplets of 1 ~-tm particles could modify the data by joining the 2.05 and 2.8 ~lm concentrations; the larger aggregates could not be taken into account. Moreover, these doublets and triplets would be the same in inspired and expired aerosols.
In order to avoid particle coincidences while counting, the total concentrations of particles of such sizes should not exceed SOO·ml·1 of aerosol to be measured [8). Under these conditions the particle concentrations were obtained with uncertainty equal to 0.01.
All the preceding elements were made of brass or neoprene, and all angles, abrupt diameter changes and bifurcations were designed to minimize particle losses in the apparatus.
Subjects
With the approval of the Ethical Committee of the hospital Pitie-Salpetriere, 20 children aged 5-15 yrs, boys and girls, and 10 adults, men and women, volunteered for the experiments. All of them were healthy nonsmokers as determined by both clinical examination and respiratory function explored by spirometry: vital capacity (VC), residual volume (RV), forced expired volume in
one second (FEV1), total lung capacity (T LC), and functional residual capacity (FRC) (table 1). T he reference values for adults came from QuANTER [9]; for children, reference values for VC came from CHERNW<
[10], for RV and FEV1 from GooFREY et al. [11), for TLC from DAB [12] and for FRC from H ELLJESEN et. al. [13).
Methods
After calibration of airflows, volumes, generated aerosol sizes and concentrat ions, pa rticle deposition was measured in each subject's respiratory tract. The controlled ventilation included two levels referred to as "rest" and "moderate exercise". In adults the same sets of parameters were chosen for both sexes: at rest VT = 0.750 l andff = 15·min·1, during exercise VT = 1.25 land fR = 23·min· [14).
The values for children were scaled to the adults' after GAULTIER et a/. [15), GODFREY et al. (16), and GODFREY [17]: for all ages, VT was calculated from the body weight, 12 ml·kg·1 at rest and 17 ml·kg·1 during exercise. For the children younger than 12 yrs, VT thus ranged, at rest from 0.230-0.420 I with fR chosen at 23·min·1, and during exercise from 0.330-0.600 l, with fR = 30·min·1• For the children older than 12 yrs, VT ranged, at rest from 0.340-0.730 I with fR = 18·min·1, and during exercise from 0.480-1.040 I with fR = 25·min4 •
Each subject repeated the aerosol inhalation at least twice with the same breathing pattern; after being trained, the adults were able to reproduce their tidal volume and respiratory frequency with an error of less than 0.05; the children reproduced them with an error less than 0.10. This was the dominating source of uncertainty for deposition.
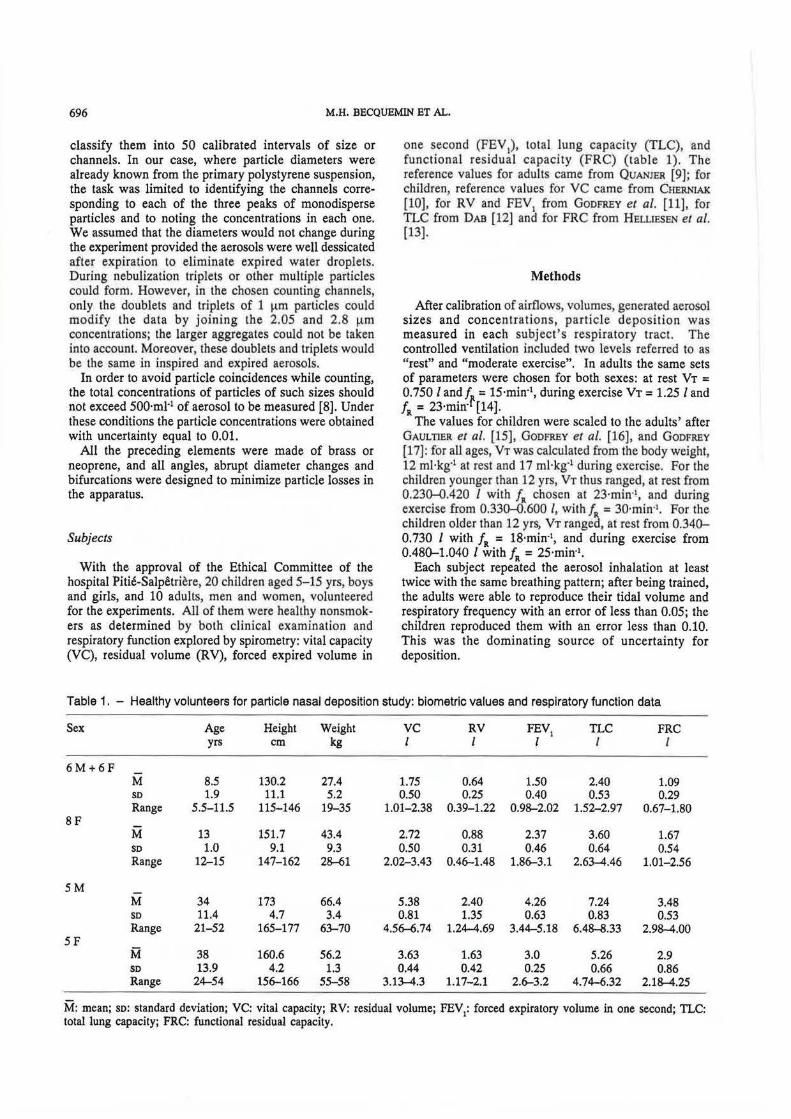
Table 1. - Healthy volunteers for particle nasal deposition study: biometric values and respiratory function data
Sex Age Height Weight VC RV FEV1 TLC FRC
yrs cm kg l l l I I
6M+6F M 8.5 130.2 27.4 1.75 0.64 1.50 2.40 1.09 so 1.9 11.1 5.2 0.50 0.25 0.40 0.53 0.29 Range 5.5-11.5 115-146 19-35 1.01-2.38 0.39-1.22 0.98-2.02 1.52-2.97 0.67-1.80
SF M 13 151.7 43.4 2.72 0.88 2.37 3.60 1.67 so 1.0 9.1 9.3 0.50 0.31 0.46 0.64 0.54 Range 12-15 147-162 2~1 2.02-3.43 0.46-1.48 1.86-3.1 2.63-4.46 1.01-2.56
SM M 34 173 66.4 5.38 2.40 4.26 7.24 3.48 SO 11.4 4.7 3.4 0.81 1.35 0.63 0.83 0.53 Range 21-52 165-177 63-70 4.56--6.74 1.24-4.69 3.44-5.18 6.48-8.33 2.98-4.00
SF M 38 160.6 56.2 3.63 1.63 3.0 5.26 2.9 so 13.9 4.2 1.3 0.44 0.42 0.25 0.66 0.86 Range 24-54 156-166 55-58 3.13-4.3 1.17-2.1 2.6-3.2 4.74-6.32 2.18-4.25
M: mean; so: standard deviation; VC: vital capacity; RV: residual volume; FEV1: forced expiratory volume in one second; TLC: total lung capacity; FRC: functional residual capacity.
PARTICLE DEPOSmON IN TilE NOSE 697
Total airway deposition by mouth-breathing
Measurements were made during mouth-breathing, with a noseclip: firstly, with the mouthpiece closed, the spirometer was filled automatically with aerosol, at a rate (VT and /R) equal to that of previously determined controlled breathing, in order to keep impaction and sedimentation close to the actual breathing conditions. The APS U1en sampled aerosol from the filled spirometer for 30 s and measured the distribution and concentration (Ci) of particles to be inspired. The subject then inhaled an identical aerosoL After five wash-out cycles, the system was connected and the subject expired 10 I for adults and 5 I for children into the spirometer which was in turn sampled for 30 s by ilie APS, giving the distribution and concentration (Ce) of expired particles. The consistency of the aerosol concentration to be inspired (Ci) was checked after each inhalation manoeuvre.
Individual variability was observed in deposition data obtained in the same subject while reproducing the same breathing pattern: 1) for 1 fUll, the variation was between 0.05 and 0.10 of the deposited fraction of inhaled particles, in adults and between 0.10 and 0.15 in children; 2) for 2.05 and 2.8 J..Lm, it was between 0.02 and 0.03 in adults and 0.03 and 0.05 in children.
The deposition data presented in this study are the values obtained for each subject with the breathing pattern the closest to his own standard.
The deposition (Dm) of inert particles in the airways by mouth-breathing, was expressed as the ratio of the concentrations of expired (Cem) and inspired (Ci) aerosols:
Dm = 1 - Cem/Ci [1}
Nasal deposition at inhalation
Following the mouth-breathing experiment each subject performed the same manoeuvre while nose-breathing, through a nose-mask (with the mouth shut), at identical ventilation rate. The deposition (Dn) by nose-breathing in the airways was expressed in the same way as in Eq. (1}, giving:
Dn= 1 - Cen/Ci (2}
For the particle sizes of these experiments (1-2.8 Jlm aerodynamic diameter) it is reasonable to assume that the mouth itself has negligible aerosol deposition efficiency when breathing through a mouthpiece and wearing a noseclip. The empirical equation for mouth deposition by Yu et al. [5} predicts zero mouth deposition for 1.0 and 2.05 !Am diameter particles at all breathing conditions, and a maximum mouth deposition of 10% for 2.8 IJ.m diameter particles at the highest flow rate used. If we assume that Dm is equal to the sub-oral airway deposition (y), mainly the pharyngeal, tracheobronchial and alveolar deposi tions and that it is the same during nose-breathing (provided the subject breathe at
the same flow rate for the mouth- and nose-breathing) we can simplify nasal penetration 1-Dn, which is given by:
1-Dn = (1-x) (1-x' ) (1-y) [3)
where: x = nasal deposition fraction during inspiratory flow; x' = nasal deposition fraction during expiratory flow.
In order to calculate the particle fraction deposited in the nose during inspiration (x), we make the reasonable assumption [4} that the two nose deposited fractions x and x' are equal, we have then:
1-Dn = (1-x)1 (1-Dm) [4]
This assumption of equal nasal deposition during inspiration and expiration was observed for similar size particles by HEYDER and RuooLF (4} in adults and was also shown to be consistent with other studies reviewed by Yu et al. [5]. Although different empirical equations were obtained by Yu et al . [5] for inspiration and expiration they are sufficiently similar to justify the simplifying assumption.
We can solve Eq. (4] for x and express it in terms of (Cen and Cem):
x=l-~m [5]
lf we allow for a mouth deposition fraction (z), there is a factor (1 - z) multiplying the square root term in Eq. [5] and since the maximum value of z is 0.10, the resulting change in x is small. Thus, in these studies, it seems justified to neglect the effect of mouth deposition. It was not necessary to calculate Dm and Dn separately, provided Ci was kept constant, only the ratio of Cen to Cem was necessary.
Anterior rhinomanometry
In these subjects, anterior rhinomanometric determination of nasal resistances as a function of nasal airflows was made for each side of the nasal passages [18]: the pressure and flow rates variations were measured simultaneously in both nares during a breathing cycle. The flow rates (V), were measured with a Fleisch no. 1 pneumotachograph fitted to one nostril by a rubber piece and connected to a membrane pressuretransducer. The pressure drop (l!.P), over the opposite passage was measured in the vestibular region by a pressure recording catheter, connected to a second pressure transducer. The flow rate and pressure signals during inspiration were recorded in the x/y mode, for each nasal passage in turn. In each side pressure increased at first linearly with flow rate, then over a maximal V, depending on each subject, P increased faster than V and the curve became sigmoidal. The nasa l resistance, ratio of pressure over flow rate:
[6]
698 M.H. BECQUEMIN ET AL.
was not constant during an inspiration but increased with the airflow; the linear part of the resulting curve was fitted by the least square method to a linear relationship; the right and left res istances R, and R1 were thus obtained and the total resistance of the entire nose, RT, given by:
1/RT = 1/R, + 1/R1 [7J
For a given total nasal airflow during inspiration, the partitioning of the airflow between the two nasal passages was given by the maximal flo~ rate values from the linear part of the curve P versus V obtained in each side at the same moment. The total resistances measured just before and after aerosol inhalation in same subjects varied less than 0.10 of the first value.
Data treatment
The subjects were separated into three age-groups: 10 adults, 8 children 12 < age < 15 yrs, 12 children 5 :s; age :s; 12 yrs.
The mean values and standard deviations of the nasal deposited fractions of 1, 2.05 and 2.8 1-1m inhaled particles and of the ventilation parameters, at rest and during light exe~cise have been calculated for each of the subject groups: V (/·s'1) mean inspiratory flow rate; RT (kPa·f' Ls) total nasal resistance at this flow rate; P (kPa) pressure gradient across the nose and nasopharynx during nose-breathing of the aerosol test.
Mean values of total deposition by mouth-breathing, measured with the same breathing patterns are also given in parenthesis to allow comparison . .
For the same inspiratory flow rate, V chosen at 0.300 /·s·1, individual nasal resistances have been calculated, for the left and right nasal passages and for the total nose. All total resistances, as well as the ones of the maximal and minimal airflow sides were plotted against age. This presentation takes into account a predominant airflow in one of the nasal passages that was observed in all of our subjects.
For all of the individual values of each particle size deposited fraction, at rest and during exercise, linear correlation coefficients (r), were calculated with the corresponding flow rates (V) and total nose resistances (RT) and nasal pressure drop (~P) .
For every subject and each deposition test, an impaction parameter [4} equal to:
was calculated with: p = inhaled particle density (kg·/·1), d = inhaled particle dynamic diameter (J..lm), ~p = nasal pressure drop (kPa).
These values were plotted against the individual values of the nasal deposited fractions, for the three groups.
Nasal inspiratory deposition of three particle sizes in each of the two groups of children were compared to those of the adults by the Mann-Whitney non parametric rank test.
Results
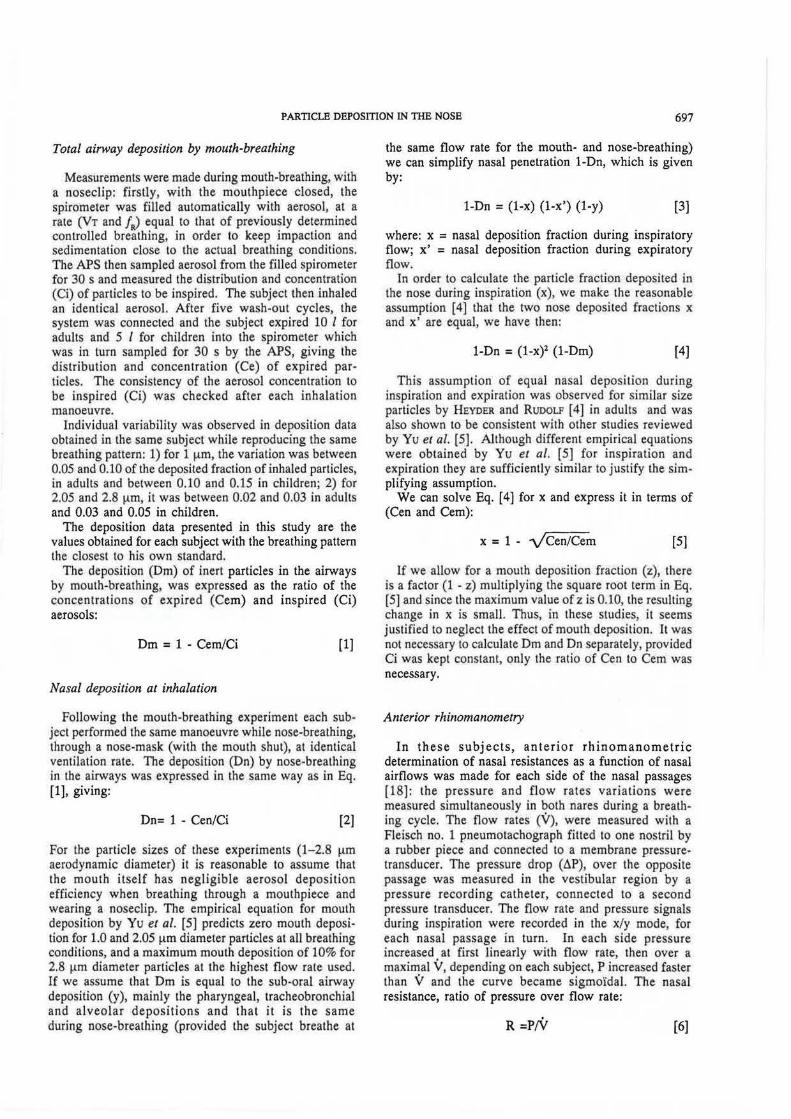
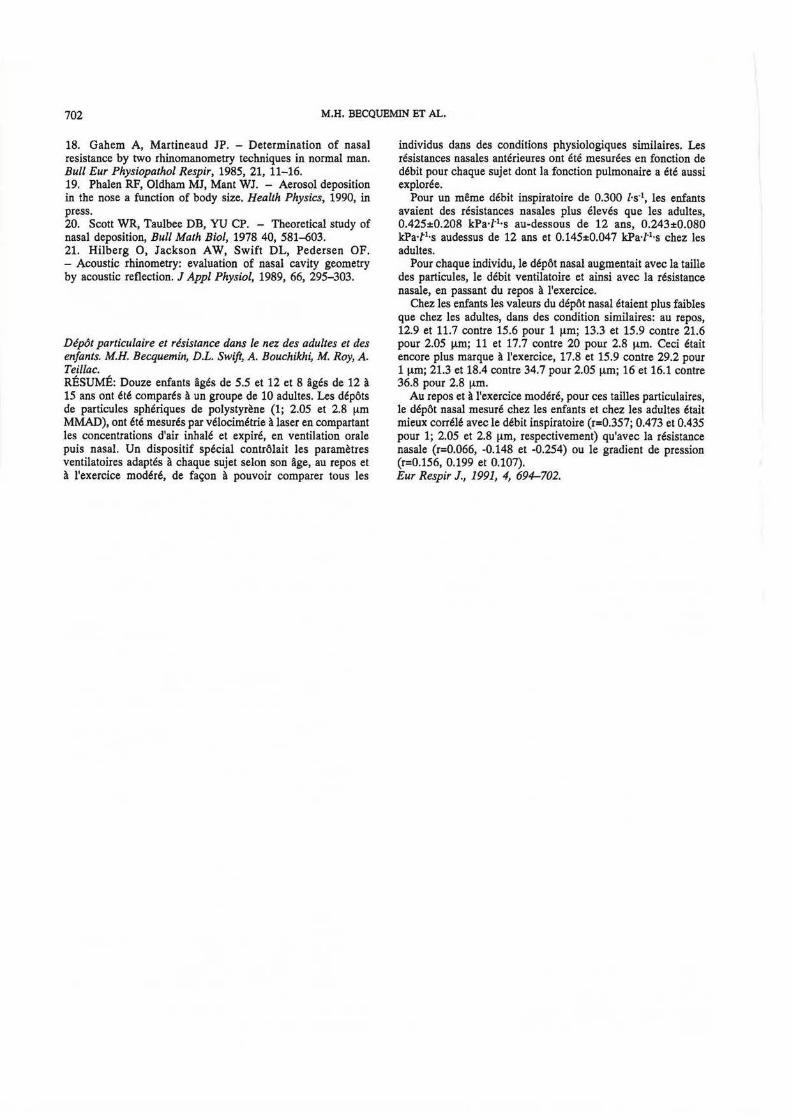
In children, the nasal resistance at a flow rate V = 0.300 l·s·1 decreased sharply with increasing age (fig. 2). At this flow rate, total resistances were: 1) in children under twelve, 0 .425±0.208 k Pa· /·'·s, with extreme values of 0.183 and 0. 794; 2) in children over twelve, 0.243±0.080 kPa·/·Ls, with extreme values of 0 .178 and 0.388; 3) in adults, 0.145±0.047 kPa·/·1·s, with extreme values of 0.065 and 0.219.
A predominant airflow in one of the nasal passages was observed in all of our subjects, and compared to the adults, the youngest children had a greater disequilibrium between the two unilateral resistances.
Unilateral reslstances
k Pa·l"1s
4
3
2
0
0 6.6
Total nasal reslstancea
0.90
0.75
0.60
0.45
0.30
0.15
0.00
0.00 6.6
I
13 20 26 33
Ageyrs
0
13 20 26 33
Age yra
Fig. 2. - Individual, unilateral resistances for the higher (.---I) and the lower (.:lr-A) flow rate and total nasal resistances at 0.3/·s·1 versus age.
PARTICLE DEPOSITION IN THE NOSE 699
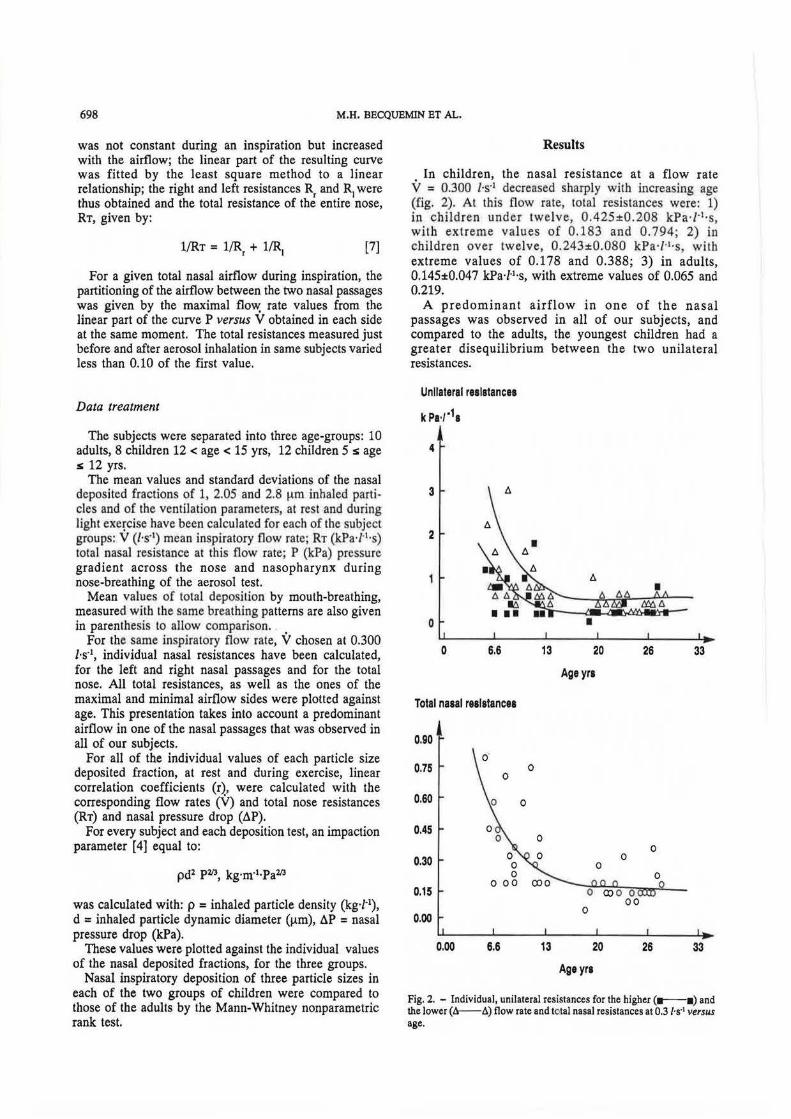
Table 2. -Particle nasal deposition in the three subject groups with corresponding measured flow rate and calculated nasal resistance and pressure drop
Resting ventilation Moderate exercising ventilation
10 adults 8 children 12 children 10 adults 8 children 12 children age 011:12 yrs age <12 yrs age 011:12 yrs age <12 yrs
Mean inspiratory M: flow rate /·s·1 0.455 0.309 0.284 1.057 0.522 0.466 so 0.222 0.084 0.130 0.389 0.167 0.155 Range 0.239-1.047 0.174--0.405 0.10()....(1.583 0.625-1.830 0.23()....(1.800 0.206-0.663
Total resistance kPa·/·1·s M 0.169 0.331 0.348 0.269 0.471 0.484
so 0.06 0.151 0.262 0.078 0.168 0.435 Range 0.101-0.326 0.194--0.645 0.102-1.10 0.176-0.440 0.261-0.701 0.114-1.73
Pressure drop M kPa 0.088 0.101 0.105 0.303 0.238 0.256 so 0.092 0.055 0.115 0.208 0.121 0.306
Percentage Range 0.028-0.341 0.056-0.202 0.012-0.449 0.125-0.805 0.135-0.455 0.076-1.097 nasal deposition of inhaled aerosols
1 t-tm M: 15.6 (20.4) 11.7 (15.3) 12.9 (20.7) 29.2 (29.7) 15.9 (17.2) 17.8 (14.5) so 9.7 6.1 6.1 12.3 7.1 8.4 B_ange 3.7-35.6 4.6-15 3.4-23.2 13.2-58.3 7.~29 6.7-33.7
20.5 t-tm M 21.6 (37.5) 15.9 (28.7) 13.3 (36.8) 34.7 (48.3) 18.4 (36) 21.3 (32.6) so 10.9 11.1 6.2 11.1 8.6 5.7 !!_ange 7.2-40.1 3-23.5 2.3-24.5 19-52.7 8.1-32.8 12.1-30.6
2.8 t-tm M 20 (52.1) 17.7 (41.4) 11.0 (46.3) 36.8 (67.6) 16.1 (48) 16.0 (47) so 11.1 12.7 5.3 10.4 8.6 6.2 Range 4.1-39.1 3.2-26.5 1-20.6 21-50.6 3.3-28 5.4-24.4
( ): mean percentage total deposition values of inhaled aerosols by mouth-breathing; M: mean; so: standard deviation.
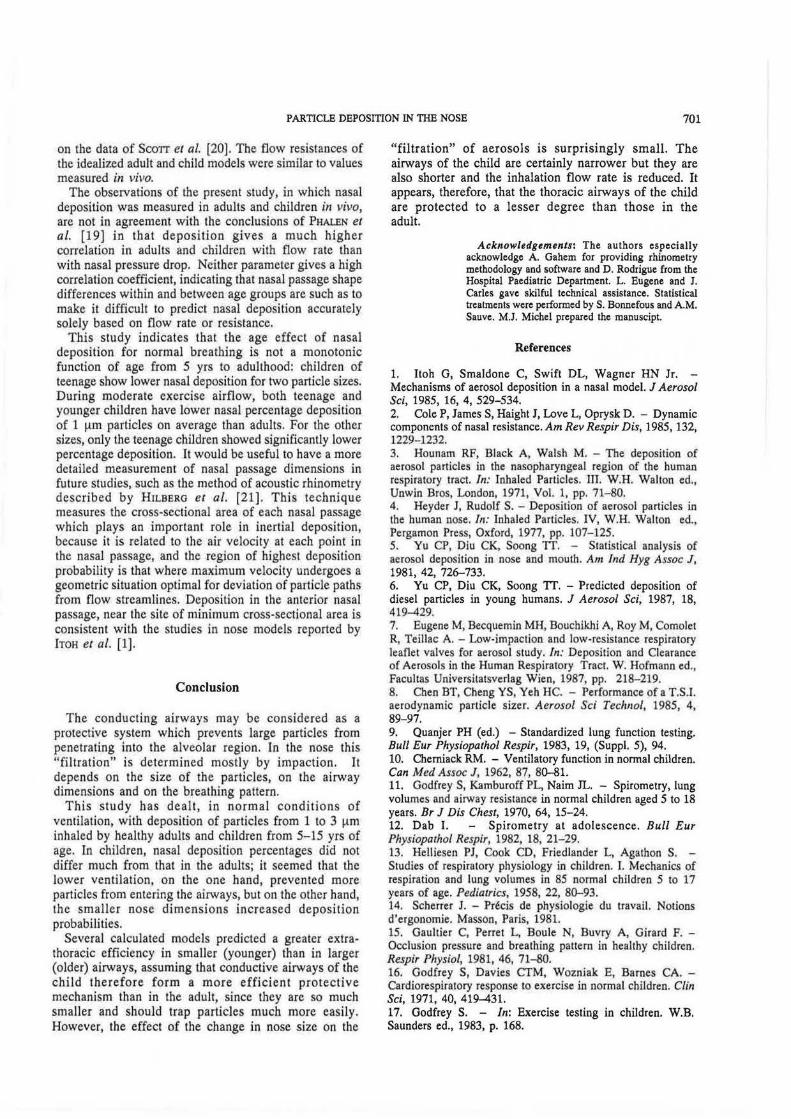
For the three particle sizes studied, the observed nasal deposition data were clearly lower in children of both groups than in adults (table 2). This difference was statistically significant (fig. 3) at rest for 2.05 and 2.8 ~-tm in the younger children (p<O.OS) and even more during exercise for the three sizes (0.001 < p<O.OS). This observation was less clear for the older children (p<O.Ol for 1 ~-tm during exercise only).
In any event, the deposition data were very dispersed, probably because controlled breathing was not exactly tolerated by each subject and errors on breathing patterns induced uncertainties on deposition data; this made it difficult to interpret directly the data in terms of group relationships between deposition and flow rates, resistances and pressure drops. It seemed better to correlate the individually observed deposition to its own respiratory parameters (table 3), as described below.
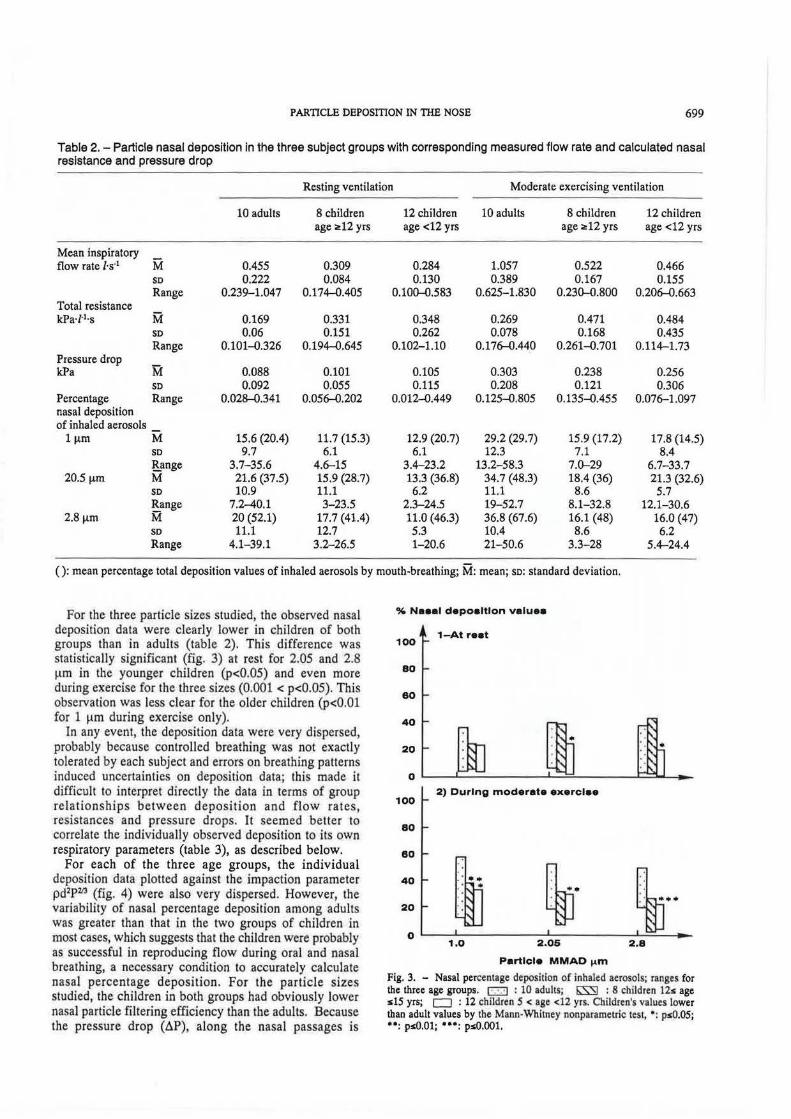
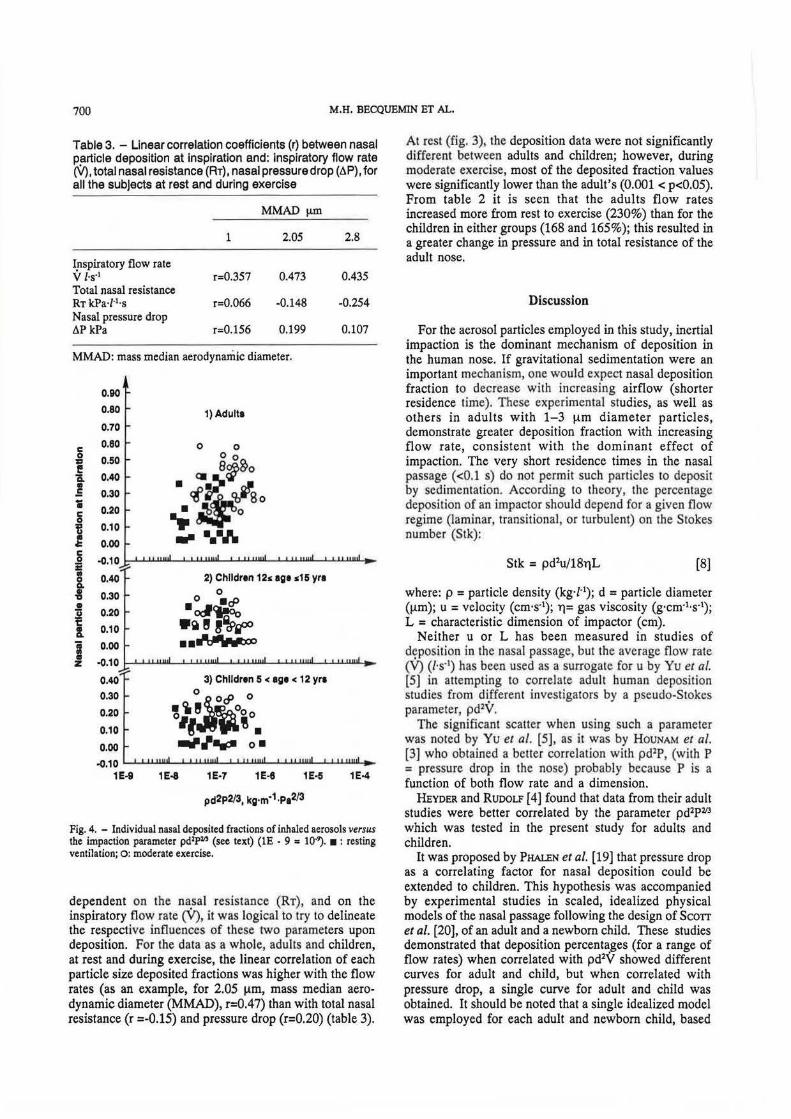
For each of the three age groups, the individual deposition data plotted against the impaction parameter pd2P213 (fig. 4) were also very dispersed. However, the variability of nasal percentage deposition among adults was greater than that in the two groups of children in most cases, which suggests that the children were probably as successful in reproducing flow during oral and nasal breathing, a necessary condition to accurately calculate nasal percentage deposition. For the particle sizes studied, the children in both groups had obviously lower nasal particle filtering efficiency than the adults. Because the pressure drop (~P), along the nasal passages is
% Neeal depoaltlon veluea
100 1-At reet
80
60
100 2) During moderate exerclee
80
60
40
20 ~· ~·· 0 ~--~----------~----------~=--4--
1.0 2.05 2.8
Particle MMAD 1-4m
Fig. 3. - Nasal percentage deposition of inhaled aerosols; ranges for the three age groups. [::::;:) : 10 adults; liSS) : 8 children lls age sl5 yrs; CJ : 12 children 5 < age <12 yrs. Child.ren's values lower than adult values by the Mann-Wbitney nonparametric test, •: ps0.05; ••: psO.Ol; • .. : psO.OOl.
700 M.H. BECQUEMIN ET AL.
Table 3. - Linear correlation coefficients (r) between nasal particle deposition at inspiration and: inspiratory flow rate ('il) I total nasal resistance (Rr) I nasal pressure drop (~ P) I for all the subjects at rest and during exercise
MMAD !!ID
1 2.05 2.8
Ipspiratory flow rate V l·s·1 r=0.357 0.473 0.435 Total nasal resistance RT kPa·l"'·s r=0.066 -0.148 -0.254 Nasal pressure drop ~PkPa r=0.156 0.199 0.107
MMAD: mass median aerodynamic diameter.
0.90
0.80 1) Adulta 0.70
& 0.80 0 0
0.50 0 0
~ 0.40 Ql 8~~0 a
·~~So 1 0.30 • 0.20 • ~ 0 g ....... ~ 0.10
~ 0.00 ... ~ • 0.40 2) Children 12" age "15 yra
f 0.30 0
• ·':J~ ~ 0.20
t 0.10 .Q 8 ~%)gx>
) 0.00 •• ~ ..... lOO
z -o.10
0.40 3) Children 5 < ege < 12 yra
0 .30 0 0
0.20 '!~~oo 0.10 '~ ~. 0.00 -,#/"riJJ o•
-o.10 1E-9 1E-8 1E-7 1E-8 1E-5 1E-4
Fig. 4. - Individual nasal deposited fractions of inhaled aerosols versus the impaction parameter pdlP., (see text) (lE - 9 = 10·9). • : resting ventilation; o: moderate exercise.
dependent on the nasal res istance (RT), and on the inspiratory flow rate (V), it was logical to try to delineate the respective influences of these two parameters upon deposition. For the data as a whole, adults and children, at rest and during exercise, the linear correlation of each particle size deposited fractions was higher with the flow rates (as an example, for 2.05 Jlm, mass median aerodynamic diameter (MMAD), r=0.47) than with total nasal resistance (r =-0.15) and pressure drop (r=0.20) (table 3).
At rest (fig. 3), the deposition data were not significantly different between adults and children; however, during moderate exercise, most of the deposited fraction values were significantly lower than the adult's (0.001 < p<0.05). From table 2 it is seen that the adults flow rates increased more from rest to exercise (230%) than for the children in either groups (168 and 165%); this resulted in a greater change in pressure and in total resistance of the adult nose.
Discussion
For the aerosol particles employed in this study, inertial impaction is the dominant mechanism of deposition in the human nose. If gravitational sedimentation were an important mechanism, one would expect nasal deposition fraction to decrease with increasing airflow (shorter residence time). These experimental studies, as well as others in adults with 1-3 (lm diameter particles, demonstrate greater deposition fraction with increasing flow rate, consistent with the dominant effect of impaction. The very short residence times in the nasal passage ( <0.1 s) do not permit such particles to deposit by sedimentation. According to theory, the percemage deposition of an impactor should depend for a given flow regime (laminar, transitional, or turbulent) on the Stokes number (Stk):
(8]
where: p = particle density (kg·l·1); d = particle diameter (Jlm); u =velocity (cm·s·1); Tl= gas viscosity (g·cm·t.s·1);
L = characteristic dimension of impactor (cm). Neither u or L has been measured in studies of
d~position in the nasal passage, butlhe average flow rate (V) (J.s·') has been used as a surrogate for u by Yu et al. [5] in attempting to correlate adult human deposition studies from different investigators by a pseudo-Stokes parameter, pd1V.
The significant scatter when using such a parameter was noted by Yu et al. [5], as it was by HoUNAM et al. [3] who obtained a better correlation with pd2P, (with P = pressure drop in the nose) probably because P is a function of both flow rate and a dimension.
lliYDER and Ruoou [ 4] found that data from their adult studies were better correlated by the parameter pd2P213
which was tested in the present study for adults and children.
It was proposed by PHALEN et al. (19] that pressure drop as a correlating factor for nasal deposition could be extended to children. This hypothesis was accompanied by experimental studies in scaled, idealized physical models of the nasal passage following the design of Scorr et al. (20], of an adult and a newborn child. These studies demonstrated that deposition percenta_ges (for a range of flow rates) when correlated with pd2V showed different curves for adult and child, but when correlated with pressure drop, a single curve for adult and child was obtained. It should be noted that a single idealized model was employed for each adult and newborn child, based
PARTICLE DEPOSmON IN THB NOSE 701
on the data of SCOTI et al. [20]. The flow resistances of the idealized adult and child models were similar to values measured in vivo.
The observations of the present study, in which nasal deposition was measured in adults and children in vivo, are not in agreement with the conclusions of PHALBN et al. [19] in that deposition gives a much higher correlation in adults and children with flow rate than with nasal pressure drop. Neither parameter gives a high correlation coefficient, indicating that nasal passage shape differences within and between age groups are such as to make it difficult to predict nasal deposition accurately solely based on flow rate or resistance.
Tbi s study indicates that the age effect of nasal deposition for normal breathing is not a monotonic function of age from 5 yrs to adulthood: children of teenage show lower nasal deposition for two particle sizes. During moderate exercise airflow, both teenage and younger children have lower nasal percentage deposition of 1 11m particles on average than adults. For the other sizes, only the teenage children showed significantly lower percentage deposition. It would be useful to have a more detailed measurement of nasal passage dimensions in future studies, such as the method of acoustic rhinometry described by H lLBERG et al. [21). This technique measures the cross-sectional area of each nasal passage which plays an important role in inertial deposition, because it is related to the air velocity at each point in the nasal passage, and the region of highest deposition probability is that where maximum velocity undergoes a geometric situation optimal for deviation of particle paths from flow streamlines. Deposition in the anterior nasal passage, near the site of minimum cross-sectional area is consistent with the studies in nose models reported by lToH er al. [1).
Conclusion
The conducting airways may be considered as a protective system which prevents large particles from penetrating into the alveolar region. In the nose this "filtration" is determined mostly by impaction. It depends on the size of the particles, on the airway dimensions and on the breathing pattern.
This study has dealt, in normal conditions of ventilation, with deposition of particles from 1 to 3 1-1m inhaled by healthy adults and children from 5-15 yrs of age. In children, nasal deposition percentages did not differ much from that in the adults; it seemed that the lower ventilation, on the one hand, prevented more particles from entering the airways, but on the other hand, the smaller nose dimensions increased deposition probabilities.
Several calculated models predicted a greater extrathoracic efficiency in smaUer (younger) than in larger (older) airways, assuming that conductive airways of the ch.ild therefore form a more efficient protective mechanism than in the adult, since they are so much smaller and should trap particles much more easily. However, the effect of the change in nose size on the
"filtration" of aerosols is surprisingly small. The airways of the child are certainly narrower but they are also shorter and the inhalation flow rate is reduced. It appears, therefore, that the thoracic airways of the child are protected to a lesser degree than those in the adult.
Acknowledgements: The authors especially acknowledge A. Gahem for providing rhinometry methodology and software and D. Rodrigue from the Hospital Paediatric Department. L. Eugene and J. Caries gave skilful technical assistance. Statistical treatments were performed by S. Bonnefous and A.M. Sauve. M.J. Michel prepared the manuscipt.
References
1. Itoh G, Smaldone C, Swift DL, Wagner HN Jr. -Mechanisms of aerosol deposition in a nasal model. J Aerosol Sci, 1985, 16, 4, 529-534. 2. Cole P, James S, Haight J, Love L, Oprysk D. - Dynamic components of nasal resistance. Am Rev Respir Dis, 1985, 132, 1229- 1232. 3. Hounam RF, Black A, Walsh M. - The deposition of aerosol particles in the nasopharyngeal region of the human respiratory tract. In: Inhaled Particles. ITI. W.H. Walton ed., Unwin Bros, London, 1971, VoL 1, pp. 71-80. 4. Heyder J, Rudolf S. - Deposition of aerosol particles in the human nose. In: Inhaled Particles. IV, W.H. Walton ed., Pergamon Press, Oxford, 1977, pp. 107-125. 5. Yu CP, Diu CK, Soong Tf. - Statistical analysis of aerosol deposilion in nose and mouth. Am lnd Hyg Assoc J, 1981, 42, 72Cr733. 6. Yu CP, Diu CK, Soong IT. - Predicted deposition of diesel particles in young humans. J Aerosol Sci, 1987, 18, 419~29. 7. Eugene M, Becquemin MH, Bouchlk.hi A, Roy M, Comolet R, Teillac A. - Low-impaction and low-resistance respiratory leaflet valves for aerosol study. In: Deposition and Clearance of Aerosols in the Human Respiratory Tract. W. Hofmann ed., Facultas Universitatsverlag Wien, 1987, pp. 218-219. 8. Chen BT, Cheng YS, Yeh HC. - Performance of a T.SJ. aerodynamic particle sizer. Aerosol Sci Teclrnol, 1985, 4, 89-97. 9. Quanjer PH (ed.) - Standardized lung function testing. Bull Eur Physiopathol Respir, 1983, 19, (Suppl. 5), 94. 10. Chemiack RM. - Ventilatory function in nonnal children. Can Med Assoc J, 1962, 87, 80--81. 11. Godfrey S, Kamburoff PL, Nairn JL. - Spirometry, lung volumes and airway resistance in normal children aged 5 to 18 years. Br J Dis Chest, 1970, 64, 15-24. 12. Dab I. - Spirometry at adolescence. Bull Eur Physioparhol Respir, 1982, 18, 21-29. 13. Hellieseo PJ, Cook CD, Friedlander L, Agathon S. -Studies of respiratory physiology in children. I. Mechanics of respiration and lung volumes in 85 nonnal children 5 to 17 years of age. Pedlarrics, 1958, 22, 80-93. 14. Scherrer J. - Pr~cis de physiologie du travail. Notions d'ergonomie. Masson, Paris, 1981. 15. Gaultier C, Perret L, Boule N, Buvry A, Girard F. -Occlusion pressure and breathing pattern in healthy children. Respir Physiol, 1981, 46, 71-80. 16. Godfrey S, Davies crM, Wozniak E, Barnes CA. -Cardiorespiratory response to exercise in normal children. Clin Sci, 1971, 40, 419-431. 17. Godfrey S. - In: Exercise testing in children. W.B. Saunders ed., 1983, p. 168.
702 M.H. BECQUEMIN ET AL.
18. Gahem A, Martineaud JP. - Determination of nasal resistance by two rhinomanometry techniques in normal man. Bull Eur Physiopathol Respir, 1985, 21, 11-16. 19. Phalen RF, Oldham MJ, Mant WJ. - Aerosol deposition in the nose a function of body size. Health Physics, 1990, in press. 20. Scott WR, Taulbee DB, YU CP. - Theoretical study of nasal deposition, Bull Math Bioi, 1978 40, 581-603. 21. Hilberg 0, Jackson AW, Swift DL, Pedersen OF. - Acoustic rhinometry: evaluation of nasal cavity geometry by acoustic reflection. J Appl Physiol, 1989, 66, 295-303.
De/}Ot particulaire et resistance dans le nez des adultes et des enfants. M.H. Becquemin, D.L. Swift, A. Bouchikh~ M. Roy, A. Teillac. RESUME: Douze enfants ag6s de 5.5 et 12 et 8 ag6s de 12 ~ 15 ans ont 6t6 compar6s ~ un groupe de 10 adultes. Les d6pots de particules spMriques de polystyr~ne (1; 2.05 et 2.8 ~-tm MMAD), ont 616 mesures par velocimetrie ~laser en compartant les concentrations d'air inhal6 et expire, en ventilation orale puis nasal. Un dispositif special contr<'llait les param~tres ventilatoires adaptes ~ chaque sujet selon son age, au repos et ~ l'exercice modere, de fa~on ~ pouvoir comparer tous les
individus dans des conditions physiologiques similaires. Les resistances nasales anterieures ont ete mesurees en fonction de d6bit pour chaque sujet dont la fonction pulmonaire a ete aussi exploree.
Pour un meme debit inspiratoire de 0.300 l·s·1, les enfants avaient des resistances nasales plus eleves que les adultes, 0.425±0.208 kPa·J·1·s au-dessous de 12 ans, 0.243±0.080 kPa·f1·s audessus de 12 ans et 0.145±0.047 kPa·L·1·s chez les adultes.
Pour chaque individu, le depot nasal augmentait avec la taille des particules, le debit ventilatoire et ainsi avec la resistance nasale, en passant du repos ~ l'exercice.
Chez les enfants les valeurs du depot nasal etaient plus faibles que chez les adultes, dans des condition similaires: au repos, 12.9 et 11.7 contre 15.6 pour 1 J.Lm; 13.3 et 15.9 contre 21.6 pour 2.05 ~-tm; 11 et 17.7 contre 20 pour 2.8 j.lffi. Ceci etait encore plus marque i\ l'exercice, 17.8 et 15.9 contre 29.2 pour 1J.Lm; 21.3 et 18.4 contre 34.7 pour 2.05 J.Lm; 16 et 16.1 contre 36.8 pour 2.8 J.Lm.
Au repos et ~ l'exercice modere, pour ces tallies particulaires, le depot nasal mesure chez les enfants et chez les adultes etait mieux correle avecle debit inspiratoire (r=0.357; 0.473 et 0.435 pour 1; 2.05 et 2.8 J.Lrn, respectivement) qu'avec la resistance nasale (r=0.066, -0.148 et ·0.254) ou le gradient de pression (r=0.156, 0.199 et 0.107). Eur Respir J., 1991, 4, 694-702.