Embed Size (px)
Citation preview

Part IV – Hypothesis Testing
Chapter 4
Statistics for Managers Using Microsoft Excel, 7e © 2014 Pearson Prentice-Hall, Inc. Philip A. Vaccaro , PhD
MGMT E-5070

Requirements
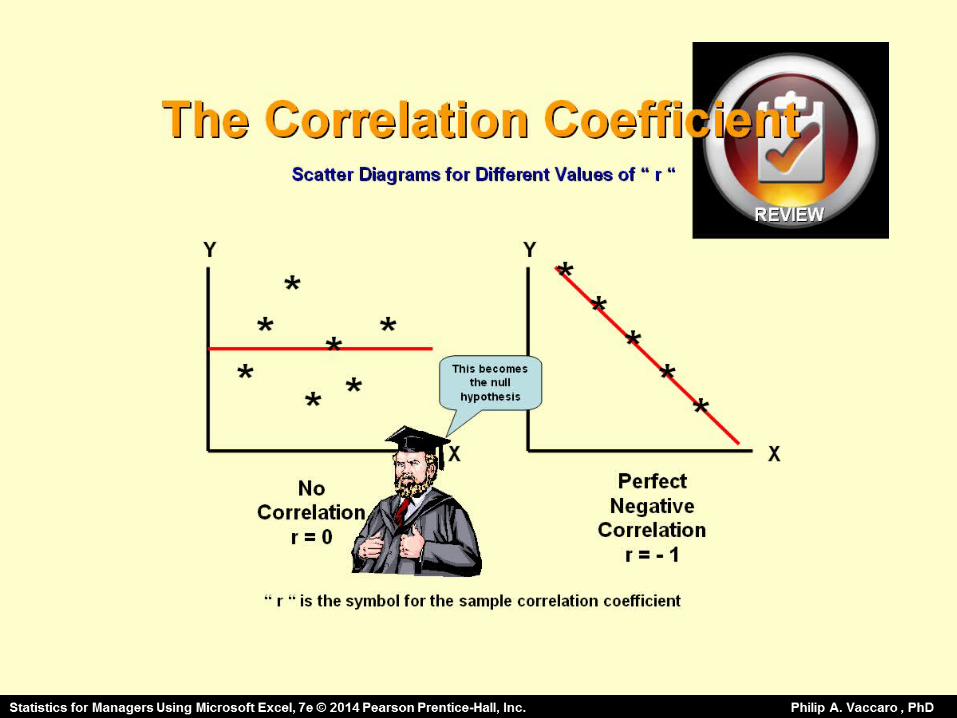
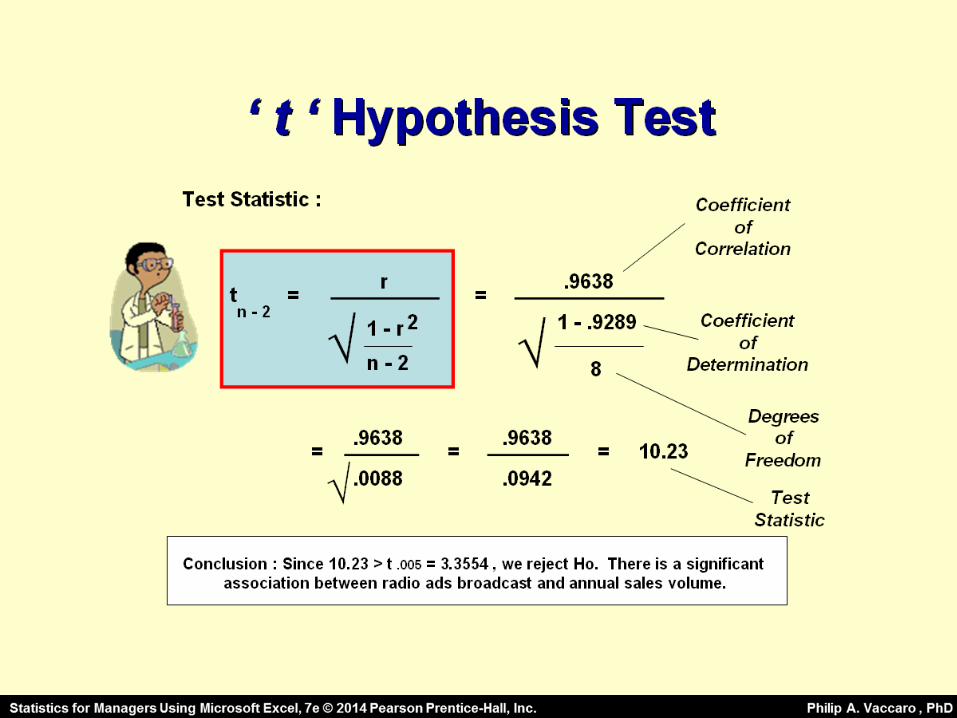
7. Compute the coefficient of correlation ( r ) .
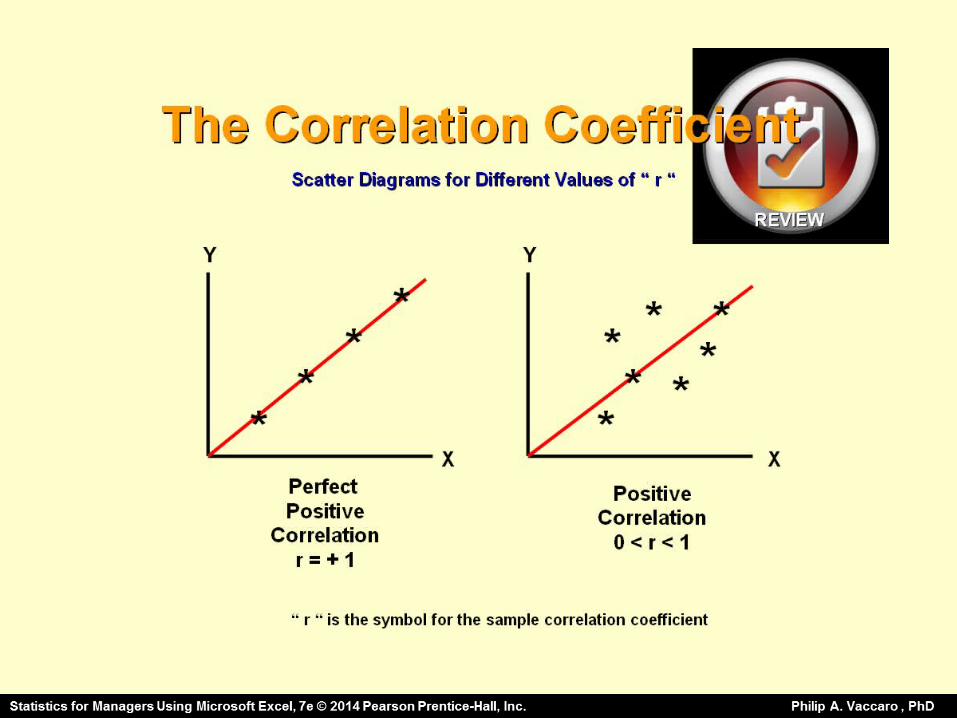
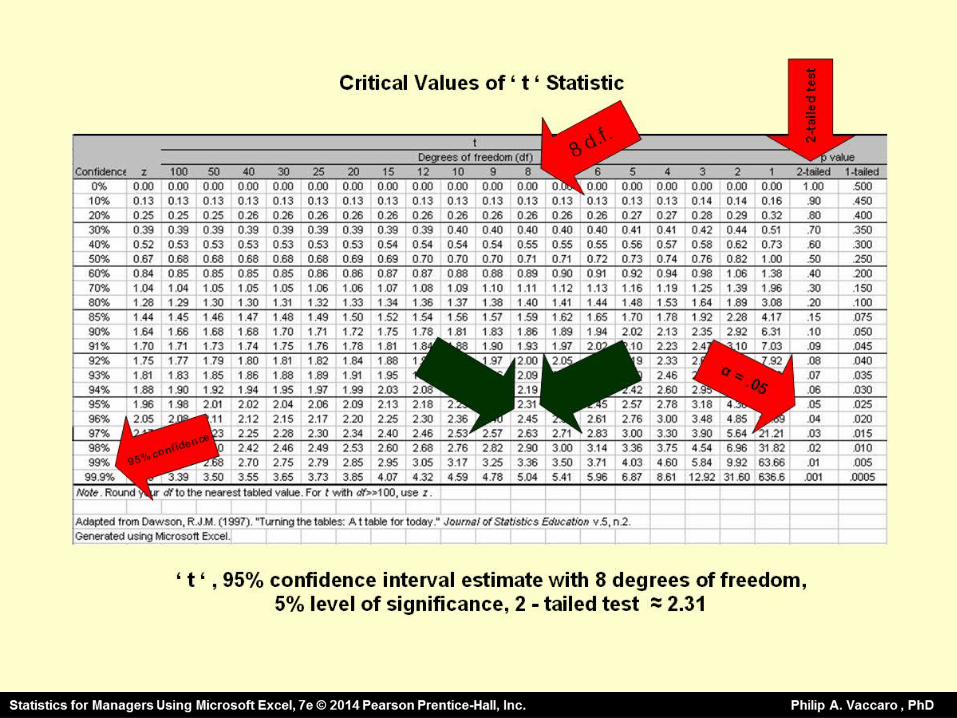
8. Set up a 95% and 99% confidence interval estimate of the average annual sales volume in a city in which eight ( 8 ) ads are broadcast daily.
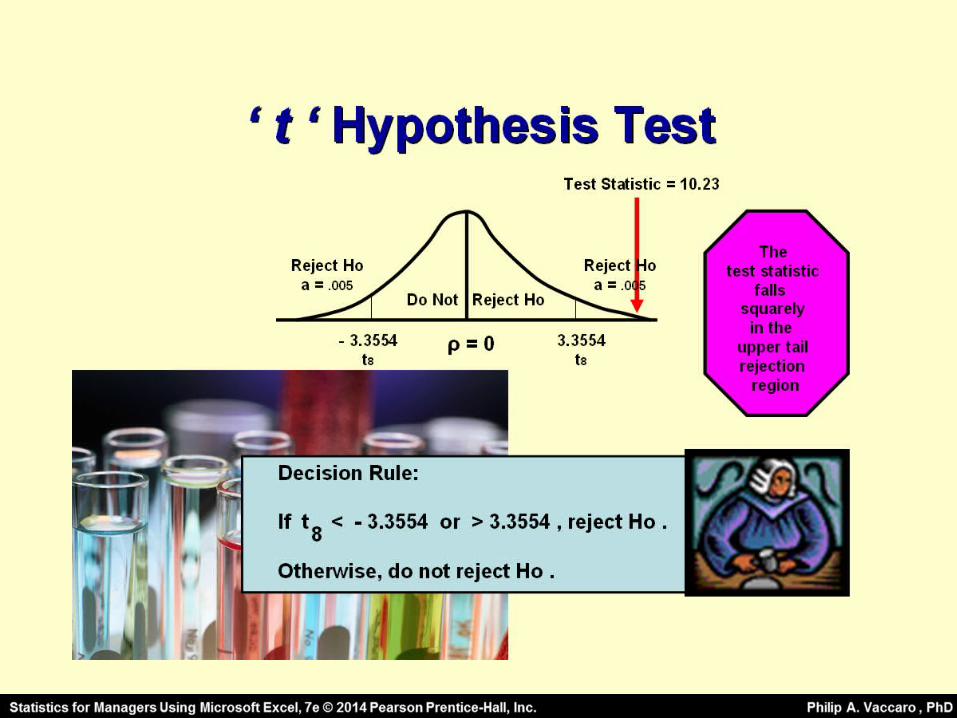
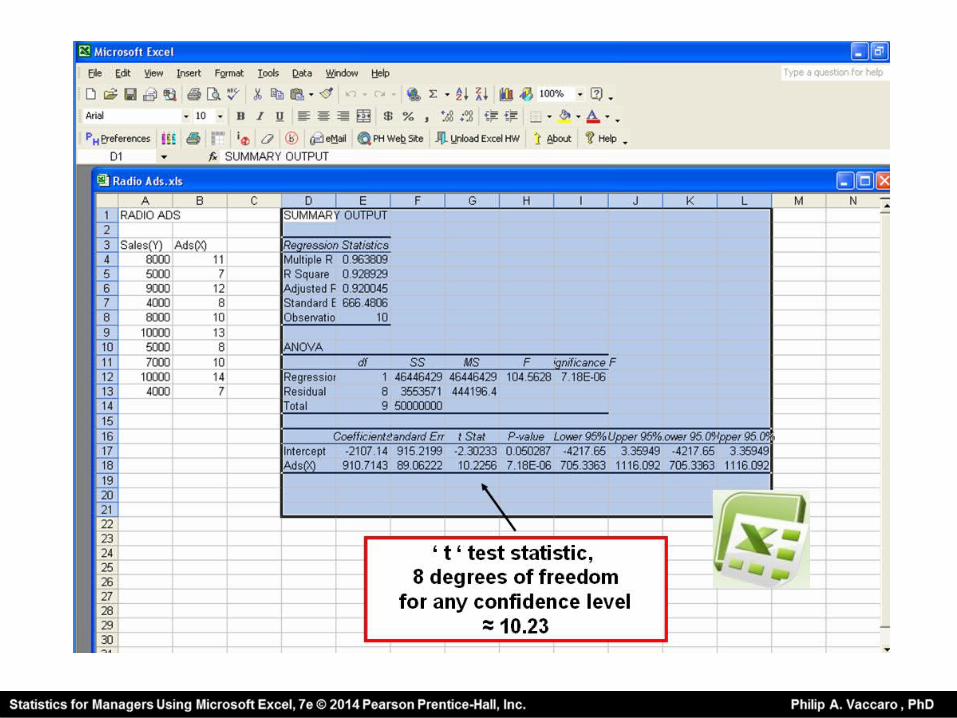
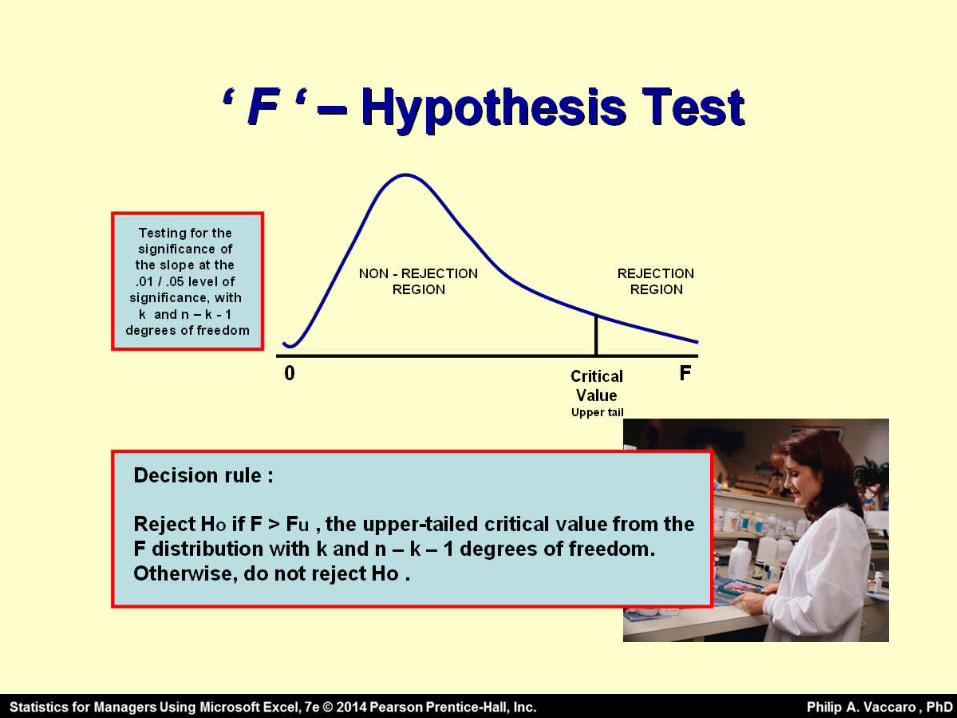
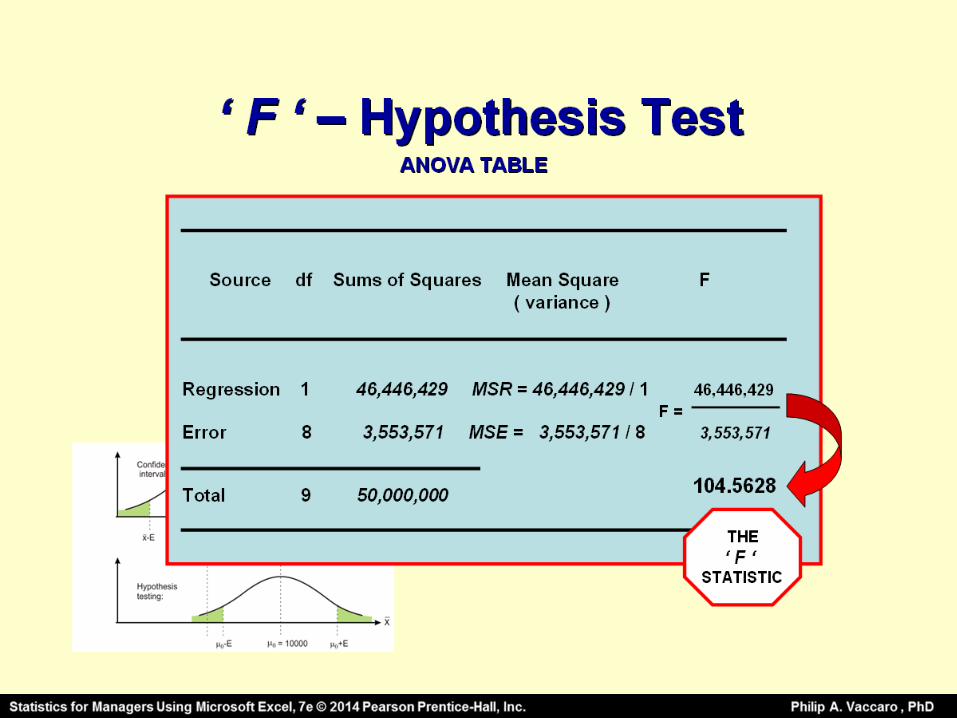
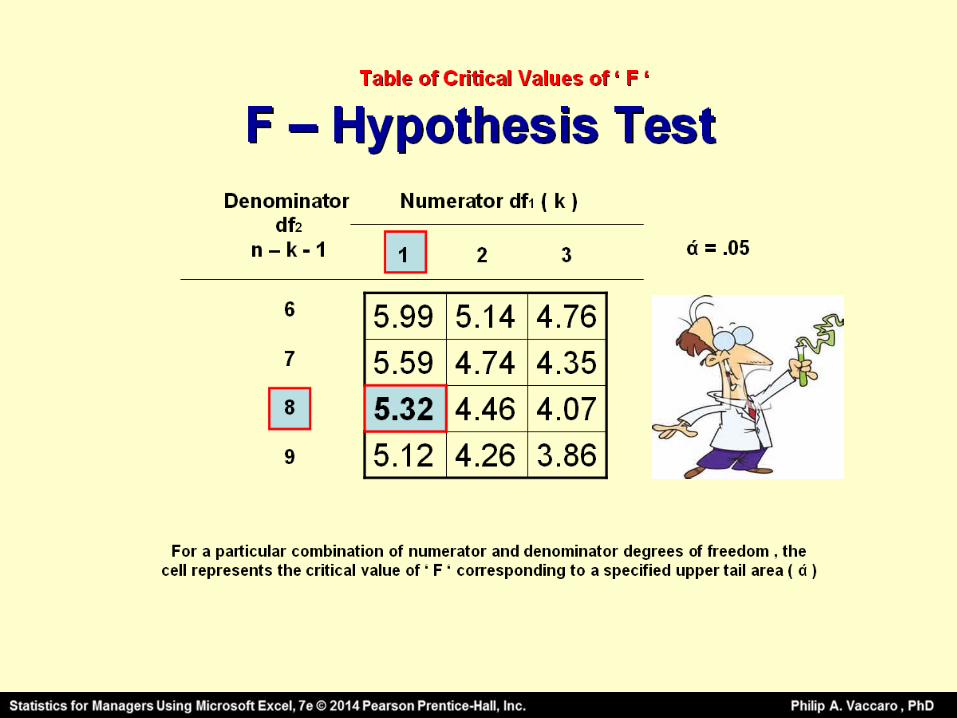
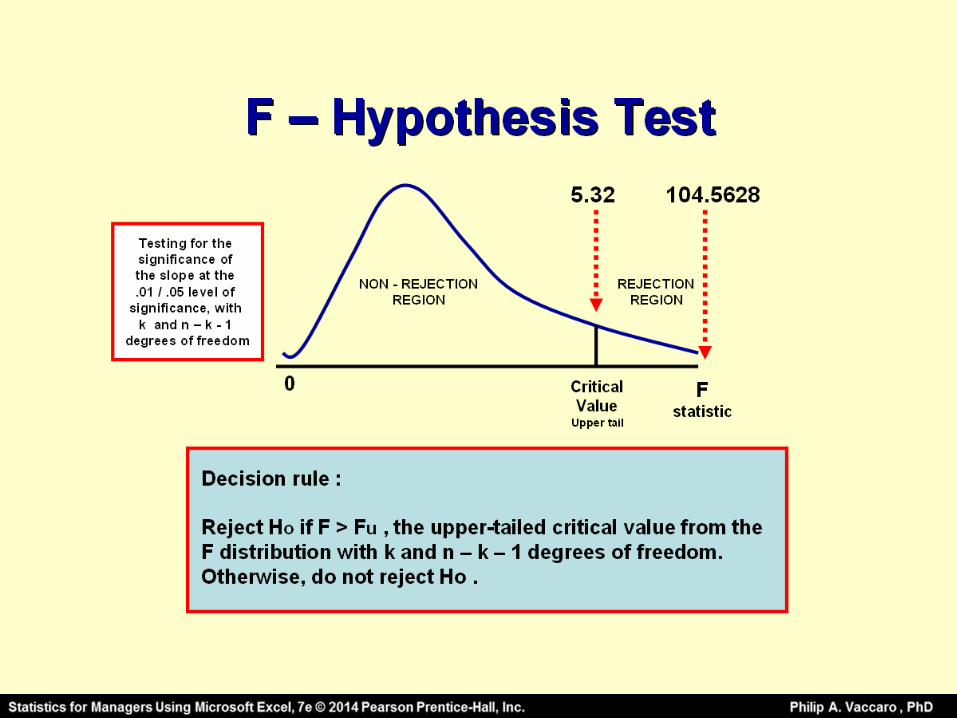
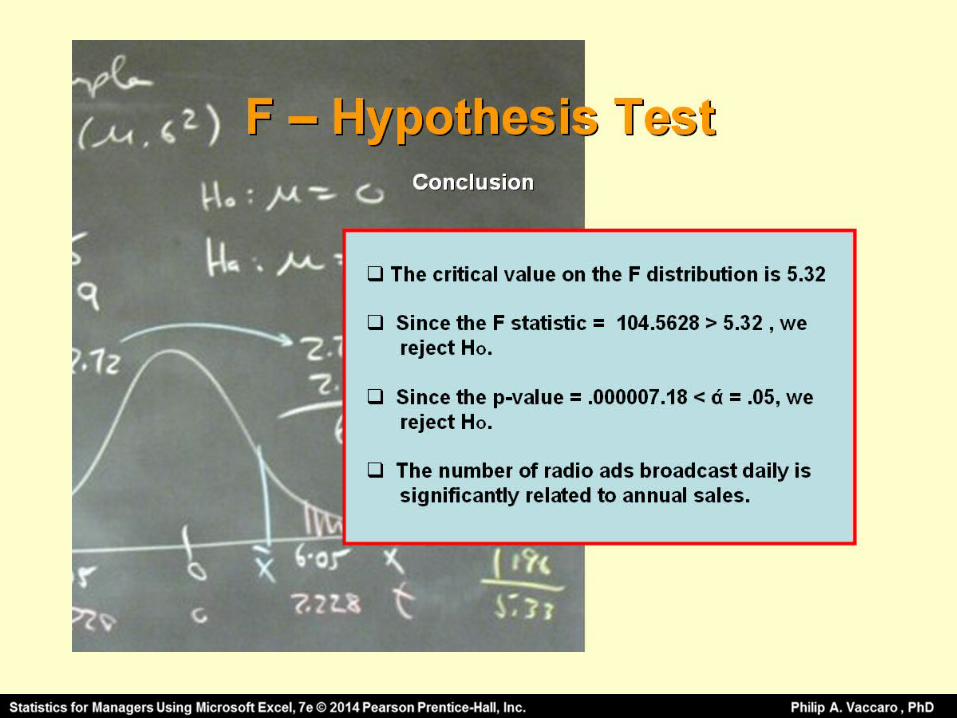
9. At the a = .01 and .05 level of significance, is there a relationship between sales volume and the number of radio ads broadcast?
10. Set up the 99% confidence interval estimate of the true slope.
11. Discuss why you should not predict annual sales volume in a city which has fewer than 7 broadcasts daily or more than 14 daily.


Hypothesis Testing: σ Known ,the ‘p’- Value Approach
The p-value is the probability of obtaining a test statistic equal to or more extreme ( < or > ) than the observed sample value given H0 is true Also called observed level of significance* Smallest value of for which H0 can be rejected
* Because we can reject or not reject Ho “at a glance“ .

Hypothesis Testing: σ Knownp-Value Approach
Convert Sample Statistic (ex. X) to Test Statistic (ex. ‘Z’ statistic or ‘t’ statistic )
Obtain the ‘p’-value from a table or by using Excel Compare the p-value with
If p-value < , reject H0
If p-value , do not reject H0
Hypothesis Testing: σ Knownp-Value Approach
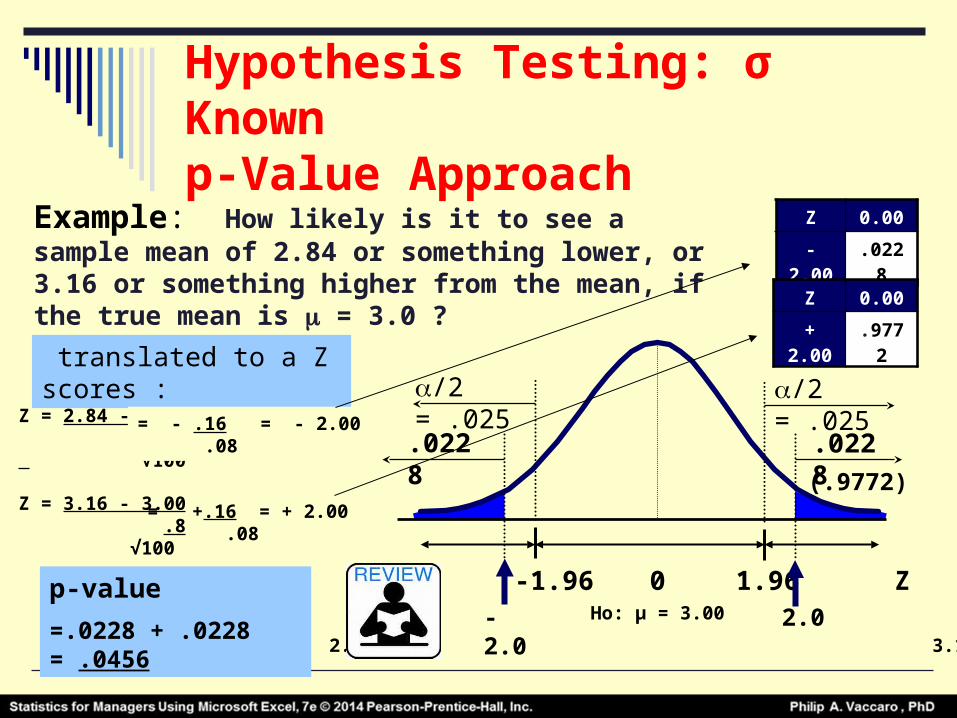
Example: How likely is it to see a sample mean of 2.84 or something lower, or 3.16 or something higher from the mean, if the true mean is = 3.0 ?
translated to a Z scores :
p-value
=.0228 + .0228 = .0456
.0228
/2 = .025
-1.96 0-2.0
Z1.962.0
.0228
/2 = .025
Z 0.00
- 2.00 .0228
Z 0.00
+ 2.00 .9772
Z = 2.84 - 3.00 .8 √100
= - .16 = - 2.00 .08
Z = 3.16 - 3.00 .8 √100
= +.16 = + 2.00 .08
Ho: μ = 3.00
2.84 3.16
(.9772)
Hypothesis Testing: σ Knownp-Value Approach
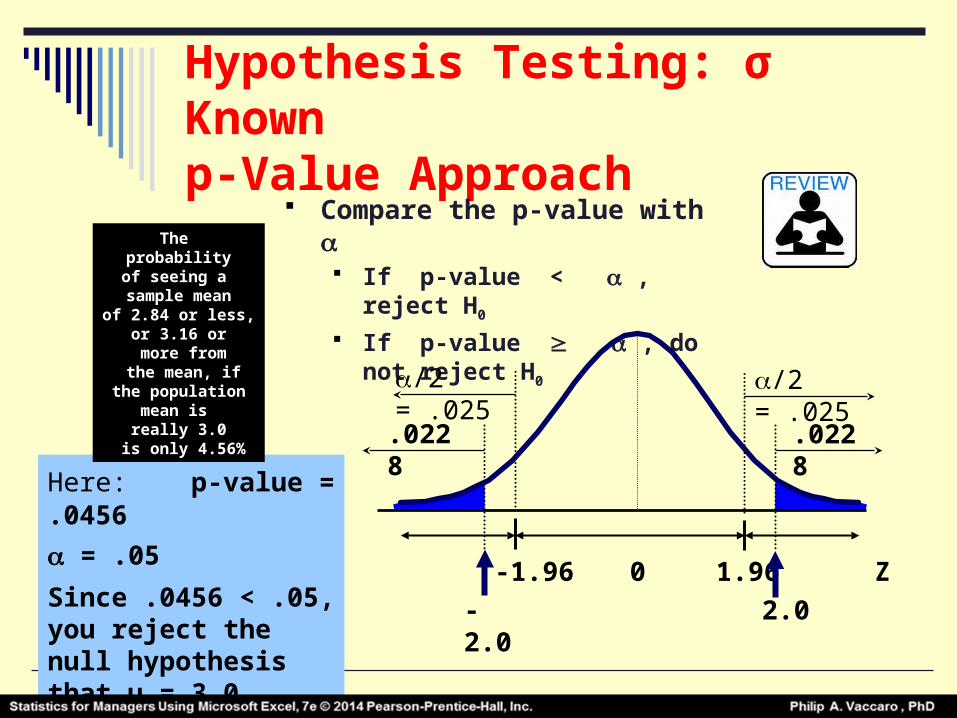
Compare the p-value with If p-value < , reject H0
If p-value , do not reject H0
Here: p-value = .0456 = .05
Since .0456 < .05, you reject the null hypothesis that μ = 3.0
.0228
/2 = .025
-1.96 0
-2.0
Z1.96
2.0
.0228
/2 = .025
The probabilityof seeing a
sample meanof 2.84 or less,
or 3.16 or more from
the mean, ifthe population
mean is really 3.0
is only 4.56%

Requirements
7. Compute the coefficient of correlation ( r ) .
8. Set up a 95% and 99% confidence interval estimate of the average annual sales volume in a city in which eight ( 8 ) ads are broadcast daily.
9. At the a = .01 and .05 level of significance, is there a relationship between sales volume and the number of radio ads broadcast?
10. Set up the 99% confidence interval estimate of the true slope.
11. Discuss why you should not predict annual sales volume in a city which has fewer than 7 broadcasts daily or more than 14 daily.


Part IV – Hypothesis Testing
Chapter 4
Statistics for Managers Using Microsoft Excel, 7e © 2014 Pearson Prentice-Hall, Inc. Philip A. Vaccaro , PhD
MGMT E-5070