Embed Size (px)
Citation preview

Part IITrading Relative Strength
End of Day
What you will learn in Part II
What will be covered:
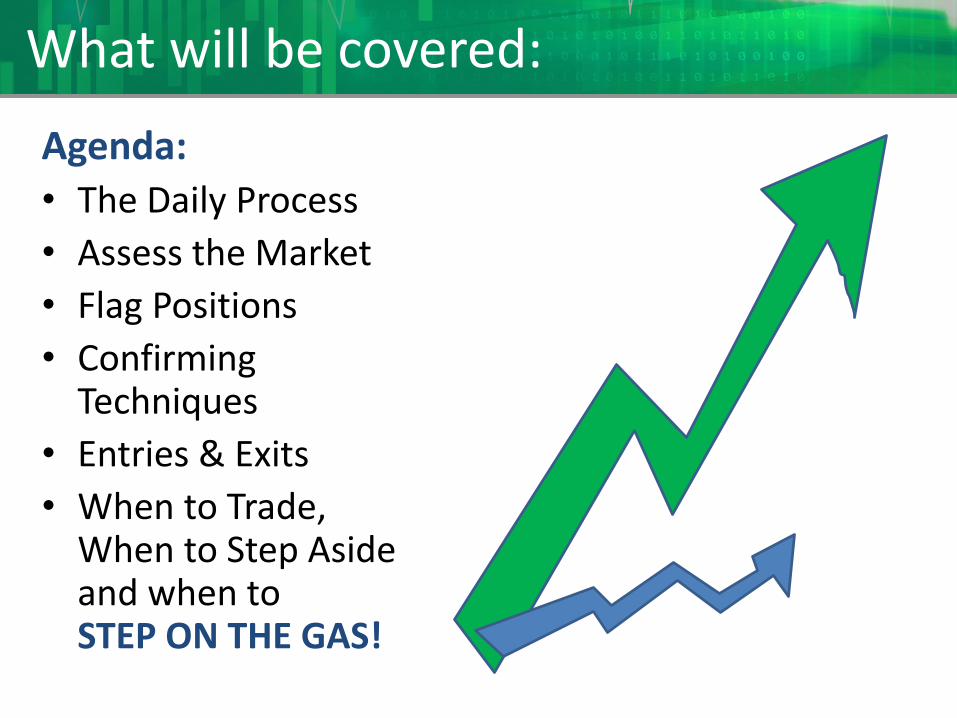
Agenda:
• The Daily Process
• Assess the Market
• Flag Positions
• Confirming Techniques
• Entries & Exits
• When to Trade, When to Step Aside and when to STEP ON THE GAS!
Preparations
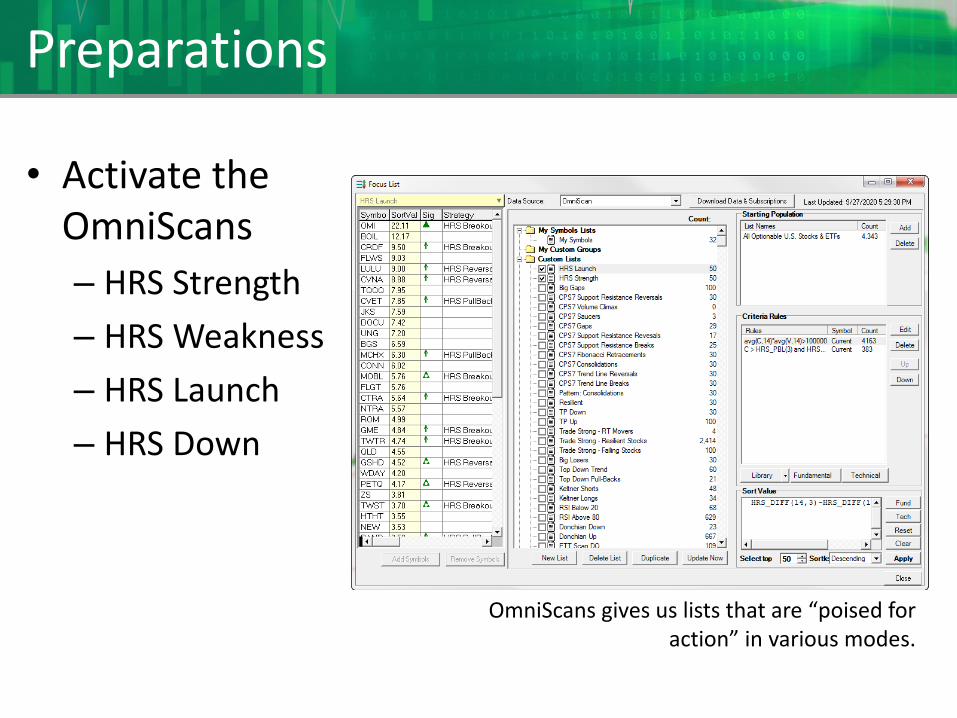
• Activate the OmniScans
– HRS Strength
– HRS Weakness
– HRS Launch
– HRS Down
OmniScans gives us lists that are “poised for action” in various modes.
The Daily Process
Automation Review
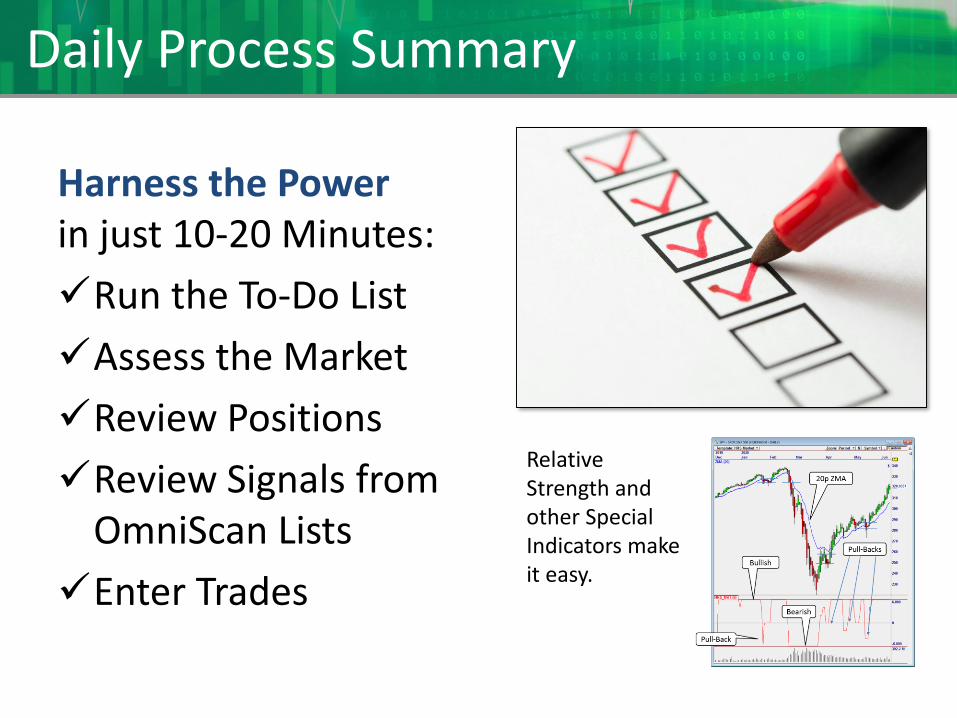
Daily Process Summary
Harness the Powerin just 10-20 Minutes:
✓Run the To-Do List
✓Assess the Market
✓Review Positions
✓Review Signals from OmniScan Lists
✓Enter Trades
Relative Strength and other Special Indicators make it easy.
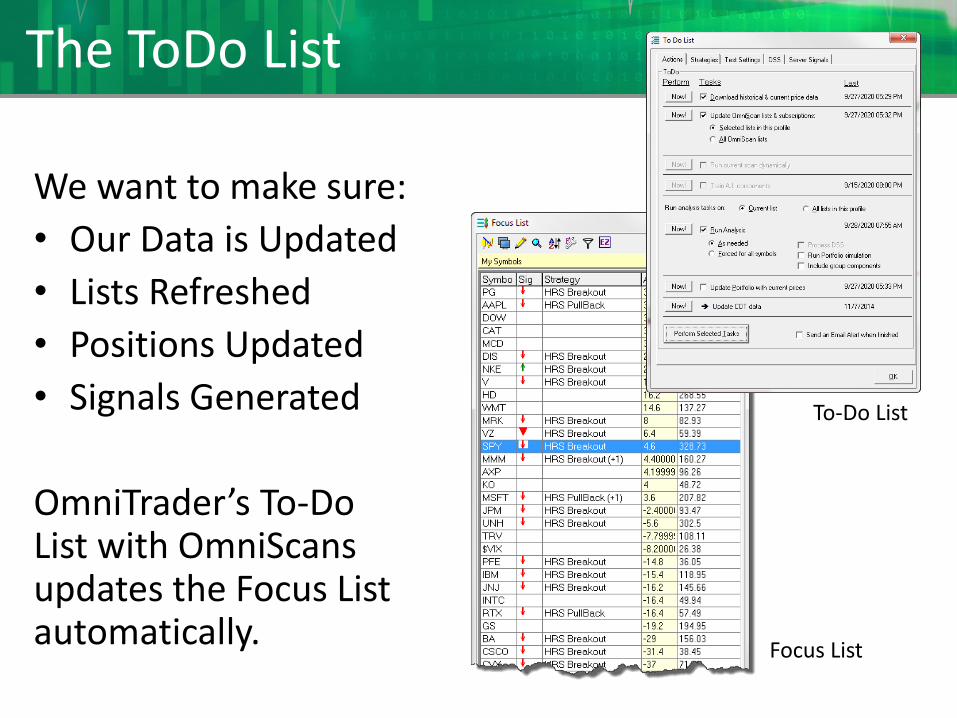
The ToDo List
We want to make sure:
• Our Data is Updated
• Lists Refreshed
• Positions Updated
• Signals Generated
OmniTrader’s To-Do List with OmniScans updates the Focus List automatically.
To-Do List
Focus List
Assess the Market
It’s All About Timing
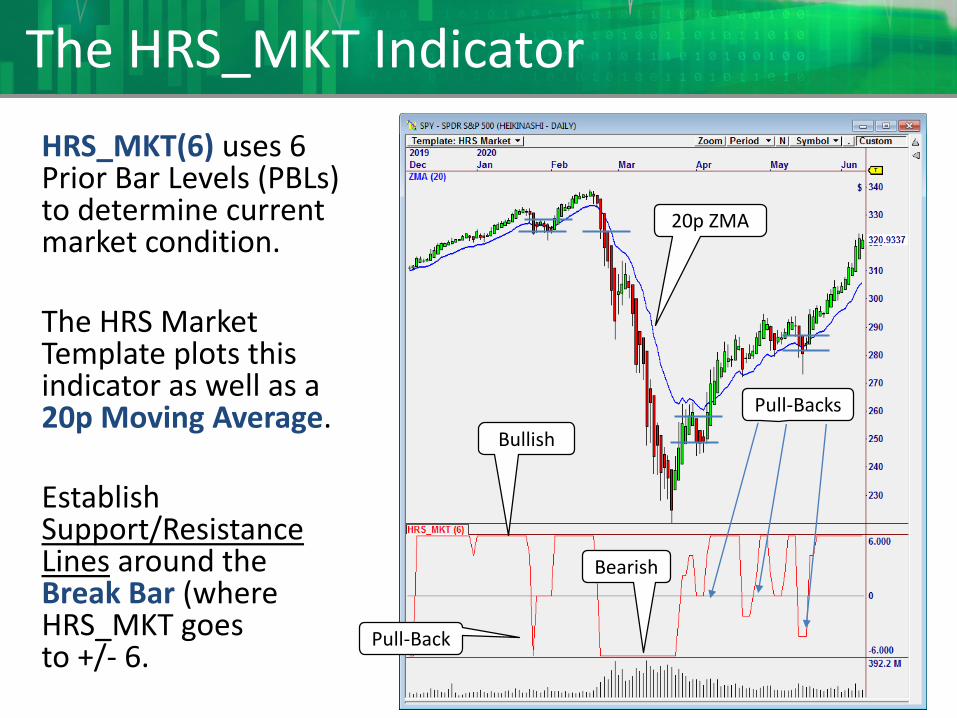
The HRS_MKT Indicator
HRS_MKT(6) uses 6 Prior Bar Levels (PBLs) to determine current market condition.
The HRS Market Template plots this indicator as well as a 20p Moving Average.
Establish Support/Resistance Lines around the Break Bar (where HRS_MKT goes to +/- 6.
Bullish
Bearish
20p ZMA
Pull-Backs
Pull-Back
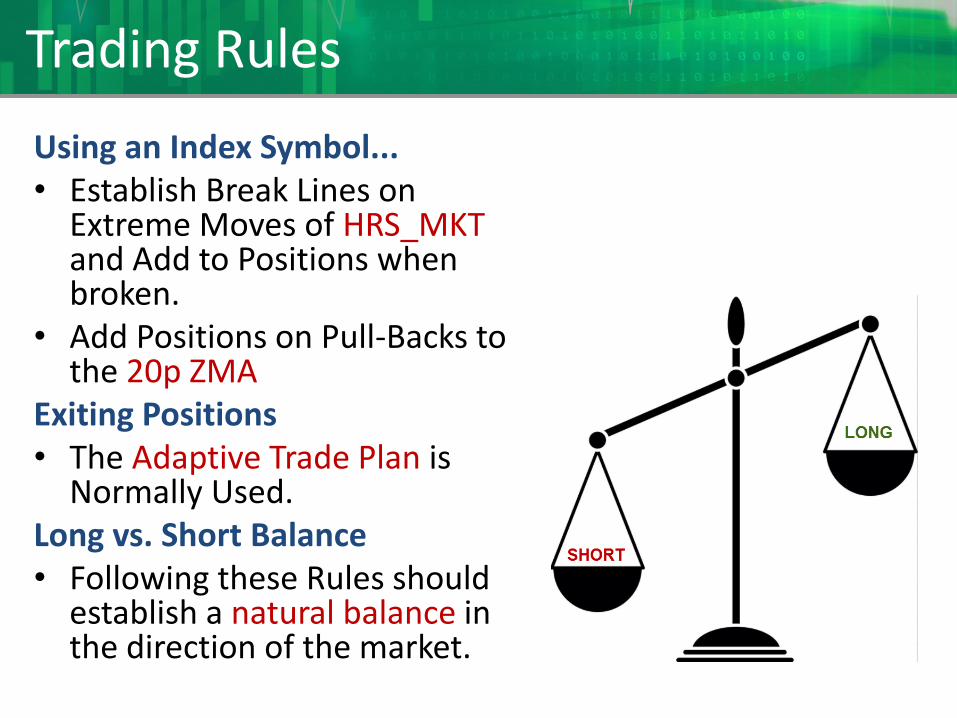
Trading Rules
Using an Index Symbol...• Establish Break Lines on
Extreme Moves of HRS_MKT and Add to Positions when broken.
• Add Positions on Pull-Backs to the 20p ZMA
Exiting Positions• The Adaptive Trade Plan is
Normally Used.Long vs. Short Balance• Following these Rules should
establish a natural balance in the direction of the market.

Flag Positions to Consider for Entry
Using the Right OmniScan
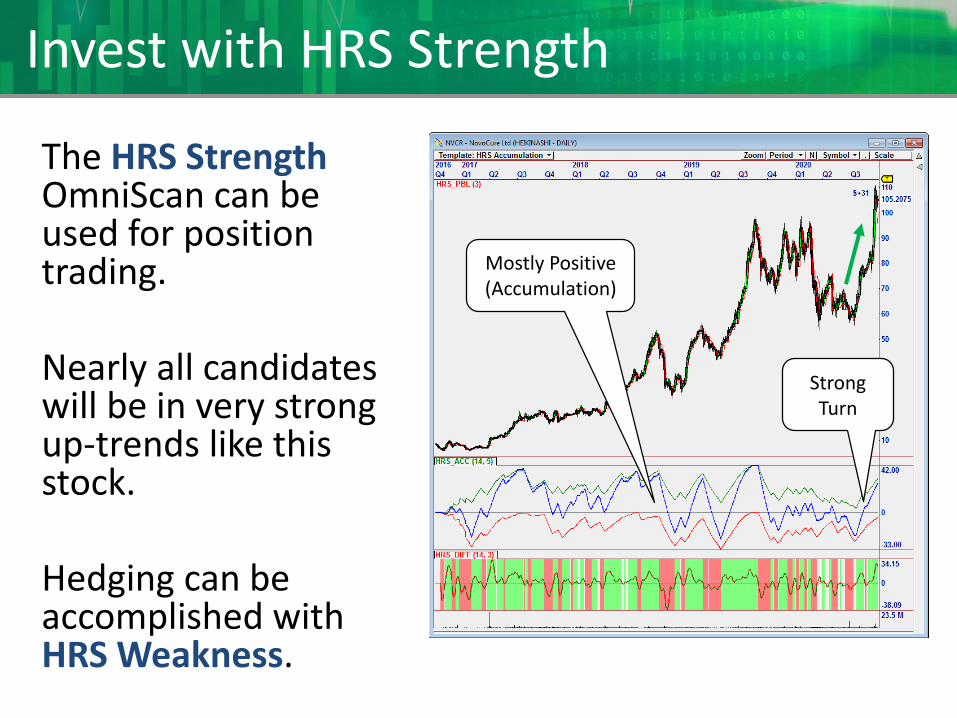
Invest with HRS Strength
The HRS Strength OmniScan can be used for position trading.
Nearly all candidates will be in very strong up-trends like this stock.
Hedging can be accomplished with HRS Weakness.
Strong Turn
Mostly Positive (Accumulation)
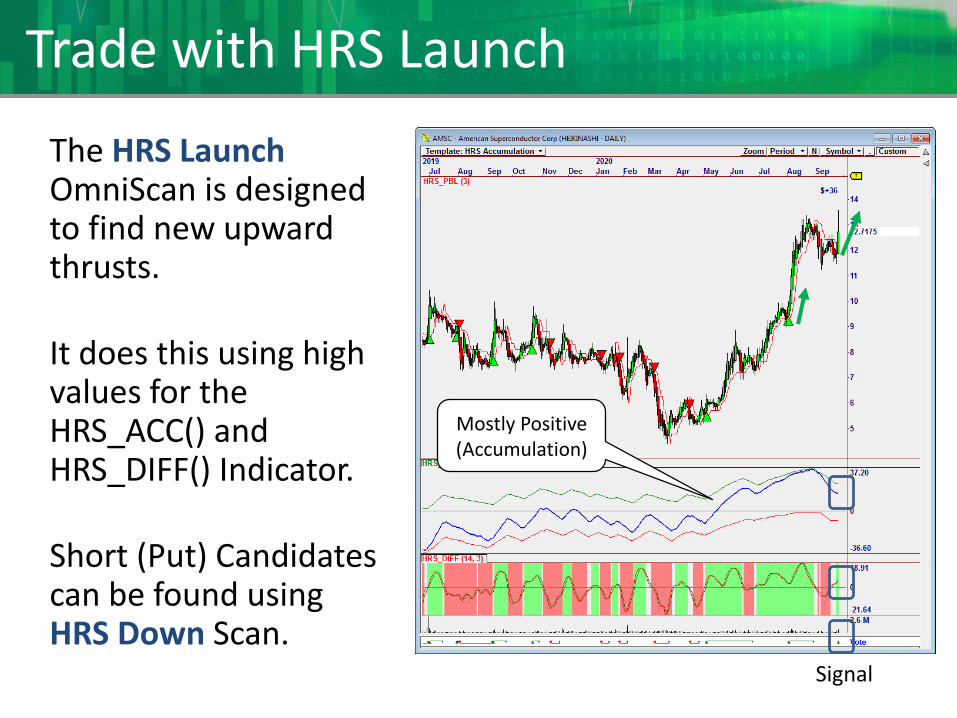
Trade with HRS Launch
The HRS Launch OmniScan is designed to find new upward thrusts.
It does this using high values for the HRS_ACC() and HRS_DIFF() Indicator.
Short (Put) Candidates can be found using HRS Down Scan.
Mostly Positive (Accumulation)
Signal
Confirm the Signals
Increase Your Accuracy
Confirmation
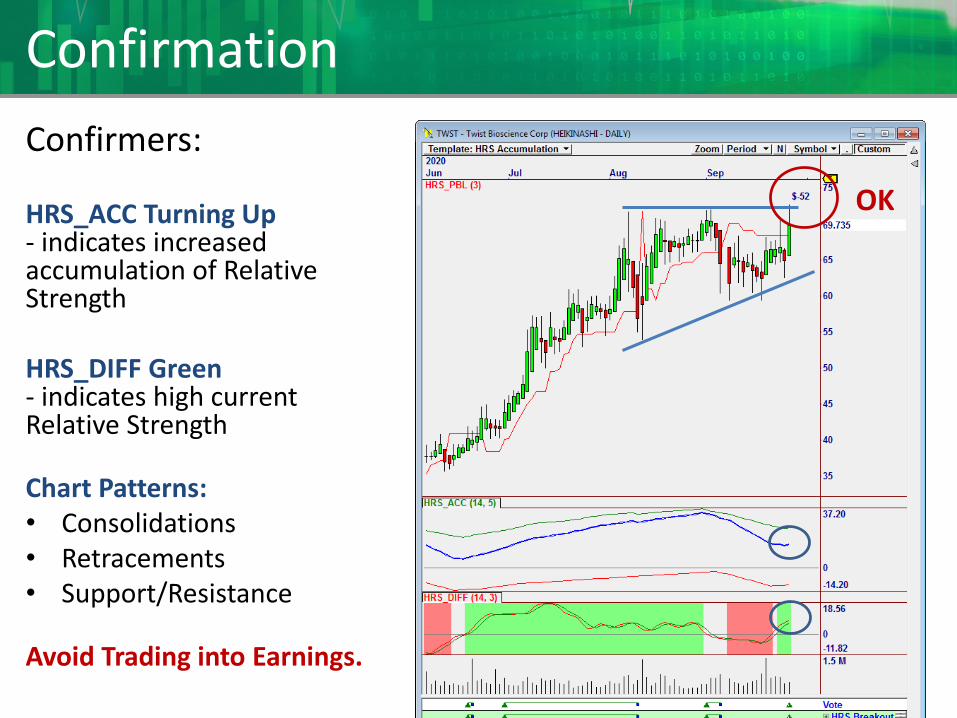
Confirmers:
HRS_ACC Turning Up - indicates increased accumulation of Relative Strength
HRS_DIFF Green - indicates high current Relative Strength
Chart Patterns:• Consolidations• Retracements• Support/Resistance
Avoid Trading into Earnings.
OK

Enter/Exit Trades:MOC or MOO?
Getting a Jump on the Market
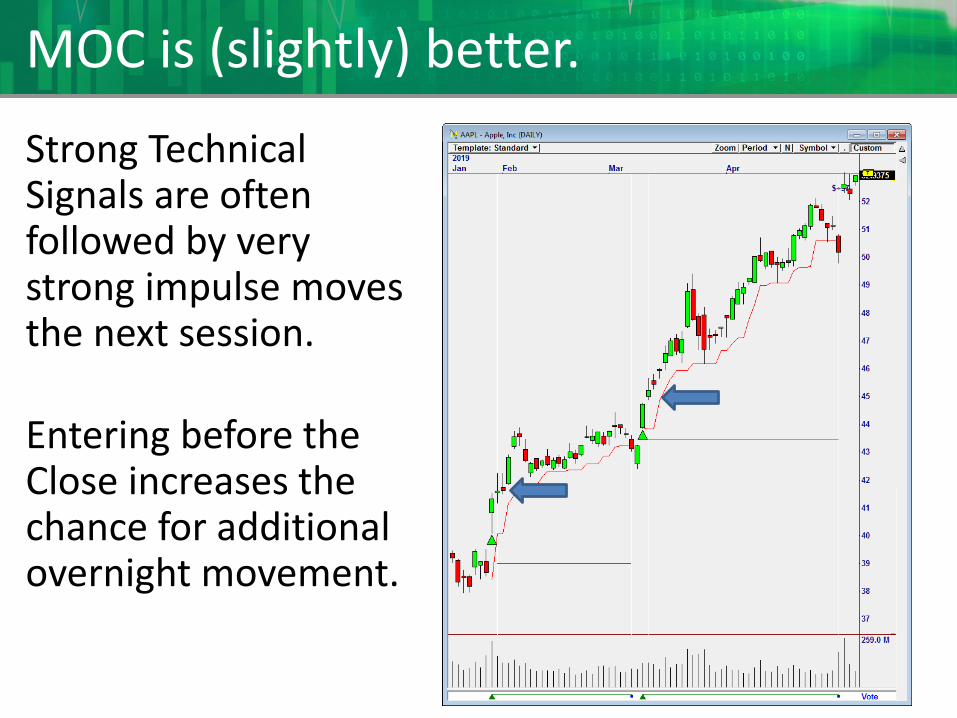
MOC is (slightly) better.
Strong Technical Signals are often followed by very strong impulse moves the next session.
Entering before the Close increases the chance for additional overnight movement.
When to Stop Trading.When to Step on the Gas!
Timing our Actions with Relative Strength
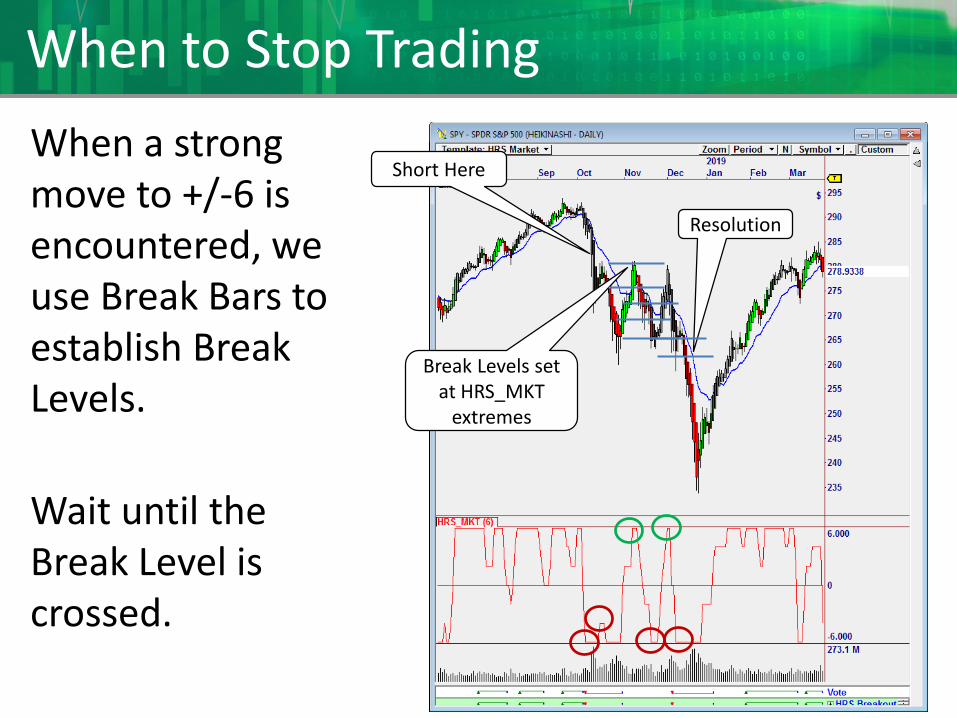
When to Stop Trading
When a strong move to +/-6 is encountered, we use Break Bars to establish Break Levels.
Wait until the Break Level is crossed.
Break Levels set at HRS_MKT
extremes
Resolution
Short Here
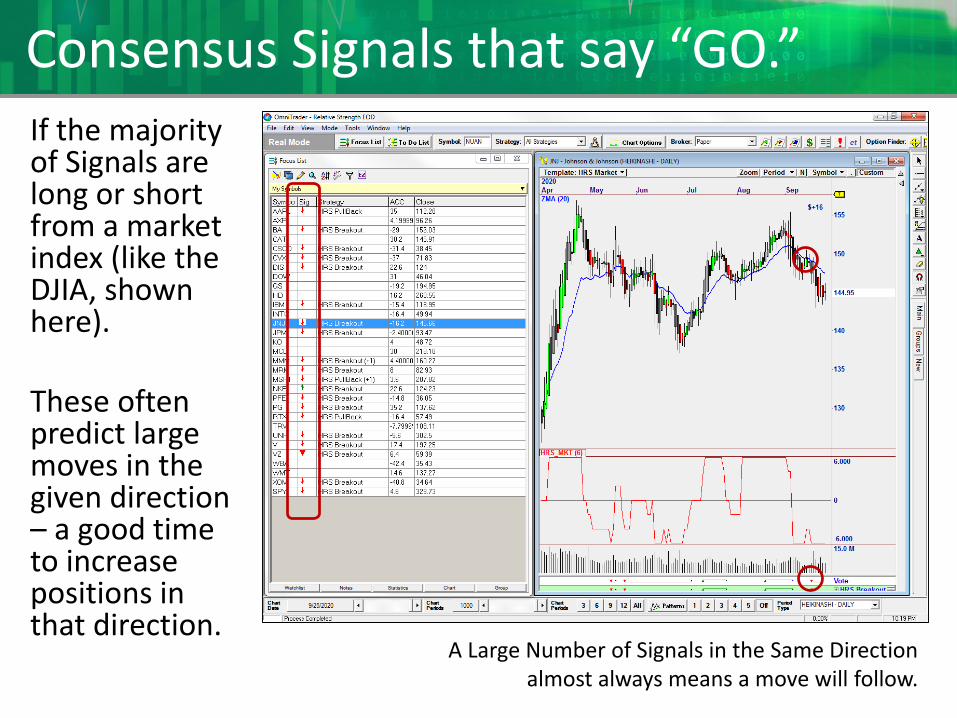
Consensus Signals that say “GO.”If the majority of Signals are long or short from a market index (like the DJIA, shown here).
These often predict large moves in the given direction – a good time to increase positions in that direction.
A Large Number of Signals in the Same Direction almost always means a move will follow.

What’s Next for“Harnessing the Power?”
A Preview of Part III
What’s Next
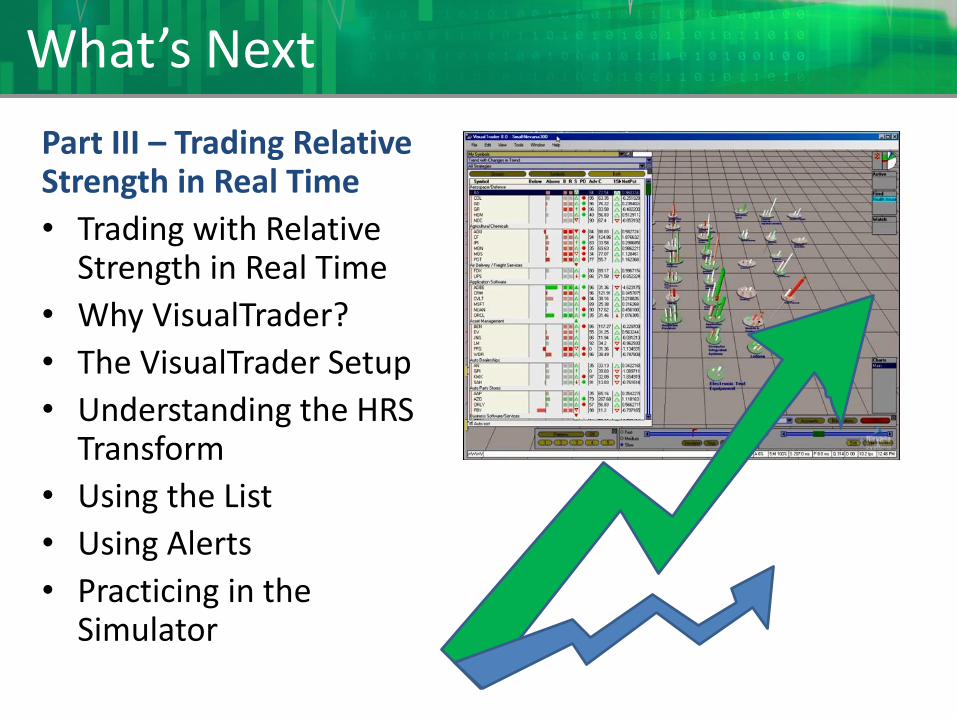
Part III – Trading Relative Strength in Real Time
• Trading with Relative Strength in Real Time
• Why VisualTrader?
• The VisualTrader Setup
• Understanding the HRS Transform
• Using the List
• Using Alerts
• Practicing in the Simulator