Embed Size (px)
Citation preview
Part F. Chapter 6. All-cause Mortality, Cardiovascular Mortality, and Incident Cardiovascular Disease
2018 Physical Activity Guidelines Advisory Committee Scientific Report F6-1
PART F. CHAPTER 6. ALL-CAUSE MORTALITY,
CARDIOVASCULAR MORTALITY, AND INCIDENT
CARDIOVASCULAR DISEASE
Table of Contents Introduction ............................................................................................................................................. F6-1
Review of the Science .............................................................................................................................. F6-2
Overview of Questions Addressed ....................................................................................................... F6-2
Data Sources and Process Used to Answer Questions ........................................................................ F6-3
Question 1. What is the relationship between physical activity and all-cause mortality? .................. F6-3
Comparing 2018 Findings with the 2008 Scientific Report ................................................................ F6-10
Question 2. What is the relationship between physical activity and cardiovascular disease mortality?
........................................................................................................................................................... F6-11
Question 3. What is the relationship between physical activity and cardiovascular disease incidence?
........................................................................................................................................................... F6-15
Overall Summary, Conclusions, and Public Health Impact .................................................................... F6-21
Needs for Future Research .................................................................................................................... F6-22
References ............................................................................................................................................. F6-24
INTRODUCTION
The Physical Activity Guidelines Advisory Committee Report, 20081 concluded that the amount of
moderate-to-vigorous physical activity is inversely associated with all-cause mortality, cardiovascular
disease (CVD) mortality, and incident CVD. All of the dose-response data used to develop the physical
activity targets for the 2008 Physical Activity Guidelines2 were developed using epidemiologic data from
longitudinal cohort studies with moderate-to-vigorous physical activity as the lone physical activity
exposure.
Part F. Chapter 6. All-cause Mortality, Cardiovascular Mortality, and Incident Cardiovascular Disease
2018 Physical Activity Guidelines Advisory Committee Scientific Report F6-2
In 2008, the Advisory Committee1 relied mostly on the primary literature to perform its work on all-
cause mortality, CVD mortality, and CVD. Since then, studies on the relationship of moderate-to-
vigorous physical activity to these outcomes have continued to be published. In 2008, the assessment of
CVD as an outcome was principally limited to coronary artery disease.1 Since then, studies have been
published on incident cerebrovascular disease—primarily ischemic stroke—and incident heart failure. In
addition, due to the volume of conducted studies, reviews, pooled analyses, and meta-analyses with
many component studies and large sample sizes now are available on the relationship of moderate-to-
vigorous physical activity to all-cause mortality, CVD mortality, and CVD. The abundance of reviews
permitted the Subcommittee to rely on systematic reviews, meta-analyses, and pooled analyses to
perform our review.
In 2008, the Advisory Committee1 began to define a dose-response relationship among moderate-to-
vigorous physical activity and both all-cause and CVD mortality as a curvilinear one, with an early
decrease in risk with greater amounts of moderate-to-vigorous physical activity, and with continuing
benefit with still greater physical activity amounts. While undertaking the current review, the
Subcommittee believed it important to confirm whether this relationship still holds with new data, and
to examine whether it extends to the various CVD outcomes of incident CVD, cerebrovascular disease
(ischemic stroke), and incident heart failure.
REVIEW OF THE SCIENCE
Overview of Questions Addressed
This chapter addresses three major questions and related subquestions:
1. What is the relationship between physical activity and all-cause mortality? a) Is there a dose-response relationship? If yes, what is the shape of the relationship? b) Does the relationship vary by age, sex, race/ethnicity, socioeconomic status, or weight status?
2. What is the relationship between physical activity and cardiovascular disease mortality? a) Is there a dose-response relationship? If yes, what is the shape of the relationship? b) Does the relationship vary by age, sex, race/ethnicity, socioeconomic status, or weight status?
3. What is the relationship between physical activity and cardiovascular disease incidence? a) Is there a dose-response relationship? If yes, what is the shape of the relationship? b) Does the relationship vary by age, sex, race/ethnicity, socioeconomic status, or weight status?
Part F. Chapter 6. All-cause Mortality, Cardiovascular Mortality, and Incident Cardiovascular Disease
2018 Physical Activity Guidelines Advisory Committee Scientific Report F6-3
Data Sources and Process Used to Answer Questions
The Exposure Subcommittee determined that systematic reviews, meta-analyses, and pooled analyses
provided sufficient literature to answer all three research questions. One search and triage process was
conducted for Questions 1 through 3, which covered all-cause mortality, cardiovascular disease
mortality, and cardiovascular disease incidence. For complete details on the systematic literature review
process, see Part E. Scientific Literature Search Methodology.
Question 1. What is the relationship between physical activity and all-cause mortality?
a) Is there a dose-response relationship? If yes, what is the shape of the relationship? b) Does the relationship vary by age, sex, race/ethnicity, or socioeconomic status, and weight status? Source of Evidence: Systematic reviews, meta-analyses, pooled analyses
Conclusion Statements
Strong evidence demonstrates a clear inverse dose-response relationship between the amount of
moderate-to-vigorous physical activity and all-cause mortality. The strength of the evidence is very
unlikely to be modified by more studies of these outcomes. PAGAC Grade: Strong.
Strong evidence demonstrates a dose-response relationship between physical activity and all-cause
mortality. The shape of the curve is nonlinear, with the greatest benefit seen early in the dose-response
relationship. The relationship of moderate-to-vigorous physical activity and risk reduction has no lower
limit. Risk appears to continue to decrease with increased exposure up to at least three to five times the
amounts of the lower bound of moderate-to-vigorous physical activity recommended in the 2008
Guidelines (i.e., 150 minutes per week). The new data are consistent with those used to develop the
2008 Guidelines. PAGAC Grade: Strong.
Strong evidence demonstrates that the dose-response relationships between moderate-to-vigorous
physical activity and all-cause mortality do not vary by age, sex, race, or weight status. PAGAC Grade:
Strong.
Insufficient evidence is available to determine whether these relationships vary by ethnicity or
socioeconomic status. PAGAC Grade: Not assignable.
Part F. Chapter 6. All-cause Mortality, Cardiovascular Mortality, and Incident Cardiovascular Disease
2018 Physical Activity Guidelines Advisory Committee Scientific Report F6-4
Review of the Evidence
An initial search for systematic reviews, meta-analyses, pooled analyses, and reports identified sufficient
literature to answer the research question as determined by the Subcommittee. Additional searches for
original research were not needed.
In data collected from 2006 to 2017, the outcomes of all-cause mortality, CVD mortality, and incident
CVD were often considered in the same systematic reviews and meta-analyses. Therefore, the
systematic reviews and meta-analyses contributing to the understanding of the relation of physical
activity to these three outcomes had significant overlap. Similarly, many of the same studies appeared in
the systematic reviews and meta-analyses identified in our searches. In this section, we deal only with
all-cause mortality.
A total of 12 existing reviews were included in the analysis of the relation of physical activity to all-cause
mortality: 2 systematic reviews,3, 4 7 meta-analyses,5-11 and 3 pooled analyses.12-14 Of these 12 reviews, 5
also addressed CVD mortality and are reported later in the chapter. Follow-up for these studies ranged
from 3.8 to longer than 20 years, and up to 3.4 million participants in total were studied across these
reviews and meta-analyses.
The two systematic reviews included a large number of contributing studies: 1213 and 254.4 However, in
Milton et al,3 only seven addressed all-cause mortality, nine addressed CVD, and three addressed stroke.
For Warburton et al,4 70 component studies addressed all-cause mortality, 49 addressed CVD, and 25
addressed stroke. The total numbers for each outcome were not reported. The studies covered
extensive timeframes: from 1990 to 2013 and from 1950 to 2008, respectively.
The meta-analyses ranged from 9 to 80 studies. Most meta-analyses covered an extensive timeframe:
from inception of the database to 1 year before publication,5, 7, 10, 11 from 1945 to 2013,8 and from 1970s
and 1990s to 2007 and 2006.6, 9 The pooled analyses include data from six prospective cohort studies
Arem et al12 and Moore et al,13 (used the same six cohorts) and from 11 cohorts O’Donovan et al.14
The majority of the included reviews examined self-reported leisure time moderate-to-vigorous physical
activity. Most reviews also established specific physical activity dose categories in metabolic equivalents
of task (MET) for minutes or hours per week using quartiles or a variety of categories such as inactive
and low, medium, and high levels of physical activity, or high versus low levels of physical activity.
Part F. Chapter 6. All-cause Mortality, Cardiovascular Mortality, and Incident Cardiovascular Disease
2018 Physical Activity Guidelines Advisory Committee Scientific Report F6-5
Three reviews addressed specific types of physical activity. Kelly et al8 studied cycling and walking.
Samitz et al10 studied domain-specific physical activity defined into leisure-time physical activity,
activities of daily living, and occupational physical activity. Hamer and Chida6 studied habitual walking
only.
One pooled analysis14 separately examined individuals who meet the physical activity guidelines in one
or two sessions in addition to the usual physical activity categories (inactive, insufficiently active, and
regularly active). Merom et al15 examined dancing versus walking.
Evidence on the Overall Relationship
All the included reviews addressed all-cause mortality as an outcome and five of them also examined
CVD mortality.
All studies reported an inverse relationship between moderate-to-vigorous physical activity and all-
cause mortality in a dose-response fashion as described below. There were no null studies. The pooled
analysis, in which individuals meeting guidelines in one or two sessions per week and individuals
meeting guidelines with three or more sessions per week were compared to an inactive group, showed
no differences in the effect sizes for all-cause mortality between individuals meeting guidelines in 1 to 2
sessions per week (hazard ratio (HR)= 0.60; confidence interval (CI): 0.45-0.82) and individuals meeting
guidelines in 3 or more sessions per week (HR=0.59; CI: 0.48-0.73), compared to the inactive group.14
In the analysis by Kelly et al,8 the effect sizes for cycling and walking were similar. For exercise of 11.25
MET-hours per week (675 MET-minutes per week), the reduction in risk for all-cause mortality was 11
percent (95% CI: 4%-17%) for walking and 10 percent (95% CI: 6%-13%) for cycling. The shape of the
dose-response relationship was modeled through meta-analysis of pooled relative risks within three
exposure intervals. Consistent with other studies, the dose-response analysis showed that for walking or
cycling, the greatest reduction in risk for all-cause mortality occurred within the lowest exposure
categories of physical activity.
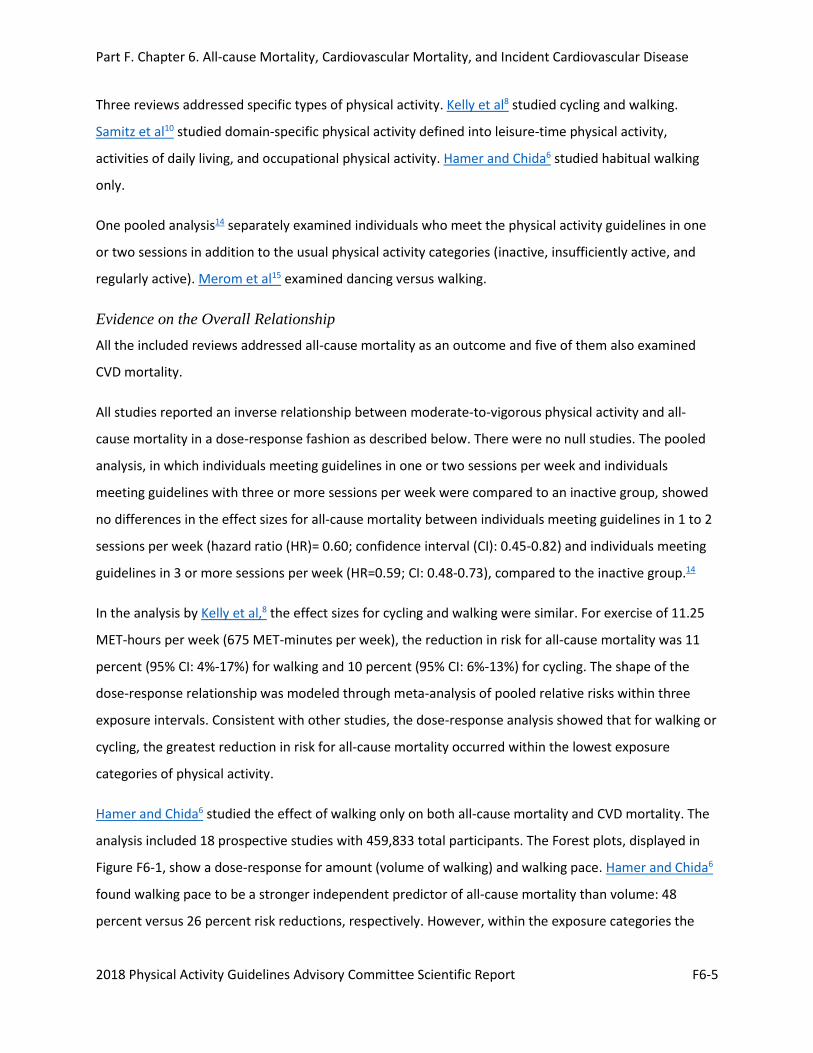
Hamer and Chida6 studied the effect of walking only on both all-cause mortality and CVD mortality. The
analysis included 18 prospective studies with 459,833 total participants. The Forest plots, displayed in
Figure F6-1, show a dose-response for amount (volume of walking) and walking pace. Hamer and Chida6
found walking pace to be a stronger independent predictor of all-cause mortality than volume: 48
percent versus 26 percent risk reductions, respectively. However, within the exposure categories the
Authors (year) Exposure Sample size Hazard ratio (95% CI)
Male 1 Wannamethee et al (1998)11 Walking > 1 hour/day 4311 0.62 (0.37 to 1.05) 2 Hakim et al (1998)12 Walking > 3.2 km/day 707 0.55 (0.37 to 0. 83) 3 Bijnen et al (1998)13 Walking > 1 hour/week 80 2 0.71 (0.68 to 0.88) 4 Davey Smith et al (2000)19 Brisk walking 6702 0.55 (0.48 to 0.63) 5 Fujita et al (2004)24 Walking > 1 hour/day 20,004 0.92 (0.80 to 1.06)
6a Schnohr et al (2007)26 Walking > 2 hours/day 3204 0.89 (0.69 to 1.14) 6b Schnohr et al (2007)26 Brisk walking 3204 0.43 (0.32 to 0.59)
Subtotal 38,934 0.66 (0.53 to 0.83)
Female 1 Gregg et al (2003)23 Walking > 898 kcal/week 9518 0.71 (0.62 to 0.82) 2 Fujita et al (2004)24 Walking > 1 hour/day 21,159 0.72 ( 0.59 to 0.89) 3a Schnohr et al (2007)26 Walking > 2 hours/day 4104 0.81 (0.59 to 1.10) 3b Schnohr et al (2007)26 Brisk walking 4104 0.48 ( 0.35 to 0.66) 4 Matthew et al (2007)27 Walking > 10 MET-hours/day 67,143 0.86 (0.71 to 1.05)
Subtotal 106,028 0.72 (0.62 to 0.84)
Male and female 1 LaCroix et al (1996)1 0 Walking > 4 hours/week 1645 0.73 (0.48 to 1.10) 2 Stessman et al (2000)18 Walking > 4 hours/week 456 0.14 (0.04 to 0.50)
Total 147,063 0.68 (0.59 to 0.78) Test for heterogeneity χ²(13) = 31.35, p < 0.001 Test for overall effect χ²(1) = 57.86, p < 0.001
Part F. Chapter 6. All-cause Mortality, Cardiovascular Mortality, and Incident Cardiovascular Disease
2018 Physical Activity Guidelines Advisory Committee Scientific Report F6-6
studies had considerable heterogeneity. The greatest walking exposure groups averaged more than 5.2
hours per week or more than 10.7 miles per week, and the groups ranged from more than 1 hour per
week to more than 2 hours per day and more than 6.0 miles per week to more than 12.4 miles per
week. Walking pace was generally assessed as a relative rather than an absolute measure, although
several studies defined ‘‘brisk’’ as more than 3.0 miles per hour and ‘‘moderate’’ as 2.0 to 2.9 miles per
hour. Minimal walking categories averaged approximately 3 hours per week (ranging from
approximately 30 minutes per week to approximately 5 hours per week) or 6.1 miles per week (ranging
from approximately 3.1 miles per week to approximately 9.3 miles per week), which equated to a casual
or moderate walking pace of approximately 2 miles per hour.
Figure F6-1. The Association Between Walking and All-Cause Mortality in Men and Women
Note: Walking is favored, with a shift of the estimate to the left. These estimates are similar to the effects on cardiovascular disease mortality in Question 2, Figure F6-4. Source: Reproduced from [Walking and primary prevention: A meta-analysis of prospective cohort studies, Hamer and Chida6, 42, 2008] with permission from BMJ Publishing Group Ltd.
Dose-response: Every one of the 12 studies within our analysis demonstrated a significant inverse dose-
response relationship with all-cause mortality across physical activity exposure groups. The uniformity
and strength of these relationships led to the strength of association finding for this subquestion. The
uniformity of findings prompted us to highlight the two pooled analyses of Arem et al12 and Moore et
al.13 In these pooled analyses of six studies, combining data at the individual level allowed an
Part F. Chapter 6. All-cause Mortality, Cardiovascular Mortality, and Incident Cardiovascular Disease
2018 Physical Activity Guidelines Advisory Committee Scientific Report F6-7
examination of the strength of effects and confidence boundaries across large populations with great
precision.
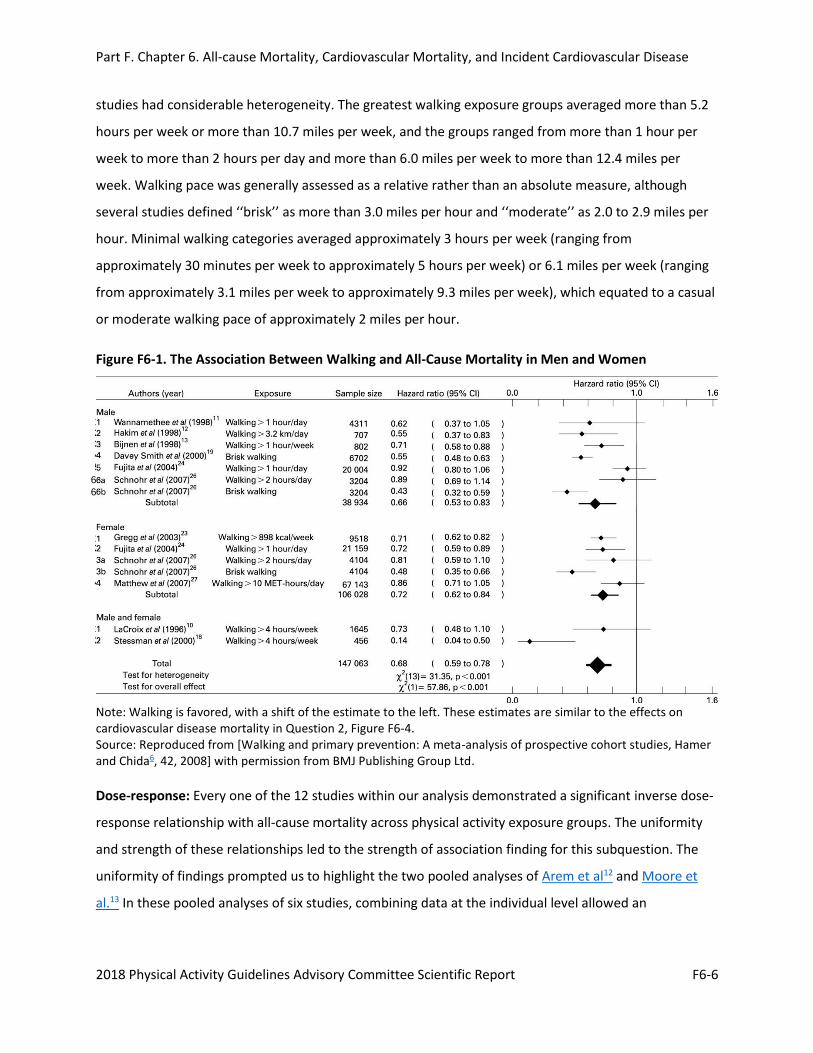
Moore et al13 reported a pooled analysis of the association of leisure-time physical activity with
mortality during follow-up in pooled data from six prospective cohort studies in the National Cancer
Institute Cohort Consortium. The combined pooled cohort included 654,827 individuals, ages 21 to 90
years. Moderate-to-vigorous physical activity in MET-hours per week was used to generate adjusted
survival curves (for participants ages 40 years and older), with 95% confidence intervals derived by
bootstrap. The study included a median 10 years of follow-up and 82,465 deaths. Figure F6-2 shows the
survival curves against several characteristics of the relationship common among the studies reporting
on dose-response on all-cause mortality. The survival curve from this analysis demonstrates several
important points:
1. The beneficial effect has no lowest threshold.
2. The slope is steepest at the lowest amounts of moderate-to-vigorous physical activity.
3. At least 70 percent of the potential benefit on all-cause mortality is reached by achieving 8.25
MET-hours (150 minutes) per week of moderate-to-vigorous physical activity.
4. There is no obvious best amount.
5. There is no apparent upper threshold.
6. Benefits continue to accrue as more physical activity is accrued.
7. Activity volumes (amounts) up to four times the 2008 Guidelines2 (150-300 minutes moderate-
intensity physical activity) show no evidence of increased mortality risk.
Part F. Chapter 6. All-cause Mortality, Cardiovascular Mortality, and Incident Cardiovascular Disease
2018 Physical Activity Guidelines Advisory Committee Scientific Report F6-8
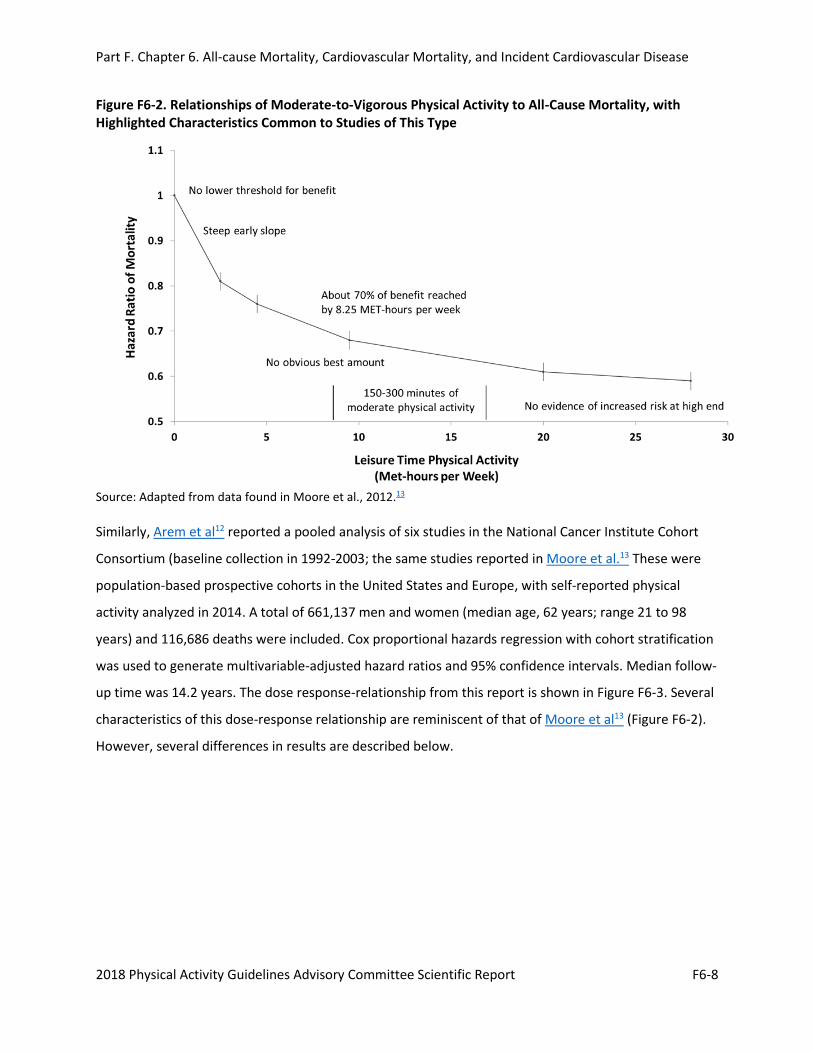
Figure F6-2. Relationships of Moderate-to-Vigorous Physical Activity to All-Cause Mortality, with Highlighted Characteristics Common to Studies of This Type
Source: Adapted from data found in Moore et al., 2012.13
Similarly, Arem et al12 reported a pooled analysis of six studies in the National Cancer Institute Cohort
Consortium (baseline collection in 1992-2003; the same studies reported in Moore et al.13 These were
population-based prospective cohorts in the United States and Europe, with self-reported physical
activity analyzed in 2014. A total of 661,137 men and women (median age, 62 years; range 21 to 98
years) and 116,686 deaths were included. Cox proportional hazards regression with cohort stratification
was used to generate multivariable-adjusted hazard ratios and 95% confidence intervals. Median follow-
up time was 14.2 years. The dose response-relationship from this report is shown in Figure F6-3. Several
characteristics of this dose-response relationship are reminiscent of that of Moore et al13 (Figure F6-2).
However, several differences in results are described below.
Part F. Chapter 6. All-cause Mortality, Cardiovascular Mortality, and Incident Cardiovascular Disease
2018 Physical Activity Guidelines Advisory Committee Scientific Report F6-9
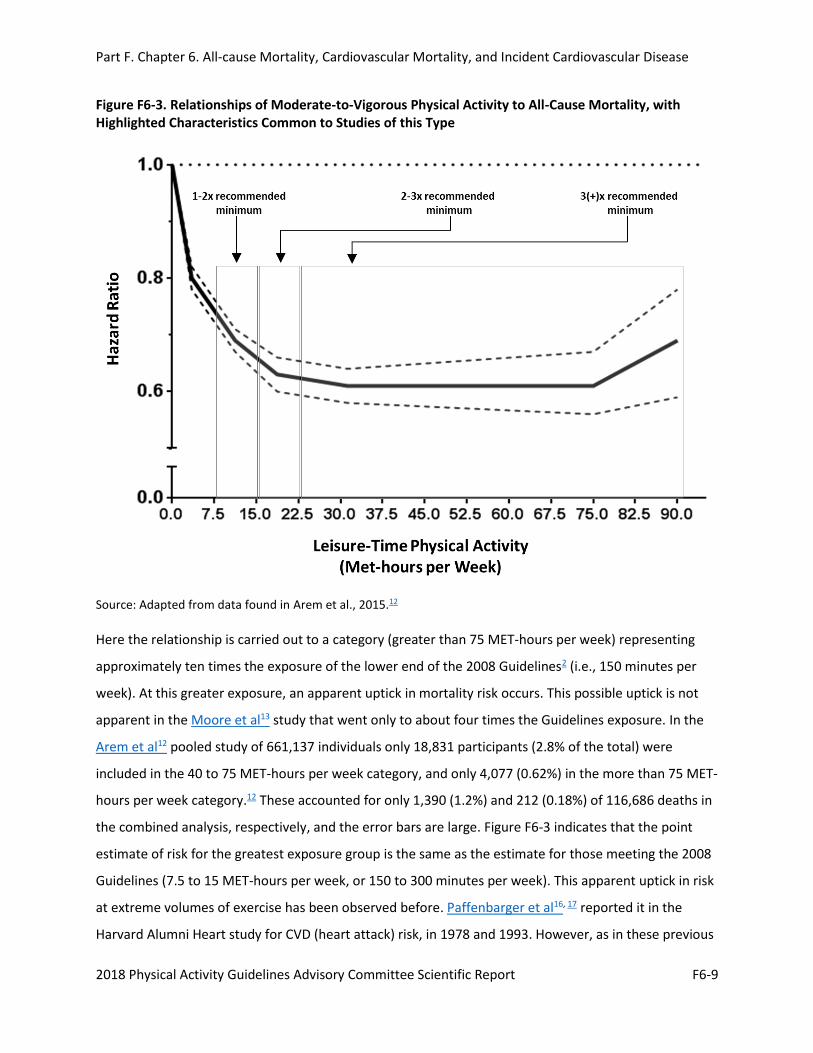
Figure F6-3. Relationships of Moderate-to-Vigorous Physical Activity to All-Cause Mortality, with Highlighted Characteristics Common to Studies of this Type
Source: Adapted from data found in Arem et al., 2015.12 Here the relationship is carried out to a category (greater than 75 MET-hours per week) representing
approximately ten times the exposure of the lower end of the 2008 Guidelines2 (i.e., 150 minutes per
week). At this greater exposure, an apparent uptick in mortality risk occurs. This possible uptick is not
apparent in the Moore et al13 study that went only to about four times the Guidelines exposure. In the
Arem et al12 pooled study of 661,137 individuals only 18,831 participants (2.8% of the total) were
included in the 40 to 75 MET-hours per week category, and only 4,077 (0.62%) in the more than 75 MET-
hours per week category.12 These accounted for only 1,390 (1.2%) and 212 (0.18%) of 116,686 deaths in
the combined analysis, respectively, and the error bars are large. Figure F6-3 indicates that the point
estimate of risk for the greatest exposure group is the same as the estimate for those meeting the 2008
Guidelines (7.5 to 15 MET-hours per week, or 150 to 300 minutes per week). This apparent uptick in risk
at extreme volumes of exercise has been observed before. Paffenbarger et al16, 17 reported it in the
Harvard Alumni Heart study for CVD (heart attack) risk, in 1978 and 1993. However, as in these previous
Part F. Chapter 6. All-cause Mortality, Cardiovascular Mortality, and Incident Cardiovascular Disease
2018 Physical Activity Guidelines Advisory Committee Scientific Report F6-10
reports, the apparent rise in risk at very high amounts of moderate-to-vigorous physical activity did not
reach the level of statistical significance.12
In a seminal paper in 2016, Ekelund et al5 examined the associations of sedentary behavior (sitting and
television watching) and physical activity (moderate-to-vigorous physical activity) with all-cause
mortality. See Part D. Integrating the Evidence and Part F. Chapter 2. Sedentary Behavior for more
details on these interactions. Using 16 contributing studies, combining data across all studies to analyse
the association of daily sitting time and physical activity with all-cause mortality, estimating summary
hazard ratios using Cox regression, and expressing physical activity in terms of MET-hours per week of
moderate-to-vigorous physical activity, Ekelund et al5 found the same curvilinear relationships among
physical activity and all-cause mortality as observed Arem et al12 and Moore et al.13
Evidence on Specific Factors
Demographic factors and weight status: Most studies reported overall distributions of demographic
factors (race, sex, weight status) across exposure groups within individual studies in their reviews and
meta-analyses. Given the nature of meta-analyses—conducted at the study level versus the individual
level—it is difficult to detect differential effects by demographic factors and weight status unless the
specific component studies performed them within their analysis. Some studies examined subgroup
effects directly in their review or meta-analysis; one focused on adults older than 60 years.7 In such
studies, no subgroup effects were detected. The O’Donovan et al14 analysis of “weekend warrior”
physical activity behavior on all-cause mortality, showed no differential responses by sex.
However, the pooled analyses12, 13 permit a direct examination of the relative effects across
demographic categories. In these studies, effects are reported for strata across sex, race, and body mass
index (BMI) and the aggregate event data reported according to strata. Although not directly tested in
these reports, no differential effects across sex, race, or BMI strata are readily apparent. Strata for
socioeconomic status and ethnicity were not reported.
For additional details on this body of evidence, visit: https://health.gov/paguidelines/second-edition/report/supplementary-material.aspx for the Evidence Portfolio.
Comparing 2018 Findings with the 2008 Scientific Report
Compared with the 2008 Advisory Committee, this Subcommittee’s review of systematic reviews, meta-
analyses, and pooled studies exploited the analysis of larger cohorts and provided more precision
Part F. Chapter 6. All-cause Mortality, Cardiovascular Mortality, and Incident Cardiovascular Disease
2018 Physical Activity Guidelines Advisory Committee Scientific Report F6-11
around the effect size estimates. Our review identified the same dose-effect estimates relating
moderate-to-vigorous physical activity with all-cause mortality as was described in 2008. Given the large
population sizes and heterogeneity studied, we have more confidence in the precision of these numbers
as well as their generalizability to U.S. adult men and women, and populations of all races, ages, and
body sizes.
Question 2. What is the relationship between physical activity and cardiovascular disease mortality?
a) Is there a dose-response relationship? If yes, what is the shape of the relationship? b) Does the relationship vary by age, sex, race/ethnicity, or socioeconomic status, and weight status?
Source of Evidence: Systematic reviews, meta-analyses, pooled analyses
Conclusion Statements
Strong evidence demonstrates that a strong inverse dose-response relation exists between amount of
moderate-to-vigorous physical activity and cardiovascular disease mortality. The strength of the
evidence is very unlikely to be modified by more studies of this outcome. PAGAC Grade: Strong.
Strong evidence demonstrates that the shape of the curve is nonlinear, with the greatest benefit seen
early in the dose-response relationship. The relationship of moderate-to-vigorous physical activity and
risk reduction has no lower limit. Risk appears to continue to decrease with increased exposure up to at
least three to five times the amounts of moderate-to-vigorous physical activity recommended in the
2008 Guidelines (i.e., 150 minutes per week). The new data are consistent with those used to develop
the 2008 Guidelines. PAGAC Grade: Strong.
Strong evidence demonstrates that these relationships do not vary by age, sex, race, or weight status.
PAGAC Grade: Strong.
Insufficient evidence is available to determine whether these relationships vary by ethnicity or
socioeconomic status. PAGAC Grade: Not assignable.
Review of the Evidence
An initial search for systematic reviews, meta-analyses, pooled analyses, and reports identified sufficient
literature to answer the research question as determined by the Subcommittee. Additional searches for
original research were not needed.
Part F. Chapter 6. All-cause Mortality, Cardiovascular Mortality, and Incident Cardiovascular Disease
2018 Physical Activity Guidelines Advisory Committee Scientific Report F6-12
In data collected from 2006 to 2017, the outcomes of all-cause mortality, CVD mortality, and incident
CVD were often considered in the same systematic reviews and meta-analyses. Therefore, the
systematic reviews and meta-analyses contributing to the understanding of the relation of physical
activity to these three outcomes had significant overlap. Similarly, many of the same studies appeared in
the systematic reviews and meta-analyses identified in our searches. In this section, we address only
CVD mortality; however, the format and conclusions differ little from those made for all-cause mortality.
A note on nomenclature is necessary here. For this discussion, CVD mortality refers to mortality
attributable to CVD in its broadest sense. CVD refers to diseases beyond coronary artery disease, but
does not include:
• non-atheromatous or infectious valvular disease and others, such as diseases due to coronary
heart disease secondary to coronary artery disease,
• cerebrovascular disease secondary to a cerebrovascular accident or stroke,
• heart failure of ischemic (coronary) or non-ischemic etiology.
A total of six existing reviews were included: one systematic review,3 three meta-analyses,5, 6, 18 and two
pooled analyses.14, 15 The reviews were published from 2008 to 2017. The systematic review3 included
121 studies and a timeframe from 1983 to 2013. The meta-analyses included a range of 16 to 36 studies
and covered an extensive timeframe: Ekelund et al,5 from inception of the database to 2015; Hamer and
Chida,6 and Wahid et al,18 from 1970s and 1980s to 2007 and 2014 respectively. The pooled analyses
included data from 11 cohorts, each from different population surveys.14, 15
The majority of the included reviews examined self-reported leisure time moderate-to-vigorous physical
activity. Most reviews also established specific physical activity dose categories in MET-minutes or MET-
hours per week using quartiles or a variety of categories such as inactive and low, medium, and high
levels of physical activity, or high versus low levels of physical activity.
One pooled analysis14 examined a “weekend warrior” category (meeting the physical activity guidelines
in one or two sessions per seek) in addition to the usual physical activity categories (insufficiently active
and regularly active) compared to an inactive group. Two reviews addressed specific types of physical
activity: dancing15 and habitual walking.6
Part F. Chapter 6. All-cause Mortality, Cardiovascular Mortality, and Incident Cardiovascular Disease
2018 Physical Activity Guidelines Advisory Committee Scientific Report F6-13
Evidence on the Overall Relationship
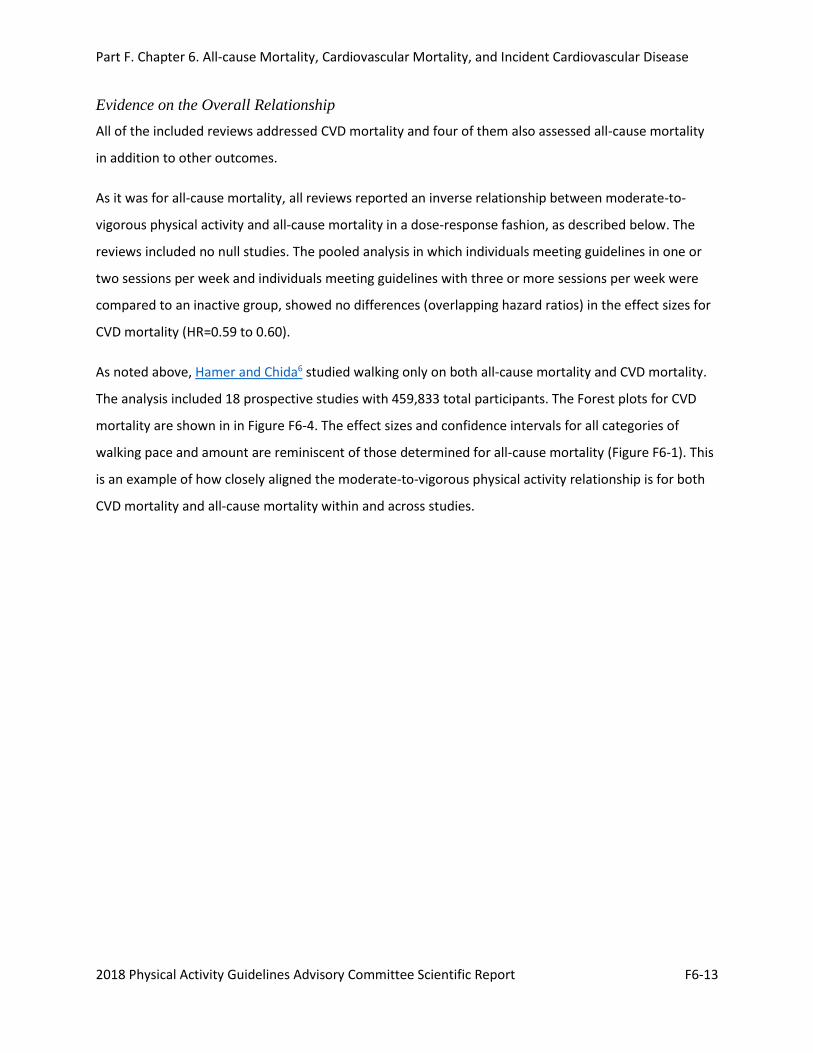
All of the included reviews addressed CVD mortality and four of them also assessed all-cause mortality
in addition to other outcomes.
As it was for all-cause mortality, all reviews reported an inverse relationship between moderate-to-
vigorous physical activity and all-cause mortality in a dose-response fashion, as described below. The
reviews included no null studies. The pooled analysis in which individuals meeting guidelines in one or
two sessions per week and individuals meeting guidelines with three or more sessions per week were
compared to an inactive group, showed no differences (overlapping hazard ratios) in the effect sizes for
CVD mortality (HR=0.59 to 0.60).
As noted above, Hamer and Chida6 studied walking only on both all-cause mortality and CVD mortality.
The analysis included 18 prospective studies with 459,833 total participants. The Forest plots for CVD
mortality are shown in in Figure F6-4. The effect sizes and confidence intervals for all categories of
walking pace and amount are reminiscent of those determined for all-cause mortality (Figure F6-1). This
is an example of how closely aligned the moderate-to-vigorous physical activity relationship is for both
CVD mortality and all-cause mortality within and across studies.
Authors (year) Exposure Sample size Hazard ratio (95% CI) Male
1 Hakim et al (1998)12 Walking > 3.2 km/day 707 0.39 (0.10 to 1.49) 2 Hakim et al (1999)14 Walking >2.5 km/day 2678 0.43 (0.24 to 0.77) 3 Bijnen et al (1998)13 Walking > 1 hour/week 802 0.69 (0.45 to 1.05) 4 Sesso et al (2000)17 Walking > 10 km/week 12,516 0 .88 (0.78 to 1.00) 5 Davey Smith et al (2000)19 Brisk walking 6702 0.47 (0.37 to 0.59) 6a Tanasescu et al (2002)22 Walking > 3.5 hours/week 44,452 0 .90 (0.73 to 1.10) 6b Tanasescu et al (2002)22 Brisk walking 44,452 0.51 (0.31 to 0.84)
7 Noda et al (2005)25 Walking > 1 hour/day 31,023 0.85 (0.72 to 1.00) Subtotal 143,332 0.68 (0.55 to 0.85)
Female 1a Manson et al (1999)15 Walking > 3 hours/week 72,488 0.65 (0.47 to 0.91) 1b Manson et al (1999)15 Brisk walking 72,488 0.64 (0.47 to 0.88)
2 Sesso et al (1999)16 Walking > 10 km/week 1564 0.67 (0.45 to 1.01) 3a Lee et al (2001 )20 Walking > 2 hours/week 39,372 0.48 (0.29 to 0.78) 3b Lee et al (2001 )20 Brisk walking 39,372 0.52 (0.30 to 0.90)
4 Manson et al [2002)2 1 Walking > 3 hours/week 73,743 0.68 (0.56 to 0.82) 5 Gregg et al (2003)23 Walking > 898 kcal/week 9518 0.62 (0.49 to 0.78) 6 Noda et al (2005)26 Walking > 1 hour/day 42,242 0.84 (0.70 to 1.02) 7 Matthew et al (2007)27 Walking > 10 MET-hour/day 67,143 0.92 (0.60 to 1.40)
Subtotal 417,930 0.69 (0.61 to 0.77)
Male and female 1 LaCroix et al (1996)10 Walking > 4 hours/week 1645 0.68 (0.52 to 0.90)
Total 562,907 0.69 (0.61 to 0.77) Test for heterogeneity χ²(17) = 42.91, p < 0.001 Test for overall effect χ²(1) = 47.68, p < 0.001
Part F. Chapter 6. All-cause Mortality, Cardiovascular Mortality, and Incident Cardiovascular Disease
2018 Physical Activity Guidelines Advisory Committee Scientific Report F6-14
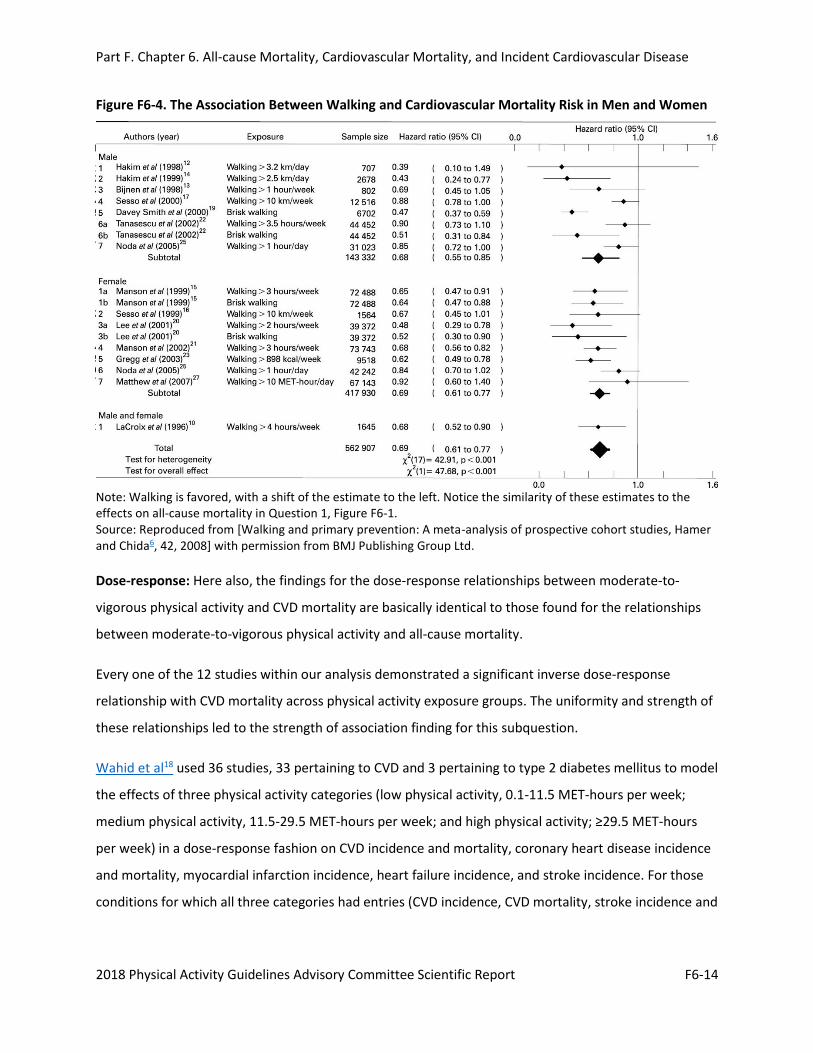
Figure F6-4. The Association Between Walking and Cardiovascular Mortality Risk in Men and Women
Note: Walking is favored, with a shift of the estimate to the left. Notice the similarity of these estimates to the effects on all-cause mortality in Question 1, Figure F6-1. Source: Reproduced from [Walking and primary prevention: A meta-analysis of prospective cohort studies, Hamer and Chida6, 42, 2008] with permission from BMJ Publishing Group Ltd.
Dose-response: Here also, the findings for the dose-response relationships between moderate-to-
vigorous physical activity and CVD mortality are basically identical to those found for the relationships
between moderate-to-vigorous physical activity and all-cause mortality.
Every one of the 12 studies within our analysis demonstrated a significant inverse dose-response
relationship with CVD mortality across physical activity exposure groups. The uniformity and strength of
these relationships led to the strength of association finding for this subquestion.
Wahid et al18 used 36 studies, 33 pertaining to CVD and 3 pertaining to type 2 diabetes mellitus to model
the effects of three physical activity categories (low physical activity, 0.1-11.5 MET-hours per week;
medium physical activity, 11.5-29.5 MET-hours per week; and high physical activity; ≥29.5 MET-hours
per week) in a dose-response fashion on CVD incidence and mortality, coronary heart disease incidence
and mortality, myocardial infarction incidence, heart failure incidence, and stroke incidence. For those
conditions for which all three categories had entries (CVD incidence, CVD mortality, stroke incidence and
Part F. Chapter 6. All-cause Mortality, Cardiovascular Mortality, and Incident Cardiovascular Disease
2018 Physical Activity Guidelines Advisory Committee Scientific Report F6-15
CHD incidence), all but CVD mortality demonstrated a strong curvilinear dose-response relationship
across categories.
Evidence on Specific Factors
Demographic factors and weight status: Similar to all-cause mortality, the studies providing the
strongest evidence regarding subgroup moderation effects on CVD mortality were the pooled analyses
of Merom et al15 and O’Donovan et al.14 Again, as for all-cause mortality, no differential effects across
sex, race, or BMI strata were readily apparent. Strata for socioeconomic status and ethnicity were not
reported.
For additional details on this body of evidence, visit: https://health.gov/paguidelines/second-edition/report/supplementary-material.aspx for the Evidence Portfolio.
Question 3. What is the relationship between physical activity and cardiovascular disease incidence?
a) Is there a dose-response relationship? If yes, what is the shape of the relationship? b) Does the relationship vary by age, sex, race/ethnicity, socioeconomic status, or weight status?
Source of evidence: Systematic reviews and meta-analyses
Conclusion Statements
Strong evidence demonstrates a significant relationship between greater amounts of physical activity
and decreased incidence of cardiovascular disease, stroke, and heart failure. The strength of the
evidence is unlikely to be modified by more studies of these outcomes. PAGAC Grade: Strong.
Strong evidence demonstrates a significant dose-response relationship between physical activity and
cardiovascular disease, stroke, and heart failure. When exposures are expressed as energy expenditure
(MET-hours per week), the shape of the curve for incident CVD appears to be nonlinear, with the
greatest benefit seen early in the dose-response relationship. It is unclear whether the shapes of the
relations for incident stroke and heart failure are linear or nonlinear. There is no lower limit for the
relation of MPVA and risk reduction. Risk appears to continue to decrease with increased exposure up to
at least five times the current recommended levels of moderate-to-vigorous physical activity. PAGAC
Grade: Strong.
Insufficient evidence is available to determine whether these relationships vary by age, sex, race,
ethnicity, socioeconomic status, or weight status. PAGAC Grade: Not assignable.
Part F. Chapter 6. All-cause Mortality, Cardiovascular Mortality, and Incident Cardiovascular Disease
2018 Physical Activity Guidelines Advisory Committee Scientific Report F6-16
Review of the Evidence
An initial search for systematic reviews, meta-analyses, pooled analyses, and reports identified sufficient
literature to answer the research question as determined by the Subcommittee. Additional searches for
original research were not needed.
A total of 10 existing reviews were included: 1 systematic review4 and 9 meta-analyses.18-26 The reviews
were published from 2008 to 2016. The systematic review4 included 254 studies published between
1950 and 2008.
The meta-analyses included a range of 12 to 43 studies. Most meta-analyses covered an extensive
timeframe: from database inception to 2013,25 from 1954 and 1966 to 2007,24, 26 and from the 1980s
and 1990s to 2005–2016.18-23
The majority of included reviews examined self-reported physical activity. Different domains of physical
activity were also assessed, including total21; occupational and leisure20; occupational, leisure, and
transport23; and leisure physical activity only.24 Some reviews also established specific dose categories in
MET-minutes or MET-hours per week.18, 21, 22, 26 Other reviews used minimal or low versus moderate or
high physical activity levels as reported in individual studies.4, 19, 24 Two meta-analyses specifically
examined tai chi25 and walking.26
Included reviews addressed the incidence of CVD in a variety of ways. Several addressed incident
coronary heart disease,21, 23, 24, 26 incident stroke,19, 21, 25 and incident heart failure.20, 22 Warburton et al4
reviewed incident stroke and coronary (ischemic) heart disease. Wahid et al18 used 33 studies to address
CVD incidence and mortality, coronary heart disease incidence and mortality, myocardial infarction
incidence, heart failure incidence, and stroke incidence. Thus, in all, six studies addressed incident
coronary heart disease; five studies addressed incident stroke; and three studies addressed incident
heart failure.
Evidence on the Overall Relationship
All six studies addressing incident coronary heart disease, the five studies addressing incident stroke,
and the three studies addressing incident heart failure demonstrated significant dose-response inverse
relationships with increased amounts of physical activity. There were no null studies. The shapes of the
relationships are discussed below.
Part F. Chapter 6. All-cause Mortality, Cardiovascular Mortality, and Incident Cardiovascular Disease
2018 Physical Activity Guidelines Advisory Committee Scientific Report F6-17
Coronary Heart Disease
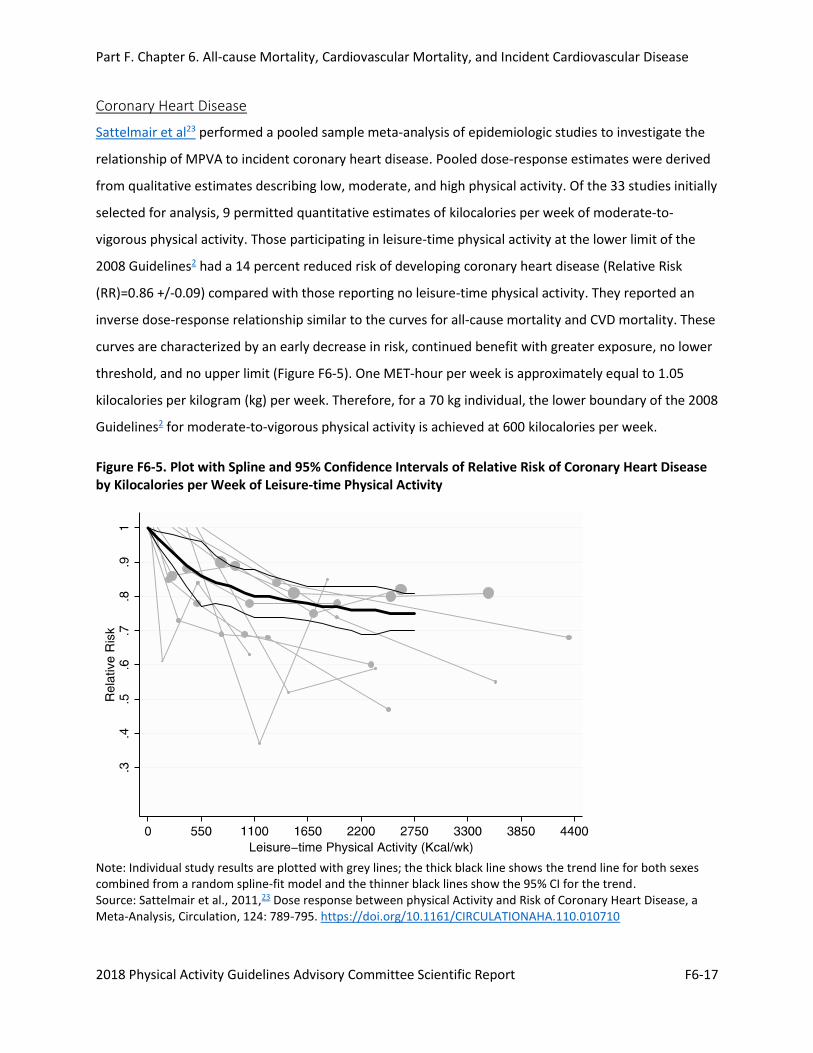
Sattelmair et al23 performed a pooled sample meta-analysis of epidemiologic studies to investigate the
relationship of MPVA to incident coronary heart disease. Pooled dose-response estimates were derived
from qualitative estimates describing low, moderate, and high physical activity. Of the 33 studies initially
selected for analysis, 9 permitted quantitative estimates of kilocalories per week of moderate-to-
vigorous physical activity. Those participating in leisure-time physical activity at the lower limit of the
2008 Guidelines2 had a 14 percent reduced risk of developing coronary heart disease (Relative Risk
(RR)=0.86 +/-0.09) compared with those reporting no leisure-time physical activity. They reported an
inverse dose-response relationship similar to the curves for all-cause mortality and CVD mortality. These
curves are characterized by an early decrease in risk, continued benefit with greater exposure, no lower
threshold, and no upper limit (Figure F6-5). One MET-hour per week is approximately equal to 1.05
kilocalories per kilogram (kg) per week. Therefore, for a 70 kg individual, the lower boundary of the 2008
Guidelines2 for moderate-to-vigorous physical activity is achieved at 600 kilocalories per week.
Figure F6-5. Plot with Spline and 95% Confidence Intervals of Relative Risk of Coronary Heart Disease by Kilocalories per Week of Leisure-time Physical Activity
Note: Individual study results are plotted with grey lines; the thick black line shows the trend line for both sexes combined from a random spline-fit model and the thinner black lines show the 95% CI for the trend. Source: Sattelmair et al., 2011,23 Dose response between physical Activity and Risk of Coronary Heart Disease, a Meta-Analysis, Circulation, 124: 789-795. https://doi.org/10.1161/CIRCULATIONAHA.110.010710
Part F. Chapter 6. All-cause Mortality, Cardiovascular Mortality, and Incident Cardiovascular Disease
2018 Physical Activity Guidelines Advisory Committee Scientific Report F6-18
This analysis points to an important aspect of understanding how the interpretation of dose-response
relationships may depend on the modeling parameters. When the dose-response relationships of the
pooled studies are modeled using the qualitative exposures of low, moderate, and high physical activity,
the dose-response relationship appears linear. When, however, the physical activity exposures are
modeled according to MET-hours per week (Figure F6-5), the curvilinear relationship is revealed.
Evidence on Specific Factors
Demographic factors and weight status: As it was for previously studied outcomes in this chapter, the
studies providing the strongest evidence regarding subgroup moderation effects on cardiovascular
mortality were the pooled analyses; particularly that of Sattelmair et al.23 Of the six studies dealing with
incident CHD in our analysis, to the best of our knowledge, only Sattelmair et al23 explicitly tested for
disease modification by specific factors. Although no interactions were reported for effect modification
by race or BMI strata, they observed a significant interaction by sex (P=0.03); the association was
stronger among women than men.
Stroke and Coronary Heart Disease
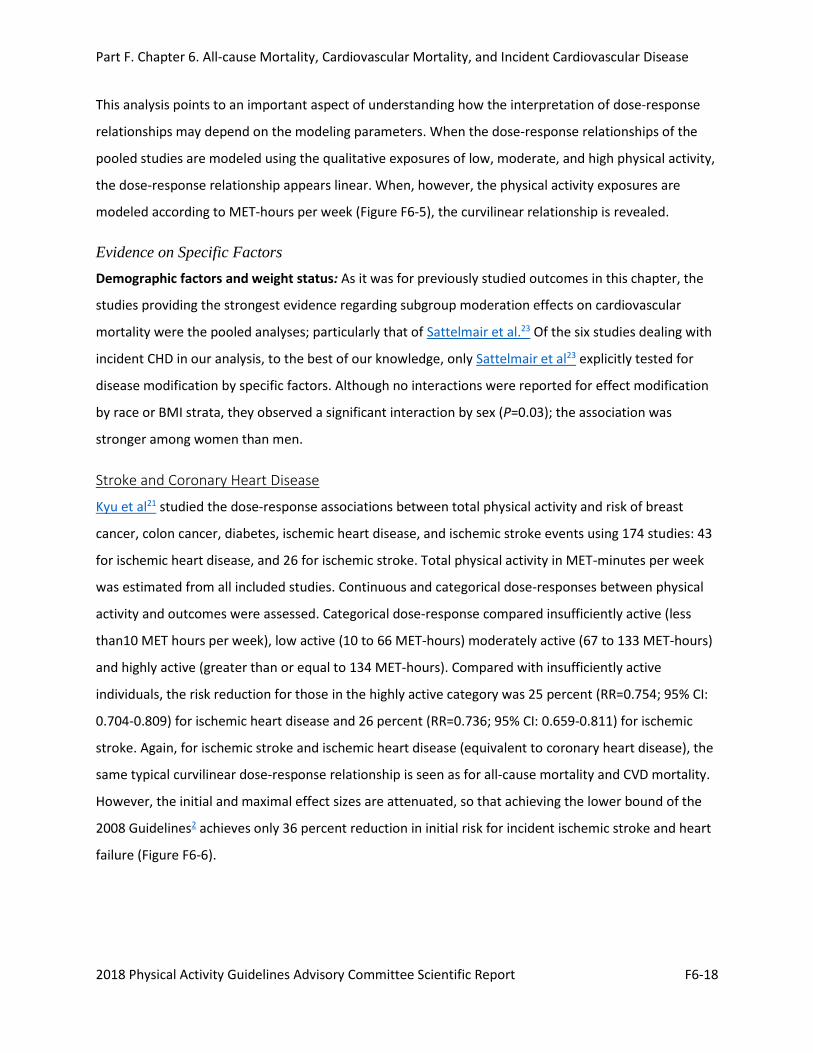
Kyu et al21 studied the dose-response associations between total physical activity and risk of breast
cancer, colon cancer, diabetes, ischemic heart disease, and ischemic stroke events using 174 studies: 43
for ischemic heart disease, and 26 for ischemic stroke. Total physical activity in MET-minutes per week
was estimated from all included studies. Continuous and categorical dose-responses between physical
activity and outcomes were assessed. Categorical dose-response compared insufficiently active (less
than10 MET hours per week), low active (10 to 66 MET-hours) moderately active (67 to 133 MET-hours)
and highly active (greater than or equal to 134 MET-hours). Compared with insufficiently active
individuals, the risk reduction for those in the highly active category was 25 percent (RR=0.754; 95% CI:
0.704-0.809) for ischemic heart disease and 26 percent (RR=0.736; 95% CI: 0.659-0.811) for ischemic
stroke. Again, for ischemic stroke and ischemic heart disease (equivalent to coronary heart disease), the
same typical curvilinear dose-response relationship is seen as for all-cause mortality and CVD mortality.
However, the initial and maximal effect sizes are attenuated, so that achieving the lower bound of the
2008 Guidelines2 achieves only 36 percent reduction in initial risk for incident ischemic stroke and heart
failure (Figure F6-6).
Part F. Chapter 6. All-cause Mortality, Cardiovascular Mortality, and Incident Cardiovascular Disease
2018 Physical Activity Guidelines Advisory Committee Scientific Report F6-19
Figure F6-6. Dose-Response Relationships Between Total Physical Activity and Risk of Breast Cancer, Colon Cancer, Diabetes, Ischemic Heart Disease, and Ischemic Stroke Events Using 174 Studies (43 For Ischemic Heart Disease, and 26 For Ischemic Stroke)
Note: For reference, shown are the lower end (8.5 MET-hours/week) and upper bounds (17 MET-hours/week) of the 2008 Guidelines for moderate-to-vigorous physical activity. Also indicated is the moderate-to-vigorous physical activity amount associated with normalization of the risk from greater than 8 hours per day of sedentary activity from Ekelund, 2016 (35 MET-hours/week). Source: Reproduced from [Physical activity and risk of breast cancer, colon cancer, diabetes, ischemic heart disease, and ischemic stroke events: Systematic review and dose-response meta-analysis for the Global Burden of Disease Study 2013, Kyu et al21, 354, 2016] with permission from BMJ Publishing Group Ltd. and Ekelund et al., 2016.5
Evidence on Specific Factors
Demographic factors and weight status: No effect modifications by age, sex, or weight status were
reported for the five reviews that studied incident ischemic stroke. Socioeconomic status and
race/ethnicity were not reported in these studies.
Heart Failure
Pandey et al22 studied the categorical dose-response relationships between physical activity and heart
failure risk. As in the previously discussed analysis by Kyu et al,21 these authors used generalized least-
squares regression modeling to assess the quantitative relationship between physical activity (MET-
minutes per week) and heart failure risk across studies reporting quantitative physical activity estimates.
Part F. Chapter 6. All-cause Mortality, Cardiovascular Mortality, and Incident Cardiovascular Disease
2018 Physical Activity Guidelines Advisory Committee Scientific Report F6-20
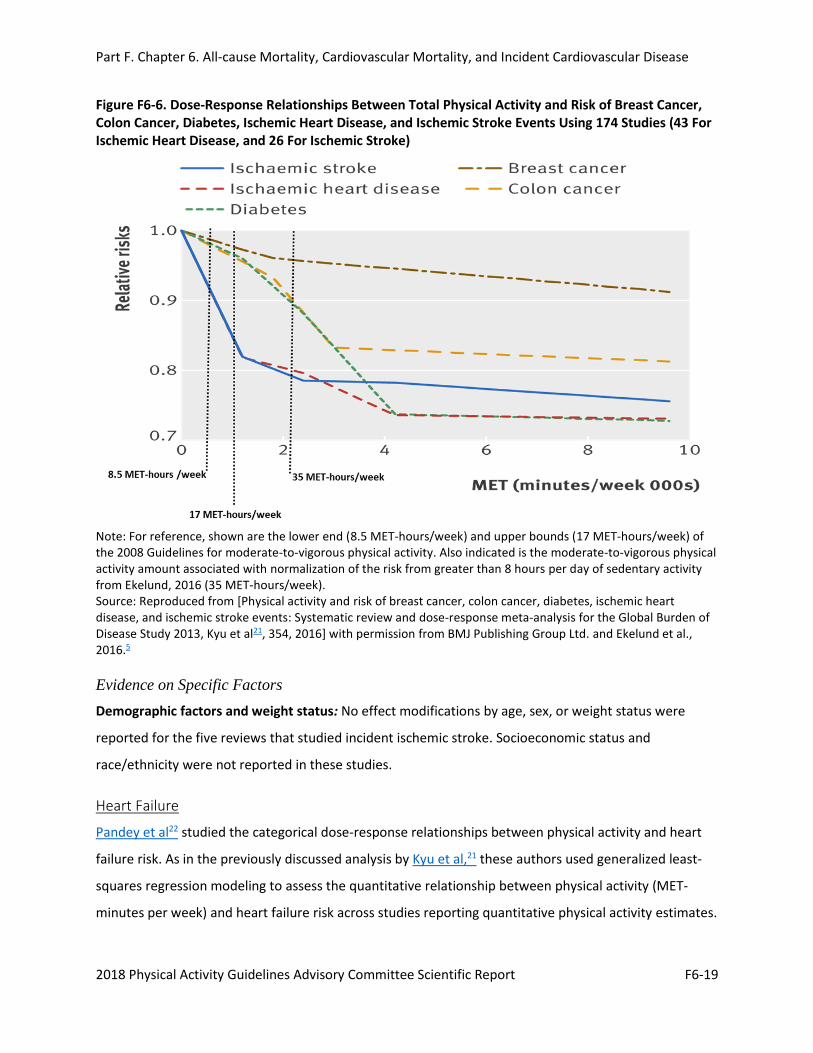
Twelve prospective cohort studies with 20,203 heart failure events among 370,460 participants (53.5%
women; median follow-up, 13 years) were included. As seen in Figure F6-7, the greatest levels of
physical activity were associated with significantly reduced risk of heart failure (pooled HR for highest
versus lowest physical activity=0.70; 95% CI: 0.67-0.73). Compared with participants reporting no
leisure-time physical activity, those who engaged in 2008 Guidelines -recommended minimum levels of
physical activity (500 MET-minutes per week2 had modest reductions in heart failure risk (pooled
HR=0.90; 95% CI: 0.87-0.92). Thus, only 33 percent of the maximal benefit was achieved at the 2008
Guidelines2 amount. Thus, for heart failure, it appears that the dose-response relationship is linear, and
not the curvilinear relationship observed for the other outcomes discussed in this chapter.
Figure F6-7. Dose-Response Relationships Between Moderate-to-Vigorous Physical Activity and Risk of Incident Heart Failure
Note: For reference, shown are the lower end (8.5 MET-hours/week) and upper bounds (17 MET-hours/week) of the 2008 Guidelines for moderate-to-vigorous physical activity. Also indicated is the moderate-to-vigorous physical activity amount associated with normalization of the risk from greater than 8 hours per day of sedentary activity from Ekelund et al., 2016 (17 MET-hours/week).
Part F. Chapter 6. All-cause Mortality, Cardiovascular Mortality, and Incident Cardiovascular Disease
2018 Physical Activity Guidelines Advisory Committee Scientific Report F6-21
Source: Used with permission, Pandey et al., 201522 2016, Dose–Response Relationship Between Physical Activity and Risk of Heart Failure, a Meta-Analysis, Circulation, 132: 1786-1794. https://doi.org/10.1161/CIRCULATIONAHA.115.015853. Lines added from Ekelund et al., 2016.5
Evidence on Specific Factors
Demographic factors and weight status: No effect modifications by age, sex, or weight status were
reported for the two reviews that studied incident heart failure. Socioeconomic status and
race/ethnicity were not reported in these studies.
For additional details on this body of evidence, visit: https://health.gov/paguidelines/second-edition/report/supplementary-material.aspx for the Evidence Portfolio.
OVERALL SUMMARY, CONCLUSIONS, AND PUBLIC HEALTH IMPACT
The effects of moderate-to-vigorous physical activity on atherosclerotic CVDs of coronary heart disease,
ischemic stroke and heart failure are very similar to those of all-cause mortality and CVD mortality. The
evidence continues to support the conclusion that increasing moderate-to-vigorous physical activity
levels by even small amounts in the inactive U.S. population has the potential to have an important and
substantial impact on these outcomes in the adult population. With respect to reductions in risk for
these endpoints, the following points are clear:
• Any amount of physical activity has greater benefit than no physical activity at all;
• More moderate-to-vigorous physical activity is better than none;
• Meeting current moderate-to-vigorous physical activity guidelines will result in an all-cause
mortality risk reduction that is about 75 percent of the maximal benefit;
• More physical activity results in greater benefit, although the incremental benefit is less; and
• There is no evidence of excess risk over the maximal effect observed at about three to five
times the moderate-to-vigorous physical activity of the current guidelines.
When the activity is quantified by volume in terms of energy expenditure of task (MET-hours per week),
these relationships seem to hold for several modes and intensities of physical activity, including walking,
running, and biking.
Part F. Chapter 6. All-cause Mortality, Cardiovascular Mortality, and Incident Cardiovascular Disease
2018 Physical Activity Guidelines Advisory Committee Scientific Report F6-22
NEEDS FOR FUTURE RESEARCH
Several advances in our understanding of the relationships among physical activity and these outcomes
have occurred since the Physical Activity Guidelines Advisory Committee Report, 2008.1 Most of the
literature upon which the conclusions were based used survey data and questionnaire data; physical
activity exposures were assessed using self-reported estimates of time spent in aerobic continuous
moderate-to-vigorous physical activity accumulated in bouts of at least ten minutes. Therefore, all other
components across the physical activity spectrum – sedentary behavior, light-intensity physical activity,
and any moderate-to-vigorous physical activity in bouts less than 10 minutes – was considered
“baseline” physical activity. Researchers have begun to incorporate device-based measures of physical
activity into their measurement armamentarium. This has permitted assessments of the relationship of
activity of less than moderate-to-vigorous intensity with health outcomes; it has permitted the
assessment of the effects of episodes of moderate-to-vigorous physical activity of less than 10 minutes
on health outcomes. These issues are addressed in Part F. Chapter 1. Physical Activity Behaviors: Steps,
Bouts, and High Intensity Training.
More research is needed in these areas:
1. Conduct research on the role of light intensity physical activities in risk reduction for all-cause
mortality, cardiovascular disease mortality, and incident cardiovascular disease (coronary heart
disease, stroke and heart failure). This can most economically and efficiently be accomplished by
incorporating devices (pedometers or wearables) to measure physical activity into all clinical drug
trials with all-cause mortality, cardiovascular disease mortality, or incident cardiovascular disease as
outcomes.
Rationale: As reported in this chapter, the benefits of moderate-to-vigorous physical activity on all-
cause mortality, cardiovascular disease mortality, and incident cardiovascular disease (coronary
heart disease, stroke and heart failure) are well-documented and strong. However, these studies
ignore the effects of physical activity that are not characterized as moderate-to-vigorous in intensity
(i.e., light intensity). The development of device-based measures of physical activity (pedometers,
accelerometers, and other wearables) provides the scientific imperative to begin to explore the
relations of all intensities and amounts of physical activity—light- to vigorous-intensity; small to
large total amounts. These studies are beginning to appear.27-31 Unfortunately, there are not enough
studies on the relation of light-intensity physical activity, total physical activity, or step counts per
Part F. Chapter 6. All-cause Mortality, Cardiovascular Mortality, and Incident Cardiovascular Disease
2018 Physical Activity Guidelines Advisory Committee Scientific Report F6-23
day to provide enough information for meta-analyses to be performed in these areas for the
outcomes of interest here. Therefore, this is a major future research need in this area.
2. Conduct research on the possibility of increased risk associated with high amounts of physical
activity.
Rationale: Whether high amounts (volumes) of aerobic physical exercise lead to increased cardiac
morbidity or mortality is an important, yet open question. As discussed in this chapter, there is a
hint in some studies of an increase in cardiovascular risk in high-volume aerobic athletes. Recent
reports document increased coronary calcium scores in masters athletes32, 33; however, there seems
to be a U-shaped relationship with life-long volume of training.33 These findings may explain the hint
of an increased cardiovascular risk in long-term athletes. Clearly, this issue demands more study in
athletic populations.
3. Conduct research on the relative importance of the various characteristics of physical activity
exposure (total volume, intensity, frequency and mode) on all-cause mortality, cardiovascular
disease mortality, and incident cardiovascular disease (coronary heart disease, stroke and heart
failure).
Rationale: The second edition of the Physical Activity Guidelines Advisory Committee Scientific
Report, continues to rely on studies of aerobic ambulatory moderate-to-vigorous physical activity,
primarily collected via survey, to understand the relationship of physical activity to all-cause
mortality, cardiovascular disease mortality, and incident cardiovascular disease. Underexplored are
the importance of frequency and intensity relative to volume of aerobic exercise; the importance of
muscle strengthening to these clinical outcomes; whether swimming, biking, and rowing contribute
to cardiovascular health equally to aerobic ambulatory exercise; and what the energy expenditures
and programs are for these aerobic activities for equivalent clinical outcomes. If we are going to
prescribe exercise of all modalities as options for individuals who want to exercise for health, we
need better understanding of the relative contributions of a general range of options.
Part F. Chapter 6. All-cause Mortality, Cardiovascular Mortality, and Incident Cardiovascular Disease
2018 Physical Activity Guidelines Advisory Committee Scientific Report F6-24
REFERENCES
1. Physical Activity Guidelines Advisory Committee. Physical Activity Guidelines Advisory Committee Report, 2008. Washington, DC: U.S. Department of Health and Human Services; 2008.
2. U.S. Department of Health and Human Services. 2008 Physical Activity Guidelines for Americans. Washington, DC: U.S. Department of Health and Human Services; 2008.
3. Milton K, Macniven R, Bauman A. Review of the epidemiological evidence for physical activity and health from low- and middle-income countries. Glob Public Health. 2014;9(4):369-381. doi:10.1080/17441692.2014.894548.
4. Warburton DE, Charlesworth S, Ivey A, Nettlefold L, Bredin SS. A systematic review of the evidence for Canada’s Physical Activity Guidelines for Adults. Int J Behav Nutr Phys Act. 2010;7:39. doi:10.1186/1479-5868-7-39.
5. Ekelund U, Steene-Johannessen J, Brown WJ. Does physical activity attenuate, or even eliminate, the detrimental association of sitting time with mortality? A harmonized meta-analysis of data from more than 1 million men and women. Lancet. 2016;388:1302-1310. doi:10.1016/S0140-6736(16)30370-1.
6. Hamer M, Chida Y. Walking and primary prevention: a meta-analysis of prospective cohort studies. Br J Sports Med. 2008;42(4):238-243.
7. Hupin D, Roche F, Gremeaux V, et al. Even a low-dose of moderate-to-vigorous physical activity reduces mortality by 22% in adults aged ≥60 years: a systematic review and meta-analysis. Br J Sports Med. 2015;49(19):1262-1267. doi:10.1136/bjsports-2014-094306.
8. Kelly P, Kahlmeier S, Götschi T, et al. Systematic review and meta-analysis of reduction in all-cause mortality from walking and cycling and shape of dose response relationship. Int J Behav Nutr Phys Act. 2014;11:132. doi:10.1186/s12966-014-0132-x.
9. Löllgen H, Böckenhoff A, Knapp G. Physical activity and all-cause mortality: an updated meta-analysis with different intensity categories. Int J Sports Med. 2009;30(3):213-224. doi:10.1055/s-0028-1128150.
10. Samitz G, Egger M, Zwahlen M. Domains of physical activity and all-cause mortality: systematic review and dose-response meta-analysis of cohort studies. Int J Epidemiol. 2011;40(5):1382-1400. doi:10.1093/ije/dyr112.
11. Woodcock J, Franco OH, Orsini N, Robert I. Non-vigorous physical activity and all-cause mortality: systematic review and meta-analysis of cohort studies. Int J Epidemiol. 2011;40(1):121-138. doi:10.1093/ije/dyq104.
12. Arem H, Moore SC, Patel A, et al. Leisure time physical activity and mortality: a detailed pooled analysis of the dose-response relationship. JAMA Intern Med. 2015;175(6):959-967. doi:10.1001/jamainternmed.2015.0533.
13. Moore SC, Patel AV, Matthews CE. Leisure time physical activity of moderate to vigorous intensity and mortality: a large pooled cohort analysis. PLoS Med. 2012;9(11):e1001335. doi:10.1371/journal.pmed.1001335.
Part F. Chapter 6. All-cause Mortality, Cardiovascular Mortality, and Incident Cardiovascular Disease
2018 Physical Activity Guidelines Advisory Committee Scientific Report F6-25
14. O’Donovan G, Lee IM, Hamer M, Stamatakis E. Association of “weekend warrior” and other leisure time physical activity patterns with risks for all-cause, cardiovascular disease, and cancer mortality. JAMA Intern Med. 2017;177(3):335-342. doi:10.1001/jamainternmed.2016.8014.
15. Merom D, Ding D, Stamatakis E. Dancing participation and cardiovascular disease mortality: a pooled analysis of 11 population-based British cohorts. Am J Prev Med. 2016;50(6):756-760. doi:10.1016/j.amepre.2016.01.004.
16. Paffenbarger RS Jr, Wing AL, Hyde RT. Physical activity as an index of heart attack risk in college alumni. Am J Epidemiol. 1978;108(3):161-175.
17. Paffenbarger RS Jr, Hyde RT, Wing AL, Hsieh CC. Physical activity, all-cause mortality, and longevity of college alumni. N Engl J Med. 1986;314(10):605-613.
18. Wahid A, Manek N, Nichols M, et al. Quantifying the association between physical activity and cardiovascular disease and diabetes: a systematic review and meta-analysis. J Am Heart Assoc. 2016;5(9):e002495. doi:10.1161/JAHA.115.002495.
19. Diep L, Kwagyan J, Kurantsin-Mills J, Weir R, Jayam-Trouth A. Association of physical activity level and stroke outcomes in men and women: a meta-analysis. J Womens Health (Larchmt). 2010;19(10):1815-1822. doi:10.1089/jwh.2009.1708.
20. Echouffo-Tcheugui JB, Butler J, Yancy CW, Fonarow GC. Association of physical activity or fitness with incident heart failure: a systematic review and meta-analysis. Circ Heart Fail. 2015;8(5):853-861. doi:10.1161/CIRCHEARTFAILURE.115.002070.
21. Kyu HH, Bachman VF, Alexander LT, et al. Physical activity and risk of breast cancer, colon cancer, diabetes, ischemic heart disease, and ischemic stroke events: systematic review and dose-response meta-analysis for the Global Burden of Disease Study 2013. BMJ. 2016;354:i3857. doi:10.1136/bmj.i3857.
22. Pandey A, Garg S, Khunger M, et al. Dose-response relationship between physical activity and risk of heart failure: a meta-analysis. Circulation. 2015;132(19):1786-1794. doi:10.1161/CIRCULATIONAHA.115.015853.
23. Sattelmair J, Pertman J, Ding EL, Kohl HW, Haskell W, Lee IM. Dose response between physical activity and risk of coronary heart disease: a meta-analysis. Circulation. 2011;124(7):789-795. doi:10.1161/CIRCULATIONAHA.110.010710.
24. Sofi F, Capalbo A, Cesari F, Abbate R, Gensini GF. Physical activity during leisure time and primary prevention of coronary heart disease: an updated meta-analysis of cohort studies. Eur J Cardiovasc Prev Rehabil. 2008;15(3):247-257. doi:10.1097/HJR.0b013e3282f232ac.
25. Zheng G, Huang M, Liu F, Li S, Tao J, Chen L. Tai chi chuan for the primary prevention of stroke in middle-aged and elderly adults: a systematic review. Evid Based Complement Alternat Med. 2015;2015:742152. doi:10.1155/2015/742152.
26. Zheng H, Orsini N, Amin J, Wolk A, Nguyen VT, Ehrlich F. Quantifying the dose-response of walking in reducing coronary heart disease risk: meta-analysis. Eur J Epidemiol. 2009;24(4):181-192. doi:10.1007/s10654-009-9328-9.
Part F. Chapter 6. All-cause Mortality, Cardiovascular Mortality, and Incident Cardiovascular Disease
2018 Physical Activity Guidelines Advisory Committee Scientific Report F6-26
27. Bennett DA, Du H, Clarke R, et al. China Kadoorie Biobank Study Collaborative Group. Association of physical activity with risk of major cardiovascular diseases in Chinese men and women. JAMA Cardiol. 2017;2(12):1349-1358. doi:10.1001/jamacardio.2017.4069.
28. Buchner DM, Rillamas-Sun E, Di C, et al. Accelerometer-measured moderate to vigorous physical activity and incidence rates of falls in older women. J Am Geriatr Soc. 2017;65(11):2480-2487. doi:10.1111/jgs.14960.
29. LaMonte MJ, Lewis CE, Buchner DM, et al. Both light intensity and moderate-to-vigorous physical activity measured by accelerometry are favorably associated with cardiometabolic risk factors in older women: the Objective Physical Activity and Cardiovascular Health (OPACH) Study. J Am Heart Assoc. 2017;6(10). pii:e007064. doi:10.1161/JAHA.117.007064.
30. LaMonte MJ, Buchner DM, Rillamas-Sun E, et al. Accelerometer-measured physical activity and mortality in women aged 63 to 99. J Am Geriatr Soc. November 2017. doi:10.1111/jgs.15201.
31. Lee IM, Shiroma EJ, Evenson KR, Kamada M, LaCroix AZ, Buring JE. Accelerometer-measured physical activity and sedentary behavior in relation to all-cause mortality: the Women's Health Study. Circulation. November 2017. pii:CIRCULATIONAHA.117.031300. doi:10.1161/CIRCULATIONAHA.117.031300.
32. Merghani A, Maestrini V, Rosmini S, et al. Prevalence of subclinical coronary artery disease in masters endurance athletes with a low atherosclerotic risk profile. Circulation. 2017;136(2):126-137. doi:10.1161/CIRCULATIONAHA.116.026964.
33. Aengevaeren VL, Mosterd A, Braber TL, et al. Relationship between lifelong exercise volume and coronary atherosclerosis in athletes. Circulation. 2017;136(2):138-148. doi:10.1161/CIRCULATIONAHA.117.027834.