Embed Size (px)
Citation preview

This is the author manuscript accepted for publication and has undergone full peer review but
has not been through the copyediting, typesetting, pagination and proofreading process, which
may lead to differences between this version and the Version of Record. Please cite this article
as doi: 10.1111/dme.13360
This article is protected by copyright. All rights reserved
DR ELIZABETH BARR (Orcid ID : 0000-0003-4284-1716)
Article type : Research Article
Title: Diabetic Medicine
Created by: Maria Davie
Email proofs to: [email protected]
Article no.: DME-2016-00825
Article type: Research Article
Figures:0; Tables:4; Equations:0; References:
Short title/Authors running head: Diabetes, albuminuria and risk of CVD in Indigenous Australians • E. L. M. Barr et
al.
Research: Epidemiology
Associations of mortality and cardiovascular disease risks
with diabetes and albuminuria in urban Indigenous
Australians: the DRUID follow -up study
E. L. M. Barr1,2, J. Cunningham1, S. Tatipata1, T. Dunbar3, N. Kangaharan4, S.
Guthridge1,5, S. Qin Li5, J. R. Condon1, J. E. Shaw2, K. O’Dea6 and L. J. Maple-
Brown1,4
1Menzies School of Health Research, Darwin, 2Baker Heart and Diabetes Institute,
Melbourne, 3Charles Darwin University, Darwin, 4Royal Darwin Hospital, Darwin, 5Health
Auth
or
Manuscript

This article is protected by copyright. All rights reserved
Gains Planning, Northern Territory Department of Health, Darwin and 6
Accepted
University of South
Australia, Adelaide, Australia
Correspondence to: Elizabeth Barr. E-mail: [email protected]
What's new?
• The Darwin Region Urban Indigenous Diabetes (DRUID) follow-up study is one of
the few studies to assess the prospective associations of diabetes and albuminuria on
mortality and cardiovascular disease (CVD) in an urban indigenousindigenous
population.
• We showed that nearly a third of CVD events in our study population were
attributable to diabetes and 21% were attributable to albuminuria.
• Public health initiatives that aim to prevent and better manage diabetes and renal
disease could have a substantial impact on the burden of CVD in Indigenous
Australians.
Abstract
Aim To assess the relationships of diabetes and albuminuria with all-cause mortality and
cardiovascular disease outcomes in a population without prior cardiovascular disease using
data from the Darwin Region Urban Indigenous Diabetes (DRUID) study.
Methods We conducted a prospective cohort study of 706 participants (aged 15–81 years,
68% women) without prior cardiovascular disease who underwent a 75-g oral glucose
tolerance test. Deaths and fatal or non-fatal cardiovascular disease were determined over 7
years, and hazard ratios with 95% CIs and population attributable risks were estimated for
baseline glycaemia and albuminuria.
Results Compared with normoglycaemia and after adjustment for age, sex, hypertension,
dyslipidaemia and smoking, known diabetes was associated with an adjusted hazard ratio of
4.8 (95% CI 1.5–14.7) for all-cause mortality and 5.6 (95% CI 2.1–15.2) for cardiovascular
disease. Compared with normoalbuminuria, the respective adjusted risks for
macroalbuminuria were 10.9 (95% CI 3.7–32.1) and 3.9 (95% CI 1.4–10.8). After adjustment
Auth
or
Manuscript

This article is protected by copyright. All rights reserved
for all-cause mortality and cardiovascular disease, the estimated population attributable risks
for diabetes were 27% and 32%, and for albuminuria they were 32% and 21%, respectively.
Conclusions In our study population, the burden of mortality and cardiovascular disease was
largely driven by diabetes and albuminuria. This finding on the influence of diabetes and
albuminuria is consistent with reports in other high-risk indigenous populations and should be
better reflected in risk scores and intervention programmes.
Introduction
Cardiovascular disease (CVD) incidence in high-income countries is decreasing [1], but
remains a major public health issue for many indigenous populations, including Indigenous
Australians who have experienced rapid social and lifestyle change [2]. The primary
prevention of CVD largely focuses on the reduction of well-established risk factors such as
smoking, hypertension, hyperlipidaemia and diabetes [3]; however, in indigenous people the
pattern of CVD risk is often dominated by high prevalence of diabetes and renal disease
compared with other risk factors [2]. In Australia, diabetes prevalence is as high as 30% in
some Indigenous communities [4], and prevalence of end-stage renal disease is 10–15 times
higher among Indigenous than non-Indigenous Australians [5]. There is limited evidence with
regard to the longitudinal associations of diabetes [6–10] and albuminuria [9–11] with CVD
outcomes specifically for indigenous populations. Findings from large meta-analyses on
diabetes [12,13] and renal disease [14] are largely based on European and Asian populations,
and do not provide any specific information on indigenous people.
Within Australia, most studies of CVD risks and outcomes have been conducted in remote
settings [9,10,15], but the majority of Indigenous Australians live in urban areas [5]. Factors
related to CVD, such as prevalence of diabetes and renal disease [4,16] and healthcare access,
[17] differ according to remoteness. It is therefore important to improve our understanding of
the contribution of these risk factors to mortality and CVD risk among urban Indigenous
populations.
The Darwin Region Urban Indigenous Diabetes (DRUID) study is an observational study
established to address the lack of information on the burden of diabetes and related conditions
in Indigenous Australians living in an urban setting [18]. Baseline findings showed that a
third of participants aged ≥35 years, and half of those aged ≥55 years had diabetes. The
prevalence of CVD risk factors in this population was very high, even among young adults
Auth
or
Manuscript

This article is protected by copyright. All rights reserved
without diabetes, with nearly half of those aged < 35 years having at least two CVD risk
factors [19]. In the present study, we looked beyond well-established traditional CVD risk
factors and examined the contributions of diabetes and albuminuria to the risk of all-cause
mortality and development of CVD over a 7-year follow-up period in people without a
history of CVD at baseline. A
uth
or
Manuscript

This article is protected by copyright. All rights reserved
Participants and Methods
Study population
The DRUID study included men and women who identified as Indigenous Australians living
in and around Darwin, a city in Northern Australia [18]. Between 2003 and 2005, 1004
volunteers aged ≥15 years participated in baseline examinations, which represented ~14% of
the estimated target population. Compared with census data, the study population
underrepresented men, but no substantial differences in age, place of residence, Indigenous
group or household income were observed [18].
In 2012, information on fatal and non-fatal CVD and all-cause mortality outcomes was
obtained. Of the 1004 participants at baseline, there were 968 participants who did not have a
prior CVD event (we excluded 29 with a prior CVD event and seven because their CVD
status could not be established). Of these 968 participants, we excluded 229 because data on
the variables under examination were not complete. Specifically, participants were excluded
from the all-cause mortality analysis because they: did not identify as Indigenous Australians
at follow-up (n=3); were reported as deceased but could not be identified on the National
Death Index in Australia (n=5); were pregnant at baseline (n=6); had not fasted (n=75); had
missing data for diabetes classification (n=54) or missing urine albumin to creatinine ratio
data (n=26); had missing total cholesterol data (n=3); had missing systolic blood pressure
data (n=1); had missing information on smoking status (n=56); or did not give consent to
follow-up on the National Death Index (n=33; Table S1). For the fatal or non-fatal CVD
analysis we excluded an additional 47 participants: those with no consent for data linkage and
medical records review (n=13), and those who did not have medical record information and
either did not consent to hospital data linkage (n=11), or could not be found on the hospital
databases (n=23).
Participants provided informed consent and the ethics committees of the Northern Territory
Department of Health and Menzies School of Health Research (including the Aboriginal sub
committee), the South Australian Health Department, the South Australian Aboriginal Health
Council and the Australian Institute of Health and Welfare approved the study. The DRUID
study Indigenous Steering Group provided Indigenous leadership, and comprised Indigenous
Australians from the Darwin region.
Auth
or
Manuscript

This article is protected by copyright. All rights reserved
Measurements
Participants provided a fasting (>8 h) blood sample. Plasma glucose [fasting and after 75-g
oral glucose tolerance test (OGTT)], total cholesterol, triglycerides, HDL cholesterol and
high-sensitivity C-reactive protein (hsCRP; measured using a Hitachi 917 device; Roche,
Basel, Switzerland) were assessed. HbA1c
Glycaemia was classified as: known diabetes mellitus: reported physician diagnosis of
diabetes or taking diabetes medication; newly diagnosed diabetes: fasting plasma glucose
≥7.0 mmol/l or 2-h post-load plasma glucose ≥11.1 mmol/l; impaired fasting glucose, if
fasting plasma glucose was ≥6.1 mmol/l and <7.0 mmol/l and 2-h plasma glucose was <11.1
mmol/l; impaired glucose tolerance, if fasting plasma glucose was <7.0 mmol/l and 2-h
plasma glucose was ≥ 7.8 mmol/l and <11.1 mmol/l; and normoglycaemia if fasting plasma
glucose was <6.1 mmol/l and 2-h plasma glucose <7.8 mmol/l [20]. HbA
was measured as a percentage of total
haemoglobin after separation by ion-exchange chromatography on a Pharmacia Mono-S
column (results traceable to the Diabetes Control and Complications Trial method).
Creatinine (modified kinetic Jaffé reaction measured using a Hitachi 917 device) and albumin
(immunonephelometry using a Beckman Coulter Array 360; Beckman Coulter, Brea, CA,
USA) were measured from a random urine sample. Samples were assayed at a central
laboratory. Seated blood pressure using an automatic monitor (Welch Allyn Medical
Products, Skaneateles Falls, CA, USA) and anthropometrics (weight, height, waist and hip
circumferences) were taken. Self-reported smoking, household income and education were
recorded.
1c was also used to
classify glycaemia at baseline as follows: normoglycaemia, HbA1c <39 mmol/mol (<5.7%);
intermediate hyperglycaemia, HbA1c ≥39 to <48 mmol/mol (≥5.7% to <6.5%); and diabetes,
HbA1c ≥48 mmol/mol (≥6.5%) or previously known diabetes [21]. Microalbuminuria was
defined as a urine albumin to creatinine ratio of 3–30 mg/mmol and macroalbuminuria was
defined as a urine albumin to creatinine ratio of >30 mg/mmol [22]. Serum creatinine was
used to calculate the estimated glomerular filtration rate (eGFR) according to the Chronic
Kidney Disease Epidemiology Collaboration formula, and eGFR was categorized as ≥90, 60–
90 or <60 ml/min/1.73m2
Follow-up and outcomes
[23]. Auth
or
Manuscript
This article is protected by copyright. All rights reserved
For all-cause mortality, the person-time denominator was date of death from any cause minus
the date of baseline examination, and for fatal or non-fatal CVD, the person-time
denominator was the date of first fatal or non-fatal CVD event minus the date of baseline
examination. We censored events at 31 December 2011. Deaths were obtained using data
linkage to the National Death Index. Causes of death were coded from death certificates
according to International Classification of Diseases (ICD) codes used by the Australian
Bureau of Statistics. CVD death was defined as cases in which the underlying cause of death
was coded I10-I25, I46.1, I48, I50-I99 or R96 (ICD-10). Non-fatal CVD outcomes were
obtained by two methods. Firstly, discharge diagnoses ICD-10 (or equivalent ICD-9) codes
for myocardial infarction (I21-I23), stroke (I06-I64) and relevant procedure codes for
percutaneous transluminal coronary angioplasty or coronary artery bypass surgery, and
admission dates were extracted from centralized databases in the Northern Territory and
South Australia using data linkage. Secondly, participants were invited to complete a survey
and report on hospitalizations for 'heart attack, stroke or heart surgery (stent or bypass)'. Two
physicians [L.M.-B. (endocrinologist) and N.K. (cardiologist)] reviewed medical records to
adjudicate self-reported CVD events according to the WHO criteria for myocardial infarction
[24] and stroke [25], and operation reports for percutaneous transluminal coronary
angioplasty and coronary artery bypass surgery. Data linkage used probabilistic matching of
participants using personal identifiers (names, gender, date of birth and addresses).
Statistical analyses
One-way analysis of variance, chi-squared tests and t-tests for independent groups were used
as appropriate to compare baseline characteristics (1) between those who consented to
follow-up and those who did not consent to follow-up (among those who would otherwise
have been included), (2) between those who had died and those who remained alive, and (3)
between those who experienced a fatal or non-fatal CVD outcome and those who did not.
Cox proportional hazards regression was used to estimate the all-cause mortality and CVD
hazard ratio (HR) and 95% CI for baseline CVD risk factors. Age was the time scale. To
evaluate the contribution of glycaemia and albuminuria to all-cause mortality and CVD, the
relationships were evaluated after adjusting for well-established CVD risk factors commonly
identified as targets for the primary prevention of CVD: sex, smoking, hypertension (≥140/90
mmHg or anti-hypertensive medication use), total cholesterol to HDL lipoprotein ratio
(logarithmic transformed continuous), as well as logarithmic transformed urine albumin to
Auth
or
Manuscript

This article is protected by copyright. All rights reserved
creatinine ratio for glycaemic status, and glycaemic status for categories of albuminuria. A
final model that grouped participants into four groups according to glycaemia (based on the
OGTT method [20]) and albuminuria was also assessed, whereby the adjusted mortality and
CVD risks of participants with (1) abnormal glycaemia and no albuminuria, (2)
normoglycaemia and albuminuria, and (3) both abnormal glycaemia and albuminuria, who
were compared to a group with no glycaemia and no albuminuria. Multivariate models were
adjusted for all covariates simultaneously; however, to examine the potential impact of model
overfitting on our results, sensitivity analyses were also undertaken to assess the individual
effects of each covariate on the age- and sex-adjusted all-cause mortality and CVD risks
associated with glycaemia or albuminuria, respectively, and results are presented in Tables S2
and S3. Proportional hazards assumptions were satisfied as assessed with graphs of log–log
plots of the relative hazards by time and by scaled Schoenfeld residuals. The prevalence of
risk factors in this cohort, and age- (time scale) and sex-adjusted HR (model 1), as well as
multivariate-adjusted HR (model 2) were used to estimate the population attributable risk
(PARs) of known diabetes and albuminuria for all-cause mortality and fatal or non-fatal CVD
using the following formula, which accounts for the multi-level nominal variable for the five
mutually exclusive categories of glucose intolerance [26]: ���� =��(��� − 1)
1 + ∑ ��(��� − 1)��=1
where Pi is the proportion of individuals in the ith of x groups (x= 5 groups for glycaemic
status: 1=normoglycaemia, 2=impaired fasting glucose, 3=impaired glucose tolerance,
4=newly diagnosed diabetes and 5= known diabetes; and x = 2 for albuminuria: 1=no
albuminuria and 2=microalbuminuria or macroalbuminuria) and HRi
Results
is the adjusted mortality
or CVD HR in each of these groups compared with that of those with normoglycaemia or no
albuminuria, respectively. Analyses were performed with STATA statistical software (version
14.2; StataCorp, College Station, TX, USA).
All -cause mortality and cardiovascular disease incidence rates
The median follow-up of 706 participants was 7.6 years. There were 30 deaths [5.7 per 1000
person-years (5.0 per 1000 for women and 7.2 per 1000 for men)]. The underlying causes of
death were CVD (20%), cancer (13%), diabetes (13%), external causes (23%), other causes
(20%) and undetermined (13%). Fatal and non-fatal CVD follow-up was available for 659
Auth
or
Manuscript
This article is protected by copyright. All rights reserved
participants without a history of CVD at baseline, with 33 CVD events [6.7 per 1000 person-
years (6.0 per 1000 person-years for women and 8.4 per 1000 person years for men)].
Compared with participants who were included in the mortality follow-up analysis (n=706),
those not consenting (but who would otherwise have been included; n=33) had a younger
mean age and lower risk profile, reflecting this age differential. In comparison with those
included in the analysis, those excluded as a result of incomplete baseline data (primarily
from not having a fasting blood test or OGTT) had a slightly lower mean age, similar
smoking status, slightly lower mean blood pressure, BMI and waist circumference, but
similar urine albumin to creatinine ratio (Table S1). Table 1 shows that participants who died
or had a CVD event during the follow-up were older, more likely to be men and had a worse
risk profile than those who remained alive.
Risk for all -cause mortality
In unadjusted analyses, baseline risk factors for all-cause mortality included: impaired fasting
glucose; impaired glucose tolerance; known diabetes; HbA1c ≥48 mmol/mol or known
diabetes; albuminuria; low eGFR; and hypertension. Of the 30 deaths, 14 participants had
either newly diagnosed diabetes or known diabetes, and 14 participants had either micro- or
macroalbuminuria at baseline. After adjusting for age and sex, strong associations remained
for known diabetes, HbA1c ≥48 mmol/mol or known diabetes, macroalbuminuria and low
eGFR (Table 2). The mortality rates for known diabetes and macroalbuminuria were 20.6 and
44.8 per 1000 person-years, respectively (Table 3). After further adjustment for hypertension,
total cholesterol:HDL and smoking, baseline known diabetes was associated with a nearly
fivefold risk, and macroalbuminuria with an elevenfold risk of all-cause mortality (Table 3).
When glycaemia was based on HbA1c, the adjusted all-cause mortality HR for known
diabetes or an HbA1c ≥48 mmol/mol (≥6.5%) was 2.9 (95% CI 1.1–7.5) compared with an
HbA1c <39 mmol/mol (<5.7%). When glycaemic status (based on the OGTT) and
albuminuria were modelled together in multivariate models, HR estimates remained stronger
for albuminuria than for known diabetes, although the 95% CIs overlapped (Table 3).
Furthermore, we showed that the risk for all-cause mortality was very high when
hyperglycaemia and albuminuria coexisted (Table 4). The age- (time-scale) and sex-adjusted
PAR for all-cause mortality was 27% for known diabetes relative to normolycaemia, and
32% for albuminuria relative to no albuminuria. These PARs remained unchanged after
multivariate analysis.
Auth
or
Manuscript

This article is protected by copyright. All rights reserved
Fatal or non-fatal cardiovascular disease
In unadjusted analyses, baseline impaired fasting glucose, impaired glucose tolerance, HbA1c
39–47 mmol/mol, known diabetes, HbA1c ≥48 mmol/mol or known diabetes, albuminuria,
low eGFR, hypertension, high total cholesterol, high hsCRP, dyslipidaemia, high
triglycerides, large waist circumference, no post-school qualifications and a lower household
income were associated with an increased risk of CVD (Table 2). Of the 33 CVD events, 19
participants had either newly diagnosed or known diabetes at baseline, and 15 participants
had micro- or macro-albuminuria at baseline. After adjusting for age and sex, known
diabetes, HbA1c
The CVD event incidence rates for known diabetes and macroalbuminuria were 30.0 and
38.1 per 1000 person-years, respectively (Table 3). In multivariate analyses, those with
known diabetes at baseline had a fivefold risk of CVD compared to those with
normoglycaemia, and this strong association remained after adjusting for albuminuria (Table
3). When glycaemia was based on HbA
≥48 mmol/mol or known diabetes, micro- and macro-albuminuria, hsCRP
≥3.5 mg/l, dyslipidaemia (HDL <1.0 mmol/l and triglycerides ≥2.0 mmol/l) and having lower
or not stated householder income remained associated with CVD (Table 2); however, after
inclusion of baseline glycaemia in these age- and sex-adjusted models, associations of hsCRP
and dyslipidaemia with CVD were attenuated (data not shown). Interestingly, the associations
of low income (HR 6.7, 95% CI 1.4– 30.8) or not stated/missing income (HR 5.3, 95% CI
1.1–25.1) with CVD remained strong after adjusting for baseline glycaemia or albuminuria
and the other common risk factors included in our multivariate analysis, although
considerable uncertainty was demonstrated by the wide CIs.
1c the adjusted CVD HR for known diabetes or HbA1c
≥48 mmol/mol (≥6.5%) was 2.7 (95% CI 1.1–6.4) compared with an HbA1c
Sensitivity analyses showed that adjusting for individual baseline CVD risk factors had little
effect on the strength of the age- and sex-adjusted all-cause mortality and CVD associations
for diabetes and albuminuria (Tables S2 and S3). The age- (time scale) and sex-adjusted and
multivariate-adjusted PARs for fatal or non-fatal CVD were 34% and 32%, respectively, for
<39 mmol/mol
(<5.7%). The association between macroalbuminuria with CVD outcomes compared with
normoalbuminuria was attenuated in multivariate analyses (Table 3). Furthermore, compared
to those without either glycaemia or albuminuria, those with only one of albuminuria or
glycaemia had a five- to sixfold increase in the risk of CVD, and those participants with both
albuminuria and glycaemia had an eightfold risk of CVD (Table 4). Auth
or
Manuscript

This article is protected by copyright. All rights reserved
known diabetes relative to normoglycaemia, and 27% and 21%, respectively, for albuminuria
relative to no albuminuria.
Discussion
The DRUID follow-up study shows that the burden of all-cause mortality and CVD in this
high-risk urban population of Indigenous Australians is largely driven by diabetes and
albuminuria. Diabetes conferred a mortality and CVD risk that was four to five times greater
than in those with normoglycaemia, and although the CIs were wide for albuminuria with
respect to CVD risk, participants with albuminuria had an 11 times greater risk of all-cause
mortality compared with those without albuminuria. These strong associations observed for
diabetes and albuminuria were independent of smoking, hypertension and total cholesterol to
HDL cholesterol ratio. Furthermore, participants with both diabetes and albuminuria at
baseline had very high risks of both all-cause mortality and CVD compared to participants
without either condition. The burden of CVD in this urban population of Indigenous
Australians was not only driven by a high prevalence of diabetes and CVD risk factors [19],
but also by the very strong associations of diabetes with CVD. This is reflected in our PAR
estimates, which showed that nearly a third of CVD events were attributable to diabetes in
this population. It is possible, however, that the PAR estimates for diabetes in this population
overestimate the PAR of diabetes in the target urban Indigenous population. Recent survey
data from the Australian Bureau of Statistics indicate that the prevalence of diabetes in urban
Indigenous Australians is ~8% [16], which is lower than our reported 13%. Such a lowering
of prevalence would inevitably lower the PAR; however, diabetes prevalence from the
Australian Bureau of Statistics would have misclassified diabetes cases with isolated 2-h
glucose elevations, as the Australian Bureau of Statistics examination did not measure 2-h
plasma glucose.
The mortality and CVD risk associations for diabetes observed in this urban population of
Indigenous Australians were much higher than those reported for diabetes in other
populations of predominantly European ancestry [12,27] and for North American Indigenous
populations [6]; however, these strong associations of diabetes with all-cause mortality and
CVD were similar to those reported in high-risk Asian populations [13] and a New Zealand
Maori population [8]. The four- to fivefold risks for diabetes with mortality and CVD were
independent of hypertension, smoking and total cholesterol to HDL cholesterol ratio, and
higher than those reported in other Australian Indigenous cohorts from urban [7] and remote
Auth
or
Manuscript

This article is protected by copyright. All rights reserved
settings [9]. Relative risk estimates for diabetes may have been weakened in other studies of
Indigenous Australians that did not define normoglycaemia with an OGTT as we have been
able to do, and as such, the reference group may have included those with intermediate
hyperglycaemia on post-load plasma glucose [7,9]. Indeed, when we classified baseline
glycaemia with HbA1c, the estimated HR for all-cause mortality and CVD attributed to
diabetes was lower than that observed for diabetes based on the OGTT. We found that among
those who died and were classified as having normoglycaemia on HbA1c (<39 mmol/mol or
<5.7%), 40% of these participants had a 2-h plasma glucose level ≥7.8 mmol/l. This may
have diminished the relative difference in mortality risk between HbA1c
The higher relative risks for all-cause mortality and CVD observed for individuals with
diabetes in the present cohort may provide some evidence that diabetes is more aggressive
and/or insufficiently managed in Indigenous Australians. This supports the findings from
other studies. Recently, another Australian study showed that, among patients with type 2
diabetes, Indigenous Australians had a much worse risk factor profile compared with non-
Indigenous people [28]. Additionally, Canadian studies have shown similar medical care gaps
for First Nation people compared with their non-indigenous counterparts [29]. Alternatively,
because the relative risk of diabetes tends to decrease with increasing age [30], our higher
relative risks may reflect the younger cohort in the present study.
groups in
comparison to the OGTT-based glycaemic groups. Furthermore, previous work has shown
that half of the cases of newly diagnosed diabetes at baseline would not have been detected
without the OGTT [19].
In the present urban study, we found strong associations between both micro- and macro-
albuminuria with all-cause mortality. Albuminuria also increased the risk of CVD outcomes,
although risks were attenuated when we adjusted for other CVD risk factors, particularly
when multivariate models included more continuously measured covariates (Model 6, Table
S3). Other data from a remote Indigenous Australian community have had similar findings,
and showed that, compared with normoalbuminuria, micro- and macro-albuminuria increased
the risk of coronary heart disease by two to three times, and that these relationships were
independent of age, sex and traditional risk factors [15]. Interestingly, the strong associations
observed between albuminuria and mortality remained after including glycaemic status in the
multivariate models. This concurs with a study in Pima Indians in the USA, which showed
Auth
or
Manuscript

This article is protected by copyright. All rights reserved
that the all-cause mortality rates increased with kidney disease, irrespective of diabetes status
[31].
In the present study, high hsCRP level, a combination of low HDL cholesterol and high
triglycerides, and low income also had strong associations with CVD outcomes after
adjusting for age and sex, but were attenuated when modelled with glycaemia, demonstrating
the known associations between these metabolic factors and diabetes [20]. The presence of
both albuminuria and abnormal glycaemia conferred greater risks of all-cause mortality and
CVD than either condition in isolation. This supports the findings of another study from a
remote setting [9]. Together, these results highlight the considerable independent impact that
these risk factors have on total mortality and CVD in Indigenous Australians.
The following limitations need to be considered. First, the generalizability of these findings
to the wider urban Indigenous population is limited by the self-selection of participants to the
study, the original cohort representing 14% of the estimated target population, which
underrepresented men [18], and the follow-up analyses being based on ~70% of the original
cohort. Whether these selection biases led to over- or under-estimation of the relative risk
estimates and PARS presented here for diabetes and albuminuria is not known. Second, we
were not able to assess the influence of intra-individual variation in baseline risk factors, as
measurements were only taken on one occasion; however, any measurement imprecision
would have been random, leading to attenuation of study findings. Nevertheless, our findings
on the associations between diabetes and albuminuria with mortality and CVD are consistent
with other observational studies [9,15]. Finally, our multivariate models have a low ratio of
events per predictor variable, and this may have led to inadequate adjustment for confounding
factors and inaccurate inferences from the relationships observed; however, sensitivity
analyses showed that the all-cause mortality and CVD risk estimates for abnormal glycaemia
and albuminuria were similar, even with individual adjustment of covariates (Tables S2 and
S3).
In this high-risk population of Indigenous Australians, we have provided additional evidence
on the significance of both diabetes and albuminuria on the risk of subsequent all-cause
mortality and CVD outcomes in an urban population. We showed that relative risk estimates
for diabetes based on an OGTT are marked in this population, and given that nearly a third of
CVD events were attributable to diabetes and 22% were attributable to albuminuria, public
health initiatives aiming to prevent and better manage diabetes and renal disease could have a
Auth
or
Manuscript

This article is protected by copyright. All rights reserved
substantial impact on the burden of CVD in Indigenous Australians. This finding on the
influence of diabetes and albuminuria largely concurs with that reported in other high-risk
indigenous populations and suggests that risk equations for this population need to be
evaluated to adequately account for the dominant effects of diabetes and macroalbuminuria.
The present study further highlights the importance of the management of diabetes and
albuminuria in addition to traditional risk factors in the prevention of premature mortality and
CVD in this high-risk population.
Funding sources
E.L.M.B. is supported by a National Health and Medical Research Council (NHMRC)
Training Research Fellowship (APP1016612); J.C. is supported by a NHMRC Senior
Research Fellowship (#1058244 and #545200); L.M.-B. is supported by a NHMRC
Practitioner Fellowship (#1078477); J.E.S. is supported by a NHMRC Senior Research
Fellowship (APP 1079438). The baseline DRUID study was funded by NHMRC Project
Grant (236207), with additional support from the Australian Government Department of
Employment and Workplace Relations, the Clive and Vera Ramaciotti Foundation, the
Vincent Fairfax Family Foundation, the International Diabetes Institute (AusDiab
Partnership), and Bayer HealthCare, and was an in-kind project of the Cooperative Research
Centre for Aboriginal Health. The DRUID follow-up study was funded by a Diabetes
Australia Research Trust General Grant, a Northern Territory Research and Innovation Board
Grant, and an NHMRC programme grant (631947), and in-kind support was provided by the
Northern Territory Department of Health. Funding sources played no role in the study design,
in the collection, analysis and interpretation of the data, in the writing of the manuscript, or in
the decision to submit the manuscript for publication.
Competing interests
None declared.
Acknowledgements
The authors gratefully acknowledge the support of DRUID study participants, study staff,
database management unit, members of the Indigenous Steering Group, and all partner
organizations. We are also grateful to the SA NT Data Link team and the South Australian
Department of Health for the data linkage undertaken in South Australia.
Auth
or
Manuscript
This article is protected by copyright. All rights reserved
References
1.Yusuf S, McKee M. Documenting the global burden of cardiovascular disease: a major
achievement but still a work in progress. Circulation 2014; 129:1459–1462.
2.International Diabetes Federation. Expert meeting on Indigenous Peoples Report, Diabetes
and Development Report. Copenhagen: International Diabetes Federation, 2012.
3.Yusuf S, Hawken S, Ounpuu S, Dans T, Avezum A, Lanas F et al. Effect of potentially
modifiable risk factors associated with myocardial infarction in 52 countries (the
INTERHEART study): case-control study. Lancet 2004; 364:937–952.
4.Minges KE, Zimmet P, Magliano DJ, Dunstan DW, Brown A, Shaw JE. Diabetes
prevalence and determinants in Indigenous Australian populations: A systematic review.
Diabetes Res Clin Pract 2011; 93:139–149.
5.Australian Institute of Health and Welfare (AIHW). The health and welfare of Australia's
Indigenous People. Cat No. IHW 147. Canberra: AIHW, 2015.
6.Lu W, Resnick HE, Jain AK, Adams-Campbell LL, Jablonski KA, Gottlieb AM et al.
Effects of isolated post-challenge hyperglycemia on mortality in American Indians: the
Strong Heart Study. Ann Epidemiol 2003; 13:182–188.
7.Bradshaw PJ, Alfonso HS, Finn JC, Owen J, Thompson PL. Coronary heart disease events
in Aboriginal Australians: incidence in an urban population. Med J Aust 2009; 190:583–586.
8.Brewer N, Wright CS, Travier N, Cunningham CW, Hornell J, Pearce N et al. A New
Zealand linkage study examining the associations between A1C concentration and mortality.
Diabetes Care 2008; 31:1144–1149.
9.McDermott RA, McCulloch B, Li M. Glycaemia and albuminuria as predictors of coronary
heart disease in Aboriginal and Torres Strait Islander adults: a north Queensland cohort. Med
J Aust 2011; 194:514–518.
10.Luke JN, Brown AD, Brazionis L, O'Dea K, Best JD, McDermott RA et al. Exploring
clinical predictors of cardiovascular disease in a central Australian Aboriginal cohort. Eur J
Prev Cardiol 2013; 20:246–253.
Auth
or
Manuscript
This article is protected by copyright. All rights reserved
11.Wang W, Lee ET, Fabsitz RR, Devereux R, Best L, Welty TK et al. A longitudinal study
of hypertension risk factors and their relation to cardiovascular disease: the Strong Heart
Study. Hypertension 2006; 47:403–409.
12.The DECODE study group on behalf of the European Diabetes Epidemiology Group.
Glucose tolerance and cardiovascular mortality: comparison of fasting and 2-hour diagnostic
criteria. Arch Intern Med 2001; 161:397–405.
13.Nakagami T. Hyperglycaemia and mortality from all causes and from cardiovascular
disease in five populations of Asian origin. Diabetologia 2004; 47:385–394.
14.Matsushita K, van der Velde M, Astor BC, Woodward M, Levey AS, de Jong PE et al.
Association of estimated glomerular filtration rate and albuminuria with all-cause and
cardiovascular mortality in general population cohorts: a collaborative meta-analysis. Lancet
2010; 375:2073–2081.
15.Wang Z, Hoy WE. Albuminuria and incident coronary heart disease in Australian
Aboriginal people. Kidney Int 2005; 68:1289–1293.
16.Australian Bureau of Statistics. Australian Aboriginal and Torres Strait Islander Health
Survey: Biomedical Results, 2012-13 (4727.0.55.003). Canberra: Australian Bureau of
Statistics, 2014.
17.Australian Institute of Health and Welfare (AIHW). Spatial variation in Aboriginal and
Torres Strait Islander people's access to primary health care (IHW 155). Canberra: AIHW,
2015.
18.Cunningham J, O'Dea K, Dunbar T, Weeramanthri T, Zimmet P, Shaw J. Study protocol–
diabetes and related conditions in urban indigenous people in the Darwin, Australia region:
aims, methods and participation in the DRUID Study. BMC Public Health 2006; 6:8.
19.O'Dea K, Cunningham J, Maple-Brown L, Weeramanthri T, Shaw J, Dunbar T et al.
Diabetes and cardiovascular risk factors in urban Indigenous adults: Results from the DRUID
study. Diabetes Res Clin Pract 2008; 80:483–489.
20.World Health Organization and International Diabetes Federation. Definition and
diagnosis of diabetes mellitus and intermediate hyperglycaemia. Geneva: WHO, 2006.
21.American Diabetes A. Diagnosis and classification of diabetes mellitus. Diabetes Care
2011; 34 (Suppl. 1):S62–69.
Auth
or
Manuscript

This article is protected by copyright. All rights reserved
22.KDIGO 2012 Clinical Practice Guideline for the Evaluation and Management of Chronic
Kidney Disease. Kidney Int Suppl 2013; 3.
23.Inker LA, Schmid CH, Tighiouart H, Eckfeldt JH, Feldman HI, Greene T et al. Estimating
glomerular filtration rate from serum creatinine and cystatin C. N Engl J Med 2012; 367:20–
29.
24.Mendis S, Thygesen K, Kuulasmaa K, Giampaoli S, Mahonen M, Ngu Blackett K, et al.
World Health Organization definition of myocardial infarction: 2008-09 revision. Int J
Epidemiol 2011; 40:139–146.
25.WHO MONICA Project Investigators. The World Health Organisation MONICA Project
(Monitoring trends and determinants in cardiovascular disease). J Clin Epidemiol 1998;
41:105–114.
26.Ferrannini E, Massari M, Nannipieri M, Natali A, Ridaura RL, Gonzales-Vill alpando C.
Plasma glucose levels as predictors of diabetes: the Mexico City diabetes study. Diabetologia
2009; 52:818–824.
27.Barr EL, Zimmet PZ, Welborn TA, Jolley D, Magliano DJ, Dunstan DW et al. Risk of
cardiovascular and all-cause mortality in individuals with diabetes mellitus, impaired fasting
glucose, and impaired glucose tolerance: the Australian Diabetes, Obesity, and Lifestyle
Study (AusDiab). Circulation 2007; 116:151–157.
28.Davis TM, Hunt K, McAullay D, Chubb SA, Sillars BA, Bruce DG et al. Continuing
disparities in cardiovascular risk factors and complications between aboriginal and Anglo-
Celt Australians with type 2 diabetes: the Fremantle Diabetes Study. Diabetes Care 2012;
35:2005–2011.
29.Harris SB, Naqshbandi M, Bhattacharyya O, Hanley AJ, Esler JG, Zinman B et al. Major
gaps in diabetes clinical care among Canada's First Nations: results of the CIRCLE study.
Diabetes Res Clin Pract 2011; 92:272–279.
30.Saydah SH, Eberhardt MS, Loria CM, Brancati FL. Age and the burden of death
attributable to diabetes in the United States. Am J Epidemiol 2002; 156:714–719.
31.Pavkov ME, Bennett PH, Sievers ML, Krakoff J, Williams DE, Knowler WC et al.
Predominant effect of kidney disease on mortality in Pima Indians with or without type 2
diabetes. Kidney Int 2005; 68:1267–1274.
Auth
or
Manuscript
This article is protected by copyright. All rights reserved
Supporting information
Additional Supporting Information may be found in the online version of this article:
Table S1. Baseline characteristics according to data availability and consent status for
mortality follow-up among participants without a prior history of CVD at baseline: the
DRUID study.
Table S2. Risk of all-cause mortality according to baseline glycaemia status and baseline
albuminuria, adjusting for individual co-variates and comparing multivariate models: the
DRUID follow-up study
Table S3. Risk of fatal or non-fatal CVD according to baseline abnormal glycaemia and
albuminuria, adjusting for individual covariates and comparing different multivariate models:
the DRUID follow-up study.
Auth
or
Manuscript

This article is protected by copyright. All rights reserved
Table 1 Baseline characteristics according to cardiovascular disease and all-cause mortality outcomes: the DRUID study
All -cause mortality Fatal and non-fatal CVD events
Alive Dead Total
No CVD Yes CVD Total
n 676 30 706
626 33 659
Age, years 36 (14) 48 (17) 37 (14)
36 (14) 51 (11) 36 (15)
Women, n (%) 463 (68) 18 (60) 481 (68)
430 (69) 20 (61) 450 (68)
Normal glycaemiaa, n (%) 473 (70) 9 (30) 482 (68)
440 (70) 7 (21) 447 (68)
Impaired fasting tolerance, n (%) 22 (3) 2 (7) 24 (3)
21 (3) 2 (6) 23 (3)
Impaired glucose tolerance, n (%) 70 (10) 5 (17) 75 (11)
64 (10) 5 (15) 69 (10)
Newly diagnosed diabetes, n (%) 38 (6) 1 (3) 39 (6)
35 (6) 2 (6) 37 (6)
Previously diagnosed diabetes, n (%) 73 (11) 13 (43) 86 (12)
66 (11) 17 (52) 83 (13)
Fasting glucose, mmol/l 5.1 (4.8, 5.7) 5.9 (5.1, 8.1) 5.2 (4.8, 5.8)
5.1 (4.8, 5.7) 6.4 (5.4, 10.1) 5.2 (4.8, 5.8)
2-h glucose , mmol/l 6.0 (5.0, 7.4) 5.6 (4.7, 8.0) 6.0 (5.0, 7.4)
5.9 (4.9, 7.4) 8.1 (5.7, 10.9) 6.0 (4.9, 7.4)
HbA 1c , mmol/mol 34 (31, 40) 44 (36, 67) 34 (31, 40) 34 (31, 40) 44 (40, 68) 34 (31, 40)
HbA 1c, % 5.3 (5.0, 5.8) 6.2 (5.4, 8.3) 5.3 (5.0, 5.8) 5.3 (5.0, 5.7) 6.2 (5.7, 8.4) 5.3 (5.0, 5.8)
No albuminuriab , n (%) 590 (87) 16 (53) 606 (86)
546 (87) 18 (55) 564 (86)
Microalbuminuria, n (%) 69 (10) 7 (23) 76 (11)
62 (10) 9 (27) 71 (11)
Macroalbuminuria, n (%) 17 (3) 7 (23) 24 (3)
18 (3) 6 (18) 24 (4)
Urine albumin to creatinine ratio, mg/l 0.6 (0.3, 1.2) 1.7 (0.6, 23.5) 0.6 (0.3, 1.3)
0.6 (0.4, 1.2) 2.0 (0.5, 23.3) 0.6 (0.4, 1.3)
CKD-EPI eGFR categoriesc
≥90 ml/min/1.73m2 554 (82) 9 (30) 563 (80) 505 (81%) 18 (55%) 523 (79%)
60–90 ml/min/1.73m2 115 (17) 18 (60) 133 (19) 114 (18%) 13 (39%) 127 (19%)
<60 ml/min/1.73m2 7 (1) 3 (10) 10 (1) 7 (1%) 2 (6%) 9 (1%)
Non-smoker, n (%) 226 (33) 6 (20) 232 (33)
206 (33) 10 (30) 216 (33)
Ex-smoker, n (%) 155 (23) 11 (37) 166 (24)
150 (24) 5 (15) 155 (24)
Current smoker, n (%) 295 (44) 13 (43) 308 (44)
270 (43) 18 (55) 288 (44)
Systolic blood pressure, mmHg 116.1 (15.1) 125.8 (25.3) 116.5 (15.8)
115.6 (15.1) 133.1 (22.1) 116.5 (16.0)
Diastolic blood pressure, mmHg 73.4 (9.9) 75.5 (9.4) 73.5 (9.9)
73.0 (9.8) 80.3 (11.2) 73.4 (10.0)
Hypertensiond, n (%) 115 (17) 12 (40) 127 (18)
104 (17) 17 (52) 121 (18)
Total cholesterol, mmol/l 5.0 (1.1) 4.9 (1.2) 5.0 (1.1)
5.0 (1.0) 5.6 (1.4) 5.0 (1.1)
HDL cholesterol, mmol/l 1.2 (0.3) 1.1 (0.3) 1.2 (0.3)
1.2 (0.3) 1.1 (0.3) 1.2 (0.3)
Au
tho
r M
an
uscrip
t

This article is protected by copyright. All rights reserved
hsCRP, mg/l 3.4 (1.3, 7.5) 4.8 (1.9, 11.5) 3.4 (1.3, 7.7)
3.4 (1.2, 7.4) 5.5 (4.2, 11.5) 3.4 (1.3, 7.7)
Dyslipidaemiae, n (%) 102 (15) 6 (20) 108 (15)
91 (15) 10 (30) 101 (15)
Triglycerides, mmol/l 1.4 (1.0, 2.0) 1.7 (1.3, 3.4) 1.4 (1.0, 2.0)
1.4 (1.0, 2.0) 2.1 (1.5, 2.9) 1.4 (1.0, 2.0)
BMI, kg/m2 28.6 (7.0) 28.8 (8.5) 28.6 (7.1)
28.4 (7.1) 30.2 (6.3) 28.5 (7.0)
Mean waist circumference, cm 94.9 (16.7) 98.6 (16.7) 95.1 (16.7)
94.6 (16.6) 103.2 (14.1) 95.0 (16.6)
Insufficient fruit and vegetable intakef, n (%) 626 (93) 29 (97) 655 (93)
578 (93) 31 (94) 609 (93)
No post-school qualifications, n (%) 373 (55) 19 (63) 392 (56)
344 (55) 25 (76) 369 (56)
Weekly household income <AUD$199, n (%) 153 (23) 11 (37) 164 (23)
145 (23) 13 (39) 158 (24)
AUD$200–499, n (%) 215 (32) 6 (20) 221 (31)
197 (31) 9 (27) 206 (31)
≥AUD$500, n (%) 167 (25) 4 (13) 171 (24)
149 (24) 2 (6) 151 (23)
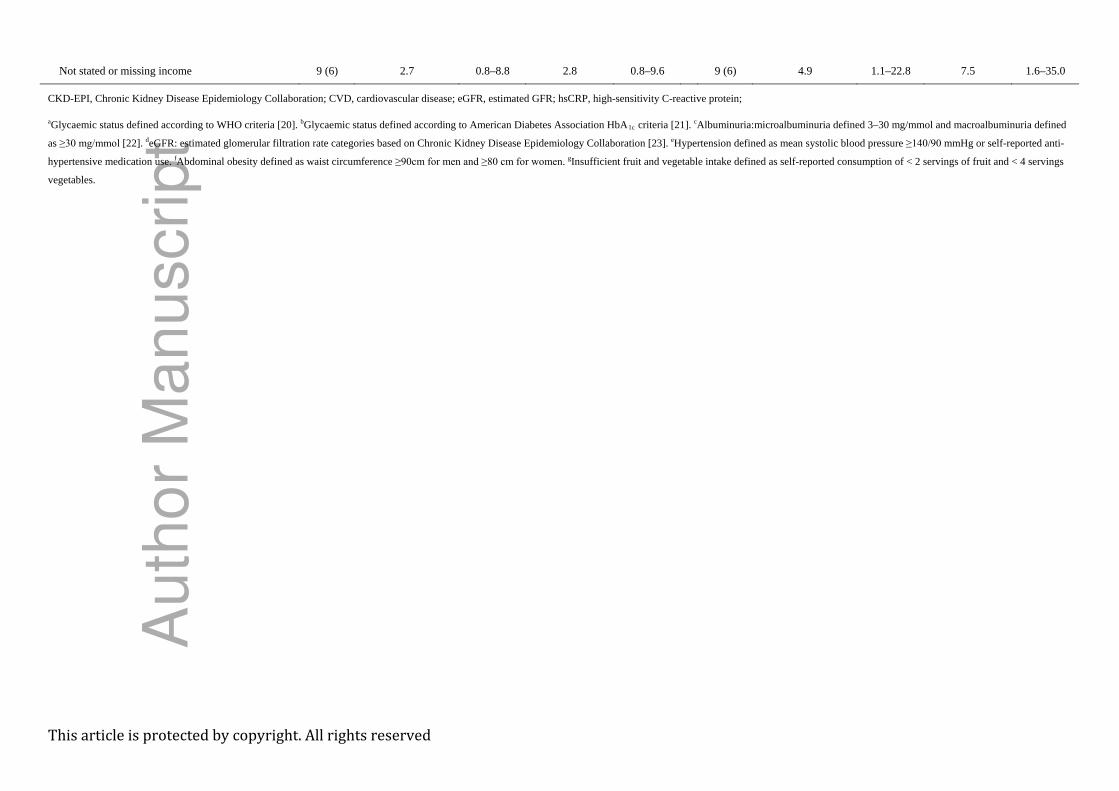
Not stated or missing, n (%) 141 (21) 9 (30) 150 (21)
135 (22) 9 (27) 144 (22)
CKD-EPI, Chronic Kidney Disease Epidemiology Collaboration; CVD, cardiovascular disease; eGFR, estimated GFR; hsCRP, high-sensitivity C-reactive protein.
For continuous variables data are mean (standard deviation) or median (25th, 75th percentiles), and for discrete variables data are numbers (%). aGlycaemic status defined according to WHO criteria [20]. bAlbuminuria: microalbuminuria
defined as 3--30 mg/mmol and macroalbuminuria defined as ≥30 mg/mmol [22]. dHypertension defined as mean systolic blood pressure ≥140/90 mmHg or self-reported anti-hypertensive medication use. eDyslipidaemia defined as HDL
<1.0 and Triglycerides ≥2.0 mmol/l. f
Insufficient fruit and vegetable intake defined as self-reported consumption of <2 servings of fruit and <4 servings vegetables.
Table 2 Unadjusted and age adjusted all-cause mortality and cardiovascular disease risks according to baseline risk factors: the DRUID study
All -cause mortality
Fatal and non-fatal CVD events
Deaths Unadjusted HR 95% CI
Age and sex
adjusted HR 95% CI
CVD Unadjusted HR 95% CI
Age and sex
adjusted HR 95% CI
n (%) n (%)
Normal glycaemiaa 9 (2) 1.0
1.0
7 (2) 1.0
1.0
Impaired fasting glucose 2 (8) 4.6 1.0–21.3 3.7 0.7–18.2
2 (9) 5.8 1.2–28.1 3.3 0.7–16.3
Impaired glucose tolerance 5 (7) 3.6 1.2–10.7 2.6 0.8–8.6
5 (7) 4.7 1.5–14.8 2.7 0.8–8.7
Newly diagnosed diabetes 1 (3) 1.4 0.2–10.8 1.0 0.1–8.1
2 (5) 3.5 0.7–16.8 1.7 0.3–8.3
Known diabetes 13 (15) 8.5 3.6–20.0 4.8 1.6–14.3
17 (20) 14.5 6.0–35.0 6.4 2.4–16.5
HbA1c <39 mmol/mol (<5.7%) 12 (2) b 1.0 1.0 10 (2) 1.0 1.0
HbA1c 4 (5) 39-47 mmol/mo (5.7–6.5%)l 2.0 0.6–6.1 1.6 0.5–5.2 6 (8) 3.7 1.3–10.0 1.8 0.6–5.2
Known diabetes or HbA1c 14 (12) ≥48 mmol/mol (≥6.5%) 5.4 2.5–11.6 3.0 1.2–7.5 17 (15) 7.8 3.6–17.0 3.3 1.4–7.8
Normal albuminuriac 16 (3) 1.0
1.0
18 (3) 1.0
1.0
Microalbuminuria 7 (9) 3.6 1.5–8.7 2.7 1.1–6.9
9 (13) 4.1 1.8–9.1 2.9 1.3–6.5
Au
tho
r M
an
uscrip
t

This article is protected by copyright. All rights reserved
Macroalbuminuria 7 (29) 13.5 5.6–33.0 9.7 3.7–25.8
6 (25) 8.9 3.5–22.5 5.3 2.0–13.7
eGFR ≥90 ml/min/1.73m 9 (2) 2 d 1.0 1.0 18 (3) 1.0 1.0
eGFR 60-90 ml/min/1.73m 18 (14) 2 8.8 3.9–19.5 6.7 2.4–19.0 13 (10) 3.1 1.5–6.2 1.1 0.5–2.4
eGFR <60 ml/min/1.73m 3 (30) 2 22.2 6.0–82.0 21.1 4.7–94.8 2 (22) 7.1 1.7–30.7 2.7 0.6–12.6
Non-smoker 6 (3) 1.0
1.0
10 (5) 1.0
1.0
Ex-smoker 11 (7) 2.6 1.0–7.0 2.2 0.8–6.1
5 (3) 0.7 0.2–2.0 0.6 0.2–1.7
Smoker 13 (4) 1.6 0.6–4.3 2.0 0.7–5.3
18 (6) 1.4 0.6–3.0 1.4 0.6–3.2
No hypertension 18 (3) 1.0
1.0
16 (3) 1.0
1.0
Hypertension 12 (9) e 3.1 1.5–6.4 1.2 0.5–2.9
17 (14) 4.9 2.5–9.8 1.9 0.9–4.1
Total cholesterol <5.5 mmol/l 21 (4)
15 (3) 1.0
1.0
Total cholesterol ≥5.5 mmol/l 9 (4) 0.9 0.4–1.9 0.8 0.4–1.8
18 (9) 2.7 1.4–5.5 1.8 0.9–3.6
HDL ≥1.0 mmol/l 20 (4) 1.0
1.0
22 (5) 1.0
1.0
HDL <1.0 mmol/l 10 (5) 1.1 0.5–2.4 1.3 0.6–2.8
11 (6) 1.4 0.7–2.8 1.4 0.7–3.0
hsCRP <3.5 mg/l 11 (3) 1.0
1.0
7 (2) 1.0
1.0
hsCRP ≥3.5 mg/l 19 (5) 1.8 0.8–3.7 1.8 0.8–4.2
26 (8) 3.9 1.7–8.9 2.7 1.1–6.3
No dyslipidaemia 24 (4) 1.0
1.0
23 (4) 1.0
1.0
HDL cholesterol <1.0 and triglycerides ≥2.0
mmol/l 6 (6) 1.4 0.6–3.3 1.3 0.5–3.3
10 (10) 2.5 1.2–5.2 2.2 1.0–4.8
Triglycerides <2.0 mmol/l 19 (4) 1.0
1.0
16 (3) 1.0
1.0
Triglycerides ≥ 2.0 mmol/l 11 (6) 1.5 0.7–3.2 1.1 0.5–2.4
17 (10) 2.9 1.5–5.8 1.7 0.9–3.5
Normal BMI ≥18.5 and < 23 kg/m 5 (4) 2 1.0
1.0
4 (4) 1.0
1.0
BMI <18.5 kg/m 3 (10) 2 2.6 0.6–11.0 4.3 0.9–20.8
1 (4) 1.0 0.1–8.8 2.3 0.2–21.6
BMI 23–27 kg/m 5 (3) 2 0.7 0.2–2.4 0.6 0.2–2.3
3 (2) 0.5 0.1–2.4 0.4 0.1–1.8
BMI ≥27 kg/m 16 (4) 2 0.9 0.3–2.6 0.7 0.2–2.1
25 (7) 1.9 0.7–5.5 1.0 0.3–2.8
Normal waist circumference 5 (3) 1.0
1.0
4 (2) 1.0
1.0
Obese waist circumferencee 23 (5) 1.7 0.7–4.5 1.2 0.4–3.5
29 (6) 2.8 1.0–7.9 1.1 0.4–3.2
Sufficient fruit and vegetable intake 1 (2) 1.0
1.0
2 (4) 1.0
1.0
Insufficient fruit and vegetable intake 29 (4) g 2.3 0.3–16.5 3.4 0.5–25.6
31 (5) 1.2 0.3–5.2 1.7 0.4–7.2
Post-school qualifications 11 (4) 1.0
1.0
8 (3) 1.0
1.0
No qualifications after school 19 (5) 1.4 0.7–2.9 1.1 0.5–2.4
25 (7) 2.5 1.1–5.5 1.9 0.8–4.2
≥AUD$500 household weekly income 4 (2) 1.0
1.0
2 (1) 1.0
1.0
AUD$1-199 household weekly income 11 (7) 3.1 1.0–9.8 2.7 0.8–8.8
13 (8) 6.6 1.5–29.3 7.3 1.6–33.1
AUD$200–499 household weekly income 6 (3) 1.2 0.3–4.1 0.7 0.2–2.7
9 (4) 3.4 0.7–15.8 3.1 0.7–14.5
Au
tho
r M
an
uscrip
t
This article is protected by copyright. All rights reserved
Not stated or missing income 9 (6) 2.7 0.8–8.8 2.8 0.8–9.6
9 (6) 4.9 1.1–22.8 7.5 1.6–35.0
CKD-EPI, Chronic Kidney Disease Epidemiology Collaboration; CVD, cardiovascular disease; eGFR, estimated GFR; hsCRP, high-sensitivity C-reactive protein;
aGlycaemic status defined according to WHO criteria [20]. bGlycaemic status defined according to American Diabetes Association HbA1c criteria [21]. cAlbuminuria:microalbuminuria defined 3–30 mg/mmol and macroalbuminuria defined
as ≥30 mg/mmol [22]. deGFR: estimated glomerular filtration rate categories based on Chronic Kidney Disease Epidemiology Collaboration [23]. eHypertension defined as mean systolic blood pressure ≥140/90 mmHg or self-reported anti-
hypertensive medication use. fAbdominal obesity defined as waist circumference ≥90cm for men and ≥80 cm for women. gInsufficient fruit and vegetable intake defined as self-reported consumption of < 2 servings of fruit and < 4 servings
vegetables.A
uth
or
Ma
nu
scrip
t

This article is protected by copyright. All rights reserved
Table 3 Adjusted risk of all-cause mortality and cardiovascular disease according to baseline glucose tolerance and albuminuria: the DRUID study
All -cause mortality Fatal or non-fatal CVD
Model 1 Model 2 Model 1 Model 2
Deaths
n (%)
Mortality rates
(per 1000 person-
years)
HR 95% CI HR 95% CI CVD
n (%)
CVD incidence
rates (per 1,000
person-years)
HR 95% CI HR 95% CI
Normal glycaemia 9 (2) a 2.5 (1.3–4.8) 1.0 1.0 7 (2) 2.1 (1.0–4.4) 1.0 1.0
Impaired fasting glucose* 2 (8) 11.4 (2.8–45.5) 3.5 0.7–17.3 2.7 0.5–13.8 2 (9) 12.0 (3.0–48.1) 3.0 0.6–15.0 2.5 0.5–12.4
Impaired glucose tolerance* 5 (7) 8.9 (3.7–21.3) 2.4 0.7–8.1 2.2 0.6–7.8 5 (7) 9.7 (4.0–23.3) 2.5 0.8–8.2 2.5 0.8–8.2
Newly diagnosed diabetes* 1 (3) 3.4 (0.5–24.1) 0.8 0.1–7.2 0.8 0.1–6.6 2 (5) 7.3 (1.8–29.2) 1.1 0.2–5.6 1.0 0.2–5.0
Known diabetes mellitus* 13 (15) 20.6 (12.0–35.5) 4.8 1.5–14.7 3.3 1.1–10.0 17 (21) 30.0 (18.7–48.3) 5.6 2.1–15.2 4.6 1.7–12.5
Normal albuminuria 16 (3) b 3.5 (2.1–5.7) 1.0 1.0 18 (3) 4.3 (2.7–6.8) 1.0 1.0
Microalbuminuria** 7 (9) 12.4 (5.9–26.1) 2.9 1.1–7.7 2.8 1.1–7.4 9 (13) 17.5 (9.1–33.7) 2.5 1.1–5.7 2.4 1.0–5.4
Macroalbuminuria** 7 (29) 44.8 (21.4–94.0) 10.9 3.7–32.1 9.2 3.0–27.8 6 (25) 38.1 (17.1–84.8) 3.9 1.4–10.8 3.1 1.1–8.7
CVD, cardiovascular disease; HR, hazard ratio. aGlycaemic status defined according to WHO criteria [20]. b
Model 1: adjusted for age (time-scale), sex, hypertension (≥140/90 mmHg or anti-hypertensive medication use), total cholesterol:HDL (continuous) and smoking.
Albuminuria: microalbuminuria defined 3–30 mg/mmol and macroalbuminuria defined as ≥30 mg/mmol [22].
Model 2: adjusted for all variables in Model 1 plus urine albumin creatinine ratio* or glycaemic status**
Au
tho
r M
an
uscrip
t

This article is protected by copyright. All rights reserved
Table 4 Risk of all-cause mortality and cardiovascular disease according to baseline abnormal glycaemia and albuminuria combined: the DRUID study
All -cause mortality Fatal or non-fatal CVD
Model 1 Model 2 Model 1 Model 2
Deaths
n (%)
Mortality rates
(per 1,000 person
years) HR 95% CI HR 95% CI
CVD
n (%)
CVD incidence
rates (per 1,000
person years) HR 95% CI HR 95% CI
Normal glycaemia and no
albuminuria
7 (2) 2.1 (1.0–4.5) 1.0 1.0
3 (1) 1.0 (0.3–3.1) 1.0 1.0
Abnormal glycaemiaa and
no albuminuria
9 (5) 7.0 (3.6–13.4) 2.2 0.7–6.9 2.0 0.6–6.7
15 (9) 12.7 (7.6–21.0) 6.1 1.7–21.8 5.2 1.4–19.0
Normal glycaemia and
micro- or macro-
albuminuria
2 (4)
b
5.9 (1.5–23.5) 2.8 0.6–13.9 2.9 0.6–14.5
4 (9) 12.1 (4.5–32.2) 8.7 1.9–39.7 6.3 1.3–29.9
Both abnormal glycaemiaa
and micro- and macro-
albuminuriab
12 (22) 31.7 (18.0–55.9) 9.1 3.0–27.8 9.8 3.0–32.4
11 (22) 32.4 (18.0–58.5) 14.1 3.8–51.8 8.4 2.1–34.4
Glycaemic status defined according to WHO criteria [20]; Albuminuria: microalbuminuria defined 3-30 mg/mmol and macroalbuminuria defined as ≥30 mg/mmol [22] aAbnormal glycaemia defined as having either impaired fasting glucose, impaired glucose tolerance or diabetes. b
Model 1 adjusted for age (time-scale) and sex.
Albuminuria: microalbuminuria defined 3-30 mg/mmol and macroalbuminura defined as ≥30 mg/mmol.
Model 2 adjusted for age (time-scale), sex, systolic blood pressure (continuous), total cholesterol (continuous), HDL (continuous), anti-hypertensive medication and smoking
Au
tho
r M
an
uscrip
t
Minerva Access is the Institutional Repository of The University of Melbourne
Author/s:Barr, ELM;Cunningham, J;Tatipata, S;Dunbar, T;Kangaharan, N;Guthridge, S;Li, SQ;Condon,JR;Shaw, JE;O'Dea, K;Maple-Brown, LJ
Title:Associations of mortality and cardiovascular disease risks with diabetes and albuminuria inurban Indigenous Australians: the DRUID follow-up study
Date:2017-07-01
Citation:Barr, E. L. M., Cunningham, J., Tatipata, S., Dunbar, T., Kangaharan, N., Guthridge, S.,Li, S. Q., Condon, J. R., Shaw, J. E., O'Dea, K. & Maple-Brown, L. J. (2017). Associationsof mortality and cardiovascular disease risks with diabetes and albuminuria in urbanIndigenous Australians: the DRUID follow-up study. DIABETIC MEDICINE, 34 (7),pp.946-957. https://doi.org/10.1111/dme.13360.
Persistent Link:http://hdl.handle.net/11343/292906