Embed Size (px)
Citation preview

Slide No 1
CSE5351 (Part 1)UTA Copyright (c)
CSE5351: Parallel Procesisng
Part 1B

Slide No 2
CSE5351 (Part 1)UTA Copyright (c)
State of the Art In Supercomputing
Several of the next slides (or modified) are the courtesy of Dr. Jack Dongarra, a distinguished professor of Computer Science at the University of Tennessee.
Slide No 3
CSE5351 (Part 1)UTA Copyright (c) 3
What is meant by performance?
What is a xflop/s?• xflop/s is a rate of execution, some number of floating point operations
per second.
• Whenever this term is used it will refer to 64 bit floating point operations and the operations will be either addition or multiplication.
What is the theoretical peak performance?• The theoretical peak is based not on an actual performance from a
benchmark run, but on a paper computation to determine the theoretical peak rate of execution of floating point operations for the machine.
• The theoretical peak performance is determined by counting the number of floating-point additions and multiplications (in full precision) that can be completed during a period of time, usually the cycle time of the machine.
• For example, an Intel Xeon 5570 quad core at 2.93 GHz can complete 4 floating point operations per cycle or a theoretical peak performance of11.72 GFlop/s per core or 46.88 Gflop/s for the socket.
Slide No 4
CSE5351 (Part 1)UTA Copyright (c)
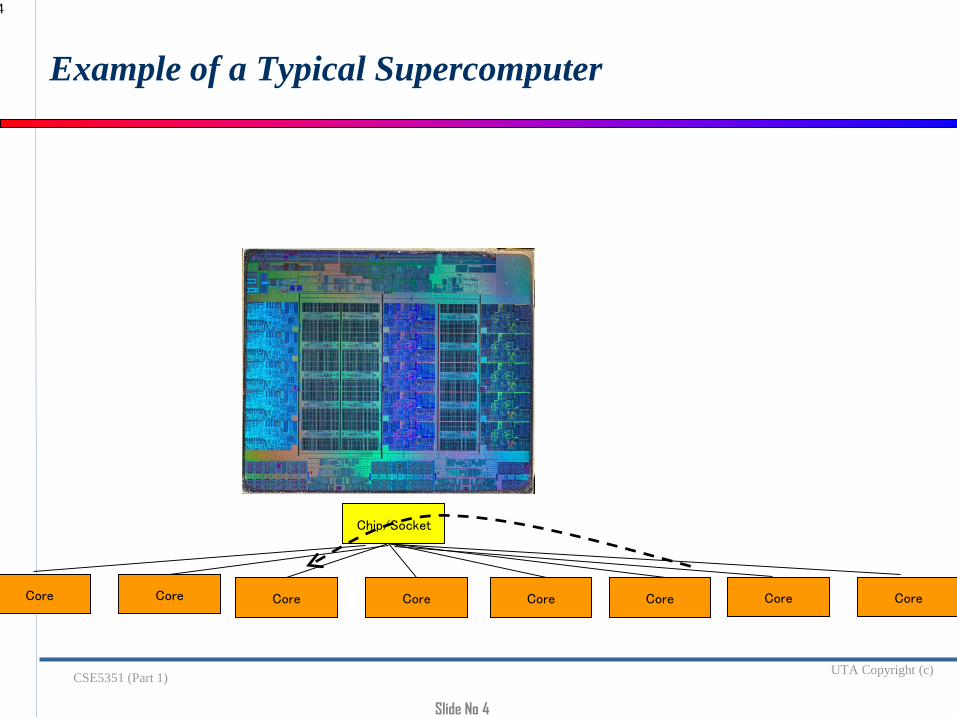
Example of a Typical Supercomputer
Chip/Socket
Core Core Core Core
4
Core CoreCore Core

Slide No 5
CSE5351 (Part 1)UTA Copyright (c)
Node/Board
Chip/Socket Chip/SocketChip/Socket… GPUGPUGPU
Example of a Typical Supercomputer
Chip/Socket
Core Core Core Core5 Core CoreCore Core

Slide No 6
CSE5351 (Part 1)UTA Copyright (c)
Cabinet
Node/Board Node/BoardNode/Board
Chip/Socket Chip/SocketChip/Socket
…
Shared memory programming between processes on a board anda combination of shared memory and distributed memory programming
between nodes and cabinets
… GPUGPUGPU
Example of a Typical Supercomputer
Chip/Socket
Core Core Core Core6 Core CoreCore Core

Slide No 7
CSE5351 (Part 1)UTA Copyright (c)
Switch
Cabinet Cabinet Cabinet
Node/Board Node/BoardNode/Board
Chip/Socket Chip/SocketChip/Socket
…
…
Combination of shared memory and distributed memory programming
… GPUGPUGPU
Example of a Typical Supercomputer
Chip/Socket
Core Core Core Core7 Core CoreCore Core
Slide No 8
CSE5351 (Part 1)UTA Copyright (c)
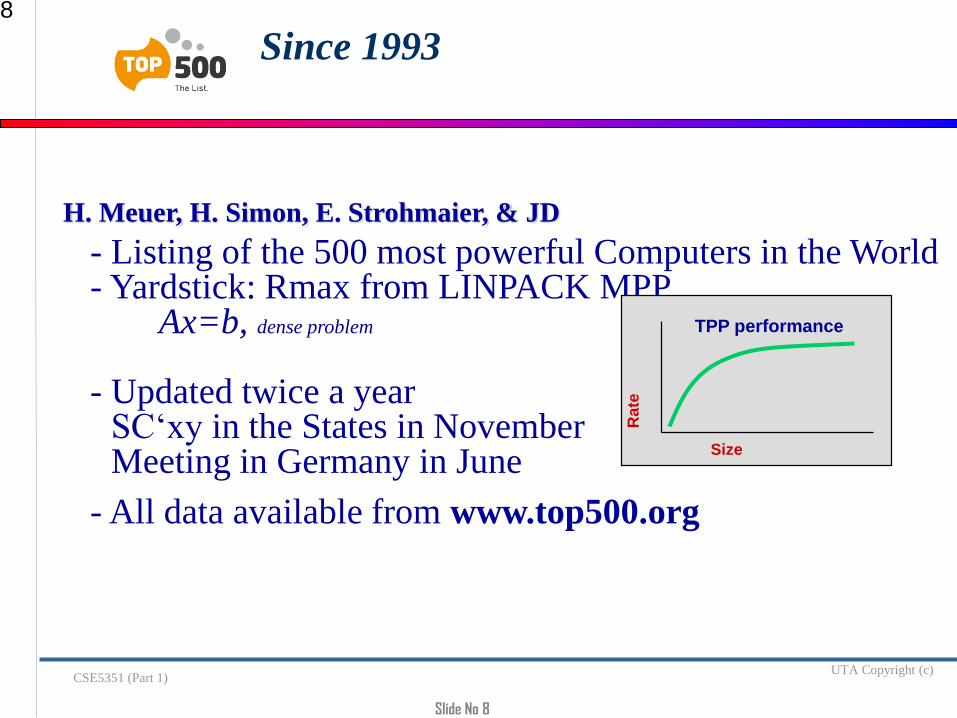
Since 1993 8
H. Meuer, H. Simon, E. Strohmaier, & JD
- Listing of the 500 most powerful Computers in the World- Yardstick: Rmax from LINPACK MPP
Ax=b, dense problem
- Updated twice a yearSC‘xy in the States in NovemberMeeting in Germany in June
- All data available from www.top500.org
Size
Ra
te
TPP performance
Slide No 9
CSE5351 (Part 1)UTA Copyright (c)
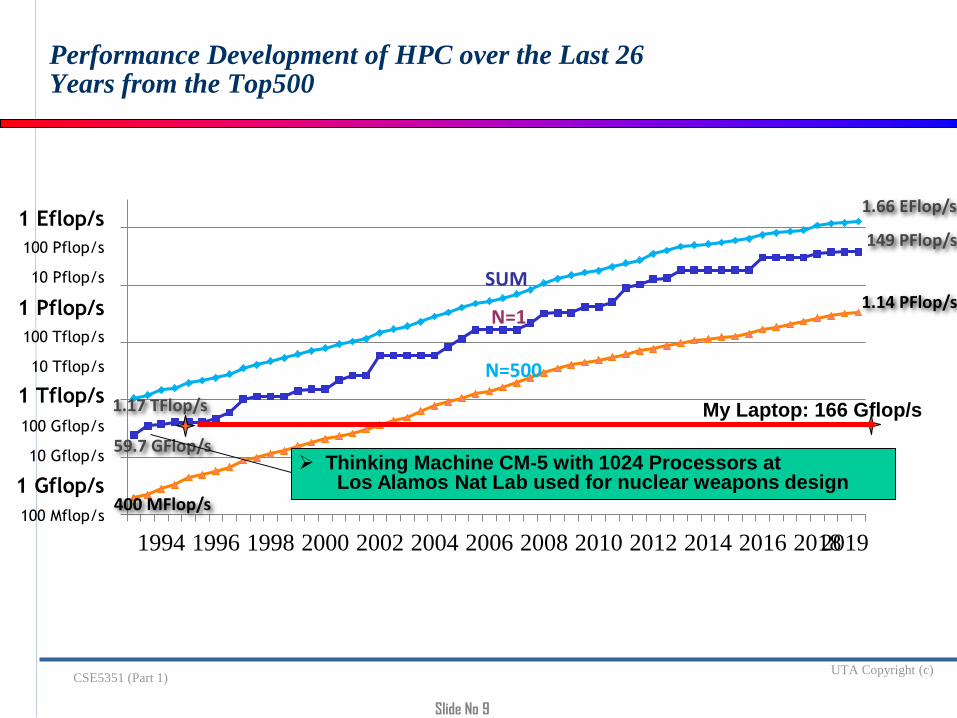
Performance Development of HPC over the Last 26 Years from the Top500
0.1
10
1000
100000
10000000
1E+09
1994 1996 1998 2000 2002 2004 2006 2008 2010 2012 2014 2016 20182019
59.7 GFlop/s
400 MFlop/s
1.17 TFlop/s
149 PFlop/s
1.14 PFlop/s
1.66 EFlop/s
SUM
N=1
N=500
1 Gflop/s
1 Tflop/s
100 Mflop/s
100 Gflop/s
100 Tflop/s
10 Gflop/s
10 Tflop/s
1 Pflop/s
100 Pflop/s
10 Pflop/s
1 Eflop/s
My Laptop: 166 Gflop/s
Thinking Machine CM-5 with 1024 Processors at Los Alamos Nat Lab used for nuclear weapons design

Slide No 10
CSE5351 (Part 1)UTA Copyright (c)
Performance Development
1.00E-01
1.00E+01
1.00E+03
1.00E+05
1.00E+07
1.00E+09
1.00E+11
19941996199820002002200420062008201020122014201620182020
SUM
N=1
N=50059.7 GFlop/s
422 MFlop/s
1.17 TFlop/s
149 PFlop/s
1.14 PFlop/s
1.66 EFlop/s
1 Gflop/s
1 Tflop/s
100 Mflop/s
100 Gflop/s
100 Tflop/s
10 Gflop/s
10 Tflop/s
1 Pflop/s
100 Pflop/s
10 Pflop/s
1 Eflop/s
100 Eflop/s
10 Eflop/s
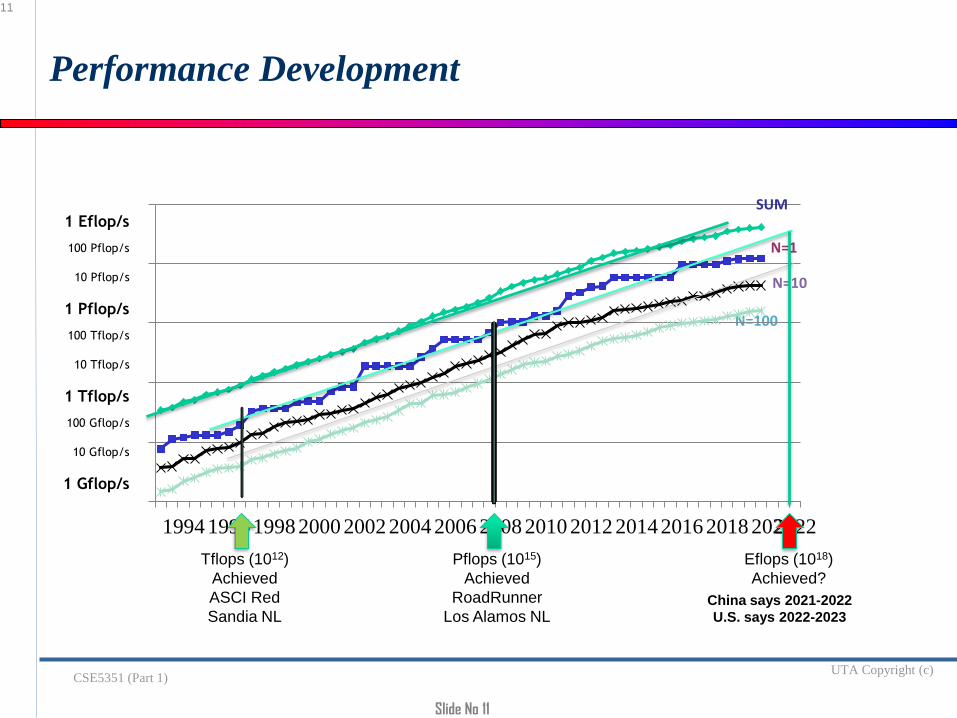
Slide No 11
CSE5351 (Part 1)UTA Copyright (c)
N=100
N=10
Performance Development
1
100
10000
1000000
100000000
1E+10
1994 1996 1998 2000 2002 2004 2006 2008 2010 2012 2014 2016 2018 20202022
SUM
N=1
1 Gflop/s
1 Tflop/s
100 Gflop/s
100 Tflop/s
10 Gflop/s
10 Tflop/s
1 Pflop/s
100 Pflop/s
10 Pflop/s
1 Eflop/s
Tflops (1012)
Achieved
ASCI Red
Sandia NL
Pflops (1015)
Achieved
RoadRunner
Los Alamos NL
Eflops (1018)
Achieved?
11
China says 2021-2022
U.S. says 2022-2023
Slide No 12
CSE5351 (Part 1)UTA Copyright (c)
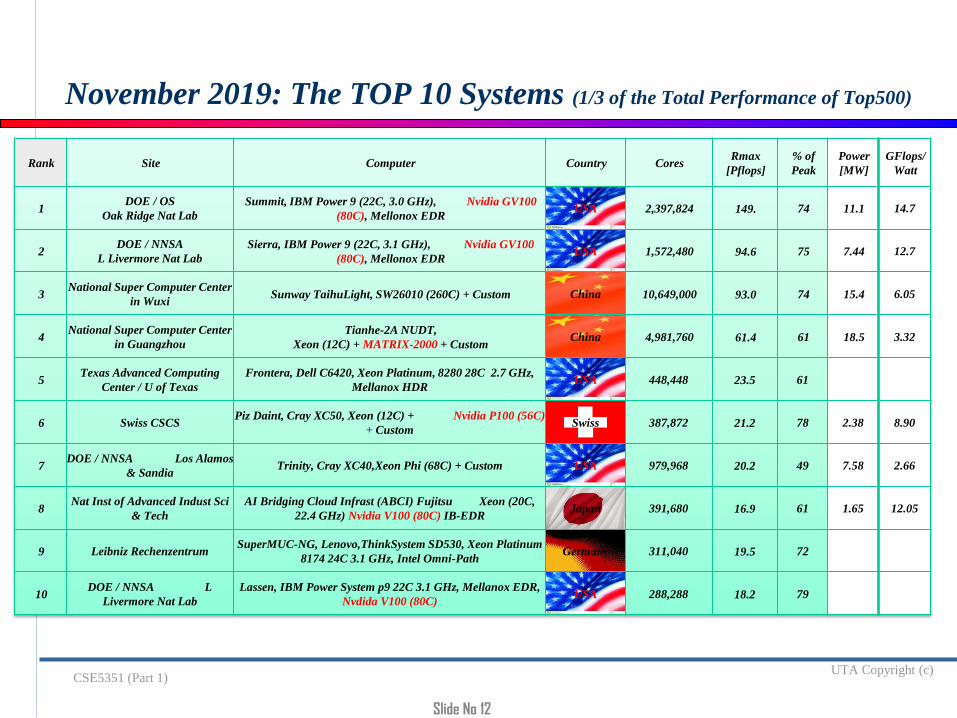
November 2019: The TOP 10 Systems (1/3 of the Total Performance of Top500)
Rank Site Computer Country CoresRmax
[Pflops]
% of
Peak
Power
[MW]
GFlops/
Watt
1DOE / OS
Oak Ridge Nat Lab
Summit, IBM Power 9 (22C, 3.0 GHz), Nvidia GV100
(80C), Mellonox EDRUSA 2,397,824 149. 74 11.1 14.7
2DOE / NNSA
L Livermore Nat Lab
Sierra, IBM Power 9 (22C, 3.1 GHz), Nvidia GV100
(80C), Mellonox EDRUSA 1,572,480 94.6 75 7.44 12.7
3National Super Computer Center
in WuxiSunway TaihuLight, SW26010 (260C) + Custom China 10,649,000 93.0 74 15.4 6.05
4National Super Computer Center
in Guangzhou
Tianhe-2A NUDT,
Xeon (12C) + MATRIX-2000 + CustomChina 4,981,760 61.4 61 18.5 3.32
5Texas Advanced Computing
Center / U of Texas
Frontera, Dell C6420, Xeon Platinum, 8280 28C 2.7 GHz,
Mellanox HDRUSA 448,448 23.5 61
6 Swiss CSCSPiz Daint, Cray XC50, Xeon (12C) + Nvidia P100 (56C)
+ CustomSwiss 387,872 21.2 78 2.38 8.90
7DOE / NNSA Los Alamos
& Sandia Trinity, Cray XC40,Xeon Phi (68C) + Custom USA 979,968 20.2 49 7.58 2.66
8Nat Inst of Advanced Indust Sci
& Tech
AI Bridging Cloud Infrast (ABCI) Fujitsu Xeon (20C,
22.4 GHz) Nvidia V100 (80C) IB-EDRJapan 391,680 16.9 61 1.65 12.05
9 Leibniz RechenzentrumSuperMUC-NG, Lenovo,ThinkSystem SD530, Xeon Platinum
8174 24C 3.1 GHz, Intel Omni-PathGermany 311,040 19.5 72
10DOE / NNSA L
Livermore Nat Lab
Lassen, IBM Power System p9 22C 3.1 GHz, Mellanox EDR,
Nvdida V100 (80C)USA 288,288 18.2 79

Slide No 13
CSE5351 (Part 1)UTA Copyright (c)
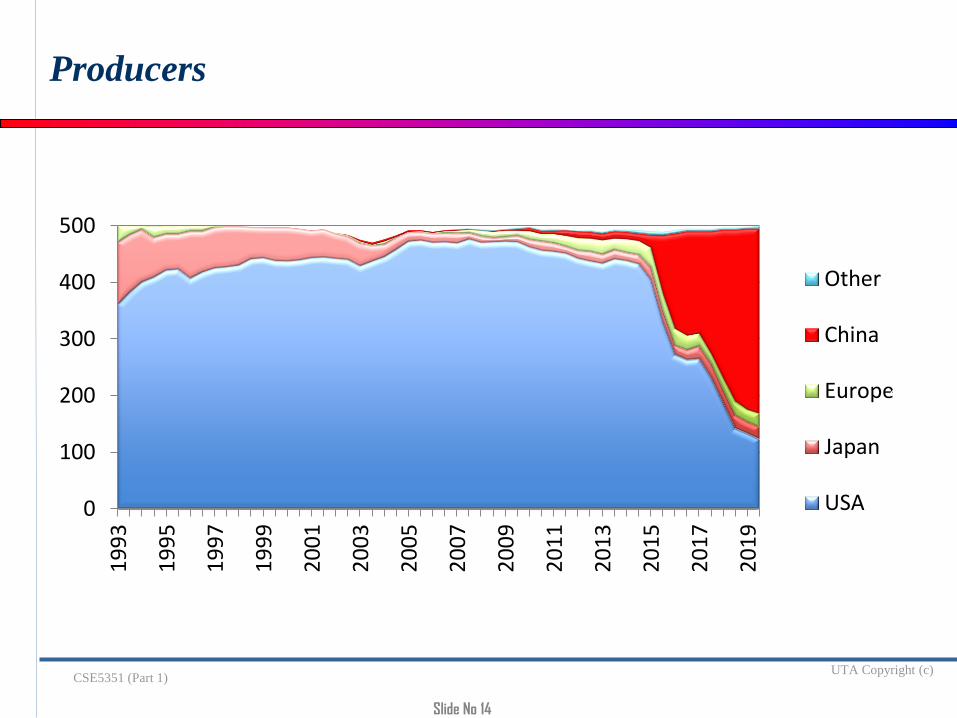
Countries Share
US has fallen to the lowest point since the TOP500 list was created. China has 45% of the systems US has 23% of the systems
13
22411529181116953
0 50 100 150 200 250
Russia
Canada
UK
Japan
China
Chart Title
Slide No 14
CSE5351 (Part 1)UTA Copyright (c)
0
100
200
300
400
500
19
93
19
95
19
97
19
99
20
01
20
03
20
05
20
07
20
09
20
11
20
13
20
15
20
17
20
19
Other
China
Europe
Japan
USA
Producers
5
327
24
21
123
Slide No 15
CSE5351 (Part 1)UTA Copyright (c)
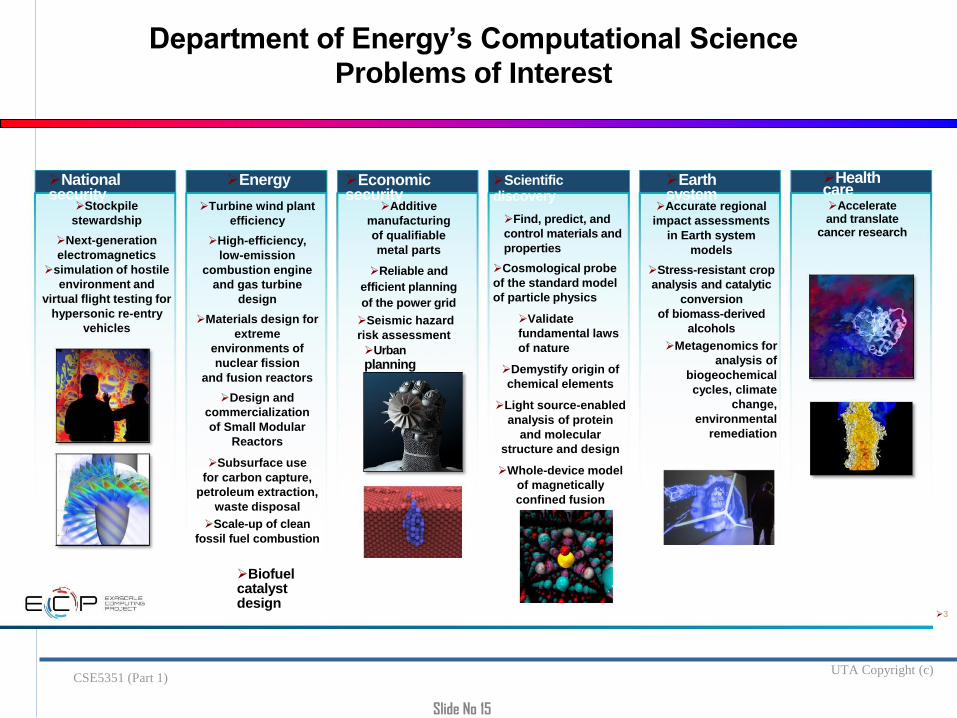
Department of Energy’s Computational Science
Problems of Interest
Stockpile
stewardship
Next-generation
electromagnetics
simulation of hostile
environment and
virtual flight testing for
hypersonic re-entry
vehicles
National security
Turbine wind plant
efficiency
High-efficiency,
low-emission
combustion engine
and gas turbine
design
Materials design for
extreme
environments of
nuclear fission
and fusion reactors
Design and
commercialization
of Small Modular
Reactors
Subsurface use
for carbon capture,
petroleum extraction,
waste disposal
Scale-up of clean
fossil fuel combustion
Energy
Biofuel catalyst design
Economic security
Additive
manufacturing
of qualifiable
metal parts
Reliable and
efficient planning
of the power grid
Seismic hazard
risk assessment
Urban
planning
Scientific discovery
Find, predict, and
control materials and
properties
Cosmological probe
of the standard model
of particle physics
Validate
fundamental laws
of nature
Demystify origin of
chemical elements
Light source-enabled
analysis of protein
and molecular
structure and design
Whole-device model
of magnetically
confined fusion
plasmas
Accurate regional
impact assessments
in Earth system
models
Stress-resistant crop
analysis and catalytic
conversion
of biomass-derived
alcohols
Metagenomics for
analysis of
biogeochemical
cycles, climate
change,
environmental
remediation
Earth system
Accelerate and translate
cancer research
Health care
3
Slide No 16
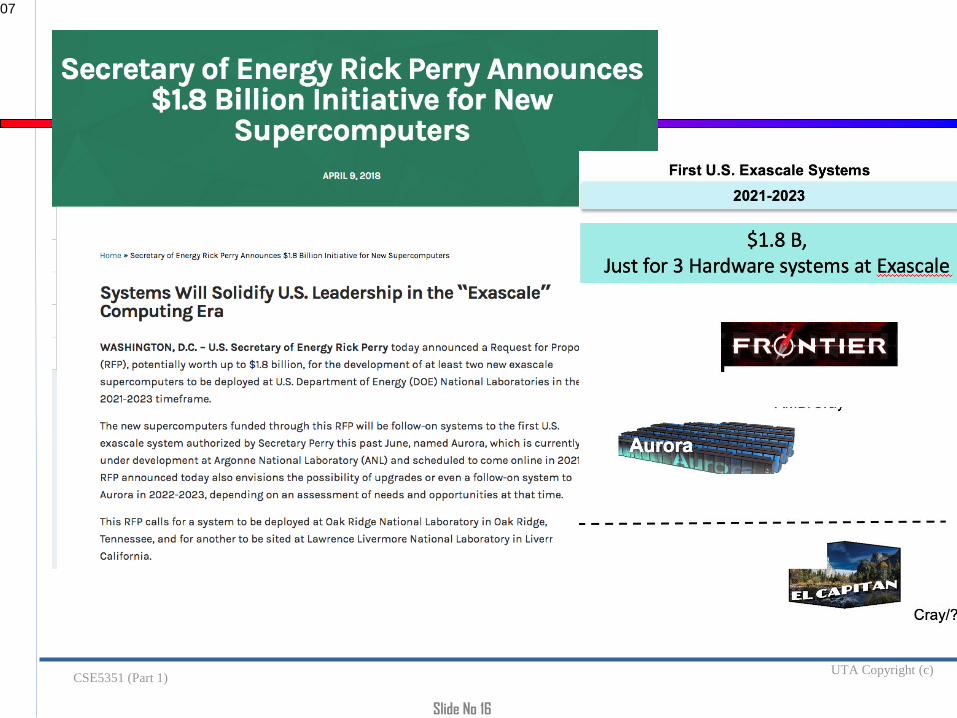
CSE5351 (Part 1)UTA Copyright (c)
0716
Oak Ridge National LabAMD/Cray
Argonne National LabIntel/Cray
Laurence Livermore National LabCray/?
17
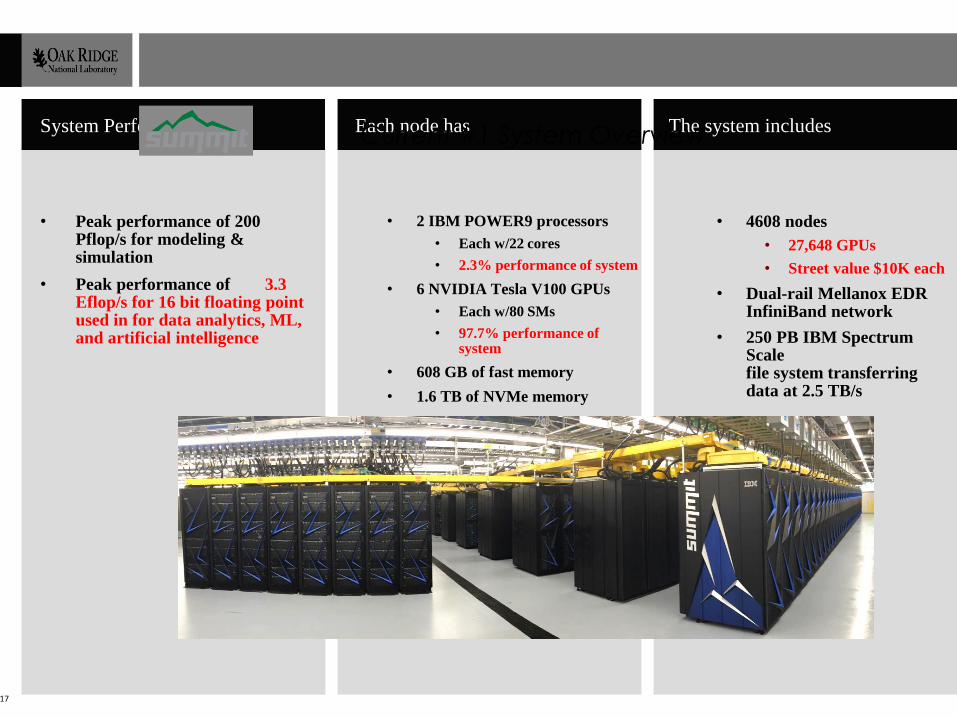
System Performance
• Peak performance of 200 Pflop/s for modeling & simulation
• Peak performance of 3.3 Eflop/s for 16 bit floating point used in for data analytics, ML, and artificial intelligence
Each node has
• 2 IBM POWER9 processors
• Each w/22 cores
• 2.3% performance of system
• 6 NVIDIA Tesla V100 GPUs
• Each w/80 SMs
• 97.7% performance of system
• 608 GB of fast memory
• 1.6 TB of NVMe memory
The system includes
• 4608 nodes
• 27,648 GPUs
• Street value $10K each
• Dual-rail Mellanox EDR InfiniBand network
• 250 PB IBM Spectrum Scale file system transferring data at 2.5 TB/s
Current #1 System Overview

Slide No 18
CSE5351 (Part 1)UTA Copyright (c)
Gordon Bell Award
Since 1987 the Gordon Bell Prize is awarded at the SC conference to
recognize outstanding achievement in high-performance computing.
The purpose of the award is to track the progress of parallel computing, with emphasis on rewarding innovation in applying HPC to applications.
Financial support of the $10,000 award is provided by Gordon Bell, a pioneer in high-performance and parallel computing.
Authors‘ mark their SC paper as a possible Gordon Bell Prize competitor.
Gordon Bell committee reviews the papers and selects 6 papers for the competition.
Presentations are made at SC and a winner is chosen.
Slide No 19
CSE5351 (Part 1)UTA Copyright (c)
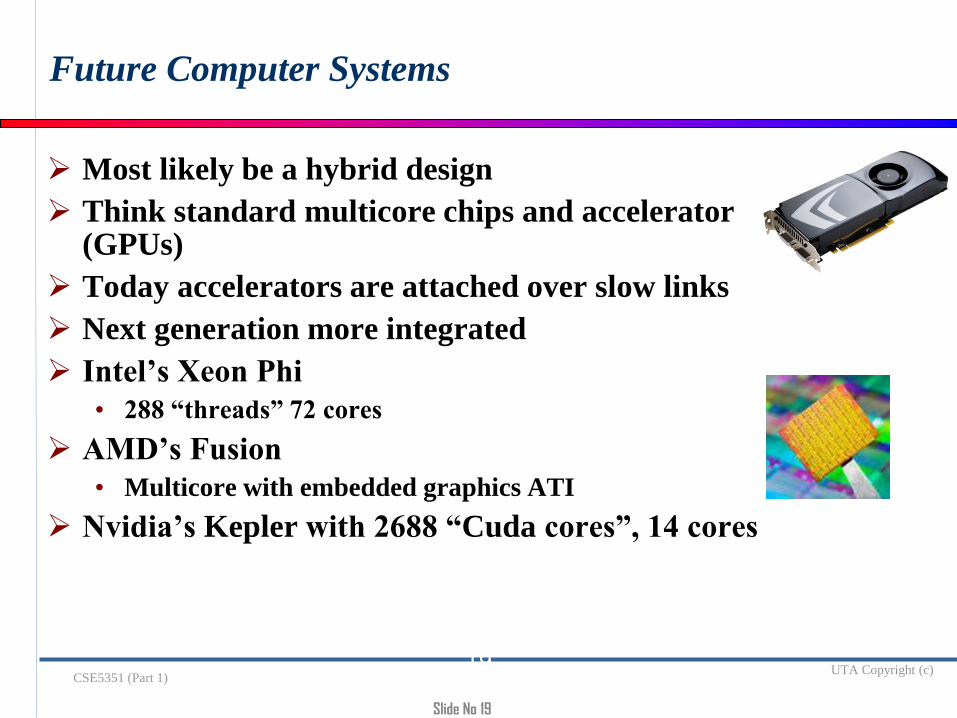
Future Computer Systems
Most likely be a hybrid design
Think standard multicore chips and accelerator (GPUs)
Today accelerators are attached over slow links
Next generation more integrated
Intel’s Xeon Phi
• 288 “threads” 72 cores
AMD’s Fusion
• Multicore with embedded graphics ATI
Nvidia’s Kepler with 2688 “Cuda cores”, 14 cores
19

Slide No 21
CSE5351 (Part 1)UTA Copyright (c)
Commodity plus Accelerator Today
21
Intel Xeon8 cores3 GHz
8*4 ops/cycle96 Gflop/s (DP)
CommodityIntel Xeon Phi (KNL)
72 “cores” 32 flops/cycle/core
1.4 GHz72*1.4*32 ops/cycle
3.22 Tflop/s (DP) or 6.45 Tflop/s (SP)
Accelerator/Co-Processor
6 GBInterconnectPCI-X 16 lane
64 Gb/s (8 GB/s)1 GW/s
Slide No 22
CSE5351 (Part 1)UTA Copyright (c)
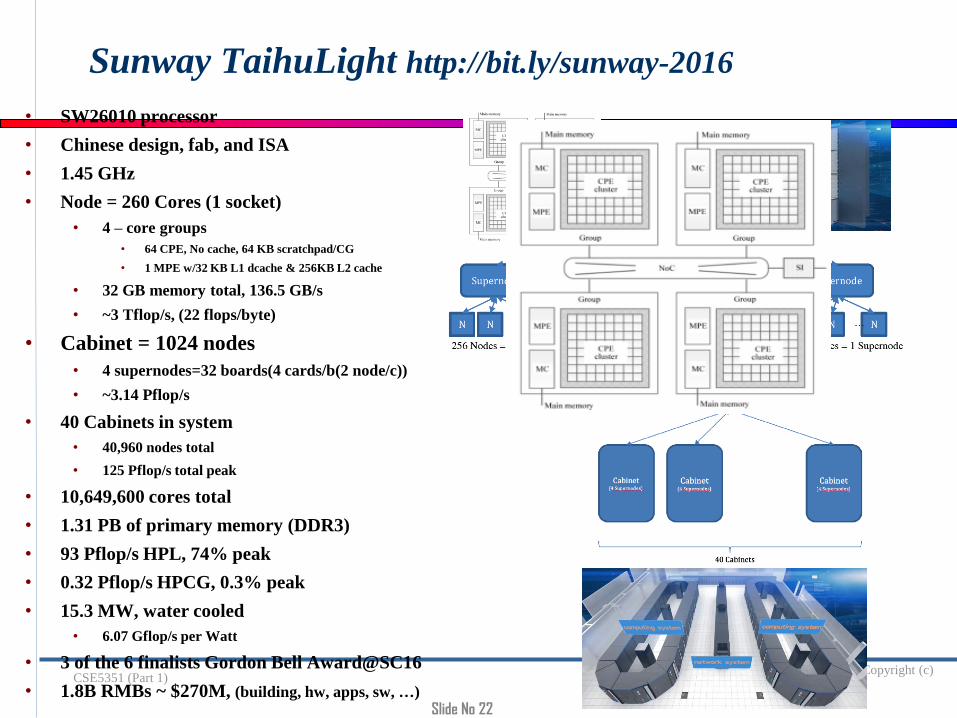
Sunway TaihuLight http://bit.ly/sunway-2016
• SW26010 processor
• Chinese design, fab, and ISA
• 1.45 GHz
• Node = 260 Cores (1 socket)
• 4 – core groups
• 64 CPE, No cache, 64 KB scratchpad/CG
• 1 MPE w/32 KB L1 dcache & 256KB L2 cache
• 32 GB memory total, 136.5 GB/s
• ~3 Tflop/s, (22 flops/byte)
• Cabinet = 1024 nodes
• 4 supernodes=32 boards(4 cards/b(2 node/c))
• ~3.14 Pflop/s
• 40 Cabinets in system
• 40,960 nodes total
• 125 Pflop/s total peak
• 10,649,600 cores total
• 1.31 PB of primary memory (DDR3)
• 93 Pflop/s HPL, 74% peak
• 0.32 Pflop/s HPCG, 0.3% peak
• 15.3 MW, water cooled
• 6.07 Gflop/s per Watt
• 3 of the 6 finalists Gordon Bell Award@SC16
• 1.8B RMBs ~ $270M, (building, hw, apps, sw, …)

Slide No 23
CSE5351 (Part 1)UTA Copyright (c)
• China, 2013: the 34 PetaFLOPS
• Developed in cooperation between NUDT and Inspur for National Supercomputer Center in Guangzhou
• Peak performance of 54.9 PFLOPS
• 16,000 nodes contain 32,000 Xeon Ivy Bridge processors and 48,000 Xeon Phi accelerators totaling 3,120,000 cores
• 162 cabinets in 720m2 footprint
• Total 1.404 PB memory (88GB per node)
• Each Xeon Phi board utilizes 57 cores for aggregate 1.003 TFLOPS at 1.1GHz clock
• Proprietary TH Express-2 interconnect (fat tree with thirteen 576-port switches)
• 12.4 PB parallel storage system
• 17.6MW power consumption under load; 24MWincluding (water) cooling
• 4096 SPARC V9 based Galaxy FT-1500 processors in front-end system
Tianhe-2 (Milkyway-2) 3+ years old

Slide No 24
CSE5351 (Part 1)UTA Copyright (c)
Japanese K Computer
24Linpack run with 705,024 cores at 10.51 Pflop/s (88,128 CPUs), 12.7 MW; 29.5 hoursFujitsu to have a 100 Pflop/s system in 2014
5.5 years old

Slide No 25
CSE5351 (Part 1)UTA Copyright (c)
Multi- to Many-Core
25
All Complex Corese.g. Intel Xeon
Mixed Big & Small Cores
All Small Cores
e.g. Intel Xeon Phi
Complex cores: huge, complex, lots of internal concurrency latency hiding
Simple cores: small, simpler core little internal concurrency latency-sensitive
Slide No 26
CSE5351 (Part 1)UTA Copyright (c)
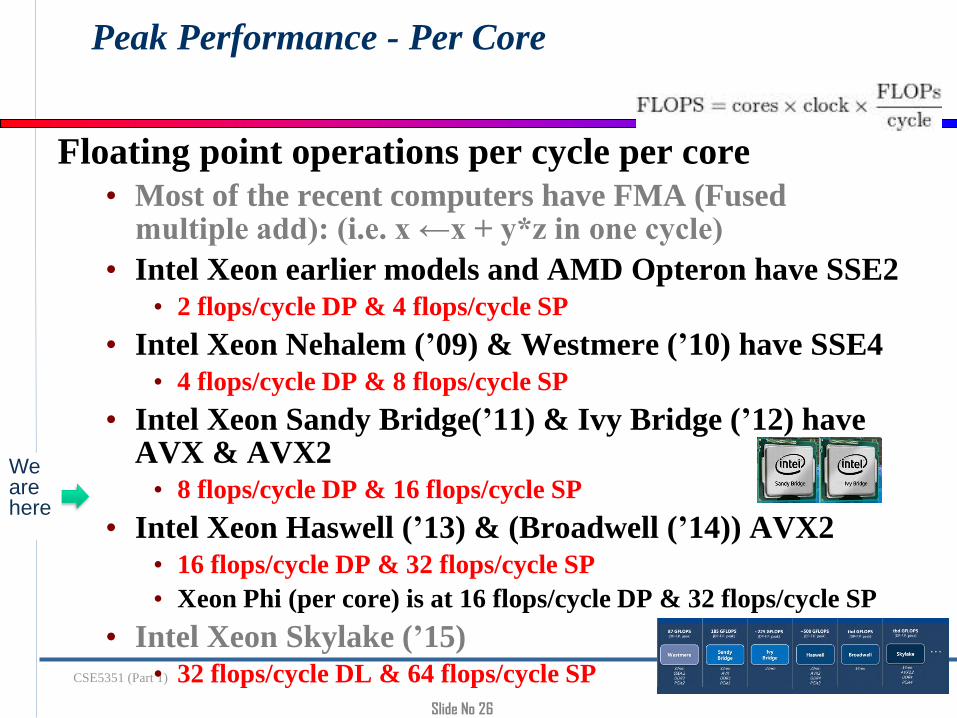
Peak Performance - Per Core
Floating point operations per cycle per core
• Most of the recent computers have FMA (Fused multiple add): (i.e. x ←x + y*z in one cycle)
• Intel Xeon earlier models and AMD Opteron have SSE2• 2 flops/cycle DP & 4 flops/cycle SP
• Intel Xeon Nehalem (’09) & Westmere (’10) have SSE4 • 4 flops/cycle DP & 8 flops/cycle SP
• Intel Xeon Sandy Bridge(’11) & Ivy Bridge (’12) have AVX & AVX2
• 8 flops/cycle DP & 16 flops/cycle SP
• Intel Xeon Haswell (’13) & (Broadwell (’14)) AVX2• 16 flops/cycle DP & 32 flops/cycle SP
• Xeon Phi (per core) is at 16 flops/cycle DP & 32 flops/cycle SP
• Intel Xeon Skylake (’15)• 32 flops/cycle DL & 64 flops/cycle SP
We arehere

Slide No 27
CSE5351 (Part 1)UTA Copyright (c)
Sunway TainhuLight22 Flops / 1 Byte
Ratio of CPU speed to memory bandwidth increases 15–33% yearly
27
• Flops “free,”memory expensive
• Good for dense,BLAS-3 operations(matrix multiply)
• Flops & memoryaccess balanced
• Good for sparse &vector operations
Data from Stream benchmark (McCalpin) and vendor information sheets
NEC SX-ACE1 Flop / 1 Byte
K Computer2 Flop / 1 Byte
Slide No 28
CSE5351 (Part 1)UTA Copyright (c)
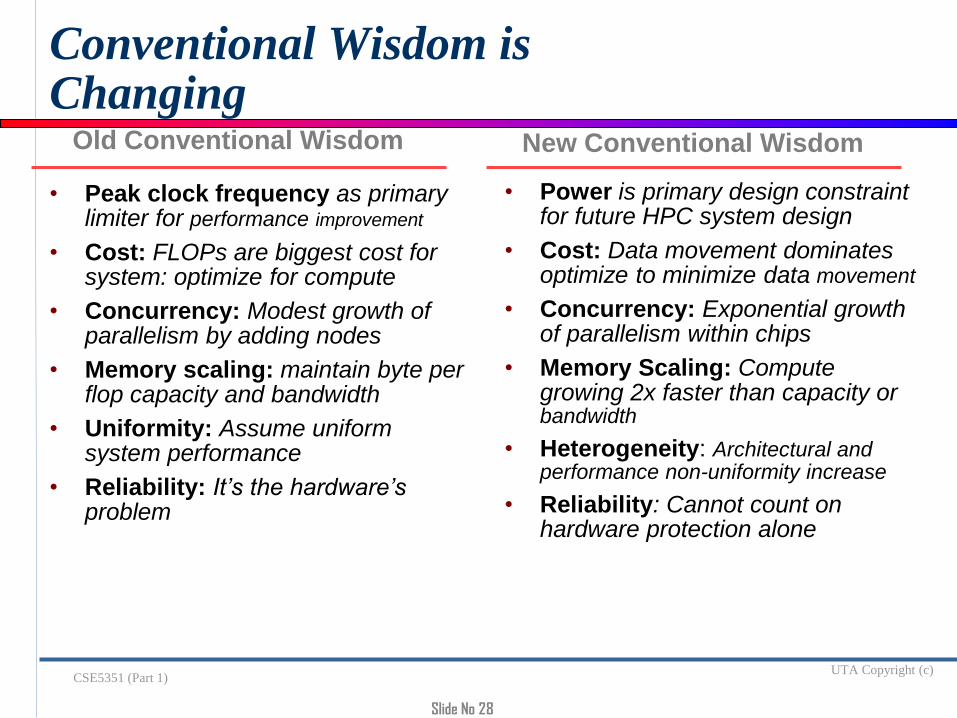
Conventional Wisdom is Changing
• Peak clock frequency as primary limiter for performance improvement
• Cost: FLOPs are biggest cost for system: optimize for compute
• Concurrency: Modest growth of parallelism by adding nodes
• Memory scaling: maintain byte per flop capacity and bandwidth
• Uniformity: Assume uniform system performance
• Reliability: It’s the hardware’s problem
• Power is primary design constraint for future HPC system design
• Cost: Data movement dominates optimize to minimize data movement
• Concurrency: Exponential growth of parallelism within chips
• Memory Scaling: Compute growing 2x faster than capacity or bandwidth
• Heterogeneity: Architectural and performance non-uniformity increase
• Reliability: Cannot count on hardware protection alone
Old Conventional Wisdom New Conventional Wisdom

Slide No 29
CSE5351 (Part 1)UTA Copyright (c)
Systems in the US DOE under ECP
Oak Ridge Lab and Lawrence Livermore Lab received IBM and Nvidia based systems
IBM Power 9 + Nvidia Volta V100
5-10 times Titan on apps
4,600 nodes, each containing six (ORNL) 7.5-teraflop NVIDIA V100 GPUs, and two IBM Power9 CPUs, its aggregate peak performance > 200 petaflops.
In 2021 Argonne Lab to receive Intel based system
Exascale systems, based on Future Intel parts
Aurora 21
Balanced architecture to support three pillars
Large-scale Simulation (PDEs, traditional HPC)
Data Intensive Applications (science pipelines)
Deep Learning and Emerging Science AI
Integrated computing, acceleration, storage
Towards a common software stack
29
Slide No 31
CSE5351 (Part 1)UTA Copyright (c)
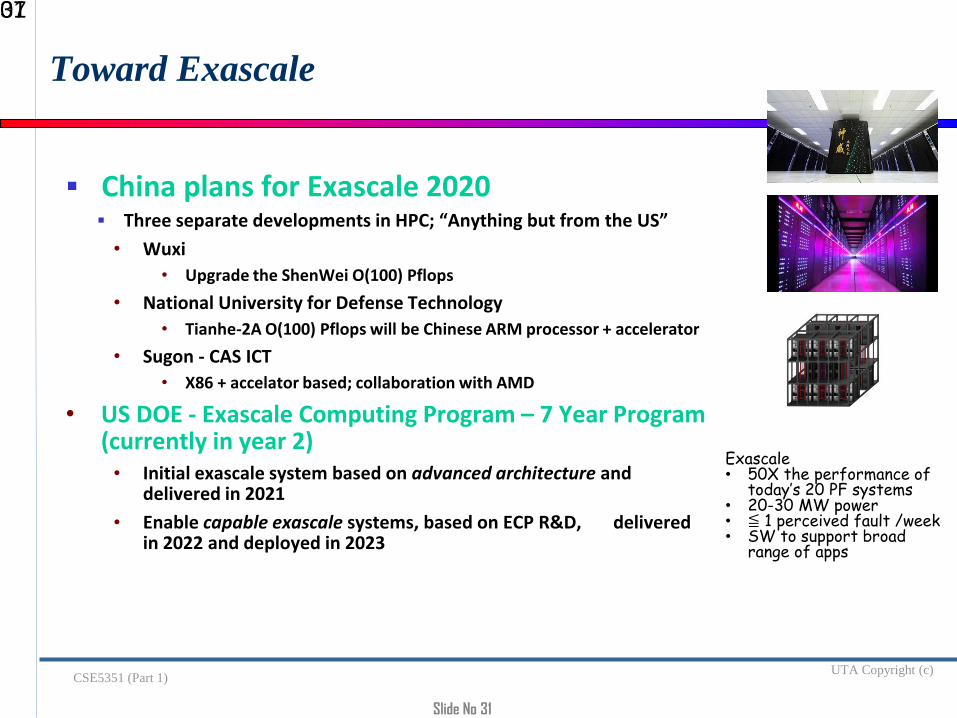
Toward Exascale
China plans for Exascale 2020 Three separate developments in HPC; “Anything but from the US”
• Wuxi
• Upgrade the ShenWei O(100) Pflops
• National University for Defense Technology
• Tianhe-2A O(100) Pflops will be Chinese ARM processor + accelerator
• Sugon - CAS ICT
• X86 + accelator based; collaboration with AMD
• US DOE - Exascale Computing Program – 7 Year Program (currently in year 2)
• Initial exascale system based on advanced architecture and delivered in 2021
• Enable capable exascale systems, based on ECP R&D, delivered in 2022 and deployed in 2023
0731
Exascale• 50X the performance of
today’s 20 PF systems• 20-30 MW power• ≦ 1 perceived fault /week• SW to support broad
range of apps

Slide No 32
CSE5351 (Part 1)UTA Copyright (c)
0732
Just for hardware

Slide No 35
CSE5351 (Part 1)UTA Copyright (c)
We Can Build an Exascale System Today?
35Require 150 MW of power, programming for 100 M threads, and $2.7B price tag
Connect together 10 Sunway TaihuLight systems

Slide No 36
CSE5351 (Part 1)UTA Copyright (c)
Systems 2016Sunway TaihuLight
2022 (may be 2024)
Difference
Today & Exa
System peak 143 Pflop/s 1 Eflop/s ~10x
Power 15 MW(8 Gflops/W)
~20 MW(50 Gflops/W)
O(1)
~6x
System memory 1.31 PB 32 - 64 PB ~50x
Node performance 3.06 TF/s 1.2 or 15TF/s O(1)
Node concurrency 260 cores O(1k) or 10k ~5x - ~50x
Node Interconnect BW 16 GB/s 200-400GB/s ~25x
System size (nodes) 40,960 O(100,000) or O(1M) ~6x - ~60x
Total concurrency 10.6 M O(billion) ~100x
MTTF Few / day Many / day O(?)
Today’s #1 System
Slide No 37
CSE5351 (Part 1)UTA Copyright (c)
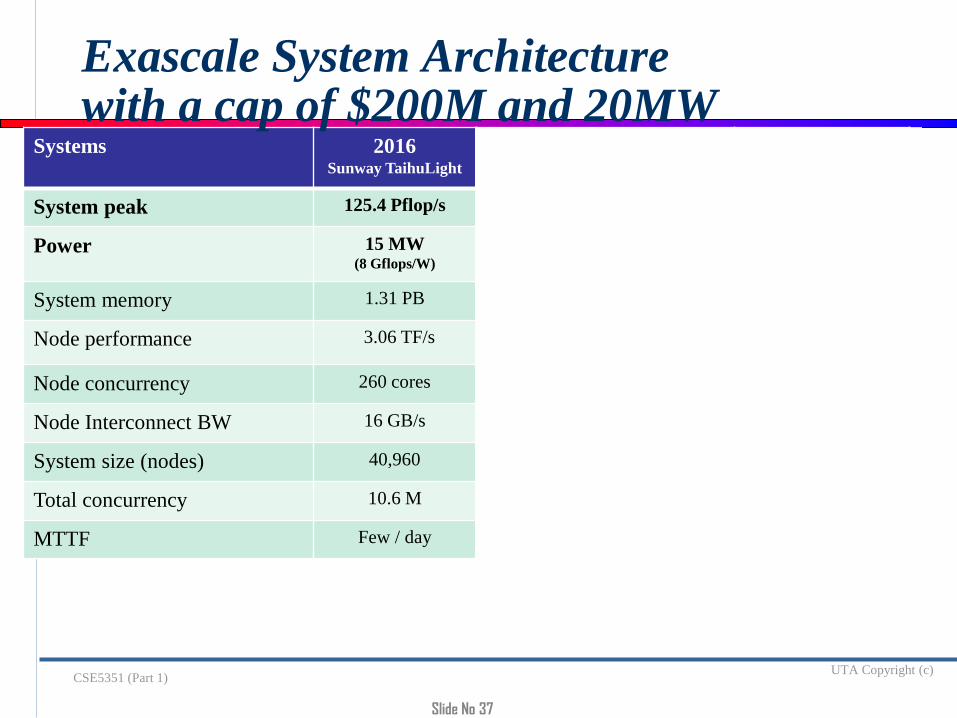
Systems 2016Sunway TaihuLight
2022 (may be 2024)
Difference
Today & Exa
System peak 125.4 Pflop/s 1 Eflop/s ~10x
Power 15 MW(8 Gflops/W)
~20 MW(50 Gflops/W)
O(1)
~6x
System memory 1.31 PB 32 - 64 PB ~50x
Node performance 3.06 TF/s 1.2 or 15TF/s O(1)
Node concurrency 260 cores O(1k) or 10k ~5x - ~50x
Node Interconnect BW 16 GB/s 200-400GB/s ~25x
System size (nodes) 40,960 O(100,000) or O(1M) ~6x - ~60x
Total concurrency 10.6 M O(billion) ~100x
MTTF Few / day Many / day O(?)
Exascale System Architecturewith a cap of $200M and 20MW
Slide No 38
CSE5351 (Part 1)UTA Copyright (c)
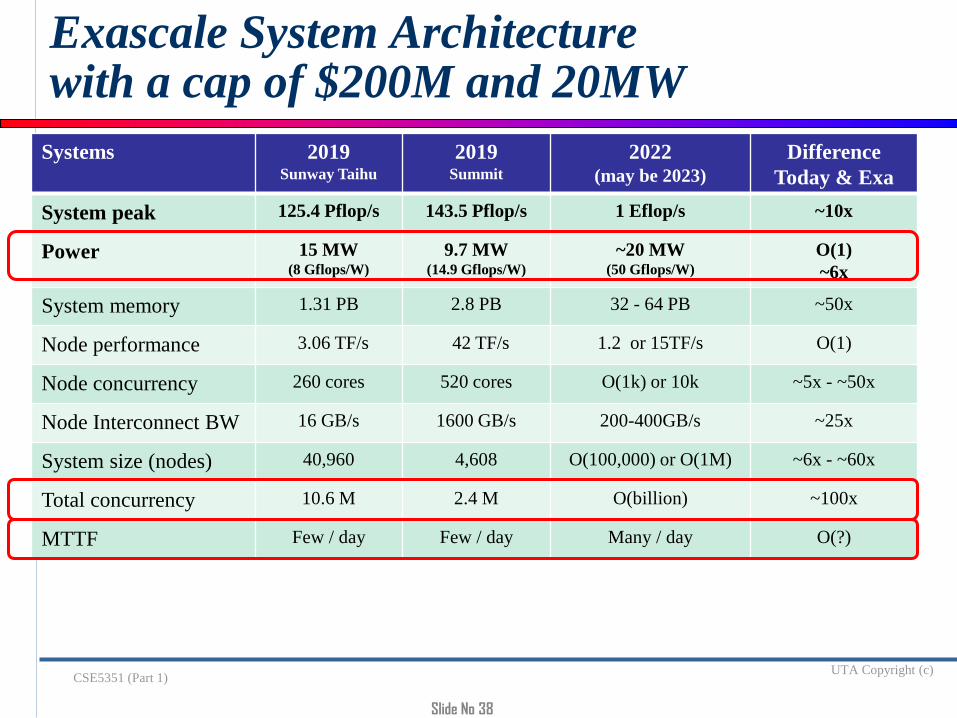
Systems 2019Sunway Taihu
2019Summit
2022 (may be 2023)
Difference
Today & Exa
System peak 125.4 Pflop/s 143.5 Pflop/s 1 Eflop/s ~10x
Power 15 MW(8 Gflops/W)
9.7 MW(14.9 Gflops/W)
~20 MW(50 Gflops/W)
O(1)
~6x
System memory 1.31 PB 2.8 PB 32 - 64 PB ~50x
Node performance 3.06 TF/s 42 TF/s 1.2 or 15TF/s O(1)
Node concurrency 260 cores 520 cores O(1k) or 10k ~5x - ~50x
Node Interconnect BW 16 GB/s 1600 GB/s 200-400GB/s ~25x
System size (nodes) 40,960 4,608 O(100,000) or O(1M) ~6x - ~60x
Total concurrency 10.6 M 2.4 M O(billion) ~100x
MTTF Few / day Few / day Many / day O(?)
Exascale System Architecturewith a cap of $200M and 20MW
Slide No 39
CSE5351 (Part 1)UTA Copyright (c)
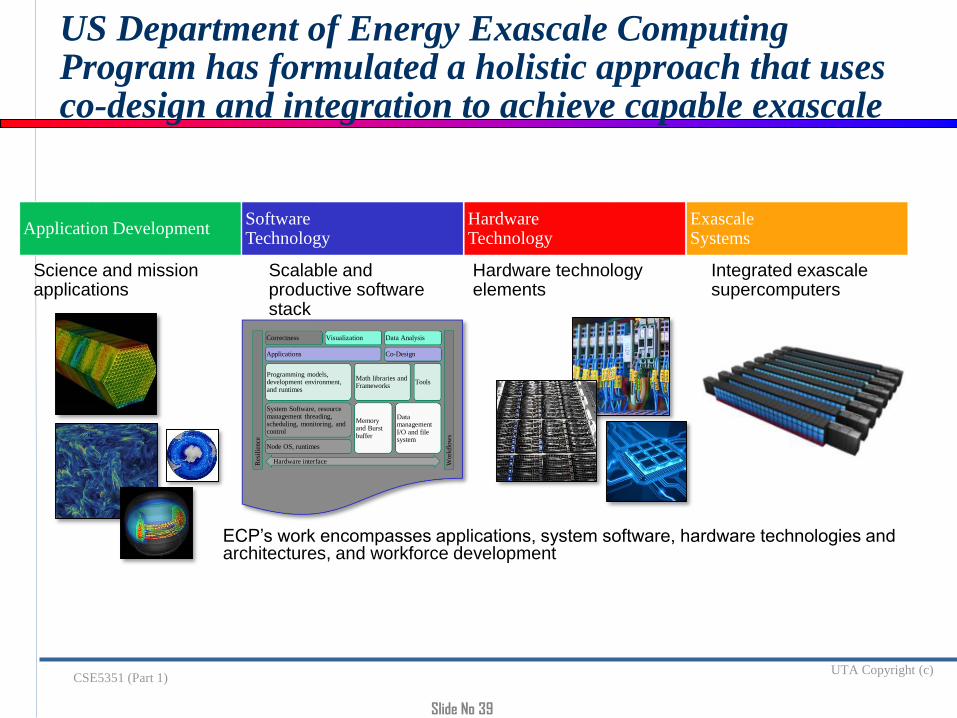
US Department of Energy Exascale Computing Program has formulated a holistic approach that uses co-design and integration to achieve capable exascale
Application DevelopmentSoftwareTechnology
HardwareTechnology
ExascaleSystems
Scalable and productive software stack
Science and mission applications
Hardware technology elements
Integrated exascalesupercomputers
Correctness Visualization Data Analysis
Applications Co-Design
Programming models, development environment, and runtimes
ToolsMath libraries and Frameworks
System Software, resource management threading, scheduling, monitoring, and control
Memory and Burst buffer
Data management I/O and file system
Node OS, runtimes
Res
ilie
nce
Work
flow
s
Hardware interface
ECP’s work encompasses applications, system software, hardware technologies and architectures, and workforce development
Slide No 41
CSE5351 (Part 1)UTA Copyright (c)
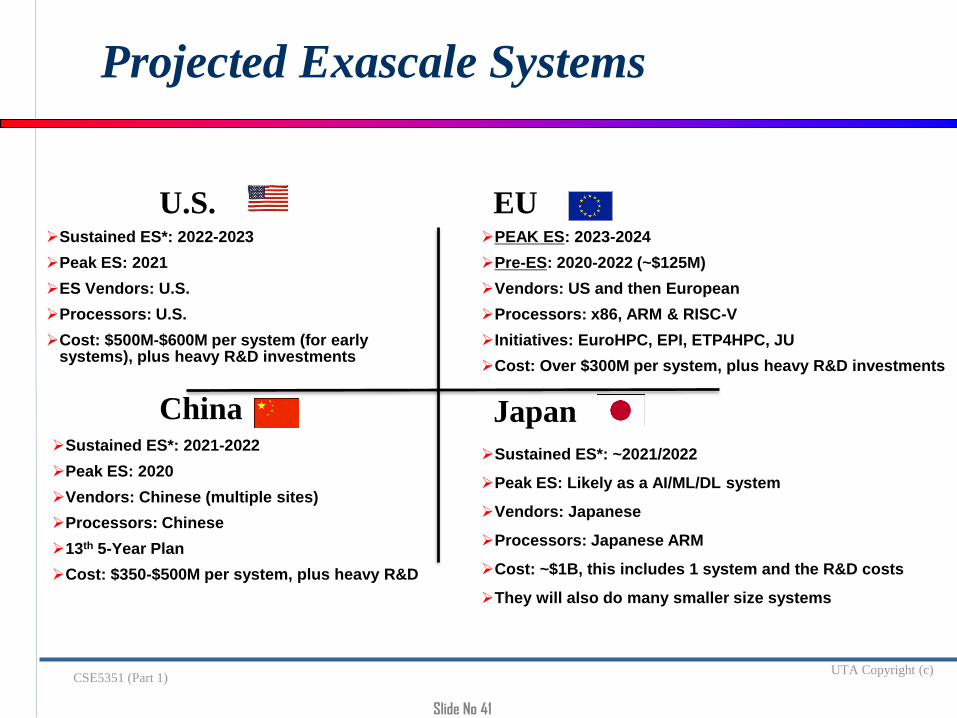
Projected Exascale Systems
U.S. Sustained ES*: 2022-2023
Peak ES: 2021
ES Vendors: U.S.
Processors: U.S.
Cost: $500M-$600M per system (for early systems), plus heavy R&D investments
41
ChinaSustained ES*: 2021-2022
Peak ES: 2020
Vendors: Chinese (multiple sites)
Processors: Chinese
13th 5-Year Plan
Cost: $350-$500M per system, plus heavy R&D
EUPEAK ES: 2023-2024
Pre-ES: 2020-2022 (~$125M)
Vendors: US and then European
Processors: x86, ARM & RISC-V
Initiatives: EuroHPC, EPI, ETP4HPC, JU
Cost: Over $300M per system, plus heavy R&D investments
Japan
Sustained ES*: ~2021/2022
Peak ES: Likely as a AI/ML/DL system
Vendors: Japanese
Processors: Japanese ARM
Cost: ~$1B, this includes 1 system and the R&D costs
They will also do many smaller size systems* 1 exaflops on a 64-bit real application
41© Hyperion Research

Slide No 42
CSE5351 (Part 1)UTA Copyright (c)
Three separate developments in HPC; “Anything but from the US”
• Wuxi
• Upgrade the ShenWei O(100) Pflops
• National University for Defense Technology
• Tianhe-2A O(100) Pflops will be Chinese ARM processor + accelerator
• Sugon - CAS ICT
• X86 + accelerator based; collaboration with AMD
Chinese plans for Exascale in 2021 - 2022
07
42

Slide No 43
CSE5351 (Part 1)UTA Copyright (c)
Figure courtesy of Kunle Olukotun, Lance Hammond, Herb Sutter, and Burton Smith
2020 2025 2030Year
Technology Scaling TrendsExascale in 2021… and then what?
Perf
orm
an
ce
Transistors
Thread Performance
Clock Frequency
Power (watts)
# Cores
And Then What?
ExascaleHappens in 2021-2023
Slide No 44
CSE5351 (Part 1)UTA Copyright (c)
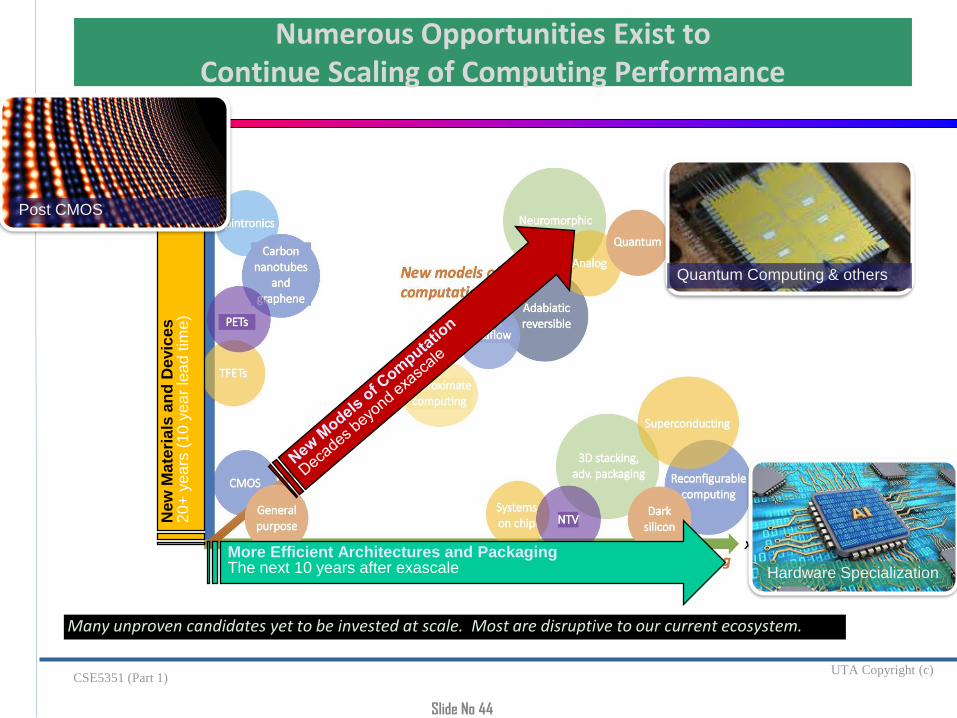
New
Ma
teri
als
an
d D
evic
es
20
+ y
ea
rs (
10
ye
ar
lea
d tim
e)
More Efficient Architectures and PackagingThe next 10 years after exascale
Numerous Opportunities Exist to Continue Scaling of Computing Performance
Many unproven candidates yet to be invested at scale. Most are disruptive to our current ecosystem.
Quantum Computing & others
Hardware Specialization
Post CMOS

Slide No 45
CSE5351 (Part 1)UTA Copyright (c)
Machine Learning in Computational Science
• Climate
• Biology
• Drug Design
• Epidemology
• Materials
• Cosmology
• High-Energy Physics
ML is changing Science
• HPC HW&SW must change
• Data will “slosh” (model to/from training)
• Scientists will share models
Many fields are beginning to adopt machine learning to augment modeling and simulation methods

Slide No 46
CSE5351 (Part 1)UTA Copyright (c)
46
Some Deep Learning Applications
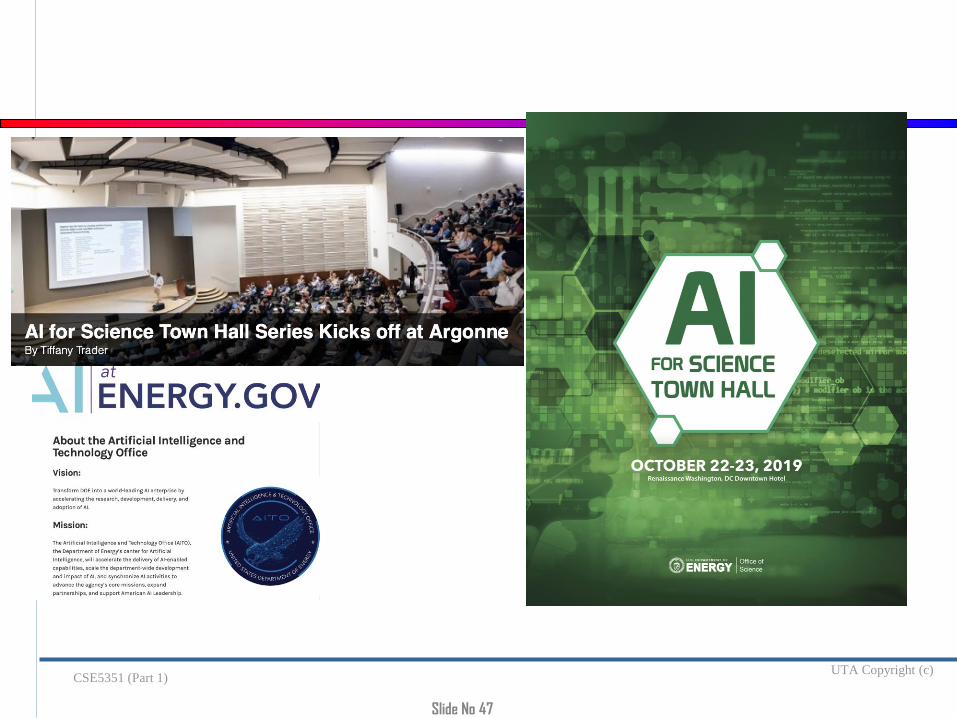
Slide No 47
CSE5351 (Part 1)UTA Copyright (c)

Slide No 48
CSE5351 (Part 1)UTA Copyright (c)
Slide No 49
CSE5351 (Part 1)UTA Copyright (c)
Scientific Computing is Changing
In the past, we moved experimental data to the centralized servers, which provided bulk storage and computational resources for analysis and simulation.
Three things have changed:
• CPU advances have enabled edge/IoT devices to be small
parallel computers with real operating systems and multithreaded
programming models (CUDA, OpenMP, TensorFlow, etc.).
• Machine learning and AI has helped create a new class of algorithms
that can sift through massive amounts of experimental data, and
then pushing to the data center only the relevant results
• Edge devices and scientific instruments are rapidly expanding,
creating a new class of “edge software defined instrument” that
must connect to cyberinfrastructure.
These three changes are forcing us to rethink the central services model of HPC and embrace a new model where network infrastructure computes-along-the-way.
To realize that goal, we need a new conceptual model for programming this new end-to-end infrastructure.

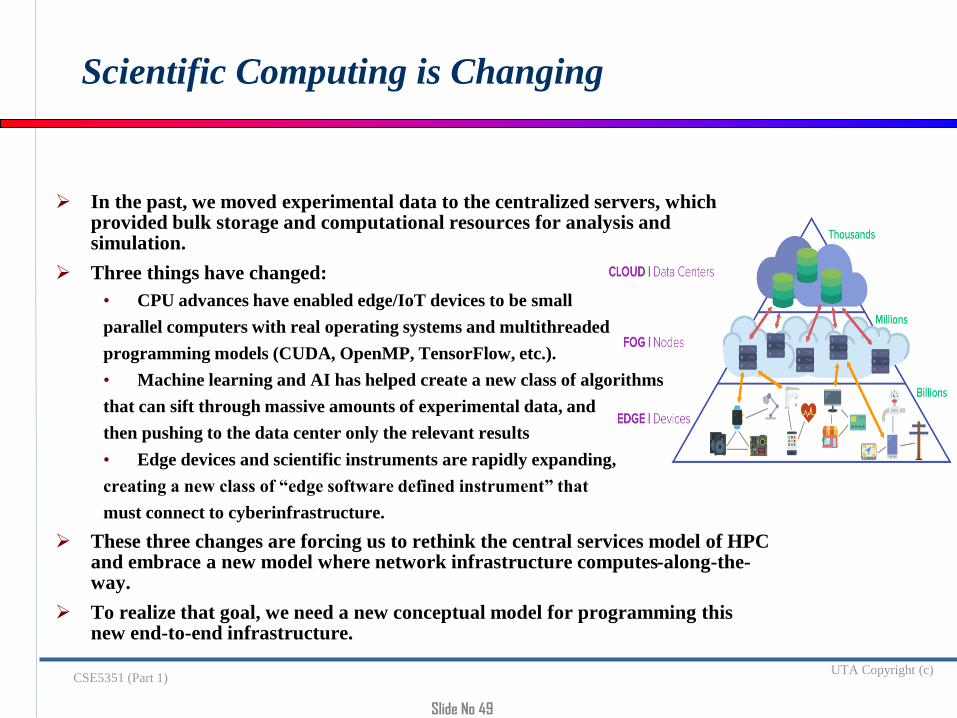
Size Nano Micro Milli Server Fog Campus Facility
Example IoT Smart Device Sage Node Linux Box Co-locatedBlades
1000-nodecluster
Datacenter
Memory 0.5K 256K 8GB 32GB 256G 32TB 16PB
Network BLE WiFi/LTE WiFi/LTE 1 GigE 10GigE 40GigE N*100GigE
Cost $5 $30 $600 $3K $50K $2M $1000M
IoT/Edge HPC/Cloud
• Machine learning in the application. for enhanced scientific discovery
• Machine learning in the computational infrastructure. for improved performance
• Machine learning at the edge. for managing data volume
• The number of network-connected
devices—• sensors, actuators, instruments,
computers, and data stores
• Now substantially exceeds the
number of humans on this planet

Slide No 51
CSE5351 (Part 1)UTA Copyright (c)
The Take Away
Three computer revolutions
• High performance computing
• Deep learning
• Edge & AI
The very small (edge/fog computing and sensors)
The very large (clouds, exascale, and big data)
51
• Technical implications
Fluid end-to-end
cyberinfrastructure
Interdisciplinary data and
infrastructure planning
• Cultural implications
Change management and strategic
planning
Community collaboration
Harnessing the computing continuum will catalyze new consumer
services, business processes, social services, and scientific discovery.

Size Nano Micro Milli Server Fog Campus Facility
Example AdafruitTrinket
Particle.ioBoron
Array of Things
Linux Box Co-locatedBlades
1000-nodecluster
Datacenter
Memory 0.5K 256K 8GB 32GB 256G 32TB 16PB
Network BLE WiFi/LTE WiFi/LTE 1 GigE 10GigE 40GigE N*100GigE
Cost $5 $30 $600 $3K $50K $2M $1000M
IoT/Edge HPC/Cloud/InstrumentFog
The Computing Continuum
The number of network-connected devices—
sensors, actuators, instruments, computers, and data stores—
Now substantially exceeds the number of humans on this planet
We lack a programming and execution model that is inclusive and capable of
harnessing the entire computing continuum to program our new intelligent world.
Slide No 56
CSE5351 (Part 1)UTA Copyright (c)
Conclusions
Exciting time for HPC
For the last decade or more, the research investment strategy has been overwhelmingly biased in favor of hardware.
This strategy needs to be rebalanced -barriers to progress are increasingly on the software side.
• High Performance Ecosystem out of balance• Hardware, OS, Compilers, Software, Algorithms, Applications