Embed Size (px)
Citation preview
Part 15 Hydrological Analysis for Simanggo-2 HEPP
Final Report (Supporting_PreF/S) Part 15 Hydrological Analysis for Simanggo-2 HEPP
JICA Project for the Master Plan Study of 15-1 August, 2011 Hydropower Development in Indonesia
PART 15 HYDROLOGICAL ANALYSIS FOR SIMANGGO-2 HEPP
15.1 METEOROLOGY AND HYDROLOGY
Meteorological Records and Hydrological Records are collected from Meteorological Climatological and Geophysical Agency (Badan Meteorologi Klimatologi dan Geofisika: BMKG), Research Institute for Water Resources Development under Ministry of Public Works (Pusat Penelitian dan Pengembangan Sumber Daya Air: PUSAIR, formerly DPMA), and engineering reports on various hydropower development projects. The location map of the stations is shown in Figure 1. The availability of data is summarized in Figure 2. The catchment area of Simanggo-2 HEPP intake weir site is shown in Figure 3.
15.1.1 METEOROLOGICAL DATA
Climatic data such as air temperature, relative humidity, wind velocity, sunshine duration have been observed at the Sibolga station, which is collected from BMKG. Pan-evaporation has been observed at the Parapat and the Gube Hutaraja stations. Pan-evaporation data is collected from Asahan -3 HEPP report.
The variation of principal climatic data at the Sibolga station, the Parapat station and the Gube Hutaraja station is shown in Figure 4.
(1) Air Temperature
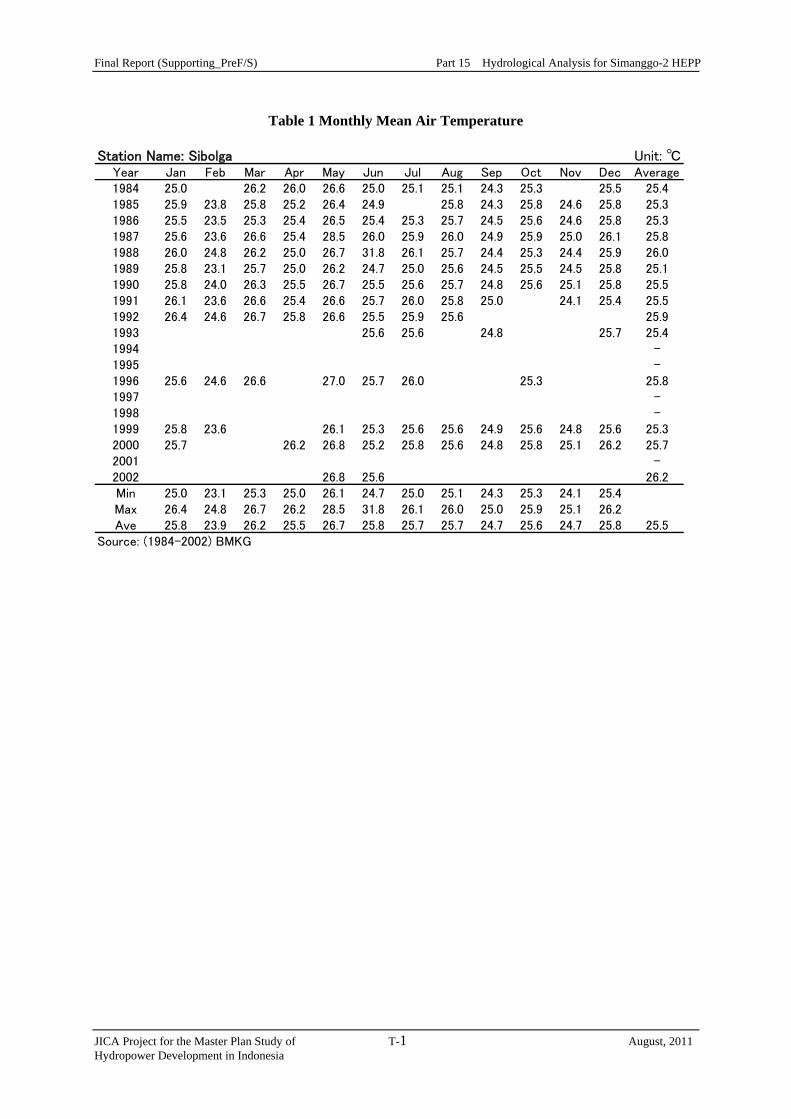
Table 1 shows the monthly mean air temperature at the Sibolga station. The average monthly mean air temperature at the Sibolga station in the period of 1984 to 2002 is summarized below.
Station Name: Sibolga (1984-2002) Unit: ℃Jan Feb Mar Apr May Jun Jul Aug Sep Oct Nov Dec Mean25.8 23.9 26.2 25.5 26.7 25.8 25.7 25.7 24.7 25.6 24.7 25.8 25.5
As seen, the mean annual air temperature at the Sibolga station is 25.5ºC on an average. There is a slight seasonal change ranging 23.9ºC in February to 26.7ºC in May.
(2) Relative Humidity
Table 2 shows the monthly mean relative humidity at the Sibolga station. The average monthly relative humidity at the Sibolga station in the period of 1984 to 2002 is summarized below.
Final Report (Supporting_PreF/S) Part 15 Hydrological Analysis for Simanggo-2 HEPP
JICA Project for the Master Plan Study of 15-2 August, 2011 Hydropower Development in Indonesia
Station Name: Sibolga (1984-2002) Unit: %Jan Feb Mar Apr May Jun Jul Aug Sep Oct Nov Dec Mean84.4 76.0 85.7 83.0 83.8 79.7 83.6 85.0 82.8 85.8 84.6 88.1 83.5
As well as the monthly pattern of mean air temperature, there is no significant change of relative humidity throughout the year. The annual mean relative humidity in the period of 1984-2002 at the Sibolga station is 83.5 % and there is a slight seasonal change ranging from 76.0% in February to 88.1 % in December.
(3) Sunshine Duration
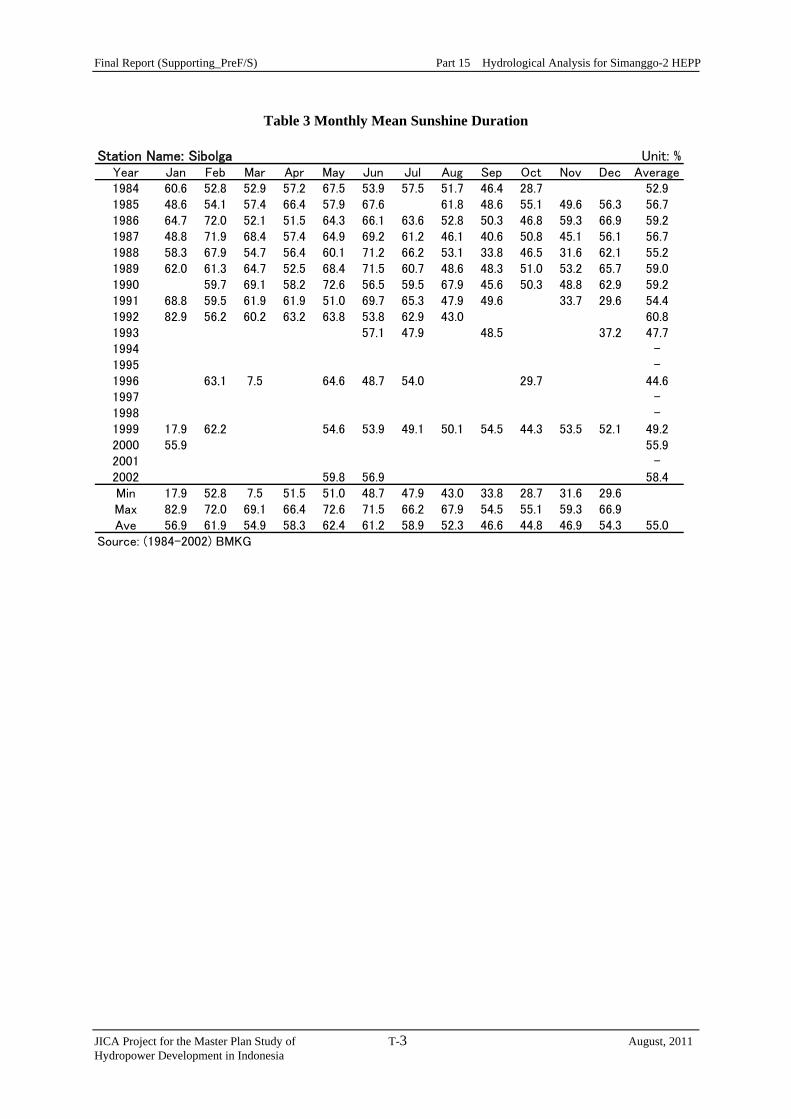
Table 3 shows the monthly mean sunshine duration at the Sibolga station. The average monthly mean sunshine duration at the Sibolga station in the period of 1984 to 2002 is summarized below.
Station Name: Sibolga (1984-2002) Unit: %Jan Feb Mar Apr May Jun Jul Aug Sep Oct Nov Dec Mean56.9 61.9 54.9 58.3 62.4 61.2 58.9 52.3 46.6 44.8 46.9 54.3 55.0
As seen, the mean annual sunshine duration at the Sibolga station is 55.0 % on an average. The maximum duration of 62.4% and the minimum one of 44.8% occur in May and October, respectively. Sunshine duration generally decreases with an increase of rainfall. The highest sunshine duration therefore occurs in May in the dry season.
(4) Wind Velocity
Table 4 shows the monthly mean wind velocity at the Sibolga station. The average monthly mean wind velocity at the Sibolga station in the period of 1984 to 2002 is summarized below.
Station Name: Sibolga (1984-2002) Unit: m/secJan Feb Mar Apr May Jun Jul Aug Sep Oct Nov Dec Mean5.2 5.8 6.5 5.5 4.8 5.0 5.3 5.3 5.2 5.4 5.1 5.1 5.3
Mean annual wind velocity at the Sibolga station is 5.3 m/sec ranging from 4.8m/sec in May and 6.5m/sec in March.
(5) Evaporation
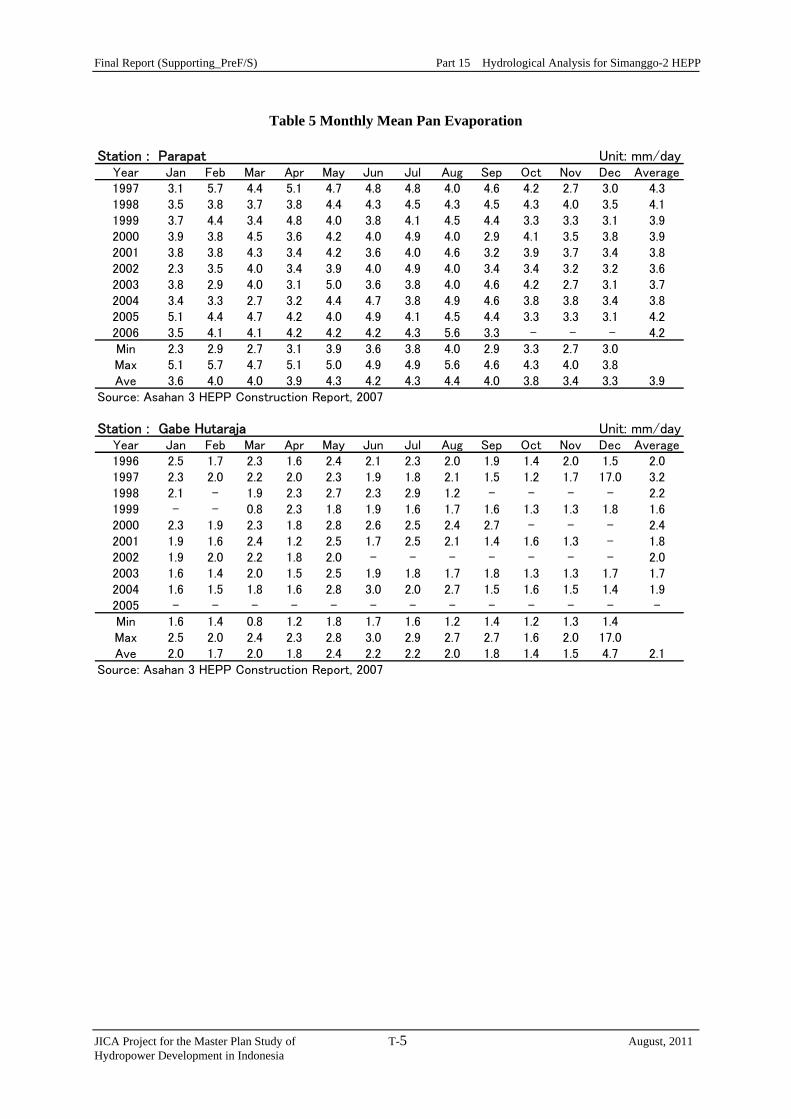
Pan evaporation records are available at the Parapat station and the Gube Hutaraja station. The pan evaporation records at both stations are summarized on monthly basis as shown in Table 5. The average monthly mean pan evaporation at the Parapat and the Gube Hutaraja stations is summarized below.
Final Report (Supporting_PreF/S) Part 15 Hydrological Analysis for Simanggo-2 HEPP
JICA Project for the Master Plan Study of 15-3 August, 2011 Hydropower Development in Indonesia
Station Name: Parapat (1997-2006) Unit: mm/dayJan Feb Mar Apr May Jun Jul Aug Sep Oct Nov Dec Mean3.6 4.0 4.0 3.9 4.3 4.2 4.3 4.4 4.0 3.8 3.4 3.3 3.9
Station Name: Gabe Hutaraja (1996-2005) Unit: mm/dayJan Feb Mar Apr May Jun Jul Aug Sep Oct Nov Dec Mean2.0 1.7 2.0 1.8 2.4 2.2 2.2 2.0 1.8 1.4 1.5 4.7 2.1
The ruling factors of pan evaporation may be air temperature and relative humidity, namely evaporation rate varies season to season following to mainly the variation of humidity. As seen in the above table, the seasonal variation of pan evaporation is generally small throughout the year, because there is no great seasonal variation of relative humidity.
15.1.2 RAINFALL DATA
There are 12 rainfall gauging stations in and around the Simanggo river basin. The location map of these stations is shown in Figure 1. Also the data availability at these stations is shown in Figure 2. The rainfall gauging stations are operated and maintained under BMKG. Daily rainfall records are collected from BMKG in this study.
PLN formerly had own hydrological observation network (PLN-LMK Observation Network). Currently most of these stations have broken down, after regional office of PLN took responsibility for maintenance which the central office of PLN had taken.
(1) Monthly Rainfall Data
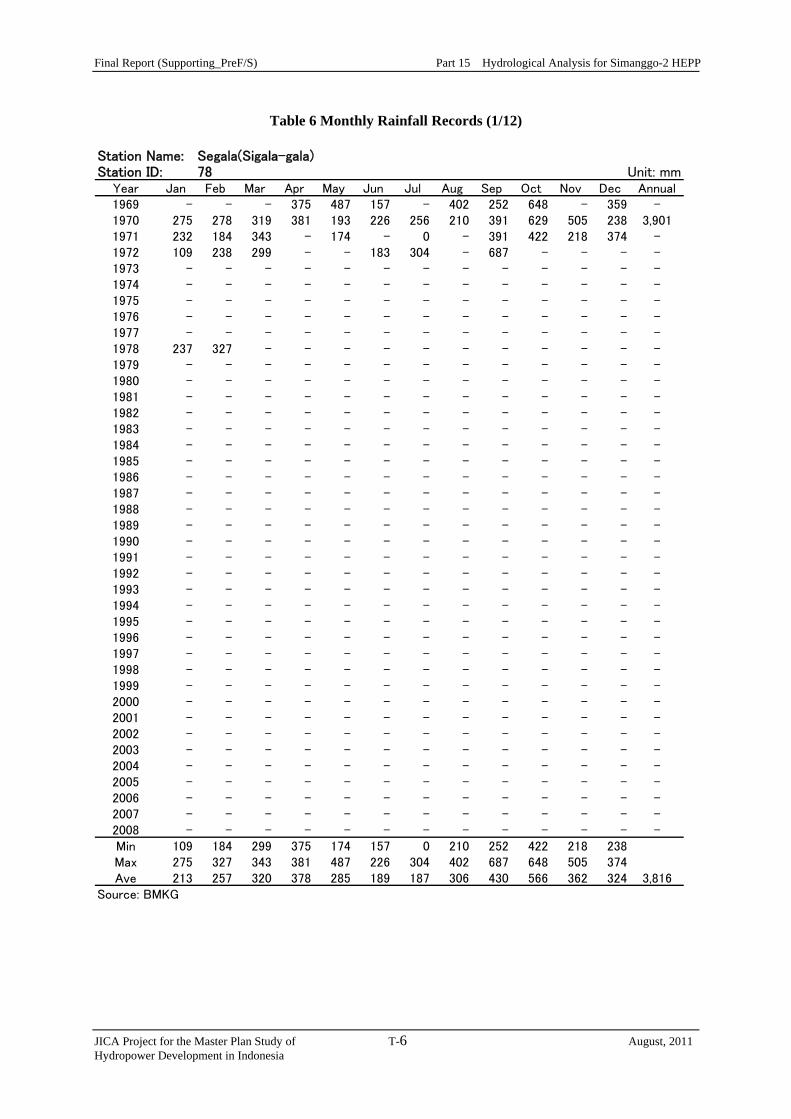
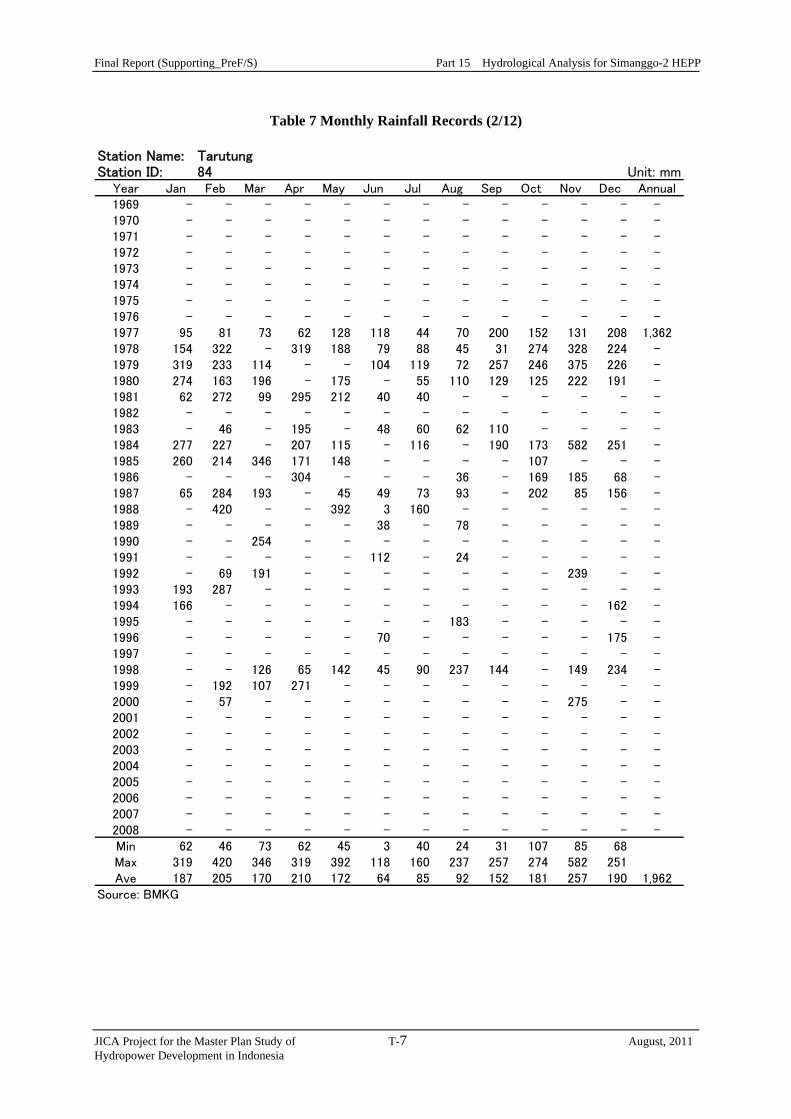
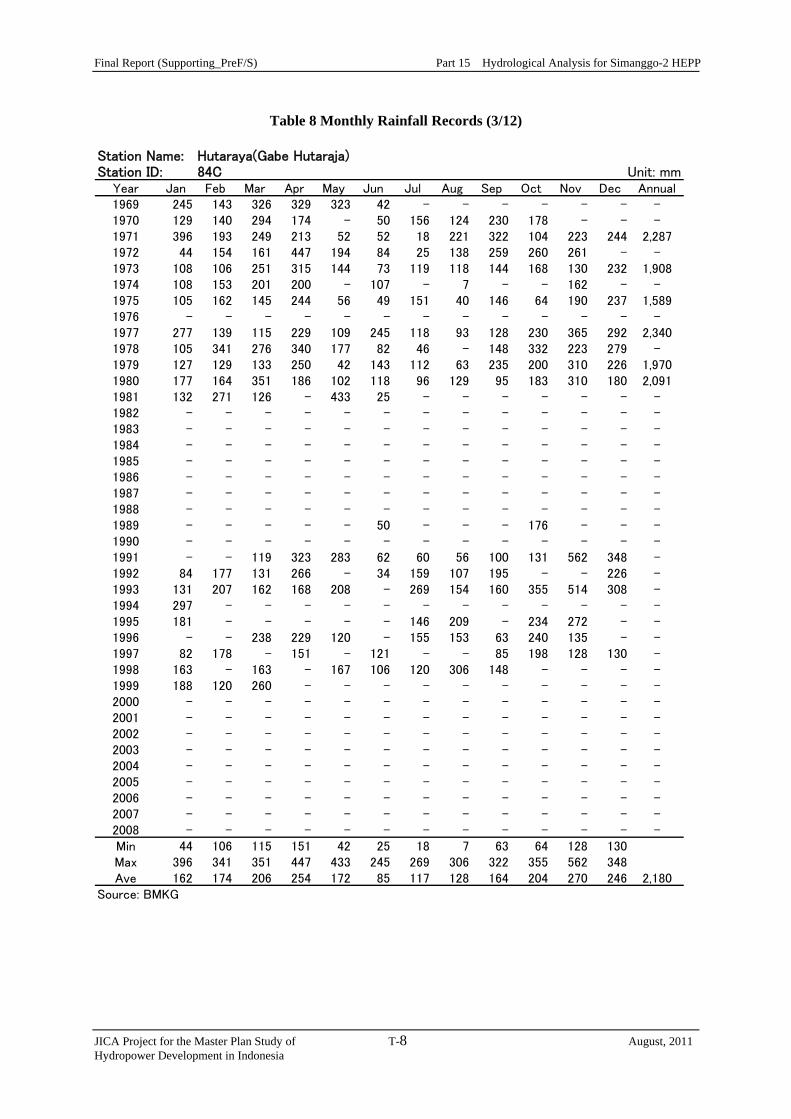
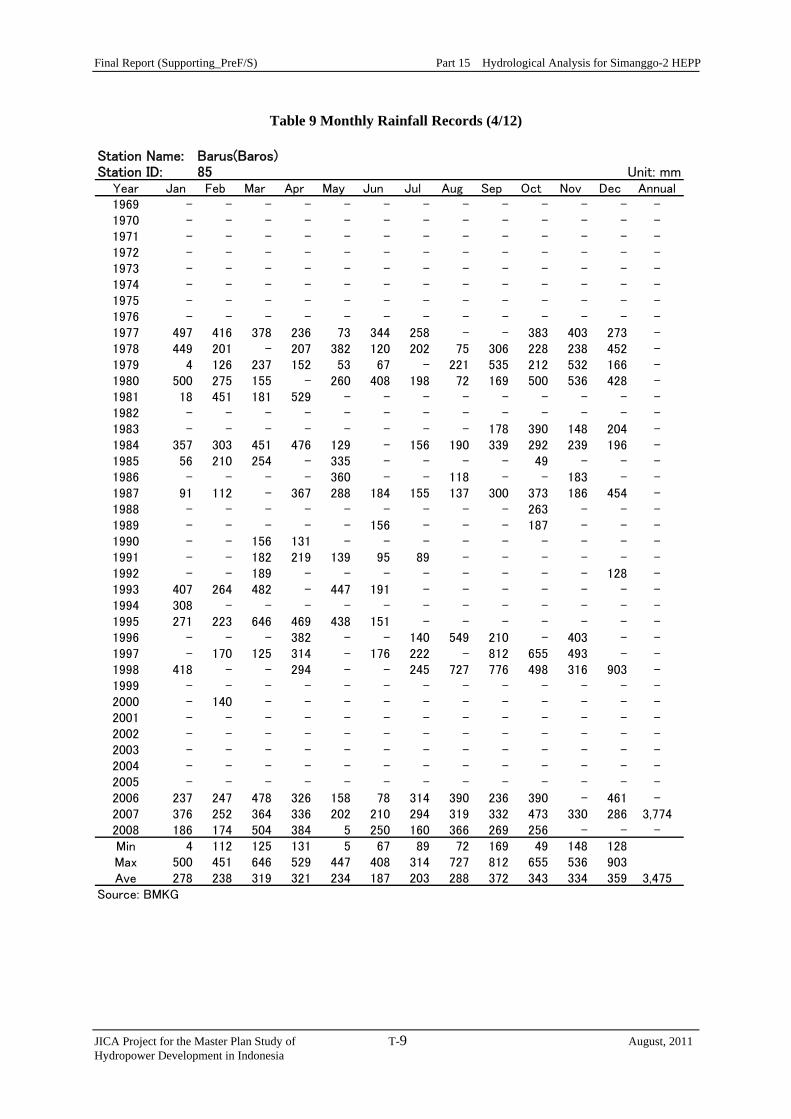
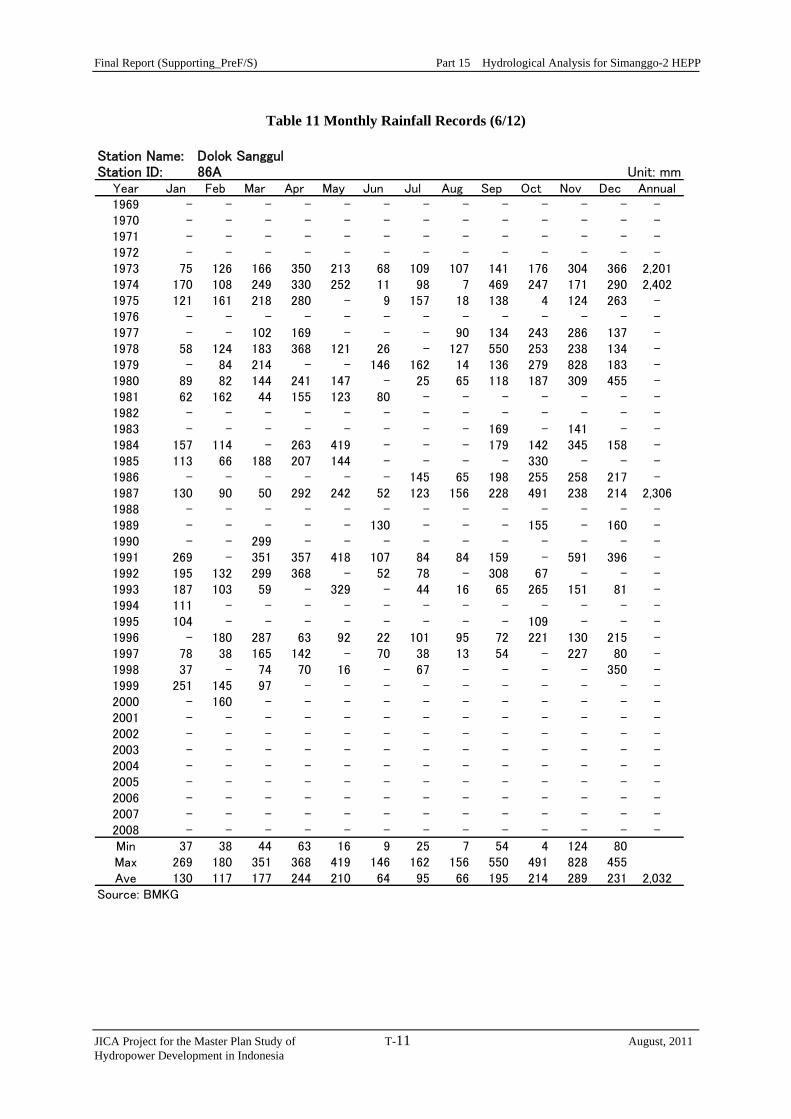
The monthly mean rainfall records are collected at 12 stations as presented in Table 6 to Table 17.
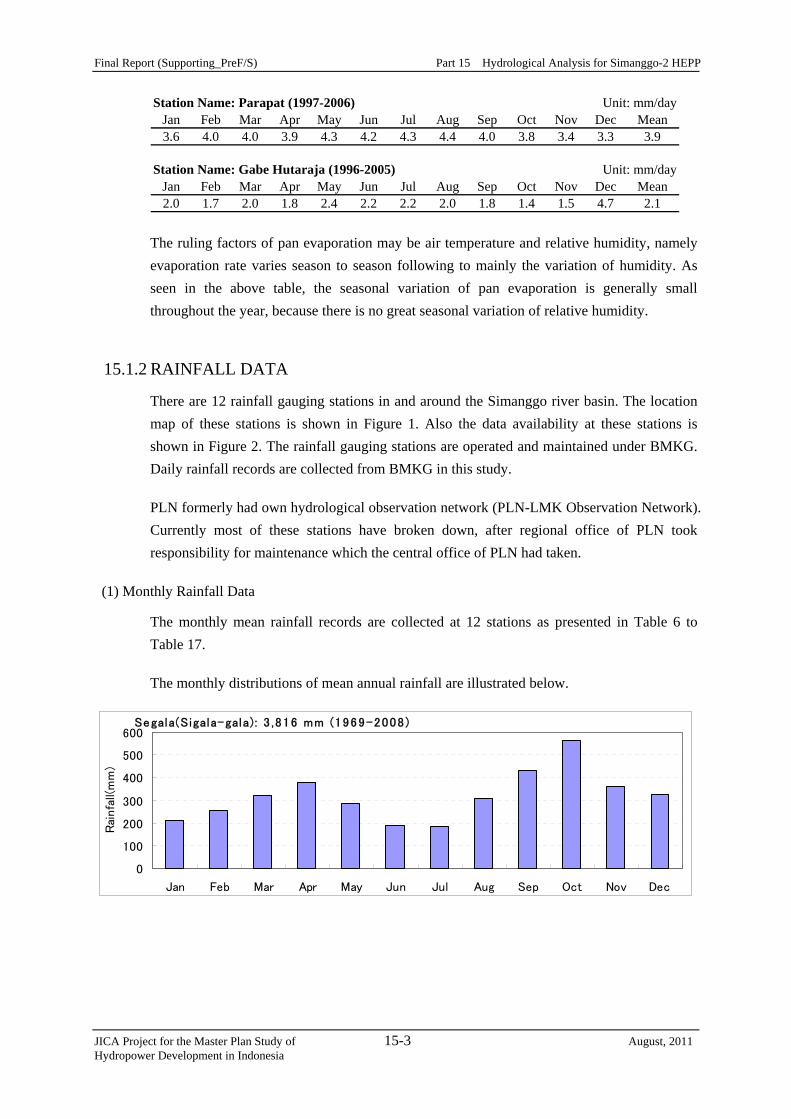
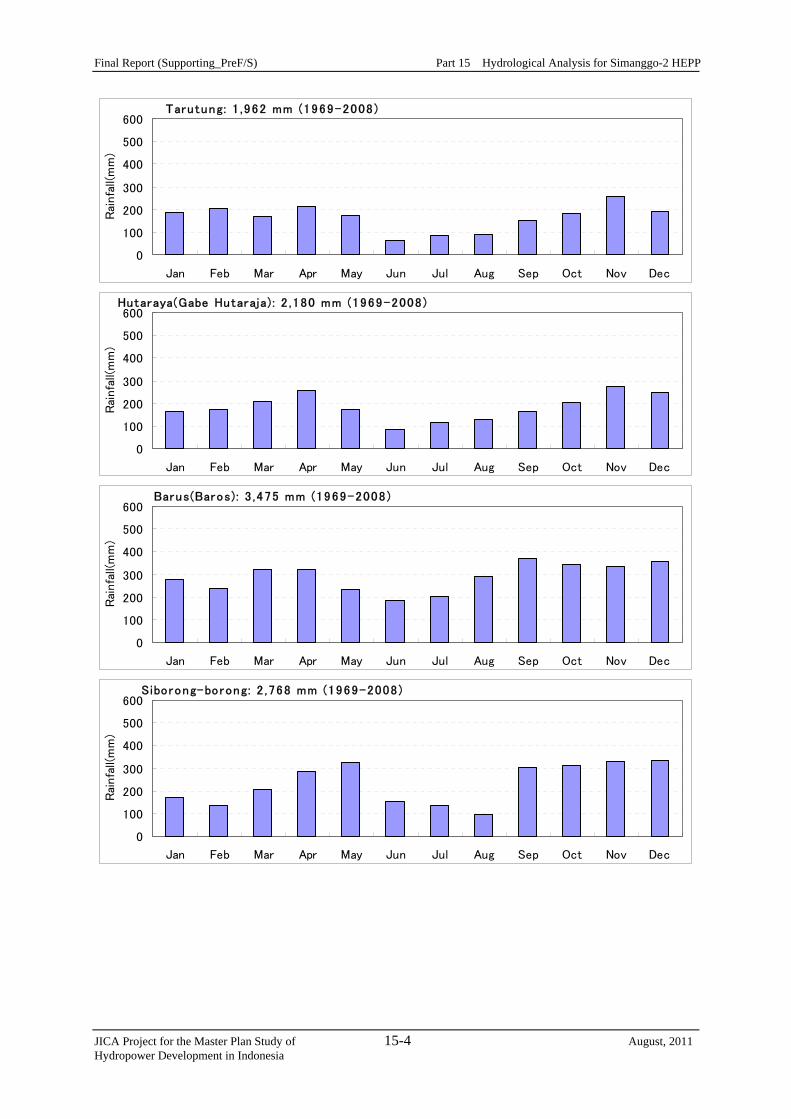
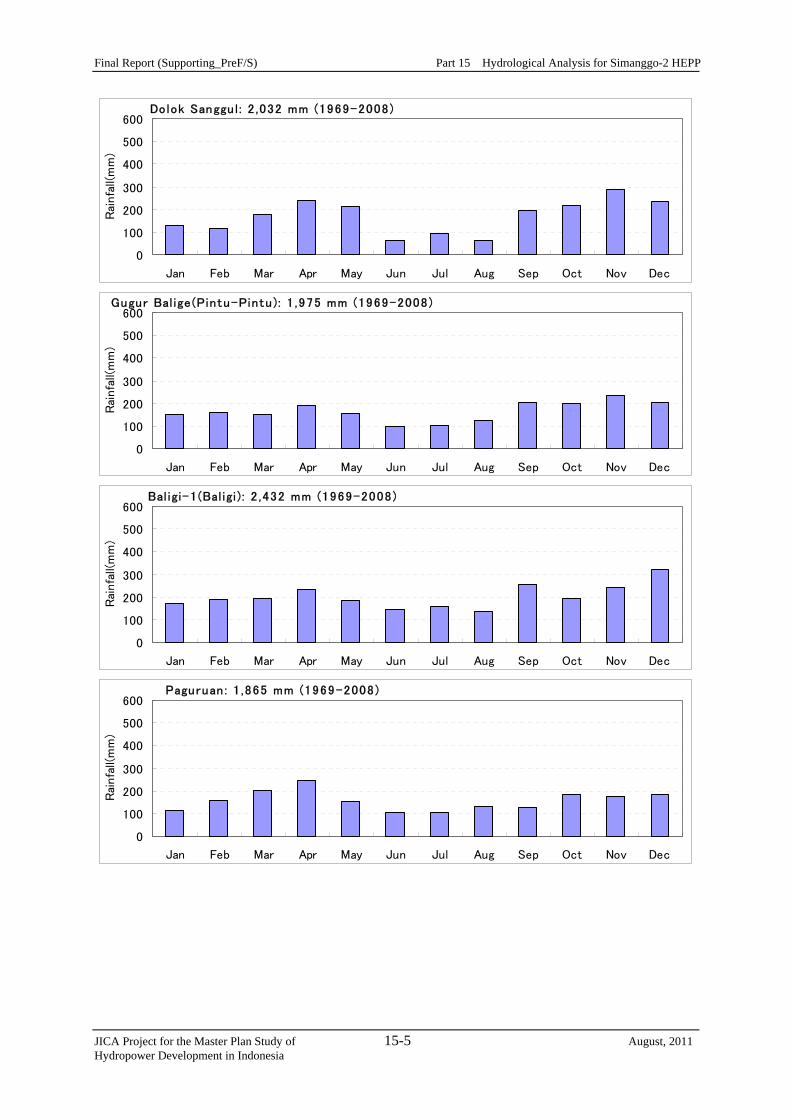
The monthly distributions of mean annual rainfall are illustrated below.
Segala(Sigala-gala): 3 ,816 mm (1969-2008)
0
100
200
300
400
500
600
Jan Feb Mar Apr May Jun Jul Aug Sep Oct Nov Dec
Rai
nfa
ll(m
m)
Final Report (Supporting_PreF/S) Part 15 Hydrological Analysis for Simanggo-2 HEPP
JICA Project for the Master Plan Study of 15-4 August, 2011 Hydropower Development in Indonesia
Tarutung: 1 ,962 mm (1969-2008)
0
100
200
300
400
500
600
Jan Feb Mar Apr May Jun Jul Aug Sep Oct Nov Dec
Rai
nfa
ll(m
m)
Hutaraya(Gabe Hutaraja) : 2 ,180 mm (1969-2008)
0
100
200
300
400
500
600
Jan Feb Mar Apr May Jun Jul Aug Sep Oct Nov Dec
Rai
nfa
ll(m
m)
Barus(Baros): 3 ,475 mm (1969-2008)
0
100
200
300
400
500
600
Jan Feb Mar Apr May Jun Jul Aug Sep Oct Nov Dec
Rai
nfa
ll(m
m)
Siborong-borong: 2 ,768 mm (1969-2008)
0
100
200
300
400
500
600
Jan Feb Mar Apr May Jun Jul Aug Sep Oct Nov Dec
Rai
nfa
ll(m
m)
Final Report (Supporting_PreF/S) Part 15 Hydrological Analysis for Simanggo-2 HEPP
JICA Project for the Master Plan Study of 15-5 August, 2011 Hydropower Development in Indonesia
Dolok Sanggu l : 2 ,032 mm (1969-2008)
0
100
200
300
400
500
600
Jan Feb Mar Apr May Jun Jul Aug Sep Oct Nov Dec
Rai
nfa
ll(m
m)
Gugur Bal ige (Pintu-Pintu ): 1 ,975 mm (1969-2008)
0
100
200
300
400
500
600
Jan Feb Mar Apr May Jun Jul Aug Sep Oct Nov Dec
Rai
nfa
ll(m
m)
Bal igi-1 (Bal igi ) : 2 ,432 mm (1969-2008)
0
100
200
300
400
500
600
Jan Feb Mar Apr May Jun Jul Aug Sep Oct Nov Dec
Rai
nfa
ll(m
m)
Paguruan : 1 ,865 mm (1969-2008)
0
100
200
300
400
500
600
Jan Feb Mar Apr May Jun Jul Aug Sep Oct Nov Dec
Rai
nfa
ll(m
m)
Final Report (Supporting_PreF/S) Part 15 Hydrological Analysis for Simanggo-2 HEPP
JICA Project for the Master Plan Study of 15-6 August, 2011 Hydropower Development in Indonesia
Salak: 3 ,089 mm (1969-2008)
0
100
200
300
400
500
600
Jan Feb Mar Apr May Jun Jul Aug Sep Oct Nov Dec
Rai
nfa
ll(m
m)
Sidikalang: 2 ,387 mm (1969-2008 )
0
100
200
300
400
500
600
Jan Feb Mar Apr May Jun Jul Aug Sep Oct Nov Dec
Rai
nfa
ll(m
m)
Tiga Lingga: 1 ,571 mm (1969-2008)
0
100
200
300
400
500
600
Jan Feb Mar Apr May Jun Jul Aug Sep Oct Nov Dec
Rai
nfa
ll(m
m)
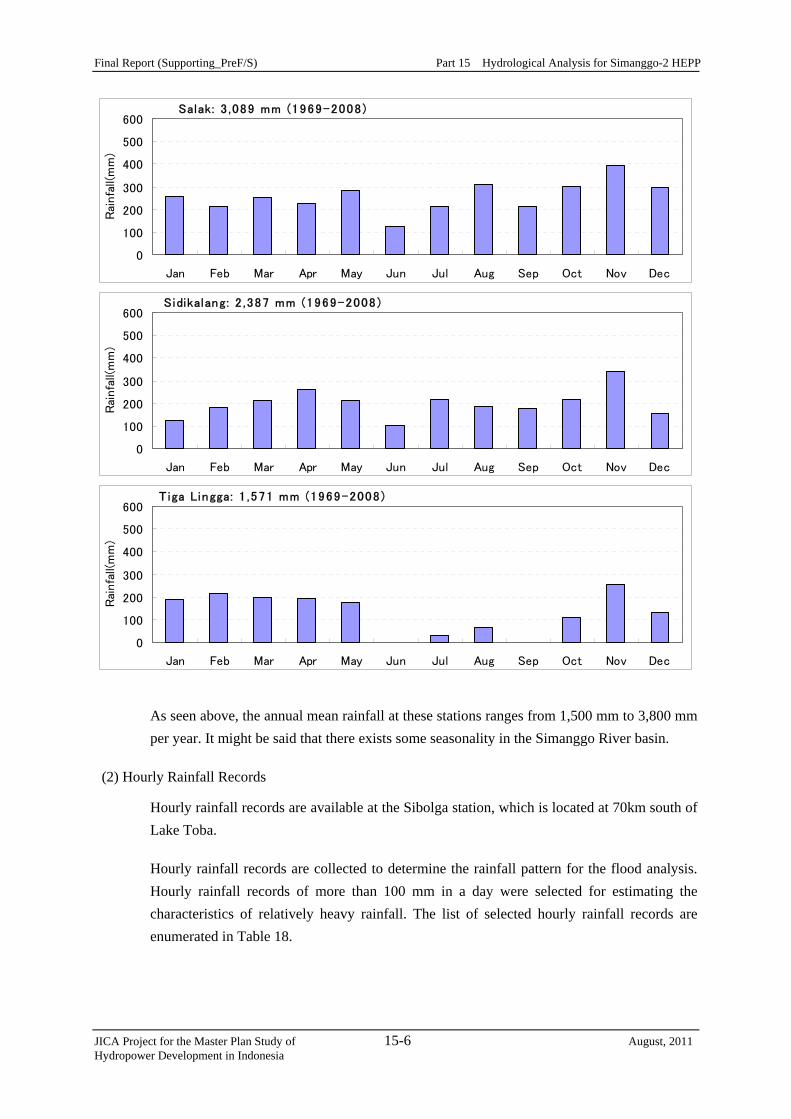
As seen above, the annual mean rainfall at these stations ranges from 1,500 mm to 3,800 mm per year. It might be said that there exists some seasonality in the Simanggo River basin.
(2) Hourly Rainfall Records
Hourly rainfall records are available at the Sibolga station, which is located at 70km south of Lake Toba.
Hourly rainfall records are collected to determine the rainfall pattern for the flood analysis. Hourly rainfall records of more than 100 mm in a day were selected for estimating the characteristics of relatively heavy rainfall. The list of selected hourly rainfall records are enumerated in Table 18.
Final Report (Supporting_PreF/S) Part 15 Hydrological Analysis for Simanggo-2 HEPP
JICA Project for the Master Plan Study of 15-7 August, 2011 Hydropower Development in Indonesia
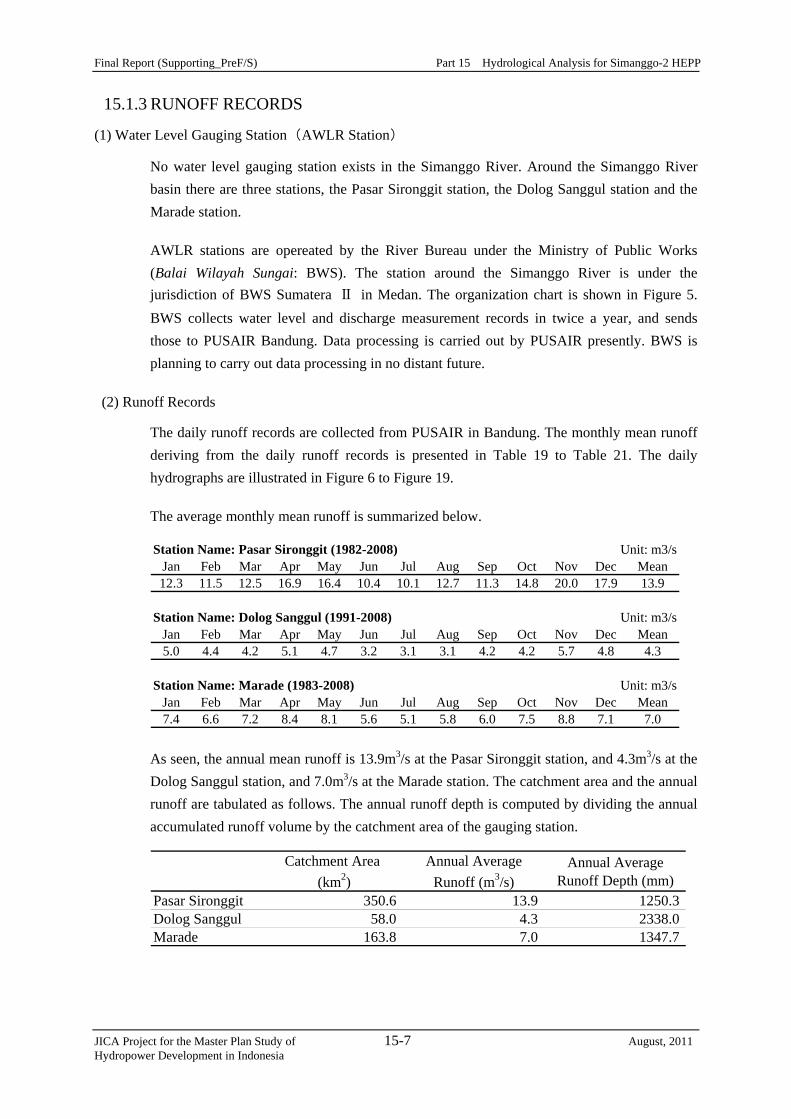
15.1.3 RUNOFF RECORDS
(1) Water Level Gauging Station(AWLR Station)
No water level gauging station exists in the Simanggo River. Around the Simanggo River basin there are three stations, the Pasar Sironggit station, the Dolog Sanggul station and the Marade station.
AWLR stations are opereated by the River Bureau under the Ministry of Public Works (Balai Wilayah Sungai: BWS). The station around the Simanggo River is under the jurisdiction of BWS Sumatera Ⅱ in Medan. The organization chart is shown in Figure 5. BWS collects water level and discharge measurement records in twice a year, and sends those to PUSAIR Bandung. Data processing is carried out by PUSAIR presently. BWS is planning to carry out data processing in no distant future.
(2) Runoff Records
The daily runoff records are collected from PUSAIR in Bandung. The monthly mean runoff deriving from the daily runoff records is presented in Table 19 to Table 21. The daily hydrographs are illustrated in Figure 6 to Figure 19.
The average monthly mean runoff is summarized below.
Station Name: Pasar Sironggit (1982-2008) Unit: m3/sJan Feb Mar Apr May Jun Jul Aug Sep Oct Nov Dec Mean12.3 11.5 12.5 16.9 16.4 10.4 10.1 12.7 11.3 14.8 20.0 17.9 13.9
Station Name: Dolog Sanggul (1991-2008) Unit: m3/sJan Feb Mar Apr May Jun Jul Aug Sep Oct Nov Dec Mean5.0 4.4 4.2 5.1 4.7 3.2 3.1 3.1 4.2 4.2 5.7 4.8 4.3
Station Name: Marade (1983-2008) Unit: m3/sJan Feb Mar Apr May Jun Jul Aug Sep Oct Nov Dec Mean7.4 6.6 7.2 8.4 8.1 5.6 5.1 5.8 6.0 7.5 8.8 7.1 7.0
As seen, the annual mean runoff is 13.9m3/s at the Pasar Sironggit station, and 4.3m3/s at the Dolog Sanggul station, and 7.0m3/s at the Marade station. The catchment area and the annual runoff are tabulated as follows. The annual runoff depth is computed by dividing the annual accumulated runoff volume by the catchment area of the gauging station.
Catchment Area (km2)
Annual AverageRunoff (m3/s)
Annual AverageRunoff Depth (mm)
Pasar Sironggit 350.6 13.9 1250.3Dolog Sanggul 58.0 4.3 2338.0Marade 163.8 7.0 1347.7
Final Report (Supporting_PreF/S) Part 15 Hydrological Analysis for Simanggo-2 HEPP
JICA Project for the Master Plan Study of 15-8 August, 2011 Hydropower Development in Indonesia
15.1.4 LOWFLOW ANALYSIS
(1) General Approach
The continuous long-term runoff data for a time period of more than 20 years at the proposed intake weir site is normally required for evaluating an optimum development scale of the project through power output computation. Further, it is highly expected that the runoff data should be of high accuracy because measurement on economic viability of project is highly dependent on the reliability of available runoff records.
On the Simanggo-2 HEPP, daily runoff records are required because the type of hydropower development scheme is runoff type.
As described in the previous chapter, no water level gauging station exists in the Simanggo River. Around the Simanggo River basin there is the Pasar Sironggit station. The daily runoff records are available from 1982 to 2008 except in 1988 to 1990, 1999, 2000, and 2002 to 2006. Furthermore, the remaining observation years still include data-missing periods. Therefore, it is necessary to supplement the runoff records at the Pasar Sironggit station by infilling of missing data.
On the other hand, the daily basin mean rainfall at the Pasar Sironggit station can be estimated for the period between 1977 and 1998. Thus the runoff data at the Pasar Sironggit station can be supplemented and expanded for the period of 1977 to 1998 by constructing a rainfall-runoff simulation model.
Along this line, the Tank Model Method is applied in this study as a rainfall-runoff model, the model parameters of which are calibrated by using rainfall and runoff records available in the period of 1991 to 1993.
Firstly, the reliability of the available runoff records at the Pasar Sironggit station for using calibration is evaluated by means of runoff coefficient and annual rainfall loss. Then lowflow analysis by the Tank Model Method is carried out to simulate 22-year long-term daily runoff data at the Pasar Sironggit station.
Finally the 22-year daily runoff data at the Simanggo-2 intake weir site is estimated.
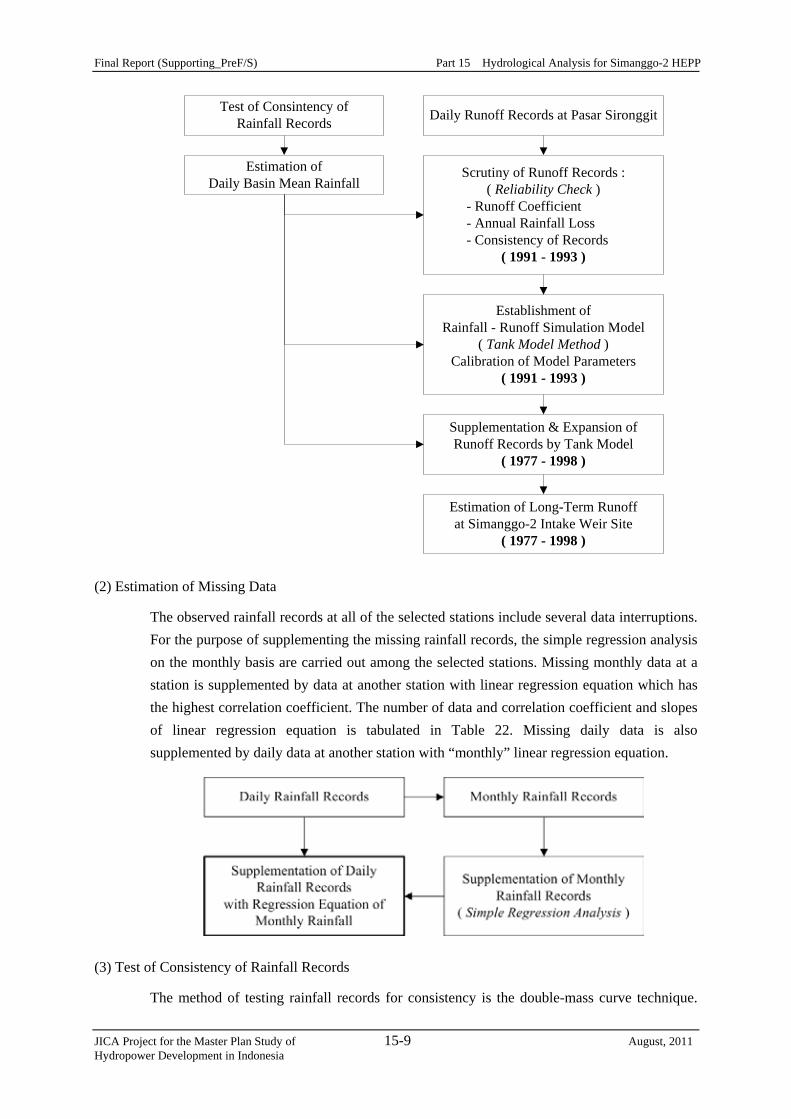
The outline of lowflow analysis is described below.
Final Report (Supporting_PreF/S) Part 15 Hydrological Analysis for Simanggo-2 HEPP
JICA Project for the Master Plan Study of 15-9 August, 2011 Hydropower Development in Indonesia
Test of Consintency ofRainfall Records
Estimation ofDaily Basin Mean Rainfall
Daily Runoff Records at Pasar Sironggit
Scrutiny of Runoff Records :( Reliability Check )
- Runoff Coefficient- Annual Rainfall Loss- Consistency of Records
( 1991 - 1993 )
Establishment ofRainfall - Runoff Simulation Model
( Tank Model Method )Calibration of Model Parameters
( 1991 - 1993 )
Supplementation & Expansion ofRunoff Records by Tank Model
( 1977 - 1998 )
Estimation of Long-Term Runoffat Simanggo-2 Intake Weir Site
( 1977 - 1998 )
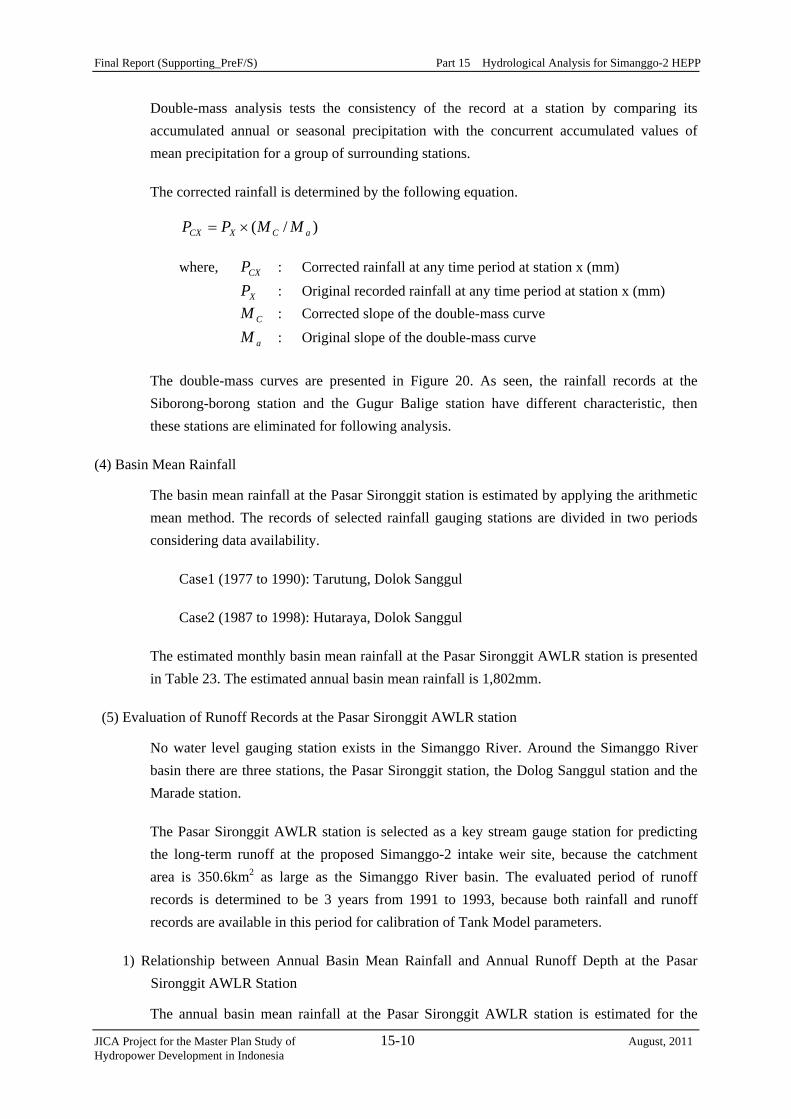
(2) Estimation of Missing Data
The observed rainfall records at all of the selected stations include several data interruptions. For the purpose of supplementing the missing rainfall records, the simple regression analysis on the monthly basis are carried out among the selected stations. Missing monthly data at a station is supplemented by data at another station with linear regression equation which has the highest correlation coefficient. The number of data and correlation coefficient and slopes of linear regression equation is tabulated in Table 22. Missing daily data is also supplemented by daily data at another station with “monthly” linear regression equation.
(3) Test of Consistency of Rainfall Records
The method of testing rainfall records for consistency is the double-mass curve technique.
Final Report (Supporting_PreF/S) Part 15 Hydrological Analysis for Simanggo-2 HEPP
JICA Project for the Master Plan Study of 15-10 August, 2011 Hydropower Development in Indonesia
Double-mass analysis tests the consistency of the record at a station by comparing its accumulated annual or seasonal precipitation with the concurrent accumulated values of mean precipitation for a group of surrounding stations.
The corrected rainfall is determined by the following equation.
)/( aCXCX MMPP ×=
where, CXP : Corrected rainfall at any time period at station x (mm) XP : Original recorded rainfall at any time period at station x (mm) CM : Corrected slope of the double-mass curve aM : Original slope of the double-mass curve
The double-mass curves are presented in Figure 20. As seen, the rainfall records at the Siborong-borong station and the Gugur Balige station have different characteristic, then these stations are eliminated for following analysis.
(4) Basin Mean Rainfall
The basin mean rainfall at the Pasar Sironggit station is estimated by applying the arithmetic mean method. The records of selected rainfall gauging stations are divided in two periods considering data availability.
Case1 (1977 to 1990): Tarutung, Dolok Sanggul
Case2 (1987 to 1998): Hutaraya, Dolok Sanggul
The estimated monthly basin mean rainfall at the Pasar Sironggit AWLR station is presented in Table 23. The estimated annual basin mean rainfall is 1,802mm.
(5) Evaluation of Runoff Records at the Pasar Sironggit AWLR station
No water level gauging station exists in the Simanggo River. Around the Simanggo River basin there are three stations, the Pasar Sironggit station, the Dolog Sanggul station and the Marade station.
The Pasar Sironggit AWLR station is selected as a key stream gauge station for predicting the long-term runoff at the proposed Simanggo-2 intake weir site, because the catchment area is 350.6km2 as large as the Simanggo River basin. The evaluated period of runoff records is determined to be 3 years from 1991 to 1993, because both rainfall and runoff records are available in this period for calibration of Tank Model parameters.
1) Relationship between Annual Basin Mean Rainfall and Annual Runoff Depth at the Pasar Sironggit AWLR Station
The annual basin mean rainfall at the Pasar Sironggit AWLR station is estimated for the
Final Report (Supporting_PreF/S) Part 15 Hydrological Analysis for Simanggo-2 HEPP
JICA Project for the Master Plan Study of 15-11 August, 2011 Hydropower Development in Indonesia
period of 1985 to 1987, and 1991 to 1998. On the other hand, the annual runoff depth at the Pasar Sironggit station is computed by dividing the annual runoff volume by its drainage area of 350.6km2 for the same period as above.
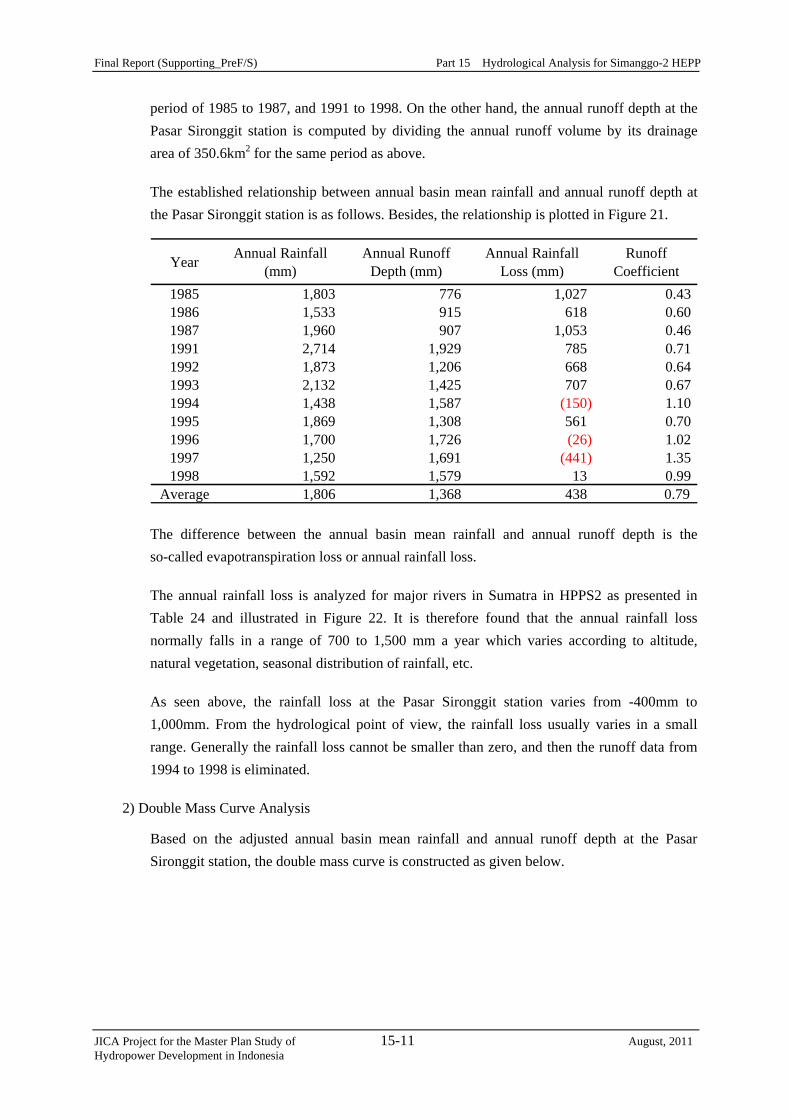
The established relationship between annual basin mean rainfall and annual runoff depth at the Pasar Sironggit station is as follows. Besides, the relationship is plotted in Figure 21.
Year Annual Rainfall(mm)
Annual RunoffDepth (mm)
Annual RainfallLoss (mm)
RunoffCoefficient
1985 1,803 776 1,027 0.431986 1,533 915 618 0.601987 1,960 907 1,053 0.461991 2,714 1,929 785 0.711992 1,873 1,206 668 0.641993 2,132 1,425 707 0.671994 1,438 1,587 (150) 1.101995 1,869 1,308 561 0.701996 1,700 1,726 (26) 1.021997 1,250 1,691 (441) 1.351998 1,592 1,579 13 0.99
Average 1,806 1,368 438 0.79
The difference between the annual basin mean rainfall and annual runoff depth is the so-called evapotranspiration loss or annual rainfall loss.
The annual rainfall loss is analyzed for major rivers in Sumatra in HPPS2 as presented in Table 24 and illustrated in Figure 22. It is therefore found that the annual rainfall loss normally falls in a range of 700 to 1,500 mm a year which varies according to altitude, natural vegetation, seasonal distribution of rainfall, etc.
As seen above, the rainfall loss at the Pasar Sironggit station varies from -400mm to 1,000mm. From the hydrological point of view, the rainfall loss usually varies in a small range. Generally the rainfall loss cannot be smaller than zero, and then the runoff data from 1994 to 1998 is eliminated.
2) Double Mass Curve Analysis
Based on the adjusted annual basin mean rainfall and annual runoff depth at the Pasar Sironggit station, the double mass curve is constructed as given below.

Final Report (Supporting_PreF/S) Part 15 Hydrological Analysis for Simanggo-2 HEPP
JICA Project for the Master Plan Study of 15-12 August, 2011 Hydropower Development in Indonesia
-
2,000
4,000
6,000
8,000
10,000
- 2,000 4,000 6,000 8,000 10,000 12,000 14,000
Accumulated Basin Mean Rainfall (mm)
Accum
ula
ted
Runoff
Depth
(m
m)
1985
1993
As shown above, the annual basin mean rainfall and annual runoff depth are plotted on a straight line, satisfactorily showing the hydrological consistency ready for Tank model analysis to be discussed in the next section.
(6) Tank Model
1) Concept of Tank Model Method
The Tank Model simulation method is widely applied for estimating river runoff from rainfall data. The Tank Model Method has been successfully applied for low-flow analysis in various water resources development projects in Indonesia.
Basic concept of Tank Model
The basic idea of Tank Model is very simple. Consider a tank having a hole at the bottom and another hole at the side as illustrated below.
Final Report (Supporting_PreF/S) Part 15 Hydrological Analysis for Simanggo-2 HEPP
JICA Project for the Master Plan Study of 15-13 August, 2011 Hydropower Development in Indonesia
When the tank is filled with water, the water will be released from the holes as shown in the above. In the tank model simulation, it is considered that the water released from the side hole corresponds to runoff from a stream, and the water from the bottom hole goes into the ground water zone.
The depth of water released from a hole is given by the following tank equation.
HQ ×=α
where, Q : Runoff depth of released water (mm)
α : Coefficient of hole H : Water depth above the hole (mm)
Applied Tank Model
For the purpose of natural runoff simulation, four by four (4×4) tanks combined in series are used as shown in Figure 23.
The top tank receives the rainfall as inflow to the tank, while the tanks below get the supply from the bottom holes of the tank directory above. The aggregated outflow from all the side holes of the tanks constitutes the inflow in the river course.
To effectively trace dry conditions in the basin, several modifications are made on the basic model. The model is firstly facilitated with a structure to simulate the moisture content in the top tank. This sub-model is composed of two moisture-bearing zones, which contain moisture up to the capacities of saturation. Between the two zones, the water transfers as expressed below.
)//(2 SSXSPSXPTCT −=
where, 2T : Transfer of moisture between primary and secondary zones (if positive, transfer occurs from primary to secondary, and vice versa) TC : Constant XP : Primary soil moisture depth PS : Primary soil moisture capacity XS : Secondary soil moisture depth SS : Secondary soil moisture capacity
When the primary soil moisture is not saturated and there is free water in lower tanks, the water goes up by capillary action so as to fill the primary soil moisture with the transfer speed T1 as given below.
)/1(1 PSXPTBT −=
Final Report (Supporting_PreF/S) Part 15 Hydrological Analysis for Simanggo-2 HEPP
JICA Project for the Master Plan Study of 15-14 August, 2011 Hydropower Development in Indonesia
where, 1T : Transfer of the water from lower tank with capillary action TB : Constant
There are many tank model parameters such as hole coefficients of each tank, and height of side holes of each tank. These parameters cannot be determined mathematically. Therefore, these parameters are subject to determination through trial-and-error calculations comparing the calculated runoff with the actually observed runoff.
2) Input Data for Calibration Model
The applied model and simulation condition for calibration are given below. The period for calibration set from 1991 to 1993 because there are continuously rainfall records and runoff records and the rainfall loss during the period is relatively stable.
Number of Tanks 4×4Calculation Time Interval 1 dayCalculation Period 1991 to 1993Observed Runoff at Pasar Sironggit 1991 to 1993Basin Mean Rainfall at Pasar Sironggit 1991 to 1993Monthly Average Evaporation at Gabe Hutaraja 1996 to 2005
The pan evaporation record at the Gabe Hutaraja station is applied. The pan coefficient of 0.8 is applied for estimating evapotranspiration in the basin. The average monthly pan evaporation is given below.
Station Name: Gabe Hutaraja (1996-2005) Unit: mm/dayJan Feb Mar Apr May Jun Jul Aug Sep Oct Nov Dec Mean2.0 1.7 2.0 1.8 2.4 2.2 2.2 2.0 1.8 1.4 1.5 4.7 2.1
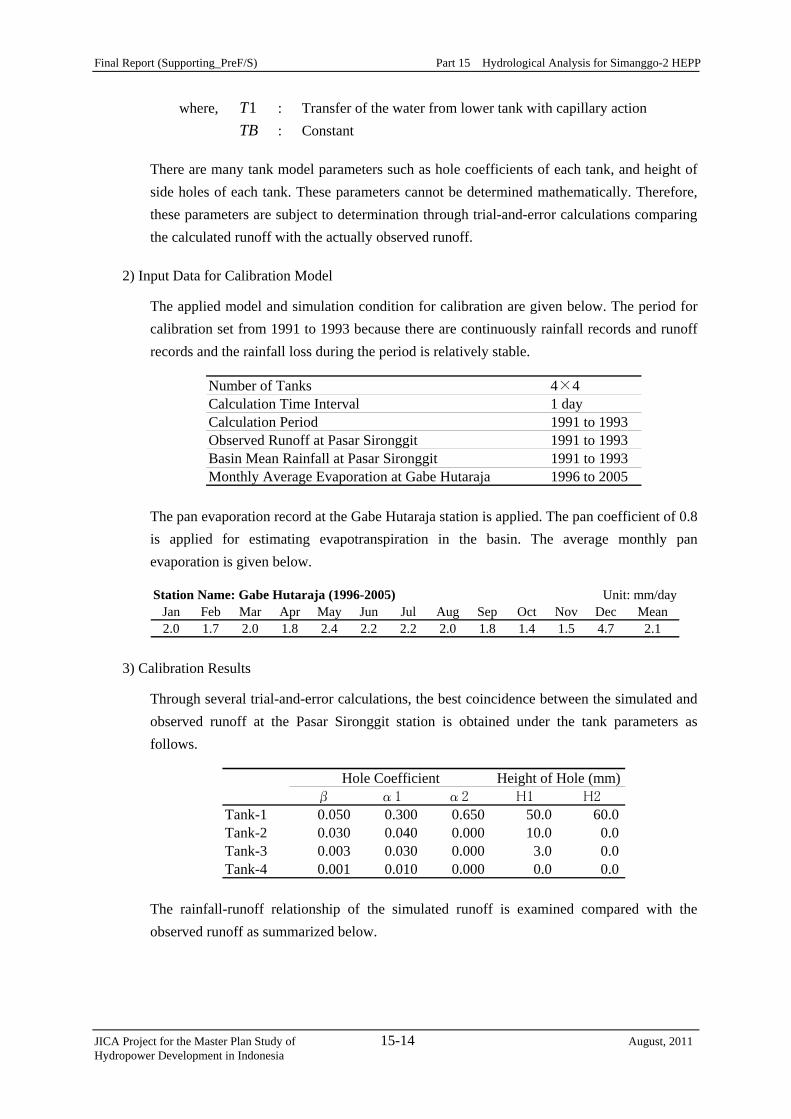
3) Calibration Results
Through several trial-and-error calculations, the best coincidence between the simulated and observed runoff at the Pasar Sironggit station is obtained under the tank parameters as follows.
Hole Coefficient Height of Hole (mm)β α1 α2 H1 H2
Tank-1 0.050 0.300 0.650 50.0 60.0Tank-2 0.030 0.040 0.000 10.0 0.0Tank-3 0.003 0.030 0.000 3.0 0.0Tank-4 0.001 0.010 0.000 0.0 0.0
The rainfall-runoff relationship of the simulated runoff is examined compared with the observed runoff as summarized below.
Final Report (Supporting_PreF/S) Part 15 Hydrological Analysis for Simanggo-2 HEPP
JICA Project for the Master Plan Study of 15-15 August, 2011 Hydropower Development in Indonesia
Observed Simulated Observed Simulated Observed Simulated
1991 2,711 1,929 1,759 783 952 0.71 0.65
1992 1,873 1,201 1,318 672 555 0.64 0.70
1993 2,131 1,424 1,421 707 710 0.67 0.67
Average 2,238 1,518 1,499 721 739 0.67 0.67
Runoff Coefficient
Year
AnnualRainfall(mm)
Annual Runoff Depth(mm)
Annual Rainfall Loss(mm)
As seen above, the average runoff coefficient and rainfall loss of the simulated runoff are derived to be 0.67 and 739mm, respectively. On the other hand, hydrological indices of the observed runoff at the Pasar Sironggit station are 0.67 and 721mm. These derived hydrological indices are judged to be in the hydrologically reasonable range.
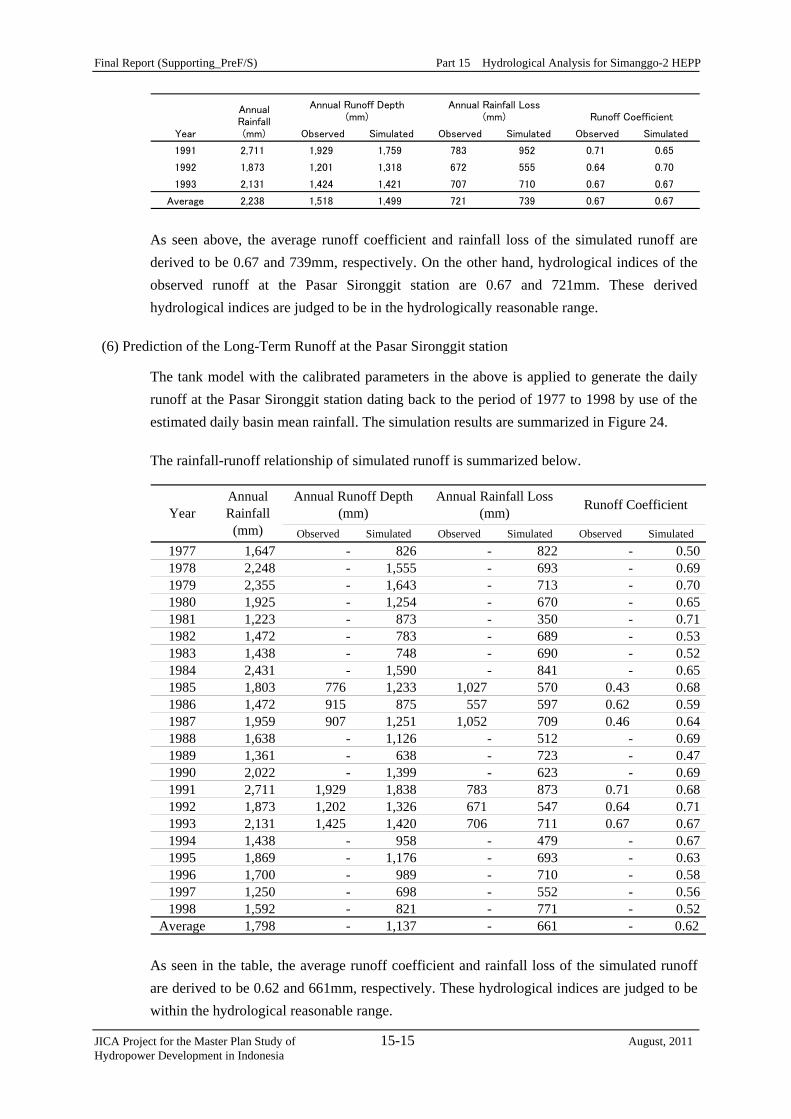
(6) Prediction of the Long-Term Runoff at the Pasar Sironggit station
The tank model with the calibrated parameters in the above is applied to generate the daily runoff at the Pasar Sironggit station dating back to the period of 1977 to 1998 by use of the estimated daily basin mean rainfall. The simulation results are summarized in Figure 24.
The rainfall-runoff relationship of simulated runoff is summarized below.
Observed Simulated Observed Simulated Observed Simulated1977 1,647 - 826 - 822 - 0.501978 2,248 - 1,555 - 693 - 0.691979 2,355 - 1,643 - 713 - 0.701980 1,925 - 1,254 - 670 - 0.651981 1,223 - 873 - 350 - 0.711982 1,472 - 783 - 689 - 0.531983 1,438 - 748 - 690 - 0.521984 2,431 - 1,590 - 841 - 0.651985 1,803 776 1,233 1,027 570 0.43 0.681986 1,472 915 875 557 597 0.62 0.591987 1,959 907 1,251 1,052 709 0.46 0.641988 1,638 - 1,126 - 512 - 0.691989 1,361 - 638 - 723 - 0.471990 2,022 - 1,399 - 623 - 0.691991 2,711 1,929 1,838 783 873 0.71 0.681992 1,873 1,202 1,326 671 547 0.64 0.711993 2,131 1,425 1,420 706 711 0.67 0.671994 1,438 - 958 - 479 - 0.671995 1,869 - 1,176 - 693 - 0.631996 1,700 - 989 - 710 - 0.581997 1,250 - 698 - 552 - 0.561998 1,592 - 821 - 771 - 0.52
Average 1,798 - 1,137 - 661 - 0.62
Runoff CoefficientYearAnnualRainfall
(mm)
Annual Runoff Depth(mm)
Annual Rainfall Loss(mm)
As seen in the table, the average runoff coefficient and rainfall loss of the simulated runoff are derived to be 0.62 and 661mm, respectively. These hydrological indices are judged to be within the hydrological reasonable range.

Final Report (Supporting_PreF/S) Part 15 Hydrological Analysis for Simanggo-2 HEPP
JICA Project for the Master Plan Study of 15-16 August, 2011 Hydropower Development in Indonesia
The daily runoff data for the flow duration curve is consisted of 6-year observed daily runoff in 1985 to 1987, and 1991 to 1993, and of 16-year simulated daily runoff in remaining period from 1977 to 1996. The flow duration curve for the 22-year runoff is drawn by arranging the discharges in descending order and assigning probabilities to each discharge. The flow duration curve of the observed and simulated runoff is shown in Figure 25.
(8) Long-Term Runoff at the Simanggo-2 Intake Weir Site
The long-term daily runoff at Simanggo-2 intake weir site for 22 years in the period of 1977 to 1998 is estimated from the predicted long-term daily runoff at the Pasar Sironggit station by using the following equation. The annual basin rainfall at Simanggo-2 basin is estimated from the isohyetal map, illustrated in Figure 26. The flow duration curve as shown in Figure 27, is drawn by arranging the discharges in descending order and assigning probabilities to each discharge.
W
D
W
DWD R
RAAQQ ××=
where, DQ : Runoff at Simanggo-2 intake weir site (m3/sec) WQ : Runoff at Pasar Sironggit AWLR station (m3/sec) DA : Catchment area at Simanggo -2 intake weir site (=478.3km2) WA : Catchment area at Pasar Sironggit AWLR station (=350.6km2) DR : Annual basin mean rainfall at Simanggo-2 intake weir site
(=2,709mm) WR : Annual basin mean rainfall at Pasar Sironggit AWLR station
(=1,802mm)
(9) Water Level Observation and Discharge Measurement
The field investigation of 3 month water level observation and 30 times discharge measurement was carried out from 2010 September 28th to 2010 December 31st by the sub-contractor. Location of the observation is at 2km upstream of the Simanggo-2 intake weir site (St.1). The location map of observation is shown in Figure 28. H-Q rating curve is established on the basis of observed water level and discharge, and hydrograph is established on the basis of observed water level and H-Q rating curve. Hydrograph is illustrated in Figure 29 and H-Q plot is shown in Figure 30.
Consequently, the average water level is 0.58m and the average runoff is 26.69 m3/s calculated with H-Q rating curve. The Equation of H-Q rating curve is given below.
2)29.0(01.35 +×= HQ
where, Q : Runoff (m3/sec)
H : Water level (m)
Final Report (Supporting_PreF/S) Part 15 Hydrological Analysis for Simanggo-2 HEPP
JICA Project for the Master Plan Study of 15-17 August, 2011 Hydropower Development in Indonesia
Runoff at the Simanggo-2 intake weir site is estimated using the following equation.
)/( WDWD AAQQ ×=
where, DQ : Runoff at Simanggo-2 intake weir site (m3/sec) WQ : Runoff at the water level gauge (m3/sec) DA : Catchment area at Simanggo-2 intake weir site (=478.3km2) WA : Catchment area at water level gauge (=290.6km2)
The estimated average runoff at the Simanggo-2 intake weir site is 43.93m3/s.
The observed average runoff is about 10% of probability on the duration curve shown in Figure 27.
(10) PLTM Palilitan
There is an existing intake weir of PLTM Palilitan at upstream of Simanggo-2 intake weir site. In the project report of PLTM Palilitan, the average runoff is estimated to be 22.865 m3/s with low-flow analysis from 1984 to 1994. Runoff at the Simanggo-2 intake weir site can be estimated with the following equation.
)/( WDWD AAQQ ×=
where, DQ : Runoff at Simanggo-2 intake weir site (m3/sec) WQ : Runoff at PLTM Palilitan intake weir site (m3/sec) DA : Catchment area at Simanggo-2 intake weir site (=478.3km2) WA : Catchment area at PLTM Palilitan intake weir site (=436km2)
Consequently, the average runoff at the Simanggo-2 intake weir site is 25.08m3/s. The catchment area of PLTM Palilitan is measured in HPPS2 as Simanggo-1 HEPP.
15.1.5 FLOOD ANALYSIS
(1) General Approach
Flood analysis is carried out to estimate the probable floods with various return periods as well as the probable maximum flood (PMF) at the Simanggo-2 intake weir site which are basically required for design of spillway and diversion facilities, and determination of dam height.
For estimating the probable floods, the unit hydrograph method is applied, which synthesizes the various probable runoff hydrographs from the probable basin mean rainfalls based on the relationship between unit of basin mean rainfall and its runoff, that is the so-called unit hydrograph. It is generally agreed that the unit hydrograph method is applied for catchment

Final Report (Supporting_PreF/S) Part 15 Hydrological Analysis for Simanggo-2 HEPP
JICA Project for the Master Plan Study of 15-18 August, 2011 Hydropower Development in Indonesia
areas less than 3,000 km2.
In this study, the Soil Conservation Service (SCS) unit hydrograph, which is empirically developed in USA Department of the Interior is used, because no hourly flood hydrograph is available in the Simanggo River basin to construct the unit hydrograph.
The general approach of flood analysis is outlined below.
(2) Rainfall Analysis
1) Depth-Area-Duration (DAD) Analysis
DAD analysis is carried out to examine the following relationships.
Relationship between rainfall depth and duration (DD Analysis)
Relationship between rainfall depth and area (DA Analysis)
a) Depth-Duration (DD) Analysis
Generally, heavy rainfall occurs intensively in a short duration and sporadically in a limited area. The hourly rainfall records around the Simanggo River basin are shown in Table 18.
The design rainfall curve is derived from collected 31 hourly rainfall curves. The
accumulated hourly rainfall curves and the design rainfall curve are presented in Figure 32.
Final Report (Supporting_PreF/S) Part 15 Hydrological Analysis for Simanggo-2 HEPP
JICA Project for the Master Plan Study of 15-19 August, 2011 Hydropower Development in Indonesia
b) Depth-Area (DA) Analysis
Generally, heavy rainfall occurs intensively in a short duration and sporadically in a limited area. Therefore the average depth of storm rainfall (basin mean rainfall) is likely to be smaller than the point depth of storm rainfall.
In general, relation between point rainfall depth and average area is expressed by an exponential equation given by the following equation.
]exp[0n
b kAPP −×=
where, bP : Average rainfall depth over an area A (mm) 0P : Maximum point rainfall at the storm center (mm)
A : Area in question (km2) nk, : Constants for a given area
The above equation is the so-called Horton’s Equation. Constants k and n usually vary according to the given rainfall duration such as 1 hour, 6 hours, 12 hours, 1 day, etc. These constants are to be obtained through rainfall analysis based on the isohyetal maps of various major rain storms occurred in the river basin in question. However, the exact determination of 0P is practically impossible, because it is very unlikely that the rain storm center
coincides with a rainfall gauging station.
To estimate the basin mean rainfall from the point rainfall, the area reduction factor showing the ratio of basin mean rainfall to point rainfall is introduced as expressed below.
0PfP ab ×=
where, bP : Basin mean rainfall (mm) 0P : Point rainfall (mm) af : Area reduction factor
If the Horton’s equation is applied, the area reduction factor under the given rainfall duration is given by the following equation.
]exp[ na kAf −=
However the available rain storm records in the Simanggo River basin are insufficient for reliable determination of the area reduction factor. The preliminary estimation of the design area reduction factor is carried out based on the following three approaches.
Firstly, the area reduction factor is estimated as 0.63 under the catchment area of 478.3 km2 for the Simanggo-2 intake weir site by applying the Horton’s equation assuming that constants of k and n are 0.1 and 0.25, respectively. These constants have been widely and
Final Report (Supporting_PreF/S) Part 15 Hydrological Analysis for Simanggo-2 HEPP
JICA Project for the Master Plan Study of 15-20 August, 2011 Hydropower Development in Indonesia
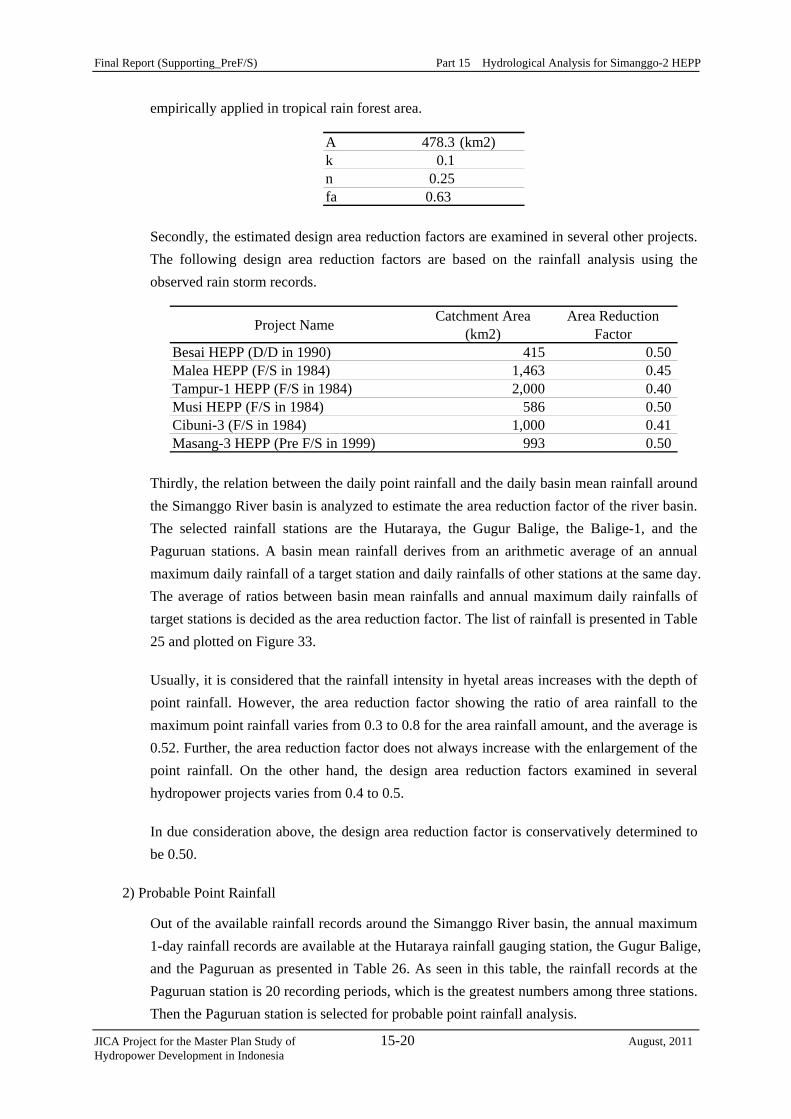
empirically applied in tropical rain forest area.
A 478.3 (km2)k 0.1n 0.25fa 0.63
Secondly, the estimated design area reduction factors are examined in several other projects. The following design area reduction factors are based on the rainfall analysis using the observed rain storm records.
Project Name Catchment Area(km2)
Area ReductionFactor
Besai HEPP (D/D in 1990) 415 0.50Malea HEPP (F/S in 1984) 1,463 0.45Tampur-1 HEPP (F/S in 1984) 2,000 0.40Musi HEPP (F/S in 1984) 586 0.50Cibuni-3 (F/S in 1984) 1,000 0.41Masang-3 HEPP (Pre F/S in 1999) 993 0.50
Thirdly, the relation between the daily point rainfall and the daily basin mean rainfall around the Simanggo River basin is analyzed to estimate the area reduction factor of the river basin. The selected rainfall stations are the Hutaraya, the Gugur Balige, the Balige-1, and the Paguruan stations. A basin mean rainfall derives from an arithmetic average of an annual maximum daily rainfall of a target station and daily rainfalls of other stations at the same day. The average of ratios between basin mean rainfalls and annual maximum daily rainfalls of target stations is decided as the area reduction factor. The list of rainfall is presented in Table 25 and plotted on Figure 33.
Usually, it is considered that the rainfall intensity in hyetal areas increases with the depth of point rainfall. However, the area reduction factor showing the ratio of area rainfall to the maximum point rainfall varies from 0.3 to 0.8 for the area rainfall amount, and the average is 0.52. Further, the area reduction factor does not always increase with the enlargement of the point rainfall. On the other hand, the design area reduction factors examined in several hydropower projects varies from 0.4 to 0.5.
In due consideration above, the design area reduction factor is conservatively determined to be 0.50.
2) Probable Point Rainfall
Out of the available rainfall records around the Simanggo River basin, the annual maximum 1-day rainfall records are available at the Hutaraya rainfall gauging station, the Gugur Balige, and the Paguruan as presented in Table 26. As seen in this table, the rainfall records at the Paguruan station is 20 recording periods, which is the greatest numbers among three stations. Then the Paguruan station is selected for probable point rainfall analysis.
Final Report (Supporting_PreF/S) Part 15 Hydrological Analysis for Simanggo-2 HEPP
JICA Project for the Master Plan Study of 15-21 August, 2011 Hydropower Development in Indonesia
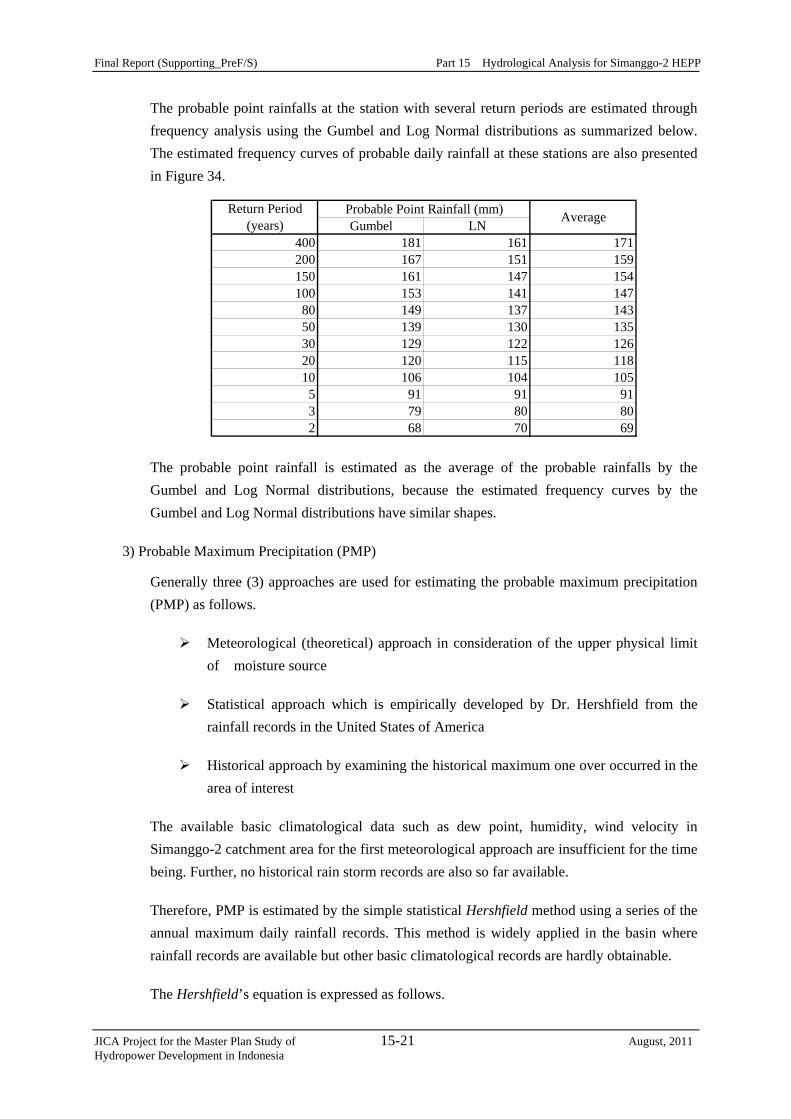
The probable point rainfalls at the station with several return periods are estimated through frequency analysis using the Gumbel and Log Normal distributions as summarized below. The estimated frequency curves of probable daily rainfall at these stations are also presented in Figure 34.
Gumbel LN400 181 161 171200 167 151 159150 161 147 154100 153 141 147
80 149 137 14350 139 130 13530 129 122 12620 120 115 11810 106 104 105
5 91 91 913 79 80 802 68 70 69
Return Period(years)
Probable Point Rainfall (mm) Average
The probable point rainfall is estimated as the average of the probable rainfalls by the Gumbel and Log Normal distributions, because the estimated frequency curves by the Gumbel and Log Normal distributions have similar shapes.
3) Probable Maximum Precipitation (PMP)
Generally three (3) approaches are used for estimating the probable maximum precipitation (PMP) as follows.
Meteorological (theoretical) approach in consideration of the upper physical limit of moisture source
Statistical approach which is empirically developed by Dr. Hershfield from the rainfall records in the United States of America
Historical approach by examining the historical maximum one over occurred in the area of interest
The available basic climatological data such as dew point, humidity, wind velocity in Simanggo-2 catchment area for the first meteorological approach are insufficient for the time being. Further, no historical rain storm records are also so far available.
Therefore, PMP is estimated by the simple statistical Hershfield method using a series of the annual maximum daily rainfall records. This method is widely applied in the basin where rainfall records are available but other basic climatological records are hardly obtainable.
The Hershfield’s equation is expressed as follows.
Final Report (Supporting_PreF/S) Part 15 Hydrological Analysis for Simanggo-2 HEPP
JICA Project for the Master Plan Study of 15-22 August, 2011 Hydropower Development in Indonesia
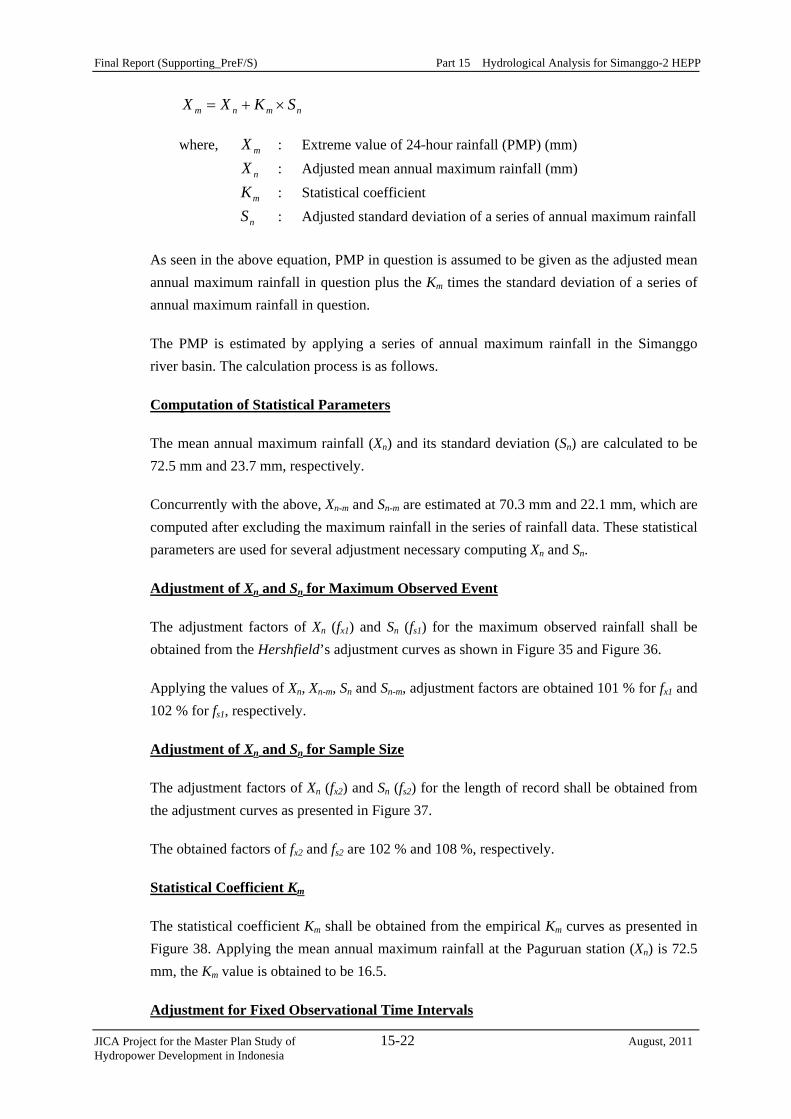
nmnm SKXX ×+=
where, mX : Extreme value of 24-hour rainfall (PMP) (mm) nX : Adjusted mean annual maximum rainfall (mm) mK : Statistical coefficient nS : Adjusted standard deviation of a series of annual maximum rainfall
As seen in the above equation, PMP in question is assumed to be given as the adjusted mean annual maximum rainfall in question plus the Km times the standard deviation of a series of annual maximum rainfall in question.
The PMP is estimated by applying a series of annual maximum rainfall in the Simanggo river basin. The calculation process is as follows.
Computation of Statistical Parameters
The mean annual maximum rainfall (Xn) and its standard deviation (Sn) are calculated to be 72.5 mm and 23.7 mm, respectively.
Concurrently with the above, Xn-m and Sn-m are estimated at 70.3 mm and 22.1 mm, which are computed after excluding the maximum rainfall in the series of rainfall data. These statistical parameters are used for several adjustment necessary computing Xn and Sn.
Adjustment of Xn and Sn for Maximum Observed Event
The adjustment factors of Xn (fx1) and Sn (fs1) for the maximum observed rainfall shall be obtained from the Hershfield’s adjustment curves as shown in Figure 35 and Figure 36.
Applying the values of Xn, Xn-m, Sn and Sn-m, adjustment factors are obtained 101 % for fx1 and 102 % for fs1, respectively.
Adjustment of Xn and Sn for Sample Size
The adjustment factors of Xn (fx2) and Sn (fs2) for the length of record shall be obtained from the adjustment curves as presented in Figure 37.
The obtained factors of fx2 and fs2 are 102 % and 108 %, respectively.
Statistical Coefficient Km
The statistical coefficient Km shall be obtained from the empirical Km curves as presented in Figure 38. Applying the mean annual maximum rainfall at the Paguruan station (Xn) is 72.5 mm, the Km value is obtained to be 16.5.
Adjustment for Fixed Observational Time Intervals
Final Report (Supporting_PreF/S) Part 15 Hydrological Analysis for Simanggo-2 HEPP
JICA Project for the Master Plan Study of 15-23 August, 2011 Hydropower Development in Indonesia
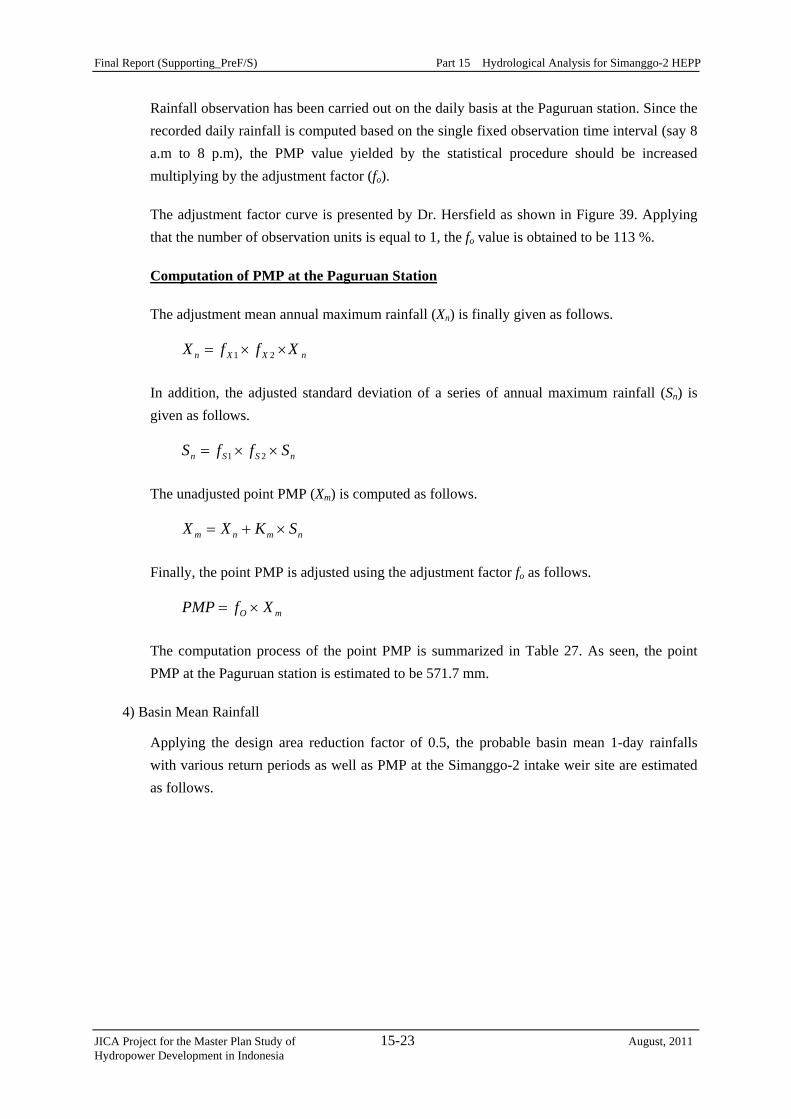
Rainfall observation has been carried out on the daily basis at the Paguruan station. Since the recorded daily rainfall is computed based on the single fixed observation time interval (say 8 a.m to 8 p.m), the PMP value yielded by the statistical procedure should be increased multiplying by the adjustment factor (fo).
The adjustment factor curve is presented by Dr. Hersfield as shown in Figure 39. Applying that the number of observation units is equal to 1, the fo value is obtained to be 113 %.
Computation of PMP at the Paguruan Station
The adjustment mean annual maximum rainfall (Xn) is finally given as follows.
nXXn XffX ××= 21
In addition, the adjusted standard deviation of a series of annual maximum rainfall (Sn) is given as follows.
nSSn SffS ××= 21
The unadjusted point PMP (Xm) is computed as follows.
nmnm SKXX ×+=
Finally, the point PMP is adjusted using the adjustment factor fo as follows.
mO XfPMP ×=
The computation process of the point PMP is summarized in Table 27. As seen, the point PMP at the Paguruan station is estimated to be 571.7 mm.
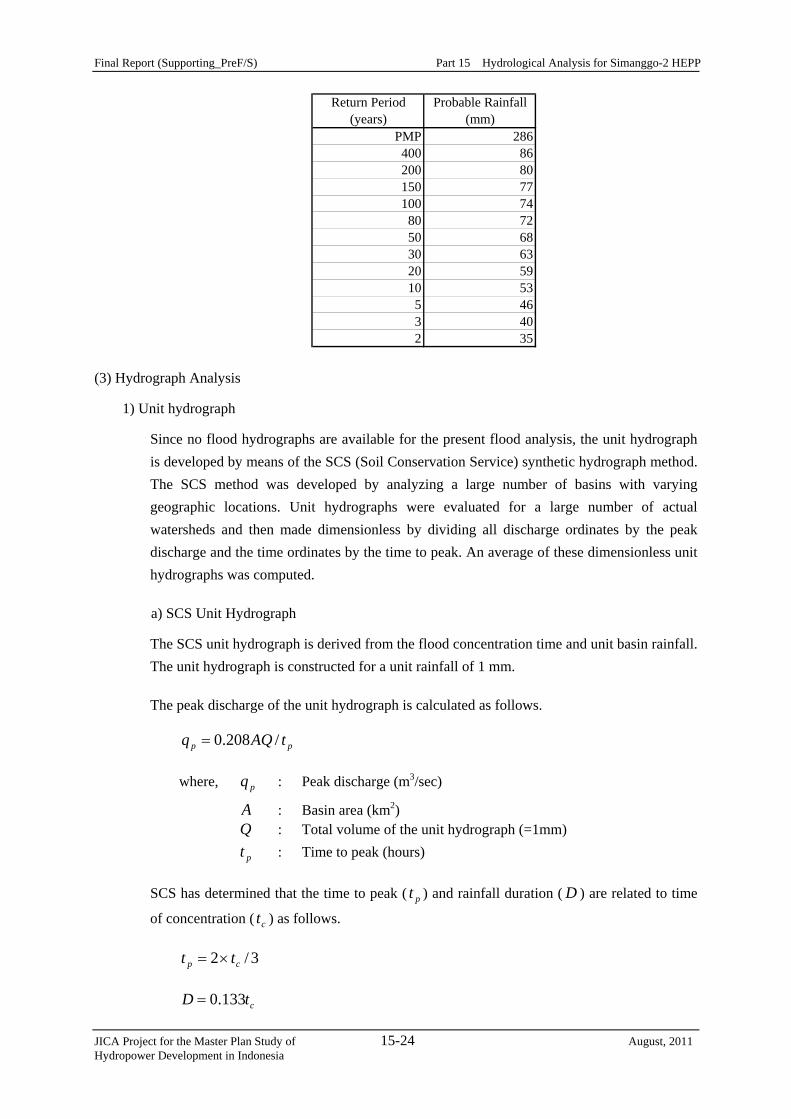
4) Basin Mean Rainfall
Applying the design area reduction factor of 0.5, the probable basin mean 1-day rainfalls with various return periods as well as PMP at the Simanggo-2 intake weir site are estimated as follows.
Final Report (Supporting_PreF/S) Part 15 Hydrological Analysis for Simanggo-2 HEPP
JICA Project for the Master Plan Study of 15-24 August, 2011 Hydropower Development in Indonesia
PMP 286400 86200 80150 77100 74
80 7250 6830 6320 5910 53
5 463 402 35
Probable Rainfall(mm)
Return Period(years)
(3) Hydrograph Analysis
1) Unit hydrograph
Since no flood hydrographs are available for the present flood analysis, the unit hydrograph is developed by means of the SCS (Soil Conservation Service) synthetic hydrograph method. The SCS method was developed by analyzing a large number of basins with varying geographic locations. Unit hydrographs were evaluated for a large number of actual watersheds and then made dimensionless by dividing all discharge ordinates by the peak discharge and the time ordinates by the time to peak. An average of these dimensionless unit hydrographs was computed.
a) SCS Unit Hydrograph
The SCS unit hydrograph is derived from the flood concentration time and unit basin rainfall. The unit hydrograph is constructed for a unit rainfall of 1 mm.
The peak discharge of the unit hydrograph is calculated as follows.
pp tAQq /208.0=
where, pq : Peak discharge (m3/sec)
A : Basin area (km2) Q : Total volume of the unit hydrograph (=1mm) pt : Time to peak (hours)
SCS has determined that the time to peak ( pt ) and rainfall duration ( D ) are related to time
of concentration ( ct ) as follows.
3/2 cp tt ×=
ctD 133.0=
Final Report (Supporting_PreF/S) Part 15 Hydrological Analysis for Simanggo-2 HEPP
JICA Project for the Master Plan Study of 15-25 August, 2011 Hydropower Development in Indonesia
b) Flood Concentration Time
The flood concentration time is defined as the time of travel from the most remote point in the catchment to the forecast point. The flood concentration time can be estimated by the formula of Kirpich as follows.
385.077.097.3 −××= SLtc
where, ct : Flood concentration time (min)
L : Maximum length of travel of water (km) S : Average slope (=H/L, where H is the difference in elevation between the remotest point in the basin and the outlet)
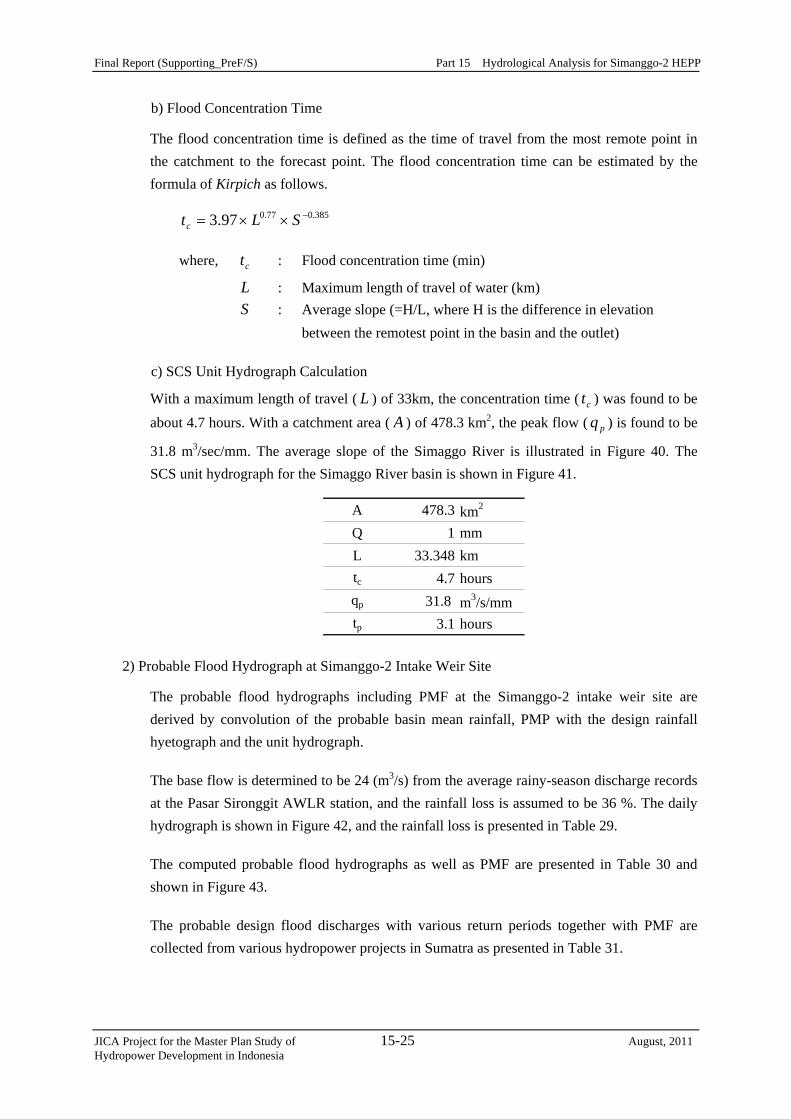
c) SCS Unit Hydrograph Calculation
With a maximum length of travel ( L ) of 33km, the concentration time ( ct ) was found to be about 4.7 hours. With a catchment area ( A ) of 478.3 km2, the peak flow ( pq ) is found to be
31.8 m3/sec/mm. The average slope of the Simaggo River is illustrated in Figure 40. The SCS unit hydrograph for the Simaggo River basin is shown in Figure 41.
A 478.3 km2
Q 1 mmL 33.348 kmtc 4.7 hoursqp 31.8 m3/s/mmtp 3.1 hours
2) Probable Flood Hydrograph at Simanggo-2 Intake Weir Site
The probable flood hydrographs including PMF at the Simanggo-2 intake weir site are derived by convolution of the probable basin mean rainfall, PMP with the design rainfall hyetograph and the unit hydrograph.
The base flow is determined to be 24 (m3/s) from the average rainy-season discharge records at the Pasar Sironggit AWLR station, and the rainfall loss is assumed to be 36 %. The daily hydrograph is shown in Figure 42, and the rainfall loss is presented in Table 29.
The computed probable flood hydrographs as well as PMF are presented in Table 30 and shown in Figure 43.
The probable design flood discharges with various return periods together with PMF are collected from various hydropower projects in Sumatra as presented in Table 31.
Final Report (Supporting_PreF/S) Part 15 Hydrological Analysis for Simanggo-2 HEPP
JICA Project for the Master Plan Study of 15-26 August, 2011 Hydropower Development in Indonesia
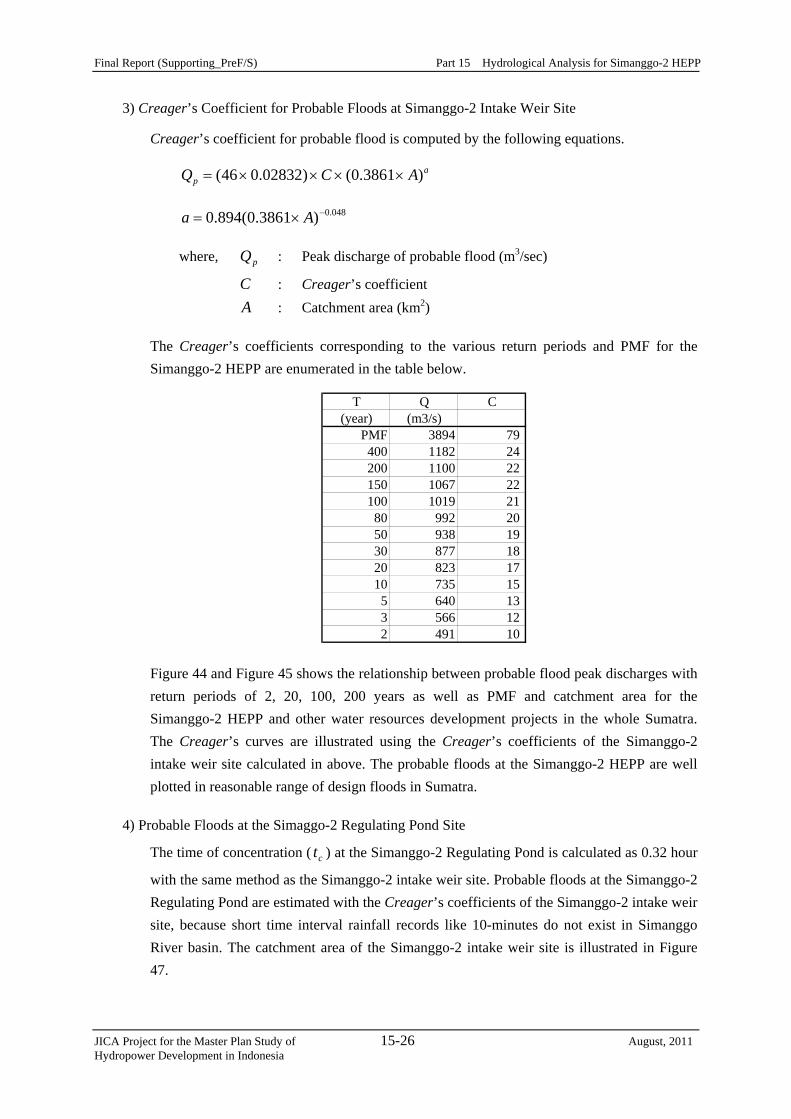
3) Creager’s Coefficient for Probable Floods at Simanggo-2 Intake Weir Site
Creager’s coefficient for probable flood is computed by the following equations.
ap ACQ )3861.0()02832.046( ××××=
048.0)3861.0(894.0 −×= Aa
where, pQ : Peak discharge of probable flood (m3/sec)
C : Creager’s coefficient A : Catchment area (km2)
The Creager’s coefficients corresponding to the various return periods and PMF for the Simanggo-2 HEPP are enumerated in the table below.
T Q C(year) (m3/s)
PMF 3894 79400 1182 24200 1100 22150 1067 22100 1019 21
80 992 2050 938 1930 877 1820 823 1710 735 15
5 640 133 566 122 491 10
Figure 44 and Figure 45 shows the relationship between probable flood peak discharges with return periods of 2, 20, 100, 200 years as well as PMF and catchment area for the Simanggo-2 HEPP and other water resources development projects in the whole Sumatra. The Creager’s curves are illustrated using the Creager’s coefficients of the Simanggo-2 intake weir site calculated in above. The probable floods at the Simanggo-2 HEPP are well plotted in reasonable range of design floods in Sumatra.
4) Probable Floods at the Simaggo-2 Regulating Pond Site
The time of concentration ( ct ) at the Simanggo-2 Regulating Pond is calculated as 0.32 hour
with the same method as the Simanggo-2 intake weir site. Probable floods at the Simanggo-2 Regulating Pond are estimated with the Creager’s coefficients of the Simanggo-2 intake weir site, because short time interval rainfall records like 10-minutes do not exist in Simanggo River basin. The catchment area of the Simanggo-2 intake weir site is illustrated in Figure 47.

Final Report (Supporting_PreF/S) Part 15 Hydrological Analysis for Simanggo-2 HEPP
JICA Project for the Master Plan Study of 15-27 August, 2011 Hydropower Development in Indonesia
A 3 km2
L 2 kmtc 0.32 hours
The results of flood analysis are estimated as follows.
PondT Q C Q
(year) (m3/s) (m3/s)PMF 3894 79 117.4400 1182 24 35.7200 1100 22 33.2150 1067 22 32.2100 1019 21 30.7
80 992 20 29.950 938 19 28.330 877 18 26.520 823 17 24.810 735 15 22.2
5 640 13 19.33 566 12 17.12 491 10 14.8
Intake
5) Probable Floods at the Simanggo-2 Power House Site
The Rambe River and the Simanggo River join together at the upstream of the Simanggo-2 Power House site. At the power house site, probable floods seem to be controlled by floods from the Simanggo River, because the catchment area of the Rambe River basin is smaller than the Simanggo River basin. So, Probable floods at the Simanggo-2 power house site are estimated with the Creager’s coefficients of the Simanggo-2 intake weir site as same as the regulating pond. The catchment area of the power house site is 936.1km2, illustrated in Figure 48.
The results of flood analysis are estimated as follows.
PondT Q C Q
(year) (m3/s) (m3/s)PMF 3894 79 5456.0400 1182 24 1656.1200 1100 22 1541.2150 1067 22 1495.0100 1019 21 1427.8
80 992 20 1389.950 938 19 1314.330 877 18 1228.820 823 17 1153.110 735 15 1029.8
5 640 13 896.73 566 12 793.02 491 10 688.0
Intake
Final Report (Supporting_PreF/S) Part 15 Hydrological Analysis for Simanggo-2 HEPP
JICA Project for the Master Plan Study of 15-28 August, 2011 Hydropower Development in Indonesia
(4) Water Level Observation and Discharge Measurement
As mentioned in the chapter of lowflow analysis, the field investigation of 3 month water level observation and 30 times discharge measurement was carried out from 2010 September 28th to 2010 December 31st by the sub-contractor.
Consequently, the maximum water level is 3.35m and the maximum runoff is 463.87 m3/s calculated with H-Q rating curve in extrapolation. The Equation of H-Q rating curve is given below.
2)29.0(01.35 +×= HQ
where, Q : Runoff (m3/sec)
H : Water level (m)
Runoff at the Simanggo-2 intake weir site is estimated using the following equation.
)/( WDWD AAQQ ×=
where, DQ : Runoff at Simanggo-2 intake weir site (m3/sec) WQ : Runoff at the water level gauge (m3/sec) DA : Catchment area at Simanggo-2 intake weir site (=478.3km2) WA : Catchment area at water level gauge (=290.6km2)
The estimated maximum runoff at the Simanggo-2 intake weir site is 763.49m3/s.
(5) PLTM Palilitan
There is an existing intake weir of PLTM Palilitan at upstream of Simanggo-2 intake weir site. In the project report of PLTM Palilitan, the 2-year flood is estimated to be 73.571 m3/s, and the 100-year flood to be 288.379 m3/s with flood analysis using annual maximum daily rainfall from 1963 to 1975. Flood at the Simanggo-2 intake weir site can be estimated with the following equation.
)/( WDWD AAQQ ×=
where, DQ : Runoff at Simanggo-2 intake weir site (m3/sec) WQ : Runoff at PLTM Palilitan intake weir site (m3/sec) DA : Catchment area at Simanggo-2 intake weir site (=478.3km2) WA : Catchment area at PLTM Palilitan intake weir site (=436km2)
Consequently, the 2-year flood at the Simanggo-2 intake weir site is estimated to be 80.71 m3/s, and the 100-year flood to be 316.36 m3/s. The catchment area of PLTM Palilitan is measured in HPPS2 as Simanggo-1 HEPP.
Final Report (Supporting_PreF/S) Part 15 Hydrological Analysis for Simanggo-2 HEPP
JICA Project for the Master Plan Study of 15-29 August, 2011 Hydropower Development in Indonesia
15.1.6 SEDIMENT ANALYSIS
(1) General
Sedimentation analysis is preliminarily carried out to estimate the denudation rate in the Simaggo River basin. The sedimentation load is herein predicted based on the estimated runoff and the sediment discharge rating curve at the intake weir site. The rating curve is established based on the in-situ sampling records obtained through the field investigation conducted in the course of the study.
The sediment transport in the Simaggo River is judged to be higher than other rivers in the Sumatra. The denudation rate showing the expected average annual erosion rate in a river basin is generally influenced by the topography (soil condition, river gradient), deforestation of the land in the basin, rainfall intensity, etc.
In addition, the design denudation rates adopted in other water resources or hydropower development projects in Sumatra are collected for comparison purposes.
(2) Suspended Load Sampling
A total of thirty (30) suspended load samplings were carried out at the intake weir site where discharge measurements were taken. The samples were taken to a laboratory for further analysis. The sieve analysis results of samples are shown in Figure 49.
(3) Suspended Load Rating Curve
The laboratory analysis results of the samples show the total suspended sediment concentration which is the combination of both dissolved and undissolved sediment. The total suspended load is found from the following formula.
WS QCQ ××= 0864.0
where, SQ : Suspended load (ton/day)
C : Total suspended sediment concentration (mg/L) WQ : Flow discharge (m3/s)
The suspended load calculations using the above formula are presented in Table 32. Several results are considered unreliable because they show very low concentration or very high concentration. Therefore these unreliable results will not be used in the determination of the suspended load rating curve. The values of Qs are plotted against their respective Qw values to determine the suspended load rating curve. On the basis of the estimated sediment discharge at the intake weir site, the suspended load rating curve is established as shown in Figure 50. The rating curve equation is given below.
7812.14615.5 WS QQ ×=
Final Report (Supporting_PreF/S) Part 15 Hydrological Analysis for Simanggo-2 HEPP
JICA Project for the Master Plan Study of 15-30 August, 2011 Hydropower Development in Indonesia
If the flow discharge Qw is known, the suspended load sediment Qs can be estimated.
(4) Total Sediment Load
The annual suspended load sediment yield is simulated by applying the above rating curve to the simulated daily runoff at the intake weir site. The catchment area of the Simaggo-2 intake weir site is 478.3km2.
Substituting runoff data, the average annual suspended load sediment at the intake weir site is estimated at 662,847 ton.
The density of sediment in appearance can be calculated by the following equation.
γγ ×−=′ )1( V
where, γ ′ : Density of sediment (ton/m3)
V : Void ratio of sediment γ : Unit weight of sediment (=2.65ton/m3)
Assuming a void ratio of 60 % in sedimentation, the density of sediment is found to be 1.06 ton/m3. Hence, the annual suspended load sediment is estimated at 625,327 m3.
The sediment load transport into an intake weir generally consists of suspended load and bed load. It is generally accepted that it might be difficult to accurately measure the bed load in a natural river. Usually, the rate of bed load transport is empirically estimated at 10 to 30 % of the total suspended load. The rate of bed load transport is estimated as 10% of the total suspended load, because 10% is usually applied in Indonesia.
Consequently, the mean annual sediment inflow volume into the Simaggo-2 intake weir is estimated to be 687,860 m3 which is equivalent to a denudation rate of 1.44 mm per year.
For comparison purpose, design denudation rates of various schemes around the project site are presented in the following table.
Final Report (Supporting_PreF/S) Part 15 Hydrological Analysis for Simanggo-2 HEPP
JICA Project for the Master Plan Study of 15-31 August, 2011 Hydropower Development in Indonesia
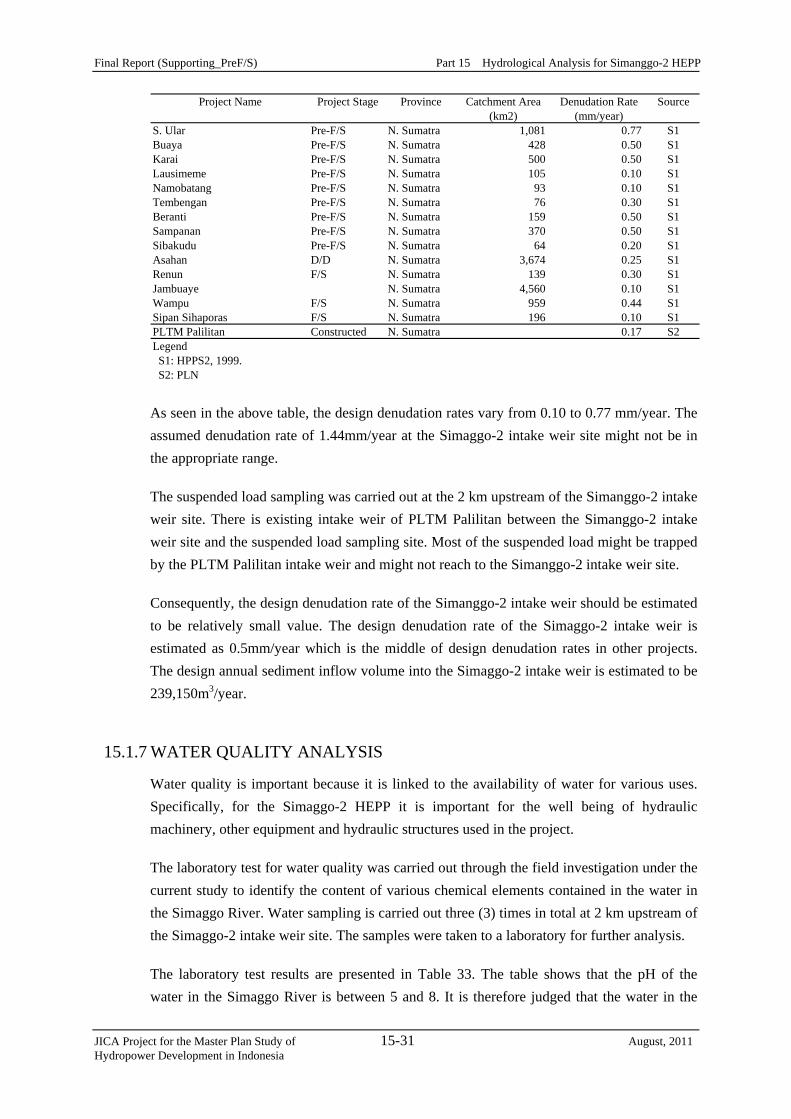
Project Name Project Stage Province Catchment Area Denudation Rate Source(km2) (mm/year)
S. Ular Pre-F/S N. Sumatra 1,081 0.77 S1Buaya Pre-F/S N. Sumatra 428 0.50 S1Karai Pre-F/S N. Sumatra 500 0.50 S1Lausimeme Pre-F/S N. Sumatra 105 0.10 S1Namobatang Pre-F/S N. Sumatra 93 0.10 S1Tembengan Pre-F/S N. Sumatra 76 0.30 S1Beranti Pre-F/S N. Sumatra 159 0.50 S1Sampanan Pre-F/S N. Sumatra 370 0.50 S1Sibakudu Pre-F/S N. Sumatra 64 0.20 S1Asahan D/D N. Sumatra 3,674 0.25 S1Renun F/S N. Sumatra 139 0.30 S1Jambuaye N. Sumatra 4,560 0.10 S1Wampu F/S N. Sumatra 959 0.44 S1Sipan Sihaporas F/S N. Sumatra 196 0.10 S1PLTM Palilitan Constructed N. Sumatra 0.17 S2Legend S1: HPPS2, 1999. S2: PLN
As seen in the above table, the design denudation rates vary from 0.10 to 0.77 mm/year. The assumed denudation rate of 1.44mm/year at the Simaggo-2 intake weir site might not be in the appropriate range.
The suspended load sampling was carried out at the 2 km upstream of the Simanggo-2 intake weir site. There is existing intake weir of PLTM Palilitan between the Simanggo-2 intake weir site and the suspended load sampling site. Most of the suspended load might be trapped by the PLTM Palilitan intake weir and might not reach to the Simanggo-2 intake weir site.
Consequently, the design denudation rate of the Simanggo-2 intake weir should be estimated to be relatively small value. The design denudation rate of the Simaggo-2 intake weir is estimated as 0.5mm/year which is the middle of design denudation rates in other projects. The design annual sediment inflow volume into the Simaggo-2 intake weir is estimated to be 239,150m3/year.
15.1.7 WATER QUALITY ANALYSIS
Water quality is important because it is linked to the availability of water for various uses. Specifically, for the Simaggo-2 HEPP it is important for the well being of hydraulic machinery, other equipment and hydraulic structures used in the project.
The laboratory test for water quality was carried out through the field investigation under the current study to identify the content of various chemical elements contained in the water in the Simaggo River. Water sampling is carried out three (3) times in total at 2 km upstream of the Simaggo-2 intake weir site. The samples were taken to a laboratory for further analysis.
The laboratory test results are presented in Table 33. The table shows that the pH of the water in the Simaggo River is between 5 and 8. It is therefore judged that the water in the

Final Report (Supporting_PreF/S) Part 15 Hydrological Analysis for Simanggo-2 HEPP
JICA Project for the Master Plan Study of 15-32 August, 2011 Hydropower Development in Indonesia
Simaggo River will have no adverse effect on turbine and metal for hydropower use, because adverse effect is expected to occur under the pH value smaller than 4.5.
Final Report (Supporting_PreF/S) Part 15 Hydrological Analysis for Simanggo-2 HEPP
JICA Project for the Master Plan Study of T-1 August, 2011 Hydropower Development in Indonesia
Table 1 Monthly Mean Air Temperature
Station Name: Sibolga Unit: ℃
Year Jan Feb Mar Apr May Jun Jul Aug Sep Oct Nov Dec Average1984 25.0 26.2 26.0 26.6 25.0 25.1 25.1 24.3 25.3 25.5 25.41985 25.9 23.8 25.8 25.2 26.4 24.9 25.8 24.3 25.8 24.6 25.8 25.31986 25.5 23.5 25.3 25.4 26.5 25.4 25.3 25.7 24.5 25.6 24.6 25.8 25.31987 25.6 23.6 26.6 25.4 28.5 26.0 25.9 26.0 24.9 25.9 25.0 26.1 25.81988 26.0 24.8 26.2 25.0 26.7 31.8 26.1 25.7 24.4 25.3 24.4 25.9 26.01989 25.8 23.1 25.7 25.0 26.2 24.7 25.0 25.6 24.5 25.5 24.5 25.8 25.11990 25.8 24.0 26.3 25.5 26.7 25.5 25.6 25.7 24.8 25.6 25.1 25.8 25.51991 26.1 23.6 26.6 25.4 26.6 25.7 26.0 25.8 25.0 24.1 25.4 25.51992 26.4 24.6 26.7 25.8 26.6 25.5 25.9 25.6 25.91993 25.6 25.6 24.8 25.7 25.41994 -1995 -1996 25.6 24.6 26.6 27.0 25.7 26.0 25.3 25.81997 -1998 -1999 25.8 23.6 26.1 25.3 25.6 25.6 24.9 25.6 24.8 25.6 25.32000 25.7 26.2 26.8 25.2 25.8 25.6 24.8 25.8 25.1 26.2 25.72001 -2002 26.8 25.6 26.2Min 25.0 23.1 25.3 25.0 26.1 24.7 25.0 25.1 24.3 25.3 24.1 25.4Max 26.4 24.8 26.7 26.2 28.5 31.8 26.1 26.0 25.0 25.9 25.1 26.2Ave 25.8 23.9 26.2 25.5 26.7 25.8 25.7 25.7 24.7 25.6 24.7 25.8 25.5
Source: (1984-2002) BMKG

Final Report (Supporting_PreF/S) Part 15 Hydrological Analysis for Simanggo-2 HEPP
JICA Project for the Master Plan Study of T-2 August, 2011 Hydropower Development in Indonesia
Table 2 Monthly Mean Relative Humidity
Station Name: Sibolga Unit: %
Year Jan Feb Mar Apr May Jun Jul Aug Sep Oct Nov Dec Average1984 85.6 79.8 86.9 82.8 81.5 85.1 85.4 82.0 86.4 83.91985 81.7 73.7 85.7 82.2 85.0 76.7 92.3 82.6 83.6 84.8 87.3 83.21986 87.1 73.2 88.0 85.3 85.2 79.1 85.3 83.3 82.0 84.3 82.5 87.0 83.51987 87.4 77.8 85.8 85.3 86.9 80.3 84.3 85.5 84.8 88.7 84.5 88.9 85.01988 89.9 81.0 89.9 83.9 83.1 80.1 81.0 86.2 85.1 87.1 86.0 83.0 84.71989 84.8 76.0 84.3 82.8 84.0 78.9 84.4 85.4 83.6 85.7 85.3 85.6 83.41990 83.6 74.8 85.7 83.6 83.6 80.4 85.4 81.2 82.8 88.2 83.9 86.5 83.31991 85.3 75.6 85.5 83.7 87.0 81.5 84.4 84.6 82.8 88.0 97.6 85.11992 78.4 75.5 83.2 80.9 84.8 80.2 82.4 84.4 81.21993 79.7 85.6 81.1 96.7 85.81994 -1995 -1996 81.0 74.4 82.2 80.4 79.7 80.9 84.7 80.51997 -1998 -1999 84.5 74.5 83.2 79.0 83.9 84.1 81.0 85.2 82.8 83.9 82.22000 83.0 79.1 81.1 79.1 80.4 83.2 82.8 83.8 83.4 84.2 82.02001 -2002 83.0 79.3 81.1Min 78.4 73.2 82.2 79.1 80.4 76.7 80.4 81.2 81.0 83.6 82.5 83.0Max 89.9 81.0 89.9 85.3 87.0 81.5 85.6 92.3 85.1 88.7 88.0 97.6Ave 84.4 76.0 85.7 83.0 83.8 79.7 83.6 85.0 82.8 85.8 84.6 88.1 83.5
Source: (1984-2002) BMKG
Final Report (Supporting_PreF/S) Part 15 Hydrological Analysis for Simanggo-2 HEPP
JICA Project for the Master Plan Study of T-3 August, 2011 Hydropower Development in Indonesia
Table 3 Monthly Mean Sunshine Duration
Station Name: Sibolga Unit: %
Year Jan Feb Mar Apr May Jun Jul Aug Sep Oct Nov Dec Average1984 60.6 52.8 52.9 57.2 67.5 53.9 57.5 51.7 46.4 28.7 52.91985 48.6 54.1 57.4 66.4 57.9 67.6 61.8 48.6 55.1 49.6 56.3 56.71986 64.7 72.0 52.1 51.5 64.3 66.1 63.6 52.8 50.3 46.8 59.3 66.9 59.21987 48.8 71.9 68.4 57.4 64.9 69.2 61.2 46.1 40.6 50.8 45.1 56.1 56.71988 58.3 67.9 54.7 56.4 60.1 71.2 66.2 53.1 33.8 46.5 31.6 62.1 55.21989 62.0 61.3 64.7 52.5 68.4 71.5 60.7 48.6 48.3 51.0 53.2 65.7 59.01990 59.7 69.1 58.2 72.6 56.5 59.5 67.9 45.6 50.3 48.8 62.9 59.21991 68.8 59.5 61.9 61.9 51.0 69.7 65.3 47.9 49.6 33.7 29.6 54.41992 82.9 56.2 60.2 63.2 63.8 53.8 62.9 43.0 60.81993 57.1 47.9 48.5 37.2 47.71994 -1995 -1996 63.1 7.5 64.6 48.7 54.0 29.7 44.61997 -1998 -1999 17.9 62.2 54.6 53.9 49.1 50.1 54.5 44.3 53.5 52.1 49.22000 55.9 55.92001 -2002 59.8 56.9 58.4Min 17.9 52.8 7.5 51.5 51.0 48.7 47.9 43.0 33.8 28.7 31.6 29.6Max 82.9 72.0 69.1 66.4 72.6 71.5 66.2 67.9 54.5 55.1 59.3 66.9Ave 56.9 61.9 54.9 58.3 62.4 61.2 58.9 52.3 46.6 44.8 46.9 54.3 55.0
Source: (1984-2002) BMKG

Final Report (Supporting_PreF/S) Part 15 Hydrological Analysis for Simanggo-2 HEPP
JICA Project for the Master Plan Study of T-4 August, 2011 Hydropower Development in Indonesia
Table 4 Monthly Mean Wind Velocity
Station Name: Sibolga Unit: m/sec
Year Jan Feb Mar Apr May Jun Jul Aug Sep Oct Nov Dec Average1984 5.8 5.6 5.6 6.0 5.4 5.6 5.5 5.7 5.8 6.7 5.6 5.81985 6.1 5.8 5.8 5.9 5.7 6.6 6.2 6.3 6.1 5.6 5.8 6.01986 5.9 6.1 6.1 6.0 5.9 6.0 6.4 6.5 5.9 5.8 5.8 6.0 6.01987 5.5 5.7 5.4 5.7 5.5 5.8 5.9 5.8 5.7 6.1 6.2 5.8 5.81988 6.0 6.3 6.2 6.0 5.7 5.7 5.5 5.8 6.0 6.1 7.0 5.8 6.01989 5.6 7.0 6.3 5.7 5.7 6.1 6.0 6.1 6.4 6.4 6.2 6.5 6.21990 6.6 7.3 6.8 6.1 6.1 6.6 6.2 6.5 6.2 6.6 6.3 5.9 6.41991 6.3 6.3 6.3 6.0 8.8 6.1 6.3 6.7 6.4 6.4 6.0 6.51992 6.6 6.1 6.0 6.3 6.3 6.4 6.2 6.9 6.41993 7.1 6.7 6.6 6.81994 -1995 -1996 5.9 6.9 11.0 6.5 6.3 7.2 7.31997 -1998 -1999 0.5 0.6 0.8 1.0 1.0 0.8 0.7 1.0 0.9 0.8 0.82000 1.1 1.0 0.9 1.3 1.3 1.0 1.1 1.7 1.1 1.0 1.12001 -2002 1.0 1.0 1.0Min 0.5 0.6 5.4 1.0 0.8 1.0 1.0 0.8 0.7 1.0 0.9 0.8Max 6.6 7.3 11.0 6.3 8.8 6.6 7.1 6.9 6.7 7.2 7.0 6.6Ave 5.2 5.8 6.5 5.5 4.8 5.0 5.3 5.3 5.2 5.4 5.1 5.1 5.3
Source: (1984-2002) BMKG
Final Report (Supporting_PreF/S) Part 15 Hydrological Analysis for Simanggo-2 HEPP
JICA Project for the Master Plan Study of T-5 August, 2011 Hydropower Development in Indonesia
Table 5 Monthly Mean Pan Evaporation
Station : Parapat Unit: mm/day
Year Jan Feb Mar Apr May Jun Jul Aug Sep Oct Nov Dec Average1997 3.1 5.7 4.4 5.1 4.7 4.8 4.8 4.0 4.6 4.2 2.7 3.0 4.31998 3.5 3.8 3.7 3.8 4.4 4.3 4.5 4.3 4.5 4.3 4.0 3.5 4.11999 3.7 4.4 3.4 4.8 4.0 3.8 4.1 4.5 4.4 3.3 3.3 3.1 3.92000 3.9 3.8 4.5 3.6 4.2 4.0 4.9 4.0 2.9 4.1 3.5 3.8 3.92001 3.8 3.8 4.3 3.4 4.2 3.6 4.0 4.6 3.2 3.9 3.7 3.4 3.82002 2.3 3.5 4.0 3.4 3.9 4.0 4.9 4.0 3.4 3.4 3.2 3.2 3.62003 3.8 2.9 4.0 3.1 5.0 3.6 3.8 4.0 4.6 4.2 2.7 3.1 3.72004 3.4 3.3 2.7 3.2 4.4 4.7 3.8 4.9 4.6 3.8 3.8 3.4 3.82005 5.1 4.4 4.7 4.2 4.0 4.9 4.1 4.5 4.4 3.3 3.3 3.1 4.22006 3.5 4.1 4.1 4.2 4.2 4.2 4.3 5.6 3.3 - - - 4.2Min 2.3 2.9 2.7 3.1 3.9 3.6 3.8 4.0 2.9 3.3 2.7 3.0Max 5.1 5.7 4.7 5.1 5.0 4.9 4.9 5.6 4.6 4.3 4.0 3.8Ave 3.6 4.0 4.0 3.9 4.3 4.2 4.3 4.4 4.0 3.8 3.4 3.3 3.9
Source: Asahan 3 HEPP Construction Report, 2007
Station : Gabe Hutaraja Unit: mm/dayYear Jan Feb Mar Apr May Jun Jul Aug Sep Oct Nov Dec Average1996 2.5 1.7 2.3 1.6 2.4 2.1 2.3 2.0 1.9 1.4 2.0 1.5 2.01997 2.3 2.0 2.2 2.0 2.3 1.9 1.8 2.1 1.5 1.2 1.7 17.0 3.21998 2.1 - 1.9 2.3 2.7 2.3 2.9 1.2 - - - - 2.21999 - - 0.8 2.3 1.8 1.9 1.6 1.7 1.6 1.3 1.3 1.8 1.62000 2.3 1.9 2.3 1.8 2.8 2.6 2.5 2.4 2.7 - - - 2.42001 1.9 1.6 2.4 1.2 2.5 1.7 2.5 2.1 1.4 1.6 1.3 - 1.82002 1.9 2.0 2.2 1.8 2.0 - - - - - - - 2.02003 1.6 1.4 2.0 1.5 2.5 1.9 1.8 1.7 1.8 1.3 1.3 1.7 1.72004 1.6 1.5 1.8 1.6 2.8 3.0 2.0 2.7 1.5 1.6 1.5 1.4 1.92005 - - - - - - - - - - - - -Min 1.6 1.4 0.8 1.2 1.8 1.7 1.6 1.2 1.4 1.2 1.3 1.4Max 2.5 2.0 2.4 2.3 2.8 3.0 2.9 2.7 2.7 1.6 2.0 17.0Ave 2.0 1.7 2.0 1.8 2.4 2.2 2.2 2.0 1.8 1.4 1.5 4.7 2.1
Source: Asahan 3 HEPP Construction Report, 2007
Final Report (Supporting_PreF/S) Part 15 Hydrological Analysis for Simanggo-2 HEPP
JICA Project for the Master Plan Study of T-6 August, 2011 Hydropower Development in Indonesia
Table 6 Monthly Rainfall Records (1/12)
Station Name: Segala(Sigala-gala)Station ID: 78 Unit: mm
Year Jan Feb Mar Apr May Jun Jul Aug Sep Oct Nov Dec Annual1969 - - - 375 487 157 - 402 252 648 - 359 -1970 275 278 319 381 193 226 256 210 391 629 505 238 3,9011971 232 184 343 - 174 - 0 - 391 422 218 374 -1972 109 238 299 - - 183 304 - 687 - - - -1973 - - - - - - - - - - - - -1974 - - - - - - - - - - - - -1975 - - - - - - - - - - - - -1976 - - - - - - - - - - - - -1977 - - - - - - - - - - - - -1978 237 327 - - - - - - - - - - -1979 - - - - - - - - - - - - -1980 - - - - - - - - - - - - -1981 - - - - - - - - - - - - -1982 - - - - - - - - - - - - -1983 - - - - - - - - - - - - -1984 - - - - - - - - - - - - -1985 - - - - - - - - - - - - -1986 - - - - - - - - - - - - -1987 - - - - - - - - - - - - -1988 - - - - - - - - - - - - -1989 - - - - - - - - - - - - -1990 - - - - - - - - - - - - -1991 - - - - - - - - - - - - -1992 - - - - - - - - - - - - -1993 - - - - - - - - - - - - -1994 - - - - - - - - - - - - -1995 - - - - - - - - - - - - -1996 - - - - - - - - - - - - -1997 - - - - - - - - - - - - -1998 - - - - - - - - - - - - -1999 - - - - - - - - - - - - -2000 - - - - - - - - - - - - -2001 - - - - - - - - - - - - -2002 - - - - - - - - - - - - -2003 - - - - - - - - - - - - -2004 - - - - - - - - - - - - -2005 - - - - - - - - - - - - -2006 - - - - - - - - - - - - -2007 - - - - - - - - - - - - -2008 - - - - - - - - - - - - -Min 109 184 299 375 174 157 0 210 252 422 218 238Max 275 327 343 381 487 226 304 402 687 648 505 374Ave 213 257 320 378 285 189 187 306 430 566 362 324 3,816
Source: BMKG
Final Report (Supporting_PreF/S) Part 15 Hydrological Analysis for Simanggo-2 HEPP
JICA Project for the Master Plan Study of T-7 August, 2011 Hydropower Development in Indonesia
Table 7 Monthly Rainfall Records (2/12)
Station Name: TarutungStation ID: 84 Unit: mm
Year Jan Feb Mar Apr May Jun Jul Aug Sep Oct Nov Dec Annual1969 - - - - - - - - - - - - -1970 - - - - - - - - - - - - -1971 - - - - - - - - - - - - -1972 - - - - - - - - - - - - -1973 - - - - - - - - - - - - -1974 - - - - - - - - - - - - -1975 - - - - - - - - - - - - -1976 - - - - - - - - - - - - -1977 95 81 73 62 128 118 44 70 200 152 131 208 1,3621978 154 322 - 319 188 79 88 45 31 274 328 224 -1979 319 233 114 - - 104 119 72 257 246 375 226 -1980 274 163 196 - 175 - 55 110 129 125 222 191 -1981 62 272 99 295 212 40 40 - - - - - -1982 - - - - - - - - - - - - -1983 - 46 - 195 - 48 60 62 110 - - - -1984 277 227 - 207 115 - 116 - 190 173 582 251 -1985 260 214 346 171 148 - - - - 107 - - -1986 - - - 304 - - - 36 - 169 185 68 -1987 65 284 193 - 45 49 73 93 - 202 85 156 -1988 - 420 - - 392 3 160 - - - - - -1989 - - - - - 38 - 78 - - - - -1990 - - 254 - - - - - - - - - -1991 - - - - - 112 - 24 - - - - -1992 - 69 191 - - - - - - - 239 - -1993 193 287 - - - - - - - - - - -1994 166 - - - - - - - - - - 162 -1995 - - - - - - - 183 - - - - -1996 - - - - - 70 - - - - - 175 -1997 - - - - - - - - - - - - -1998 - - 126 65 142 45 90 237 144 - 149 234 -1999 - 192 107 271 - - - - - - - - -2000 - 57 - - - - - - - - 275 - -2001 - - - - - - - - - - - - -2002 - - - - - - - - - - - - -2003 - - - - - - - - - - - - -2004 - - - - - - - - - - - - -2005 - - - - - - - - - - - - -2006 - - - - - - - - - - - - -2007 - - - - - - - - - - - - -2008 - - - - - - - - - - - - -Min 62 46 73 62 45 3 40 24 31 107 85 68Max 319 420 346 319 392 118 160 237 257 274 582 251Ave 187 205 170 210 172 64 85 92 152 181 257 190 1,962
Source: BMKG
Final Report (Supporting_PreF/S) Part 15 Hydrological Analysis for Simanggo-2 HEPP
JICA Project for the Master Plan Study of T-8 August, 2011 Hydropower Development in Indonesia
Table 8 Monthly Rainfall Records (3/12)
Station Name: Hutaraya(Gabe Hutaraja)Station ID: 84C Unit: mm
Year Jan Feb Mar Apr May Jun Jul Aug Sep Oct Nov Dec Annual1969 245 143 326 329 323 42 - - - - - - -1970 129 140 294 174 - 50 156 124 230 178 - - -1971 396 193 249 213 52 52 18 221 322 104 223 244 2,2871972 44 154 161 447 194 84 25 138 259 260 261 - -1973 108 106 251 315 144 73 119 118 144 168 130 232 1,9081974 108 153 201 200 - 107 - 7 - - 162 - -1975 105 162 145 244 56 49 151 40 146 64 190 237 1,5891976 - - - - - - - - - - - - -1977 277 139 115 229 109 245 118 93 128 230 365 292 2,3401978 105 341 276 340 177 82 46 - 148 332 223 279 -1979 127 129 133 250 42 143 112 63 235 200 310 226 1,9701980 177 164 351 186 102 118 96 129 95 183 310 180 2,0911981 132 271 126 - 433 25 - - - - - - -1982 - - - - - - - - - - - - -1983 - - - - - - - - - - - - -1984 - - - - - - - - - - - - -1985 - - - - - - - - - - - - -1986 - - - - - - - - - - - - -1987 - - - - - - - - - - - - -1988 - - - - - - - - - - - - -1989 - - - - - 50 - - - 176 - - -1990 - - - - - - - - - - - - -1991 - - 119 323 283 62 60 56 100 131 562 348 -1992 84 177 131 266 - 34 159 107 195 - - 226 -1993 131 207 162 168 208 - 269 154 160 355 514 308 -1994 297 - - - - - - - - - - - -1995 181 - - - - - 146 209 - 234 272 - -1996 - - 238 229 120 - 155 153 63 240 135 - -1997 82 178 - 151 - 121 - - 85 198 128 130 -1998 163 - 163 - 167 106 120 306 148 - - - -1999 188 120 260 - - - - - - - - - -2000 - - - - - - - - - - - - -2001 - - - - - - - - - - - - -2002 - - - - - - - - - - - - -2003 - - - - - - - - - - - - -2004 - - - - - - - - - - - - -2005 - - - - - - - - - - - - -2006 - - - - - - - - - - - - -2007 - - - - - - - - - - - - -2008 - - - - - - - - - - - - -Min 44 106 115 151 42 25 18 7 63 64 128 130Max 396 341 351 447 433 245 269 306 322 355 562 348Ave 162 174 206 254 172 85 117 128 164 204 270 246 2,180
Source: BMKG
Final Report (Supporting_PreF/S) Part 15 Hydrological Analysis for Simanggo-2 HEPP
JICA Project for the Master Plan Study of T-9 August, 2011 Hydropower Development in Indonesia
Table 9 Monthly Rainfall Records (4/12)
Station Name: Barus(Baros)Station ID: 85 Unit: mm
Year Jan Feb Mar Apr May Jun Jul Aug Sep Oct Nov Dec Annual1969 - - - - - - - - - - - - -1970 - - - - - - - - - - - - -1971 - - - - - - - - - - - - -1972 - - - - - - - - - - - - -1973 - - - - - - - - - - - - -1974 - - - - - - - - - - - - -1975 - - - - - - - - - - - - -1976 - - - - - - - - - - - - -1977 497 416 378 236 73 344 258 - - 383 403 273 -1978 449 201 - 207 382 120 202 75 306 228 238 452 -1979 4 126 237 152 53 67 - 221 535 212 532 166 -1980 500 275 155 - 260 408 198 72 169 500 536 428 -1981 18 451 181 529 - - - - - - - - -1982 - - - - - - - - - - - - -1983 - - - - - - - - 178 390 148 204 -1984 357 303 451 476 129 - 156 190 339 292 239 196 -1985 56 210 254 - 335 - - - - 49 - - -1986 - - - - 360 - - 118 - - 183 - -1987 91 112 - 367 288 184 155 137 300 373 186 454 -1988 - - - - - - - - - 263 - - -1989 - - - - - 156 - - - 187 - - -1990 - - 156 131 - - - - - - - - -1991 - - 182 219 139 95 89 - - - - - -1992 - - 189 - - - - - - - - 128 -1993 407 264 482 - 447 191 - - - - - - -1994 308 - - - - - - - - - - - -1995 271 223 646 469 438 151 - - - - - - -1996 - - - 382 - - 140 549 210 - 403 - -1997 - 170 125 314 - 176 222 - 812 655 493 - -1998 418 - - 294 - - 245 727 776 498 316 903 -1999 - - - - - - - - - - - - -2000 - 140 - - - - - - - - - - -2001 - - - - - - - - - - - - -2002 - - - - - - - - - - - - -2003 - - - - - - - - - - - - -2004 - - - - - - - - - - - - -2005 - - - - - - - - - - - - -2006 237 247 478 326 158 78 314 390 236 390 - 461 -2007 376 252 364 336 202 210 294 319 332 473 330 286 3,7742008 186 174 504 384 5 250 160 366 269 256 - - -Min 4 112 125 131 5 67 89 72 169 49 148 128Max 500 451 646 529 447 408 314 727 812 655 536 903Ave 278 238 319 321 234 187 203 288 372 343 334 359 3,475
Source: BMKG

Final Report (Supporting_PreF/S) Part 15 Hydrological Analysis for Simanggo-2 HEPP
JICA Project for the Master Plan Study of T-10 August, 2011 Hydropower Development in Indonesia
Table 10 Monthly Rainfall Records (5/12)
Station Name: Siborong-borongStation ID: 86 Unit: mm
Year Jan Feb Mar Apr May Jun Jul Aug Sep Oct Nov Dec Annual1969 - - - - - - - - - - - - -1970 - - - - - - - - - - - - -1971 - - - - - - - - - - - - -1972 - - - - - - - - - - - - -1973 49 85 279 262 331 237 117 115 196 216 186 344 2,4171974 101 156 143 195 272 135 99 30 461 145 156 457 2,3501975 96 - 260 252 195 44 150 12 252 121 134 89 -1976 - - - - - - - - - - - - -1977 - - 123 551 490 390 143 48 148 713 735 509 -1978 77 335 367 630 448 78 - 104 223 505 795 585 -1979 160 33 40 - - 226 360 242 937 498 - 376 -1980 380 141 193 328 367 - 40 145 165 222 69 362 -1981 220 261 89 228 232 52 5 - - - - - -1982 - - - - - - - - - - - - -1983 - 57 199 131 351 111 147 106 350 - - - -1984 334 119 - 217 - - - - 201 86 342 147 -1985 233 131 321 249 447 - - - - 215 - - -1986 - - - - - 70 102 65 - 298 - 66 -1987 144 - 201 - - - - - - 573 259 644 -1988 - - - - - - - - - - - - -1989 - 30 - - - - - - - - - - -1990 - - - - - - - - - - - - -1991 - - - - - - - - - - - - -1992 - 126 - - - - - - - - 352 - -1993 - - - - - - - - - - - - -1994 - - - - - - - - - - - - -1995 - - - - - - - - - - - - -1996 - - - - - - - - - - - 65 -1997 60 - 265 69 99 - 182 - 85 155 244 - -1998 - - - - - - - - - - - - -1999 - - - - - - - - - - - - -2000 - - - - - - - - - - - - -2001 - - - - - - - - - - - - -2002 - - - - - - - - - - - - -2003 - - - - - - - - - - - - -2004 - - - - - - - - - - - - -2005 - - - - - - - - - - - - -2006 - - - - - - - - - - - - -2007 - - - - - - - - - - - - -2008 - - - - - - - - - - - - -Min 49 30 40 69 99 44 5 12 85 86 69 65Max 380 335 367 630 490 390 360 242 937 713 795 644Ave 169 134 207 283 323 149 135 96 302 312 327 331 2,768
Source: BMKG
Final Report (Supporting_PreF/S) Part 15 Hydrological Analysis for Simanggo-2 HEPP
JICA Project for the Master Plan Study of T-11 August, 2011 Hydropower Development in Indonesia
Table 11 Monthly Rainfall Records (6/12)
Station Name: Dolok SanggulStation ID: 86A Unit: mm
Year Jan Feb Mar Apr May Jun Jul Aug Sep Oct Nov Dec Annual1969 - - - - - - - - - - - - -1970 - - - - - - - - - - - - -1971 - - - - - - - - - - - - -1972 - - - - - - - - - - - - -1973 75 126 166 350 213 68 109 107 141 176 304 366 2,2011974 170 108 249 330 252 11 98 7 469 247 171 290 2,4021975 121 161 218 280 - 9 157 18 138 4 124 263 -1976 - - - - - - - - - - - - -1977 - - 102 169 - - - 90 134 243 286 137 -1978 58 124 183 368 121 26 - 127 550 253 238 134 -1979 - 84 214 - - 146 162 14 136 279 828 183 -1980 89 82 144 241 147 - 25 65 118 187 309 455 -1981 62 162 44 155 123 80 - - - - - - -1982 - - - - - - - - - - - - -1983 - - - - - - - - 169 - 141 - -1984 157 114 - 263 419 - - - 179 142 345 158 -1985 113 66 188 207 144 - - - - 330 - - -1986 - - - - - - 145 65 198 255 258 217 -1987 130 90 50 292 242 52 123 156 228 491 238 214 2,3061988 - - - - - - - - - - - - -1989 - - - - - 130 - - - 155 - 160 -1990 - - 299 - - - - - - - - - -1991 269 - 351 357 418 107 84 84 159 - 591 396 -1992 195 132 299 368 - 52 78 - 308 67 - - -1993 187 103 59 - 329 - 44 16 65 265 151 81 -1994 111 - - - - - - - - - - - -1995 104 - - - - - - - - 109 - - -1996 - 180 287 63 92 22 101 95 72 221 130 215 -1997 78 38 165 142 - 70 38 13 54 - 227 80 -1998 37 - 74 70 16 - 67 - - - - 350 -1999 251 145 97 - - - - - - - - - -2000 - 160 - - - - - - - - - - -2001 - - - - - - - - - - - - -2002 - - - - - - - - - - - - -2003 - - - - - - - - - - - - -2004 - - - - - - - - - - - - -2005 - - - - - - - - - - - - -2006 - - - - - - - - - - - - -2007 - - - - - - - - - - - - -2008 - - - - - - - - - - - - -Min 37 38 44 63 16 9 25 7 54 4 124 80Max 269 180 351 368 419 146 162 156 550 491 828 455Ave 130 117 177 244 210 64 95 66 195 214 289 231 2,032
Source: BMKG
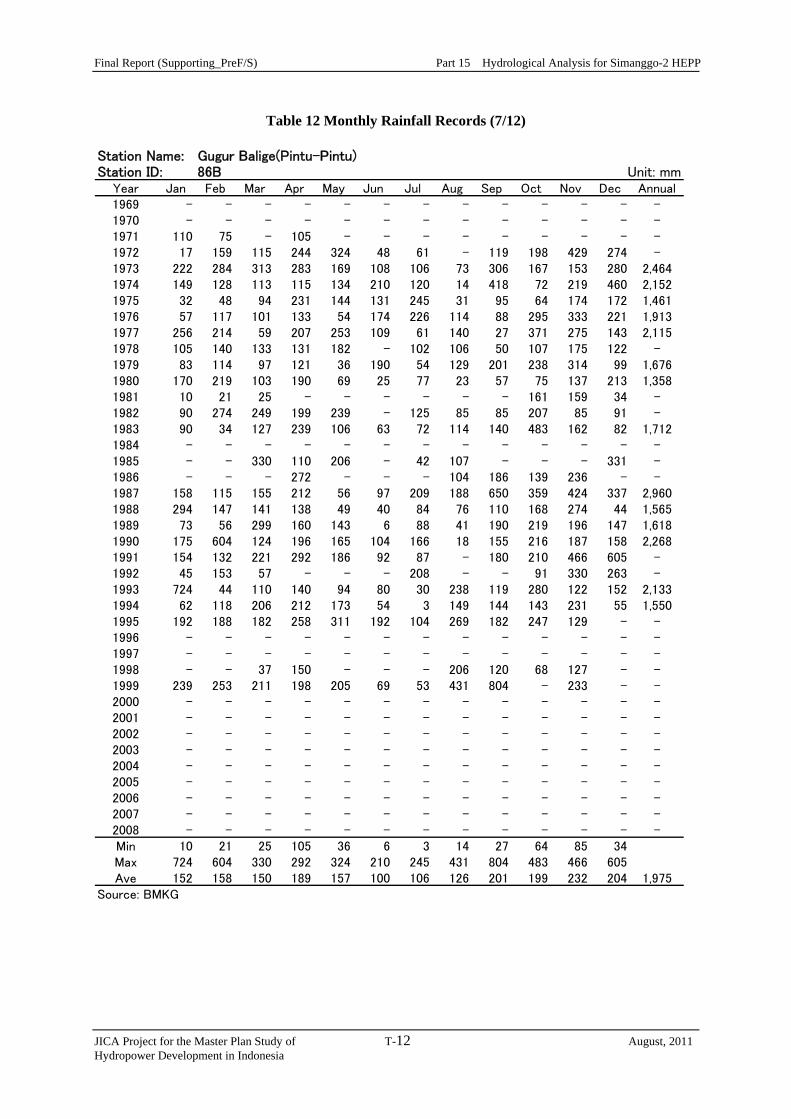
Final Report (Supporting_PreF/S) Part 15 Hydrological Analysis for Simanggo-2 HEPP
JICA Project for the Master Plan Study of T-12 August, 2011 Hydropower Development in Indonesia
Table 12 Monthly Rainfall Records (7/12)
Station Name: Gugur Balige(Pintu-Pintu)Station ID: 86B Unit: mm
Year Jan Feb Mar Apr May Jun Jul Aug Sep Oct Nov Dec Annual1969 - - - - - - - - - - - - -1970 - - - - - - - - - - - - -1971 110 75 - 105 - - - - - - - - -1972 17 159 115 244 324 48 61 - 119 198 429 274 -1973 222 284 313 283 169 108 106 73 306 167 153 280 2,4641974 149 128 113 115 134 210 120 14 418 72 219 460 2,1521975 32 48 94 231 144 131 245 31 95 64 174 172 1,4611976 57 117 101 133 54 174 226 114 88 295 333 221 1,9131977 256 214 59 207 253 109 61 140 27 371 275 143 2,1151978 105 140 133 131 182 - 102 106 50 107 175 122 -1979 83 114 97 121 36 190 54 129 201 238 314 99 1,6761980 170 219 103 190 69 25 77 23 57 75 137 213 1,3581981 10 21 25 - - - - - - 161 159 34 -1982 90 274 249 199 239 - 125 85 85 207 85 91 -1983 90 34 127 239 106 63 72 114 140 483 162 82 1,7121984 - - - - - - - - - - - - -1985 - - 330 110 206 - 42 107 - - - 331 -1986 - - - 272 - - - 104 186 139 236 - -1987 158 115 155 212 56 97 209 188 650 359 424 337 2,9601988 294 147 141 138 49 40 84 76 110 168 274 44 1,5651989 73 56 299 160 143 6 88 41 190 219 196 147 1,6181990 175 604 124 196 165 104 166 18 155 216 187 158 2,2681991 154 132 221 292 186 92 87 - 180 210 466 605 -1992 45 153 57 - - - 208 - - 91 330 263 -1993 724 44 110 140 94 80 30 238 119 280 122 152 2,1331994 62 118 206 212 173 54 3 149 144 143 231 55 1,5501995 192 188 182 258 311 192 104 269 182 247 129 - -1996 - - - - - - - - - - - - -1997 - - - - - - - - - - - - -1998 - - 37 150 - - - 206 120 68 127 - -1999 239 253 211 198 205 69 53 431 804 - 233 - -2000 - - - - - - - - - - - - -2001 - - - - - - - - - - - - -2002 - - - - - - - - - - - - -2003 - - - - - - - - - - - - -2004 - - - - - - - - - - - - -2005 - - - - - - - - - - - - -2006 - - - - - - - - - - - - -2007 - - - - - - - - - - - - -2008 - - - - - - - - - - - - -Min 10 21 25 105 36 6 3 14 27 64 85 34Max 724 604 330 292 324 210 245 431 804 483 466 605Ave 152 158 150 189 157 100 106 126 201 199 232 204 1,975
Source: BMKG
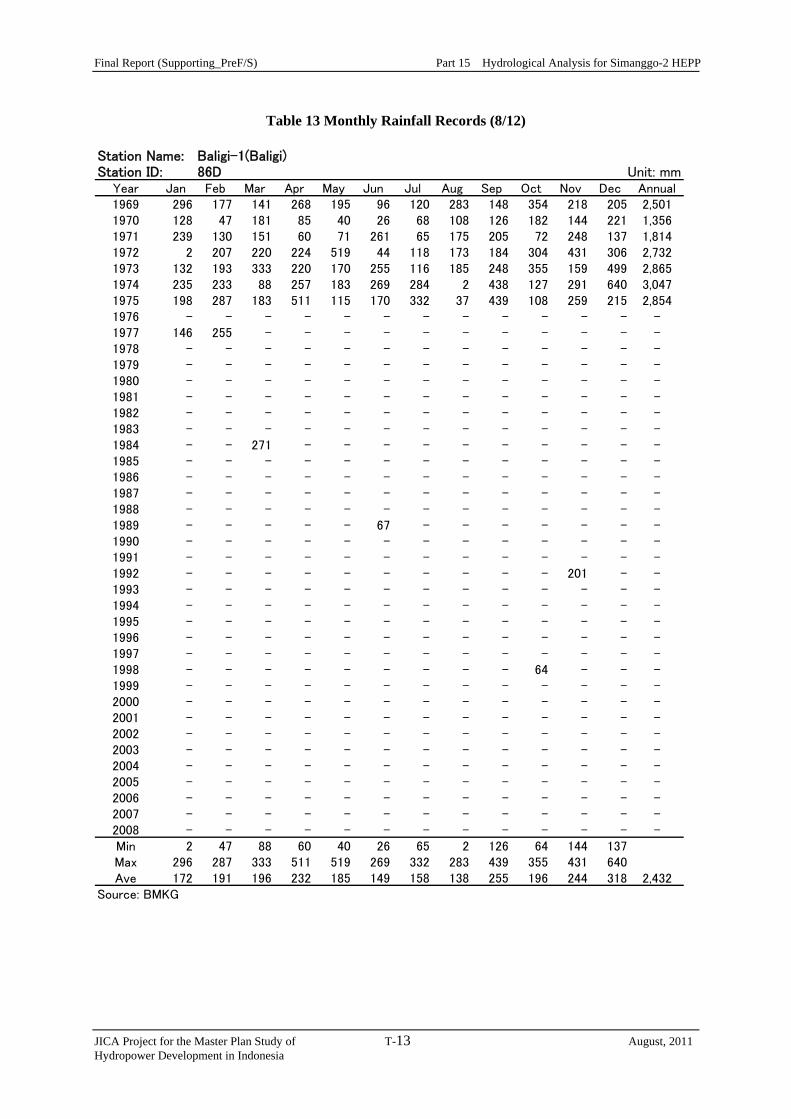
Final Report (Supporting_PreF/S) Part 15 Hydrological Analysis for Simanggo-2 HEPP
JICA Project for the Master Plan Study of T-13 August, 2011 Hydropower Development in Indonesia
Table 13 Monthly Rainfall Records (8/12)
Station Name: Baligi-1(Baligi)Station ID: 86D Unit: mm
Year Jan Feb Mar Apr May Jun Jul Aug Sep Oct Nov Dec Annual1969 296 177 141 268 195 96 120 283 148 354 218 205 2,5011970 128 47 181 85 40 26 68 108 126 182 144 221 1,3561971 239 130 151 60 71 261 65 175 205 72 248 137 1,8141972 2 207 220 224 519 44 118 173 184 304 431 306 2,7321973 132 193 333 220 170 255 116 185 248 355 159 499 2,8651974 235 233 88 257 183 269 284 2 438 127 291 640 3,0471975 198 287 183 511 115 170 332 37 439 108 259 215 2,8541976 - - - - - - - - - - - - -1977 146 255 - - - - - - - - - - -1978 - - - - - - - - - - - - -1979 - - - - - - - - - - - - -1980 - - - - - - - - - - - - -1981 - - - - - - - - - - - - -1982 - - - - - - - - - - - - -1983 - - - - - - - - - - - - -1984 - - 271 - - - - - - - - - -1985 - - - - - - - - - - - - -1986 - - - - - - - - - - - - -1987 - - - - - - - - - - - - -1988 - - - - - - - - - - - - -1989 - - - - - 67 - - - - - - -1990 - - - - - - - - - - - - -1991 - - - - - - - - - - - - -1992 - - - - - - - - - - 201 - -1993 - - - - - - - - - - - - -1994 - - - - - - - - - - - - -1995 - - - - - - - - - - - - -1996 - - - - - - - - - - - - -1997 - - - - - - - - - - - - -1998 - - - - - - - - - 64 - - -1999 - - - - - - - - - - - - -2000 - - - - - - - - - - - - -2001 - - - - - - - - - - - - -2002 - - - - - - - - - - - - -2003 - - - - - - - - - - - - -2004 - - - - - - - - - - - - -2005 - - - - - - - - - - - - -2006 - - - - - - - - - - - - -2007 - - - - - - - - - - - - -2008 - - - - - - - - - - - - -Min 2 47 88 60 40 26 65 2 126 64 144 137Max 296 287 333 511 519 269 332 283 439 355 431 640Ave 172 191 196 232 185 149 158 138 255 196 244 318 2,432
Source: BMKG
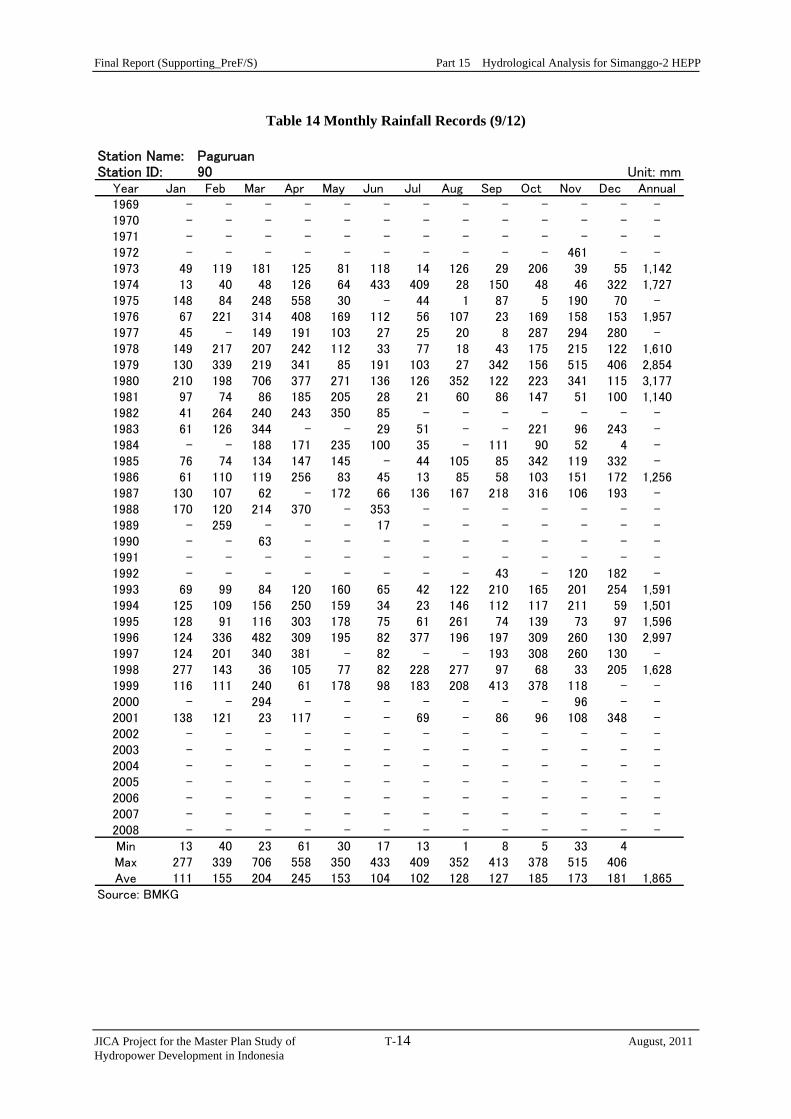
Final Report (Supporting_PreF/S) Part 15 Hydrological Analysis for Simanggo-2 HEPP
JICA Project for the Master Plan Study of T-14 August, 2011 Hydropower Development in Indonesia
Table 14 Monthly Rainfall Records (9/12)
Station Name: PaguruanStation ID: 90 Unit: mm
Year Jan Feb Mar Apr May Jun Jul Aug Sep Oct Nov Dec Annual1969 - - - - - - - - - - - - -1970 - - - - - - - - - - - - -1971 - - - - - - - - - - - - -1972 - - - - - - - - - - 461 - -1973 49 119 181 125 81 118 14 126 29 206 39 55 1,1421974 13 40 48 126 64 433 409 28 150 48 46 322 1,7271975 148 84 248 558 30 - 44 1 87 5 190 70 -1976 67 221 314 408 169 112 56 107 23 169 158 153 1,9571977 45 - 149 191 103 27 25 20 8 287 294 280 -1978 149 217 207 242 112 33 77 18 43 175 215 122 1,6101979 130 339 219 341 85 191 103 27 342 156 515 406 2,8541980 210 198 706 377 271 136 126 352 122 223 341 115 3,1771981 97 74 86 185 205 28 21 60 86 147 51 100 1,1401982 41 264 240 243 350 85 - - - - - - -1983 61 126 344 - - 29 51 - - 221 96 243 -1984 - - 188 171 235 100 35 - 111 90 52 4 -1985 76 74 134 147 145 - 44 105 85 342 119 332 -1986 61 110 119 256 83 45 13 85 58 103 151 172 1,2561987 130 107 62 - 172 66 136 167 218 316 106 193 -1988 170 120 214 370 - 353 - - - - - - -1989 - 259 - - - 17 - - - - - - -1990 - - 63 - - - - - - - - - -1991 - - - - - - - - - - - - -1992 - - - - - - - - 43 - 120 182 -1993 69 99 84 120 160 65 42 122 210 165 201 254 1,5911994 125 109 156 250 159 34 23 146 112 117 211 59 1,5011995 128 91 116 303 178 75 61 261 74 139 73 97 1,5961996 124 336 482 309 195 82 377 196 197 309 260 130 2,9971997 124 201 340 381 - 82 - - 193 308 260 130 -1998 277 143 36 105 77 82 228 277 97 68 33 205 1,6281999 116 111 240 61 178 98 183 208 413 378 118 - -2000 - - 294 - - - - - - - 96 - -2001 138 121 23 117 - - 69 - 86 96 108 348 -2002 - - - - - - - - - - - - -2003 - - - - - - - - - - - - -2004 - - - - - - - - - - - - -2005 - - - - - - - - - - - - -2006 - - - - - - - - - - - - -2007 - - - - - - - - - - - - -2008 - - - - - - - - - - - - -Min 13 40 23 61 30 17 13 1 8 5 33 4Max 277 339 706 558 350 433 409 352 413 378 515 406Ave 111 155 204 245 153 104 102 128 127 185 173 181 1,865
Source: BMKG
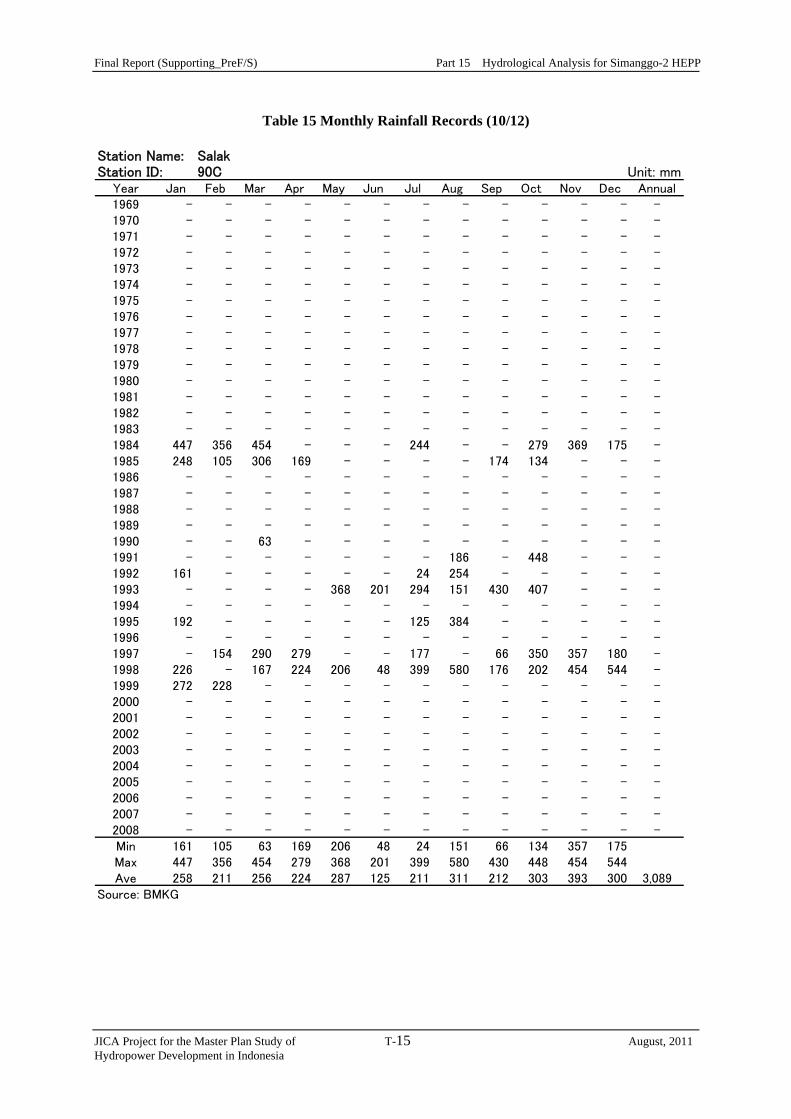
Final Report (Supporting_PreF/S) Part 15 Hydrological Analysis for Simanggo-2 HEPP
JICA Project for the Master Plan Study of T-15 August, 2011 Hydropower Development in Indonesia
Table 15 Monthly Rainfall Records (10/12)
Station Name: SalakStation ID: 90C Unit: mm
Year Jan Feb Mar Apr May Jun Jul Aug Sep Oct Nov Dec Annual1969 - - - - - - - - - - - - -1970 - - - - - - - - - - - - -1971 - - - - - - - - - - - - -1972 - - - - - - - - - - - - -1973 - - - - - - - - - - - - -1974 - - - - - - - - - - - - -1975 - - - - - - - - - - - - -1976 - - - - - - - - - - - - -1977 - - - - - - - - - - - - -1978 - - - - - - - - - - - - -1979 - - - - - - - - - - - - -1980 - - - - - - - - - - - - -1981 - - - - - - - - - - - - -1982 - - - - - - - - - - - - -1983 - - - - - - - - - - - - -1984 447 356 454 - - - 244 - - 279 369 175 -1985 248 105 306 169 - - - - 174 134 - - -1986 - - - - - - - - - - - - -1987 - - - - - - - - - - - - -1988 - - - - - - - - - - - - -1989 - - - - - - - - - - - - -1990 - - 63 - - - - - - - - - -1991 - - - - - - - 186 - 448 - - -1992 161 - - - - - 24 254 - - - - -1993 - - - - 368 201 294 151 430 407 - - -1994 - - - - - - - - - - - - -1995 192 - - - - - 125 384 - - - - -1996 - - - - - - - - - - - - -1997 - 154 290 279 - - 177 - 66 350 357 180 -1998 226 - 167 224 206 48 399 580 176 202 454 544 -1999 272 228 - - - - - - - - - - -2000 - - - - - - - - - - - - -2001 - - - - - - - - - - - - -2002 - - - - - - - - - - - - -2003 - - - - - - - - - - - - -2004 - - - - - - - - - - - - -2005 - - - - - - - - - - - - -2006 - - - - - - - - - - - - -2007 - - - - - - - - - - - - -2008 - - - - - - - - - - - - -Min 161 105 63 169 206 48 24 151 66 134 357 175Max 447 356 454 279 368 201 399 580 430 448 454 544Ave 258 211 256 224 287 125 211 311 212 303 393 300 3,089
Source: BMKG
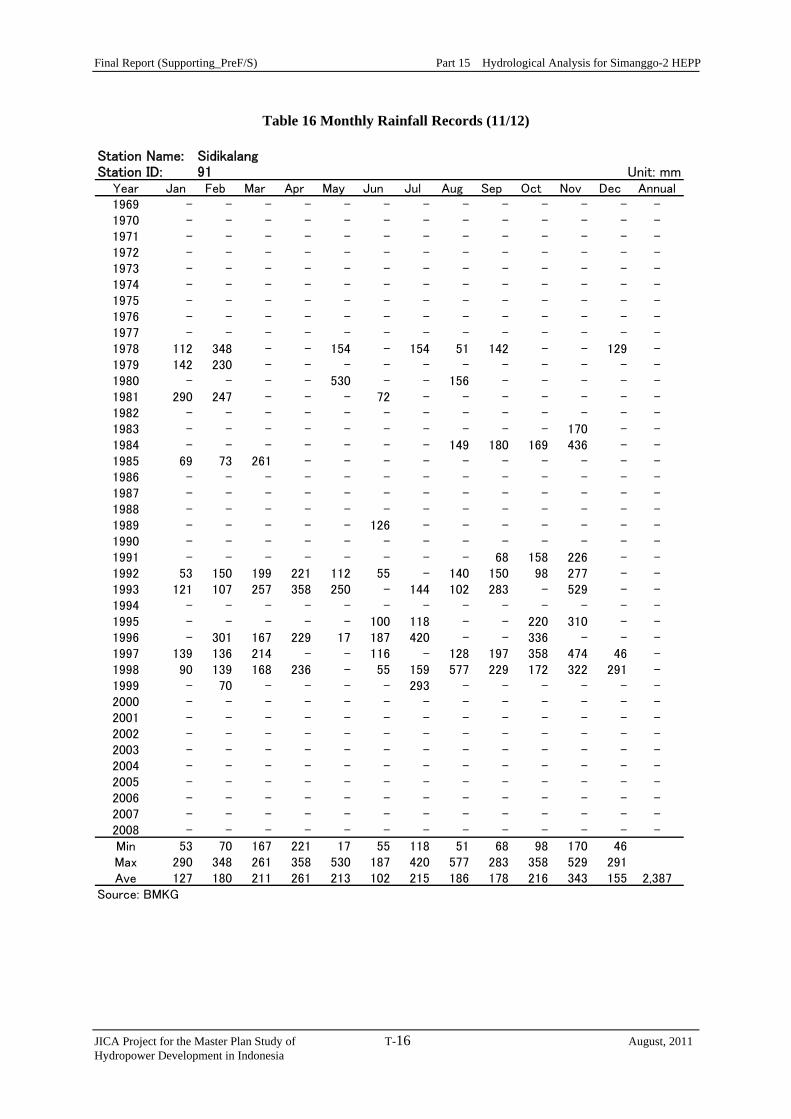
Final Report (Supporting_PreF/S) Part 15 Hydrological Analysis for Simanggo-2 HEPP
JICA Project for the Master Plan Study of T-16 August, 2011 Hydropower Development in Indonesia
Table 16 Monthly Rainfall Records (11/12)
Station Name: SidikalangStation ID: 91 Unit: mm
Year Jan Feb Mar Apr May Jun Jul Aug Sep Oct Nov Dec Annual1969 - - - - - - - - - - - - -1970 - - - - - - - - - - - - -1971 - - - - - - - - - - - - -1972 - - - - - - - - - - - - -1973 - - - - - - - - - - - - -1974 - - - - - - - - - - - - -1975 - - - - - - - - - - - - -1976 - - - - - - - - - - - - -1977 - - - - - - - - - - - - -1978 112 348 - - 154 - 154 51 142 - - 129 -1979 142 230 - - - - - - - - - - -1980 - - - - 530 - - 156 - - - - -1981 290 247 - - - 72 - - - - - - -1982 - - - - - - - - - - - - -1983 - - - - - - - - - - 170 - -1984 - - - - - - - 149 180 169 436 - -1985 69 73 261 - - - - - - - - - -1986 - - - - - - - - - - - - -1987 - - - - - - - - - - - - -1988 - - - - - - - - - - - - -1989 - - - - - 126 - - - - - - -1990 - - - - - - - - - - - - -1991 - - - - - - - - 68 158 226 - -1992 53 150 199 221 112 55 - 140 150 98 277 - -1993 121 107 257 358 250 - 144 102 283 - 529 - -1994 - - - - - - - - - - - - -1995 - - - - - 100 118 - - 220 310 - -1996 - 301 167 229 17 187 420 - - 336 - - -1997 139 136 214 - - 116 - 128 197 358 474 46 -1998 90 139 168 236 - 55 159 577 229 172 322 291 -1999 - 70 - - - - 293 - - - - - -2000 - - - - - - - - - - - - -2001 - - - - - - - - - - - - -2002 - - - - - - - - - - - - -2003 - - - - - - - - - - - - -2004 - - - - - - - - - - - - -2005 - - - - - - - - - - - - -2006 - - - - - - - - - - - - -2007 - - - - - - - - - - - - -2008 - - - - - - - - - - - - -Min 53 70 167 221 17 55 118 51 68 98 170 46Max 290 348 261 358 530 187 420 577 283 358 529 291Ave 127 180 211 261 213 102 215 186 178 216 343 155 2,387
Source: BMKG
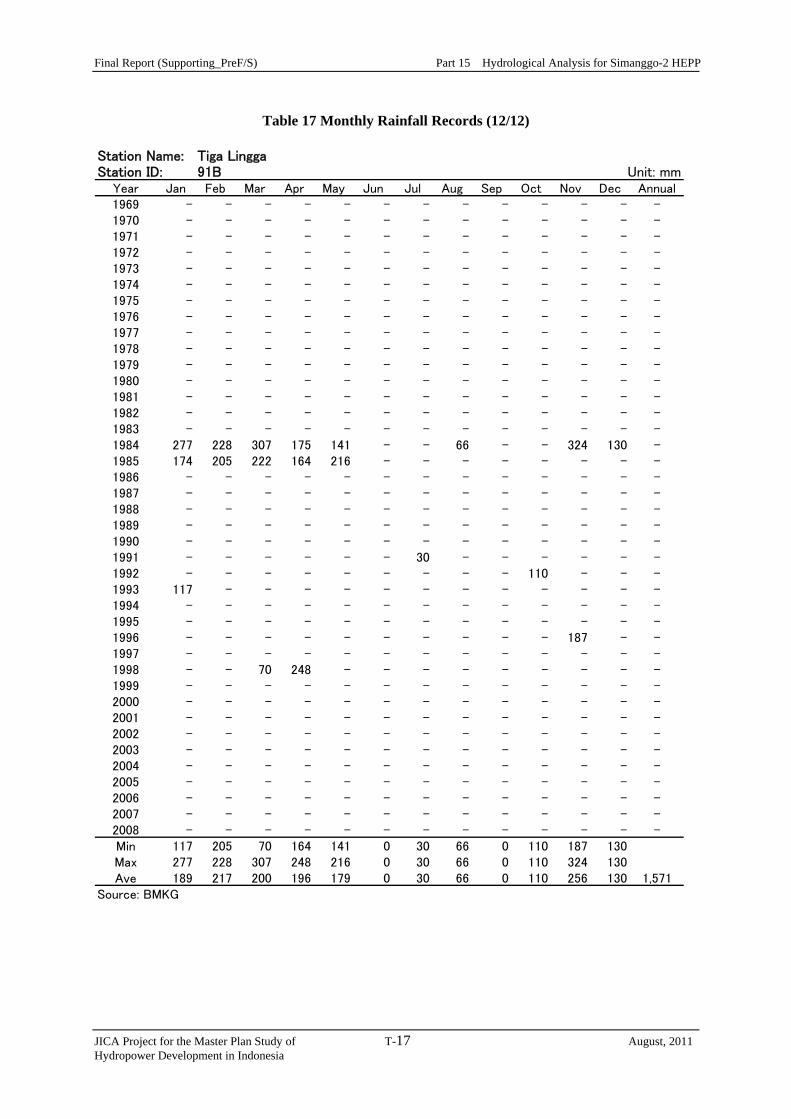
Final Report (Supporting_PreF/S) Part 15 Hydrological Analysis for Simanggo-2 HEPP
JICA Project for the Master Plan Study of T-17 August, 2011 Hydropower Development in Indonesia
Table 17 Monthly Rainfall Records (12/12)
Station Name: Tiga LinggaStation ID: 91B Unit: mm
Year Jan Feb Mar Apr May Jun Jul Aug Sep Oct Nov Dec Annual1969 - - - - - - - - - - - - -1970 - - - - - - - - - - - - -1971 - - - - - - - - - - - - -1972 - - - - - - - - - - - - -1973 - - - - - - - - - - - - -1974 - - - - - - - - - - - - -1975 - - - - - - - - - - - - -1976 - - - - - - - - - - - - -1977 - - - - - - - - - - - - -1978 - - - - - - - - - - - - -1979 - - - - - - - - - - - - -1980 - - - - - - - - - - - - -1981 - - - - - - - - - - - - -1982 - - - - - - - - - - - - -1983 - - - - - - - - - - - - -1984 277 228 307 175 141 - - 66 - - 324 130 -1985 174 205 222 164 216 - - - - - - - -1986 - - - - - - - - - - - - -1987 - - - - - - - - - - - - -1988 - - - - - - - - - - - - -1989 - - - - - - - - - - - - -1990 - - - - - - - - - - - - -1991 - - - - - - 30 - - - - - -1992 - - - - - - - - - 110 - - -1993 117 - - - - - - - - - - - -1994 - - - - - - - - - - - - -1995 - - - - - - - - - - - - -1996 - - - - - - - - - - 187 - -1997 - - - - - - - - - - - - -1998 - - 70 248 - - - - - - - - -1999 - - - - - - - - - - - - -2000 - - - - - - - - - - - - -2001 - - - - - - - - - - - - -2002 - - - - - - - - - - - - -2003 - - - - - - - - - - - - -2004 - - - - - - - - - - - - -2005 - - - - - - - - - - - - -2006 - - - - - - - - - - - - -2007 - - - - - - - - - - - - -2008 - - - - - - - - - - - - -Min 117 205 70 164 141 0 30 66 0 110 187 130Max 277 228 307 248 216 0 30 66 0 110 324 130Ave 189 217 200 196 179 0 30 66 0 110 256 130 1,571
Source: BMKG
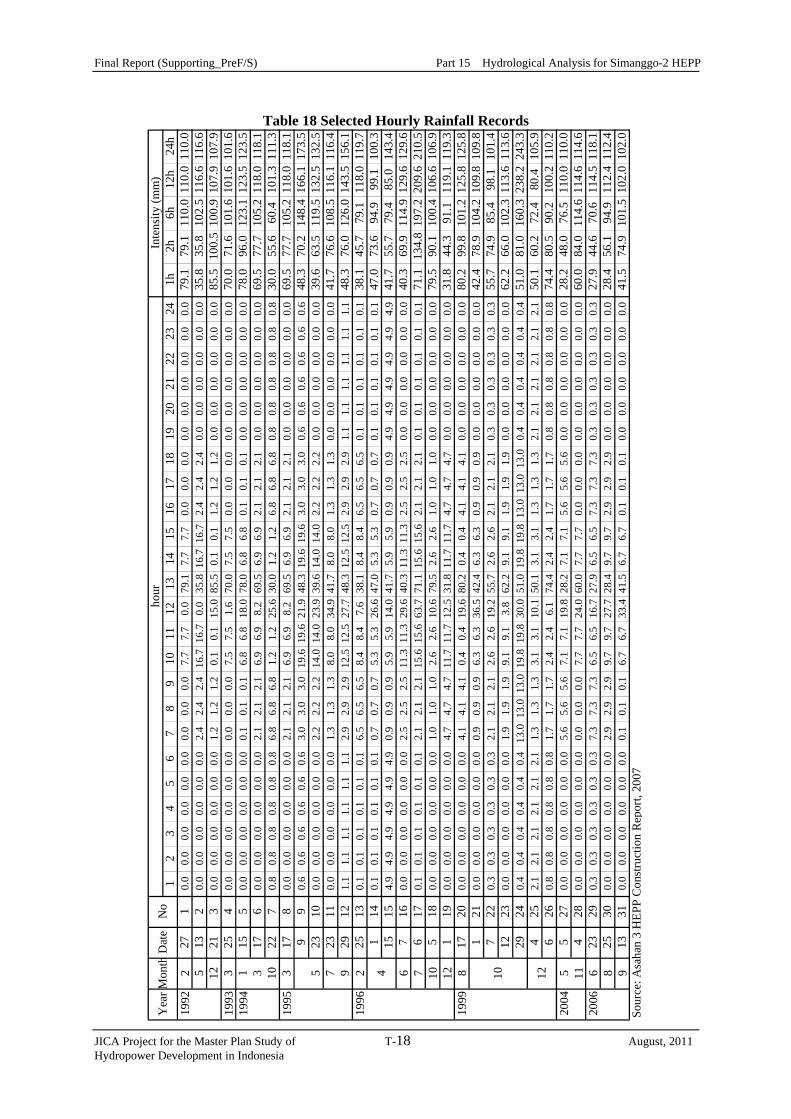
Final Report (Supporting_PreF/S) Part 15 Hydrological Analysis for Simanggo-2 HEPP
JICA Project for the Master Plan Study of T-18 August, 2011 Hydropower Development in Indonesia
Table 18 Selected Hourly Rainfall Records
12
34
56
78
910
1112
1314
1516
1718
1920
2122
2324
1h2h
6h12
h24
h19
922
271
0.0
0.0
0.0
0.0
0.0
0.0
0.0
0.0
0.0
7.7
7.7
0.0
79.1
7.7
7.7
0.0
0.0
0.0
0.0
0.0
0.0
0.0
0.0
0.0
79.1
79.1
110.
011
0.0
110.
05
132
0.0
0.0
0.0
0.0
0.0
0.0
2.4
2.4
2.4
16.7
16.7
0.0
35.8
16.7
16.7
2.4
2.4
2.4
0.0
0.0
0.0
0.0
0.0
0.0
35.8
35.8
102.
511
6.6
116.
612
213
0.0
0.0
0.0
0.0
0.0
0.0
1.2
1.2
1.2
0.1
0.1
15.0
85.5
0.1
0.1
1.2
1.2
1.2
0.0
0.0
0.0
0.0
0.0
0.0
85.5
100.
510
0.9
107.
910
7.9
1993
325
40.
00.
00.
00.
00.
00.
00.
00.
00.
07.
57.
51.
670
.07.
57.
50.
00.
00.
00.
00.
00.
00.
00.
00.
070
.071
.610
1.6
101.
610
1.6
1994
115
50.
00.
00.
00.
00.
00.
00.
10.
10.
16.
86.
818
.078
.06.
86.
80.
10.
10.
10.
00.
00.
00.
00.
00.
078
.096
.012
3.1
123.
512
3.5
317
60.
00.
00.
00.
00.
00.
02.
12.
12.
16.
96.
98.
269
.56.
96.
92.
12.
12.
10.
00.
00.
00.
00.
00.
069
.577
.710
5.2
118.
011
8.1
1022
70.
80.
80.
80.
80.
80.
86.
86.
86.
81.
21.
225
.630
.01.
21.
26.
86.
86.
80.
80.
80.
80.
80.
80.
830
.055
.660
.410
1.3
111.
319
953
178
0.0
0.0
0.0
0.0
0.0
0.0
2.1
2.1
2.1
6.9
6.9
8.2
69.5
6.9
6.9
2.1
2.1
2.1
0.0
0.0
0.0
0.0
0.0
0.0
69.5
77.7
105.
211
8.0
118.
19
90.
60.
60.
60.
60.
60.
63.
03.
03.
019
.619
.621
.948
.319
.619
.63.
03.
03.
00.
60.
60.
60.
60.
60.
648
.370
.214
8.4
166.
117
3.5
2310
0.0
0.0
0.0
0.0
0.0
0.0
2.2
2.2
2.2
14.0
14.0
23.9
39.6
14.0
14.0
2.2
2.2
2.2
0.0
0.0
0.0
0.0
0.0
0.0
39.6
63.5
119.
513
2.5
132.
57
2311
0.0
0.0
0.0
0.0
0.0
0.0
1.3
1.3
1.3
8.0
8.0
34.9
41.7
8.0
8.0
1.3
1.3
1.3
0.0
0.0
0.0
0.0
0.0
0.0
41.7
76.6
108.
511
6.1
116.
49
2912
1.1
1.1
1.1
1.1
1.1
1.1
2.9
2.9
2.9
12.5
12.5
27.7
48.3
12.5
12.5
2.9
2.9
2.9
1.1
1.1
1.1
1.1
1.1
1.1
48.3
76.0
126.
014
3.5
156.
119
962
2513
0.1
0.1
0.1
0.1
0.1
0.1
6.5
6.5
6.5
8.4
8.4
7.6
38.1
8.4
8.4
6.5
6.5
6.5
0.1
0.1
0.1
0.1
0.1
0.1
38.1
45.7
79.1
118.
011
9.7
114
0.1
0.1
0.1
0.1
0.1
0.1
0.7
0.7
0.7
5.3
5.3
26.6
47.0
5.3
5.3
0.7
0.7
0.7
0.1
0.1
0.1
0.1
0.1
0.1
47.0
73.6
94.9
99.1
100.
315
154.
94.
94.
94.
94.
94.
90.
90.
90.
95.
95.
914
.041
.75.
95.
90.
90.
90.
94.
94.
94.
94.
94.
94.
941
.755
.779
.485
.014
3.4
67
160.
00.
00.
00.
00.
00.
02.
52.
52.
511
.311
.329
.640
.311
.311
.32.
52.
52.
50.
00.
00.
00.
00.
00.
040
.369
.911
4.9
129.
612
9.6
76
170.
10.
10.
10.
10.
10.
12.
12.
12.
115
.615
.663
.771
.115
.615
.62.
12.
12.
10.
10.
10.
10.
10.
10.
171
.113
4.8
197.
220
9.6
210.
510
518
0.0
0.0
0.0
0.0
0.0
0.0
1.0
1.0
1.0
2.6
2.6
10.6
79.5
2.6
2.6
1.0
1.0
1.0
0.0
0.0
0.0
0.0
0.0
0.0
79.5
90.1
100.
410
6.6
106.
912
119
0.0
0.0
0.0
0.0
0.0
0.0
4.7
4.7
4.7
11.7
11.7
12.5
31.8
11.7
11.7
4.7
4.7
4.7
0.0
0.0
0.0
0.0
0.0
0.0
31.8
44.3
91.1
119.
111
9.3
1999
817
200.
00.
00.
00.
00.
00.
04.
14.
14.
10.
40.
419
.680
.20.
40.
44.
14.
14.
10.
00.
00.
00.
00.
00.
080
.299
.810
1.2
125.
812
5.8
121
0.0
0.0
0.0
0.0
0.0
0.0
0.9
0.9
0.9
6.3
6.3
36.5
42.4
6.3
6.3
0.9
0.9
0.9
0.0
0.0
0.0
0.0
0.0
0.0
42.4
78.9
104.
210
9.8
109.
87
220.
30.
30.
30.
30.
30.
32.
12.
12.
12.
62.
619
.255
.72.
62.
62.
12.
12.
10.
30.
30.
30.
30.
30.
355
.774
.985
.498
.110
1.4
1223
0.0
0.0
0.0
0.0
0.0
0.0
1.9
1.9
1.9
9.1
9.1
3.8
62.2
9.1
9.1
1.9
1.9
1.9
0.0
0.0
0.0
0.0
0.0
0.0
62.2
66.0
102.
311
3.6
113.
629
240.
40.
40.
40.
40.
40.
413
.013
.013
.019
.819
.830
.051
.019
.819
.813
.013
.013
.00.
40.
40.
40.
40.
40.
451
.081
.016
0.3
238.
224
3.3
425
2.1
2.1
2.1
2.1
2.1
2.1
1.3
1.3
1.3
3.1
3.1
10.1
50.1
3.1
3.1
1.3
1.3
1.3
2.1
2.1
2.1
2.1
2.1
2.1
50.1
60.2
72.4
80.4
105.
96
260.
80.
80.
80.
80.
80.
81.
71.
71.
72.
42.
46.
174
.42.
42.
41.
71.
71.
70.
80.
80.
80.
80.
80.
874
.480
.590
.210
0.2
110.
220
045
527
0.0
0.0
0.0
0.0
0.0
0.0
5.6
5.6
5.6
7.1
7.1
19.8
28.2
7.1
7.1
5.6
5.6
5.6
0.0
0.0
0.0
0.0
0.0
0.0
28.2
48.0
76.5
110.
011
0.0
114
280.
00.
00.
00.
00.
00.
00.
00.
00.
07.
77.
724
.060
.07.
77.
70.
00.
00.
00.
00.
00.
00.
00.
00.
060
.084
.011
4.6
114.
611
4.6
2006
623
290.
30.
30.
30.
30.
30.
37.
37.
37.
36.
56.
516
.727
.96.
56.
57.
37.
37.
30.
30.
30.
30.
30.
30.
327
.944
.670
.611
4.5
118.
18
2530
0.0
0.0
0.0
0.0
0.0
0.0
2.9
2.9
2.9
9.7
9.7
27.7
28.4
9.7
9.7
2.9
2.9
2.9
0.0
0.0
0.0
0.0
0.0
0.0
28.4
56.1
94.9
112.
411
2.4
913
310.
00.
00.
00.
00.
00.
00.
10.
10.
16.
76.
733
.441
.56.
76.
70.
10.
10.
10.
00.
00.
00.
00.
00.
041
.574
.910
1.5
102.
010
2.0
Sour
ce: A
saha
n 3
HEP
P C
onst
ruct
ion
Re p
ort,
2007
Inte
nsity
(mm
)
5 4
Yea
rMon
t hD
ate
hour
12
No
10
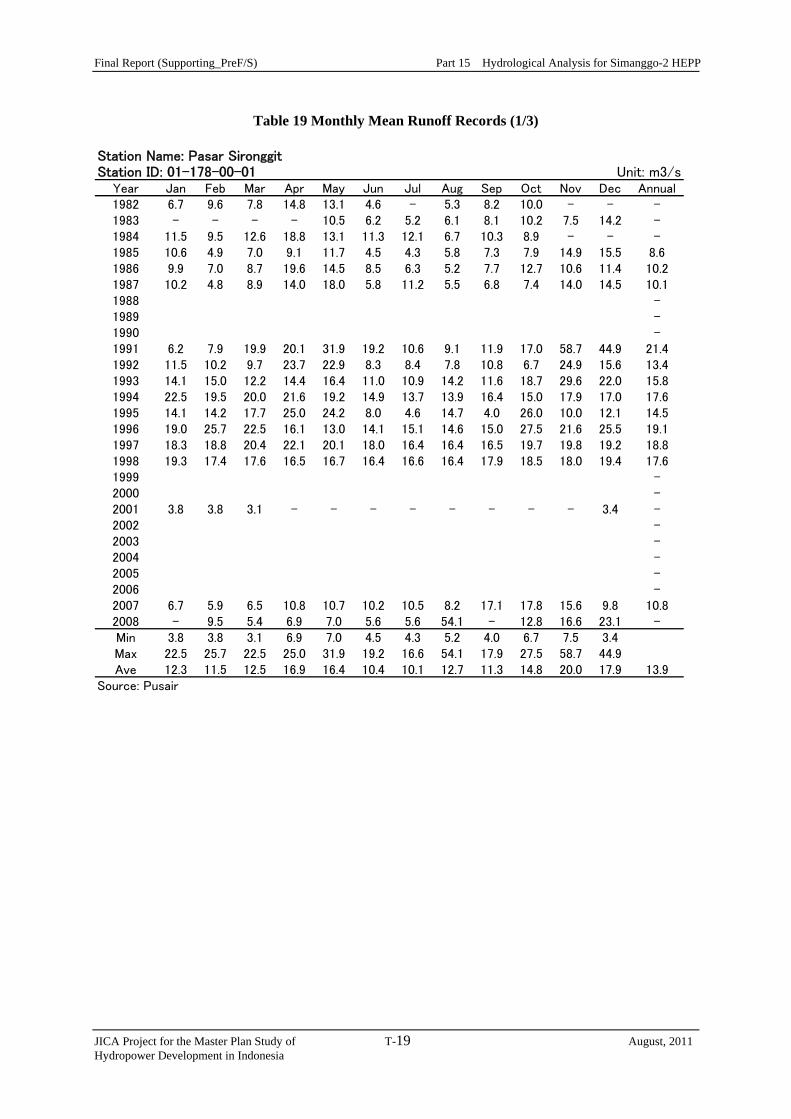
Final Report (Supporting_PreF/S) Part 15 Hydrological Analysis for Simanggo-2 HEPP
JICA Project for the Master Plan Study of T-19 August, 2011 Hydropower Development in Indonesia
Table 19 Monthly Mean Runoff Records (1/3)
Station Name: Pasar SironggitStation ID: 01-178-00-01 Unit: m3/s
Year Jan Feb Mar Apr May Jun Jul Aug Sep Oct Nov Dec Annual1982 6.7 9.6 7.8 14.8 13.1 4.6 - 5.3 8.2 10.0 - - -1983 - - - - 10.5 6.2 5.2 6.1 8.1 10.2 7.5 14.2 -1984 11.5 9.5 12.6 18.8 13.1 11.3 12.1 6.7 10.3 8.9 - - -1985 10.6 4.9 7.0 9.1 11.7 4.5 4.3 5.8 7.3 7.9 14.9 15.5 8.61986 9.9 7.0 8.7 19.6 14.5 8.5 6.3 5.2 7.7 12.7 10.6 11.4 10.21987 10.2 4.8 8.9 14.0 18.0 5.8 11.2 5.5 6.8 7.4 14.0 14.5 10.11988 -1989 -1990 -1991 6.2 7.9 19.9 20.1 31.9 19.2 10.6 9.1 11.9 17.0 58.7 44.9 21.41992 11.5 10.2 9.7 23.7 22.9 8.3 8.4 7.8 10.8 6.7 24.9 15.6 13.41993 14.1 15.0 12.2 14.4 16.4 11.0 10.9 14.2 11.6 18.7 29.6 22.0 15.81994 22.5 19.5 20.0 21.6 19.2 14.9 13.7 13.9 16.4 15.0 17.9 17.0 17.61995 14.1 14.2 17.7 25.0 24.2 8.0 4.6 14.7 4.0 26.0 10.0 12.1 14.51996 19.0 25.7 22.5 16.1 13.0 14.1 15.1 14.6 15.0 27.5 21.6 25.5 19.11997 18.3 18.8 20.4 22.1 20.1 18.0 16.4 16.4 16.5 19.7 19.8 19.2 18.81998 19.3 17.4 17.6 16.5 16.7 16.4 16.6 16.4 17.9 18.5 18.0 19.4 17.61999 -2000 -2001 3.8 3.8 3.1 - - - - - - - - 3.4 -2002 -2003 -2004 -2005 -2006 -2007 6.7 5.9 6.5 10.8 10.7 10.2 10.5 8.2 17.1 17.8 15.6 9.8 10.82008 - 9.5 5.4 6.9 7.0 5.6 5.6 54.1 - 12.8 16.6 23.1 -Min 3.8 3.8 3.1 6.9 7.0 4.5 4.3 5.2 4.0 6.7 7.5 3.4Max 22.5 25.7 22.5 25.0 31.9 19.2 16.6 54.1 17.9 27.5 58.7 44.9Ave 12.3 11.5 12.5 16.9 16.4 10.4 10.1 12.7 11.3 14.8 20.0 17.9 13.9
Source: Pusair
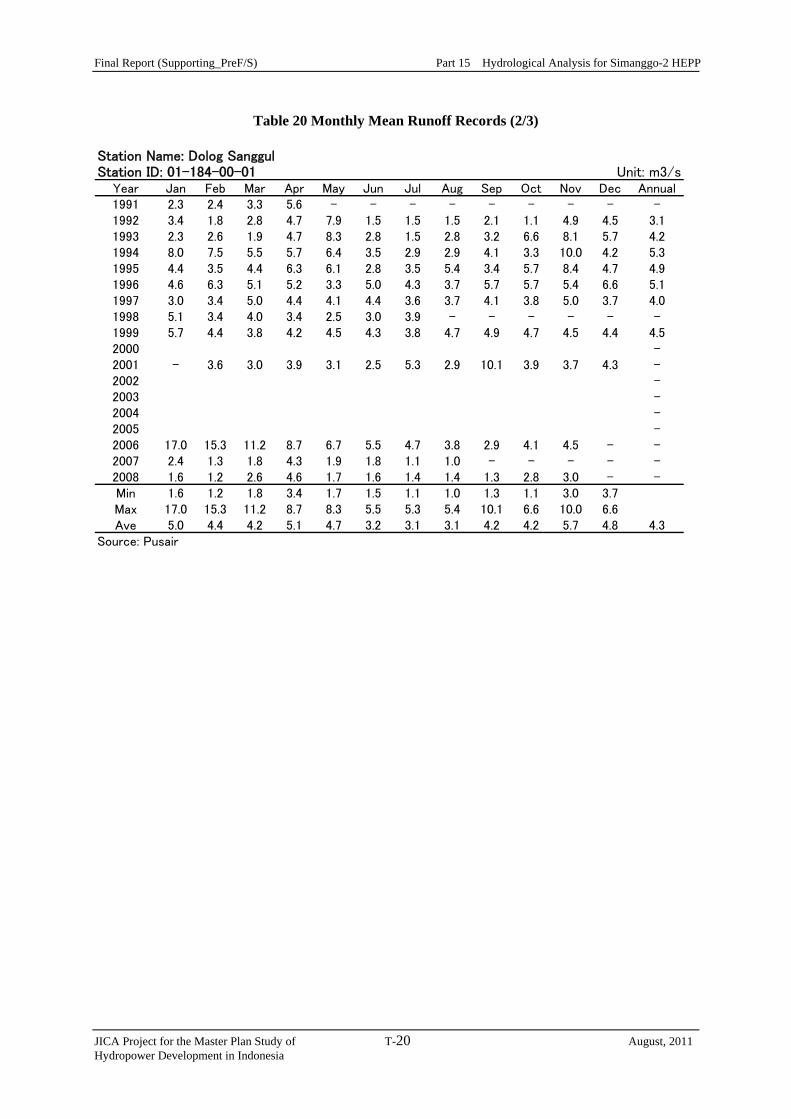
Final Report (Supporting_PreF/S) Part 15 Hydrological Analysis for Simanggo-2 HEPP
JICA Project for the Master Plan Study of T-20 August, 2011 Hydropower Development in Indonesia
Table 20 Monthly Mean Runoff Records (2/3)
Station Name: Dolog SanggulStation ID: 01-184-00-01 Unit: m3/s
Year Jan Feb Mar Apr May Jun Jul Aug Sep Oct Nov Dec Annual1991 2.3 2.4 3.3 5.6 - - - - - - - - -1992 3.4 1.8 2.8 4.7 7.9 1.5 1.5 1.5 2.1 1.1 4.9 4.5 3.11993 2.3 2.6 1.9 4.7 8.3 2.8 1.5 2.8 3.2 6.6 8.1 5.7 4.21994 8.0 7.5 5.5 5.7 6.4 3.5 2.9 2.9 4.1 3.3 10.0 4.2 5.31995 4.4 3.5 4.4 6.3 6.1 2.8 3.5 5.4 3.4 5.7 8.4 4.7 4.91996 4.6 6.3 5.1 5.2 3.3 5.0 4.3 3.7 5.7 5.7 5.4 6.6 5.11997 3.0 3.4 5.0 4.4 4.1 4.4 3.6 3.7 4.1 3.8 5.0 3.7 4.01998 5.1 3.4 4.0 3.4 2.5 3.0 3.9 - - - - - -1999 5.7 4.4 3.8 4.2 4.5 4.3 3.8 4.7 4.9 4.7 4.5 4.4 4.52000 -2001 - 3.6 3.0 3.9 3.1 2.5 5.3 2.9 10.1 3.9 3.7 4.3 -2002 -2003 -2004 -2005 -2006 17.0 15.3 11.2 8.7 6.7 5.5 4.7 3.8 2.9 4.1 4.5 - -2007 2.4 1.3 1.8 4.3 1.9 1.8 1.1 1.0 - - - - -2008 1.6 1.2 2.6 4.6 1.7 1.6 1.4 1.4 1.3 2.8 3.0 - -Min 1.6 1.2 1.8 3.4 1.7 1.5 1.1 1.0 1.3 1.1 3.0 3.7Max 17.0 15.3 11.2 8.7 8.3 5.5 5.3 5.4 10.1 6.6 10.0 6.6Ave 5.0 4.4 4.2 5.1 4.7 3.2 3.1 3.1 4.2 4.2 5.7 4.8 4.3
Source: Pusair

Final Report (Supporting_PreF/S) Part 15 Hydrological Analysis for Simanggo-2 HEPP
JICA Project for the Master Plan Study of T-21 August, 2011 Hydropower Development in Indonesia
Table 21 Monthly Mean Runoff Records (3/3)
Station Name: MaradeStation ID: 01-186-00-01 Unit: m3/s
Year Jan Feb Mar Apr May Jun Jul Aug Sep Oct Nov Dec Annual1983 3.8 2.7 3.7 2.6 8.7 5.8 4.8 4.8 8.9 - 11.6 - -1984 13.4 - 6.8 8.0 11.0 - 6.0 2.8 - - - - -1985 - 4.4 6.0 7.4 8.1 3.5 3.8 3.7 - - 7.2 10.8 -1986 4.6 3.9 8.7 11.8 9.1 3.4 2.9 2.8 4.3 6.4 10.3 4.7 6.11987 - 4.2 5.3 6.4 9.9 4.2 5.3 6.1 7.2 - 9.8 - -1988 9.5 12.8 7.7 7.3 6.7 3.2 2.9 2.2 3.6 16.2 18.3 11.5 8.51989 3.9 4.4 9.1 7.0 4.1 2.5 3.0 2.3 3.8 6.7 7.6 4.8 4.91990 5.7 3.4 3.1 4.7 7.9 2.9 3.9 3.4 2.0 4.7 3.8 5.3 4.21991 4.9 6.4 - - - - - - - - - - -1992 -1993 2.5 2.4 4.2 4.6 5.6 3.4 3.0 3.4 4.3 5.6 6.7 5.6 4.31994 9.9 7.9 10.4 13.4 9.9 5.1 3.6 4.9 6.3 3.9 7.1 4.2 7.21995 18.0 18.0 19.8 26.2 24.3 18.9 17.6 24.9 20.0 19.9 24.1 20.2 21.01996 4.1 5.8 5.5 5.2 2.8 5.1 1.5 2.0 2.7 3.3 6.3 4.0 4.01997 - - - - - - - - - - - - -1998 6.1 7.5 4.8 4.2 3.8 3.2 5.1 7.3 4.3 5.2 5.9 5.6 5.31999 -2000 -2001 6.9 7.4 7.3 7.9 5.2 5.1 6.1 5.5 5.9 6.4 6.2 - -2002 -2003 -2004 -2005 7.6 7.7 7.5 8.9 8.0 7.5 7.2 7.2 7.3 8.0 7.4 7.9 7.72006 15.4 14.7 13.8 12.6 11.6 10.6 9.8 8.8 7.7 7.0 6.6 - -2007 - 2.6 3.7 - - - 1.2 - 2.3 3.8 2.6 1.3 -2008 1.6 1.7 2.6 4.2 1.7 - - - - - - - -Min 1.6 1.7 2.6 2.6 1.7 2.5 1.2 2.0 2.0 3.3 2.6 1.3Max 18.0 18.0 19.8 26.2 24.3 18.9 17.6 24.9 20.0 19.9 24.1 20.2Ave 7.4 6.6 7.2 8.4 8.1 5.6 5.1 5.8 6.0 7.5 8.8 7.1 7.0
Source: Pusair
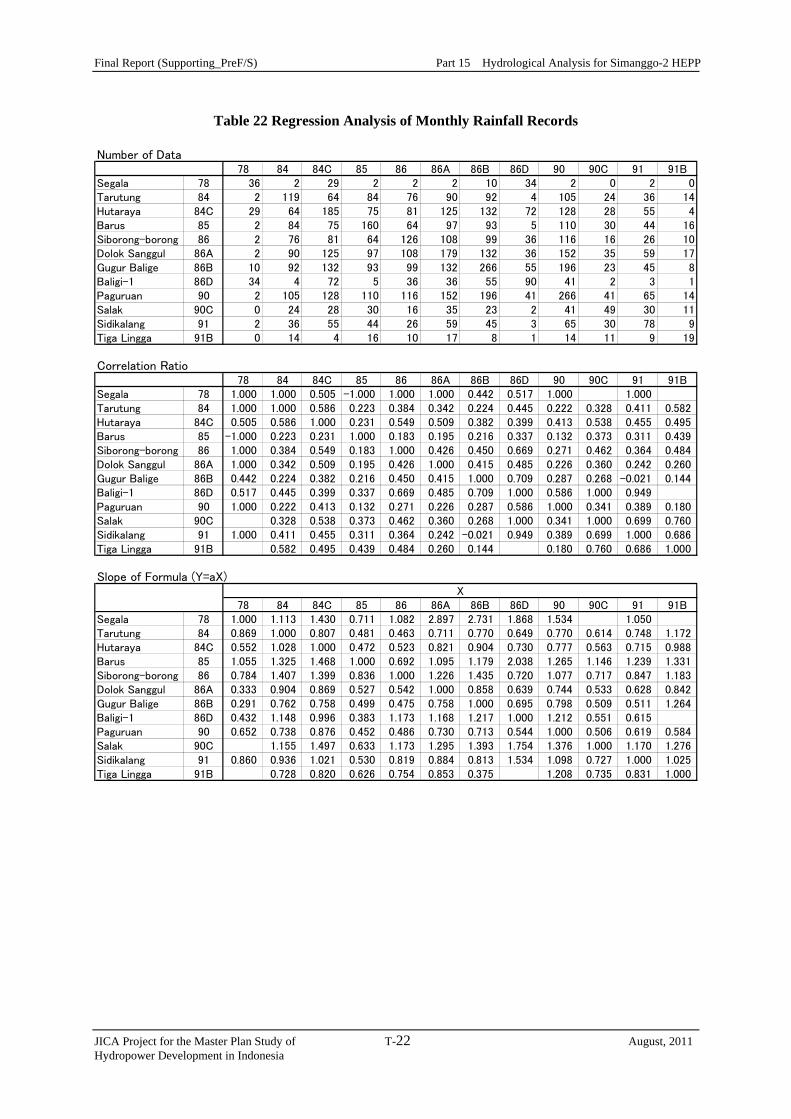
Final Report (Supporting_PreF/S) Part 15 Hydrological Analysis for Simanggo-2 HEPP
JICA Project for the Master Plan Study of T-22 August, 2011 Hydropower Development in Indonesia
Table 22 Regression Analysis of Monthly Rainfall Records
Number of Data
78 84 84C 85 86 86A 86B 86D 90 90C 91 91BSegala 78 36 2 29 2 2 2 10 34 2 0 2 0Tarutung 84 2 119 64 84 76 90 92 4 105 24 36 14Hutaraya 84C 29 64 185 75 81 125 132 72 128 28 55 4Barus 85 2 84 75 160 64 97 93 5 110 30 44 16Siborong-borong 86 2 76 81 64 126 108 99 36 116 16 26 10Dolok Sanggul 86A 2 90 125 97 108 179 132 36 152 35 59 17Gugur Balige 86B 10 92 132 93 99 132 266 55 196 23 45 8Baligi-1 86D 34 4 72 5 36 36 55 90 41 2 3 1Paguruan 90 2 105 128 110 116 152 196 41 266 41 65 14Salak 90C 0 24 28 30 16 35 23 2 41 49 30 11Sidikalang 91 2 36 55 44 26 59 45 3 65 30 78 9Tiga Lingga 91B 0 14 4 16 10 17 8 1 14 11 9 19
Correlation Ratio78 84 84C 85 86 86A 86B 86D 90 90C 91 91B
Segala 78 1.000 1.000 0.505 -1.000 1.000 1.000 0.442 0.517 1.000 1.000Tarutung 84 1.000 1.000 0.586 0.223 0.384 0.342 0.224 0.445 0.222 0.328 0.411 0.582Hutaraya 84C 0.505 0.586 1.000 0.231 0.549 0.509 0.382 0.399 0.413 0.538 0.455 0.495Barus 85 -1.000 0.223 0.231 1.000 0.183 0.195 0.216 0.337 0.132 0.373 0.311 0.439Siborong-borong 86 1.000 0.384 0.549 0.183 1.000 0.426 0.450 0.669 0.271 0.462 0.364 0.484Dolok Sanggul 86A 1.000 0.342 0.509 0.195 0.426 1.000 0.415 0.485 0.226 0.360 0.242 0.260Gugur Balige 86B 0.442 0.224 0.382 0.216 0.450 0.415 1.000 0.709 0.287 0.268 -0.021 0.144Baligi-1 86D 0.517 0.445 0.399 0.337 0.669 0.485 0.709 1.000 0.586 1.000 0.949Paguruan 90 1.000 0.222 0.413 0.132 0.271 0.226 0.287 0.586 1.000 0.341 0.389 0.180Salak 90C 0.328 0.538 0.373 0.462 0.360 0.268 1.000 0.341 1.000 0.699 0.760Sidikalang 91 1.000 0.411 0.455 0.311 0.364 0.242 -0.021 0.949 0.389 0.699 1.000 0.686Tiga Lingga 91B 0.582 0.495 0.439 0.484 0.260 0.144 0.180 0.760 0.686 1.000
Slope of Formula (Y=aX)
78 84 84C 85 86 86A 86B 86D 90 90C 91 91BSegala 78 1.000 1.113 1.430 0.711 1.082 2.897 2.731 1.868 1.534 1.050Tarutung 84 0.869 1.000 0.807 0.481 0.463 0.711 0.770 0.649 0.770 0.614 0.748 1.172Hutaraya 84C 0.552 1.028 1.000 0.472 0.523 0.821 0.904 0.730 0.777 0.563 0.715 0.988Barus 85 1.055 1.325 1.468 1.000 0.692 1.095 1.179 2.038 1.265 1.146 1.239 1.331Siborong-borong 86 0.784 1.407 1.399 0.836 1.000 1.226 1.435 0.720 1.077 0.717 0.847 1.183Dolok Sanggul 86A 0.333 0.904 0.869 0.527 0.542 1.000 0.858 0.639 0.744 0.533 0.628 0.842Gugur Balige 86B 0.291 0.762 0.758 0.499 0.475 0.758 1.000 0.695 0.798 0.509 0.511 1.264Baligi-1 86D 0.432 1.148 0.996 0.383 1.173 1.168 1.217 1.000 1.212 0.551 0.615Paguruan 90 0.652 0.738 0.876 0.452 0.486 0.730 0.713 0.544 1.000 0.506 0.619 0.584Salak 90C 1.155 1.497 0.633 1.173 1.295 1.393 1.754 1.376 1.000 1.170 1.276Sidikalang 91 0.860 0.936 1.021 0.530 0.819 0.884 0.813 1.534 1.098 0.727 1.000 1.025Tiga Lingga 91B 0.728 0.820 0.626 0.754 0.853 0.375 1.208 0.735 0.831 1.000
X
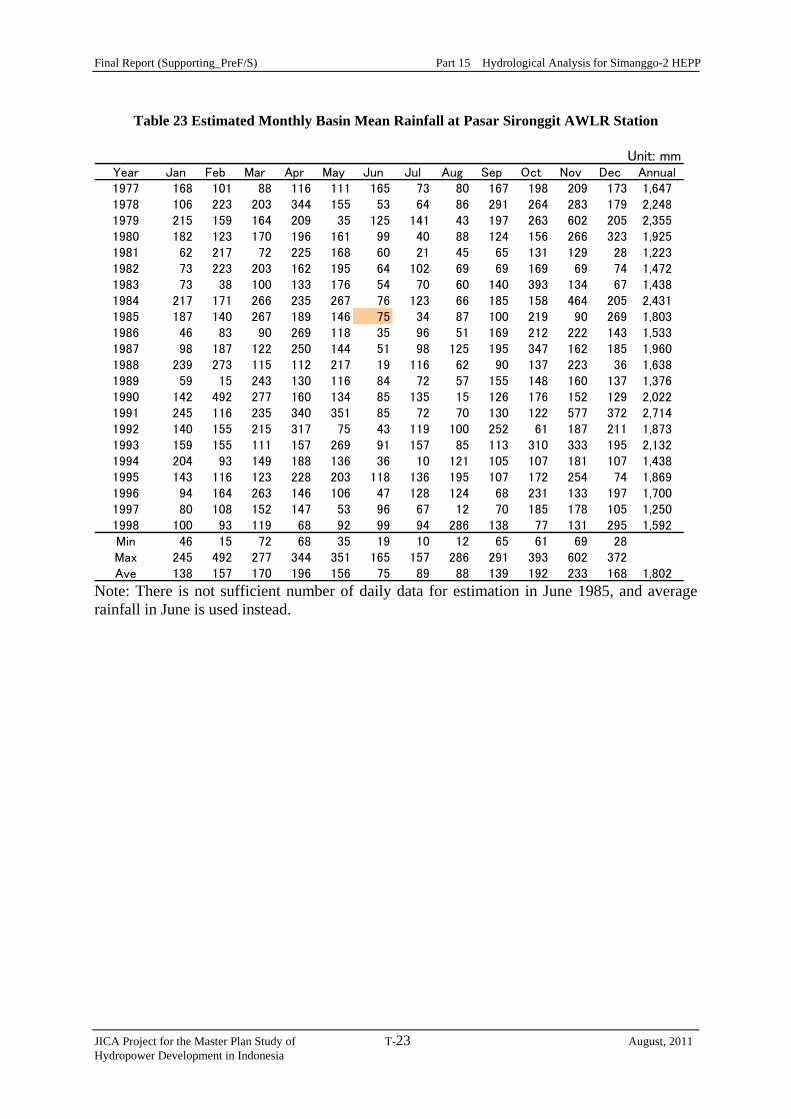
Final Report (Supporting_PreF/S) Part 15 Hydrological Analysis for Simanggo-2 HEPP
JICA Project for the Master Plan Study of T-23 August, 2011 Hydropower Development in Indonesia
Table 23 Estimated Monthly Basin Mean Rainfall at Pasar Sironggit AWLR Station
Unit: mm
Year Jan Feb Mar Apr May Jun Jul Aug Sep Oct Nov Dec Annual1977 168 101 88 116 111 165 73 80 167 198 209 173 1,6471978 106 223 203 344 155 53 64 86 291 264 283 179 2,2481979 215 159 164 209 35 125 141 43 197 263 602 205 2,3551980 182 123 170 196 161 99 40 88 124 156 266 323 1,9251981 62 217 72 225 168 60 21 45 65 131 129 28 1,2231982 73 223 203 162 195 64 102 69 69 169 69 74 1,4721983 73 38 100 133 176 54 70 60 140 393 134 67 1,4381984 217 171 266 235 267 76 123 66 185 158 464 205 2,4311985 187 140 267 189 146 75 34 87 100 219 90 269 1,8031986 46 83 90 269 118 35 96 51 169 212 222 143 1,5331987 98 187 122 250 144 51 98 125 195 347 162 185 1,9601988 239 273 115 112 217 19 116 62 90 137 223 36 1,6381989 59 15 243 130 116 84 72 57 155 148 160 137 1,3761990 142 492 277 160 134 85 135 15 126 176 152 129 2,0221991 245 116 235 340 351 85 72 70 130 122 577 372 2,7141992 140 155 215 317 75 43 119 100 252 61 187 211 1,8731993 159 155 111 157 269 91 157 85 113 310 333 195 2,1321994 204 93 149 188 136 36 10 121 105 107 181 107 1,4381995 143 116 123 228 203 118 136 195 107 172 254 74 1,8691996 94 164 263 146 106 47 128 124 68 231 133 197 1,7001997 80 108 152 147 53 96 67 12 70 185 178 105 1,2501998 100 93 119 68 92 99 94 286 138 77 131 295 1,592Min 46 15 72 68 35 19 10 12 65 61 69 28Max 245 492 277 344 351 165 157 286 291 393 602 372Ave 138 157 170 196 156 75 89 88 139 192 233 168 1,802
Note: There is not sufficient number of daily data for estimation in June 1985, and average rainfall in June is used instead.
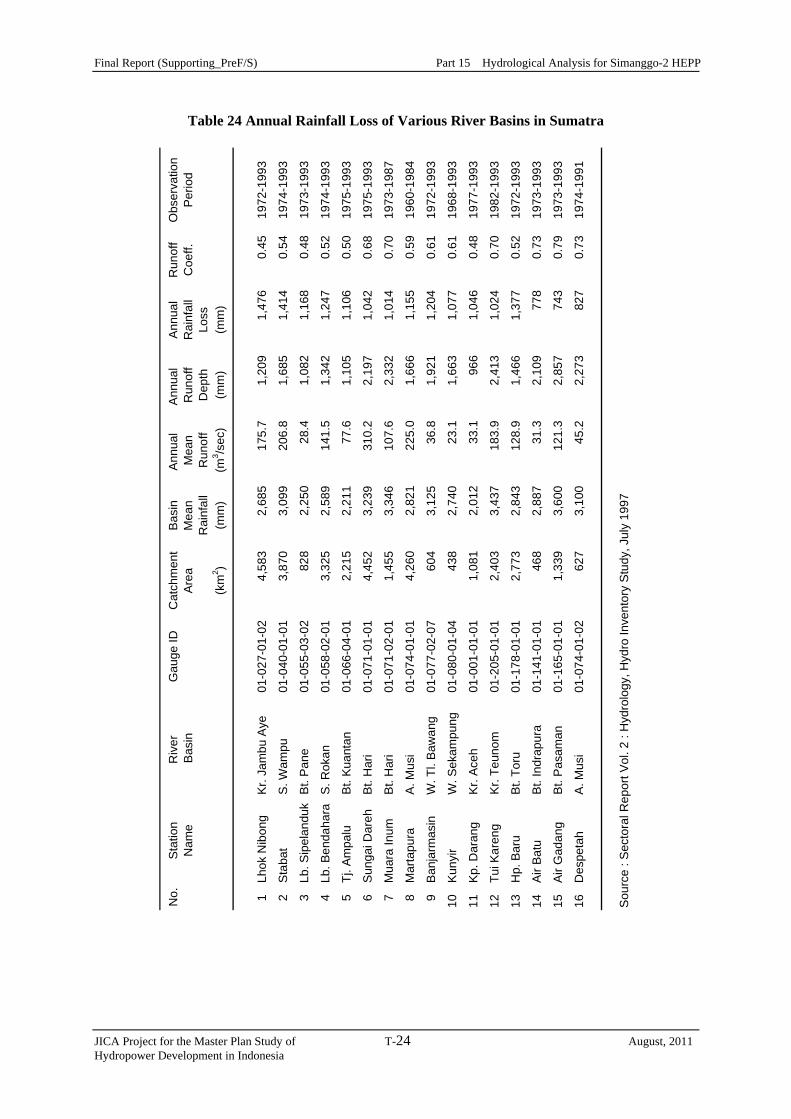
Final Report (Supporting_PreF/S) Part 15 Hydrological Analysis for Simanggo-2 HEPP
JICA Project for the Master Plan Study of T-24 August, 2011 Hydropower Development in Indonesia
Table 24 Annual Rainfall Loss of Various River Basins in Sumatra
No.
Sta
tion
Riv
er
Gau
ge ID
Cat
chm
ent
Bas
inA
nnua
l A
nnua
l A
nnua
lR
unof
fO
bser
vatio
nN
ame
Bas
inAr
eaM
ean
Mea
nR
unof
fR
ainf
all
Coe
ff.P
erio
dR
ainf
all
Run
off
Dep
thLo
ss(k
m2 )
(mm
)(m
3 /sec
)(m
m)
(mm
)
1Lh
ok N
ibon
gK
r. Ja
mbu
Aye
01-0
27-0
1-02
4,58
32,
685
175.
71,
209
1,47
60.
4519
72-1
993
2S
taba
tS
. Wam
pu01
-040
-01-
013,
870
3,09
920
6.8
1,68
51,
414
0.54
1974
-199
3
3Lb
. Sip
elan
duk
Bt.
Pan
e01
-055
-03-
0282
82,
250
28.4
1,08
21,
168
0.48
1973
-199
3
4Lb
. Ben
daha
raS
. Rok
an01
-058
-02-
013,
325
2,58
914
1.5
1,34
21,
247
0.52
1974
-199
3
5Tj
. Am
palu
Bt.
Kua
ntan
01-0
66-0
4-01
2,21
52,
211
77.6
1,10
51,
106
0.50
1975
-199
3
6S
unga
i Dar
ehB
t. H
ari
01-0
71-0
1-01
4,45
23,
239
310.
22,
197
1,04
20.
6819
75-1
993
7M
uara
Inum
Bt.
Har
i01
-071
-02-
011,
455
3,34
610
7.6
2,33
21,
014
0.70
1973
-198
7
8M
arta
pura
A. M
usi
01-0
74-0
1-01
4,26
02,
821
225.
01,
666
1,15
50.
5919
60-1
984
9B
anja
rmas
inW
. Tl.
Baw
ang
01-0
77-0
2-07
604
3,12
536
.81,
921
1,20
40.
6119
72-1
993
10K
unyi
rW
. Sek
ampu
ng01
-080
-01-
0443
82,
740
23.1
1,66
31,
077
0.61
1968
-199
3
11K
p. D
aran
gK
r. A
ceh
01-0
01-0
1-01
1,08
12,
012
33.1
966
1,04
60.
4819
77-1
993
12Tu
i Kar
eng
Kr.
Teun
om01
-205
-01-
012,
403
3,43
718
3.9
2,41
31,
024
0.70
1982
-199
3
13H
p. B
aru
Bt.
Toru
01-1
78-0
1-01
2,77
32,
843
128.
91,
466
1,37
70.
5219
72-1
993
14A
ir B
atu
Bt.
Indr
apur
a01
-141
-01-
0146
82,
887
31.3
2,10
977
80.
7319
73-1
993
15A
ir G
adan
gB
t. P
asam
an01
-165
-01-
011,
339
3,60
012
1.3
2,85
774
30.
7919
73-1
993
16D
espe
tah
A. M
usi
01-0
74-0
1-02
627
3,10
045
.22,
273
827
0.73
1974
-199
1
Sou
rce
: Sec
tora
l Rep
ort V
ol. 2
: H
ydro
logy
, Hyd
ro In
vent
ory
Stu
dy, J
uly
1997
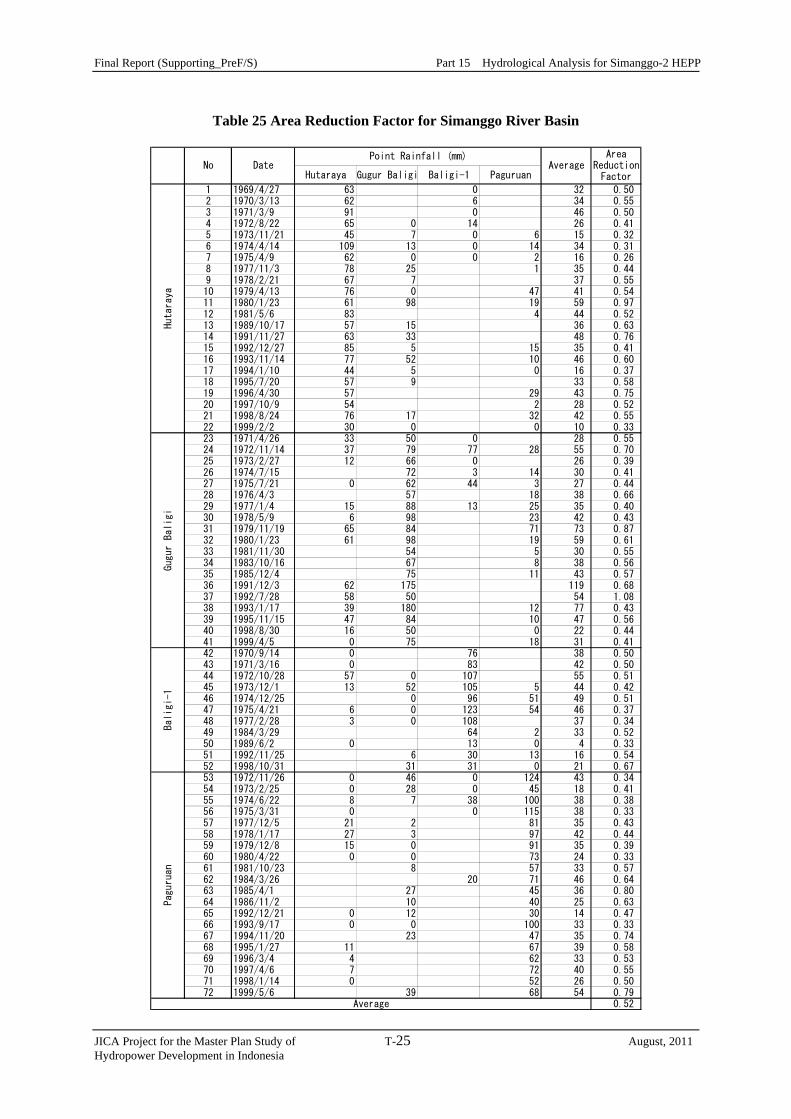
Final Report (Supporting_PreF/S) Part 15 Hydrological Analysis for Simanggo-2 HEPP
JICA Project for the Master Plan Study of T-25 August, 2011 Hydropower Development in Indonesia
Table 25 Area Reduction Factor for Simanggo River Basin
Hutaraya Gugur Baligi Baligi-1 Paguruan
1 1969/4/27 63 0 32 0.502 1970/3/13 62 6 34 0.553 1971/3/9 91 0 46 0.504 1972/8/22 65 0 14 26 0.415 1973/11/21 45 7 0 6 15 0.326 1974/4/14 109 13 0 14 34 0.317 1975/4/9 62 0 0 2 16 0.268 1977/11/3 78 25 1 35 0.449 1978/2/21 67 7 37 0.5510 1979/4/13 76 0 47 41 0.5411 1980/1/23 61 98 19 59 0.9712 1981/5/6 83 4 44 0.5213 1989/10/17 57 15 36 0.6314 1991/11/27 63 33 48 0.7615 1992/12/27 85 5 15 35 0.4116 1993/11/14 77 52 10 46 0.6017 1994/1/10 44 5 0 16 0.3718 1995/7/20 57 9 33 0.5819 1996/4/30 57 29 43 0.7520 1997/10/9 54 2 28 0.5221 1998/8/24 76 17 32 42 0.5522 1999/2/2 30 0 0 10 0.3323 1971/4/26 33 50 0 28 0.5524 1972/11/14 37 79 77 28 55 0.7025 1973/2/27 12 66 0 26 0.3926 1974/7/15 72 3 14 30 0.4127 1975/7/21 0 62 44 3 27 0.4428 1976/4/3 57 18 38 0.6629 1977/1/4 15 88 13 25 35 0.4030 1978/5/9 6 98 23 42 0.4331 1979/11/19 65 84 71 73 0.8732 1980/1/23 61 98 19 59 0.6133 1981/11/30 54 5 30 0.5534 1983/10/16 67 8 38 0.5635 1985/12/4 75 11 43 0.5736 1991/12/3 62 175 119 0.6837 1992/7/28 58 50 54 1.0838 1993/1/17 39 180 12 77 0.4339 1995/11/15 47 84 10 47 0.5640 1998/8/30 16 50 0 22 0.4441 1999/4/5 0 75 18 31 0.4142 1970/9/14 0 76 38 0.5043 1971/3/16 0 83 42 0.5044 1972/10/28 57 0 107 55 0.5145 1973/12/1 13 52 105 5 44 0.4246 1974/12/25 0 96 51 49 0.5147 1975/4/21 6 0 123 54 46 0.3748 1977/2/28 3 0 108 37 0.3449 1984/3/29 64 2 33 0.5250 1989/6/2 0 13 0 4 0.3351 1992/11/25 6 30 13 16 0.5452 1998/10/31 31 31 0 21 0.6753 1972/11/26 0 46 0 124 43 0.3454 1973/2/25 0 28 0 45 18 0.4155 1974/6/22 8 7 38 100 38 0.3856 1975/3/31 0 0 115 38 0.3357 1977/12/5 21 2 81 35 0.4358 1978/1/17 27 3 97 42 0.4459 1979/12/8 15 0 91 35 0.3960 1980/4/22 0 0 73 24 0.3361 1981/10/23 8 57 33 0.5762 1984/3/26 20 71 46 0.6463 1985/4/1 27 45 36 0.8064 1986/11/2 10 40 25 0.6365 1992/12/21 0 12 30 14 0.4766 1993/9/17 0 0 100 33 0.3367 1994/11/20 23 47 35 0.7468 1995/1/27 11 67 39 0.5869 1996/3/4 4 62 33 0.5370 1997/4/6 7 72 40 0.5571 1998/1/14 0 52 26 0.5072 1999/5/6 39 68 54 0.79
0.52
AverageArea
ReductionFactor
Point Rainfall (mm)
Average
No DateHutaraya
Gugur Baligi
Baligi-1
Paguruan

Final Report (Supporting_PreF/S) Part 15 Hydrological Analysis for Simanggo-2 HEPP
JICA Project for the Master Plan Study of T-26 August, 2011 Hydropower Development in Indonesia
Table 26 Annual Maximum 1-Day Rainfall around Simanggo River Basin
Year Hutaraya Gugur Balige Paguruan
1969 - - -1970 - - -1971 91 - -1972 65 79 -1973 45 66 451974 - 72 1001975 62 62 1151976 - 57 801977 78 88 811978 67 98 971979 76 84 911980 61 98 731981 - - 571982 - 80 -1983 - 67 -1984 - - -1985 - - 451986 - - 401987 - 46 461988 - 51 -1989 - 104 -1990 - 200 -1991 - 175 -1992 - - -1993 77 180 1001994 - 74 471995 - 84 671996 - - 621997 - - 721998 - - 521999 - - 682000 - - -2001 - - 112
Count 9 19 20

Final Report (Supporting_PreF/S) Part 15 Hydrological Analysis for Simanggo-2 HEPP
JICA Project for the Master Plan Study of T-27 August, 2011 Hydropower Development in Indonesia
Table 27 Calculation of Probable Maximum Precipitation (PMP)
Annual Maximun 1-Day Precipitation at Paguruan Station
Unit: mmYear Rainfall Max = 115 mm (1975)
1969 -1970 - n = 201971 - Xn = 72.5 mm1972 - Sn = 23.7 mm1973 45 Xn-m = 70.3 mm1974 100 Sn-m = 22.1 mm1975 1151976 80 Xn-m / Xn = 0.971977 81 Sn-m / Sn = 0.931978 971979 91 Adjustment for Maximum Observed Event1980 73 fX1 = 101%1981 57 fS1 = 102%1982 -1983 - Adjustment for Sample Size1984 - fX2 = 102%1985 45 fS2 = 108%1986 401987 46 Statistical Coefficient1988 - Km = 16.51989 -1990 - Adjustment for Fixed Observational Time Intervals1991 - f0 = 113%1992 -1993 100 Computation of PMP1994 47 Xn = fX1 * fX2 * Xn
1995 67 = 74.7 mm1996 62 Sn = fS1 * fS2 * Sn
1997 72 = 26.1 mm1998 52 Xm = Xn + Km * Sn
1999 68 = 505.9 mm2000 - PMP = f0 * Xm
2001 112 = 571.7 mm
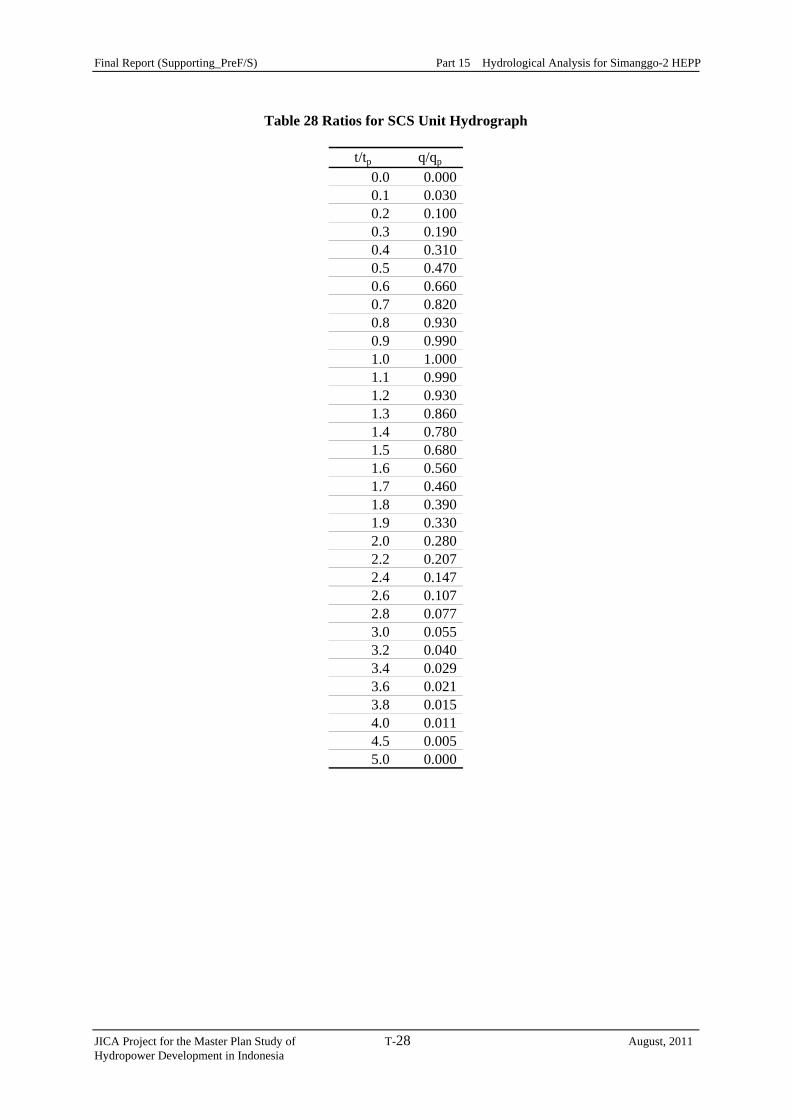
Final Report (Supporting_PreF/S) Part 15 Hydrological Analysis for Simanggo-2 HEPP
JICA Project for the Master Plan Study of T-28 August, 2011 Hydropower Development in Indonesia
Table 28 Ratios for SCS Unit Hydrograph
t/tp q/qp
0.0 0.0000.1 0.0300.2 0.1000.3 0.1900.4 0.3100.5 0.4700.6 0.6600.7 0.8200.8 0.9300.9 0.9901.0 1.0001.1 0.9901.2 0.9301.3 0.8601.4 0.7801.5 0.6801.6 0.5601.7 0.4601.8 0.3901.9 0.3302.0 0.2802.2 0.2072.4 0.1472.6 0.1072.8 0.0773.0 0.0553.2 0.0403.4 0.0293.6 0.0213.8 0.0154.0 0.0114.5 0.0055.0 0.000
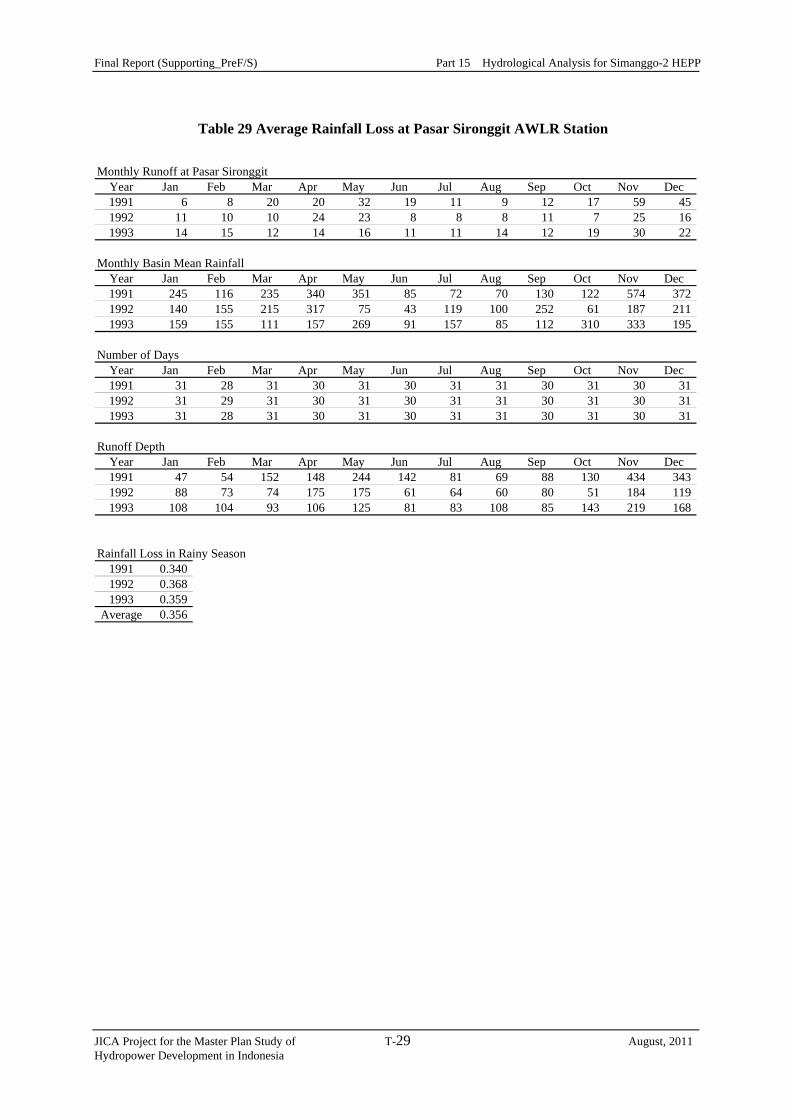
Final Report (Supporting_PreF/S) Part 15 Hydrological Analysis for Simanggo-2 HEPP
JICA Project for the Master Plan Study of T-29 August, 2011 Hydropower Development in Indonesia
Table 29 Average Rainfall Loss at Pasar Sironggit AWLR Station
Monthly Runoff at Pasar Sironggit
Year Jan Feb Mar Apr May Jun Jul Aug Sep Oct Nov Dec1991 6 8 20 20 32 19 11 9 12 17 59 451992 11 10 10 24 23 8 8 8 11 7 25 161993 14 15 12 14 16 11 11 14 12 19 30 22
Monthly Basin Mean RainfallYear Jan Feb Mar Apr May Jun Jul Aug Sep Oct Nov Dec1991 245 116 235 340 351 85 72 70 130 122 574 3721992 140 155 215 317 75 43 119 100 252 61 187 2111993 159 155 111 157 269 91 157 85 112 310 333 195
Number of DaysYear Jan Feb Mar Apr May Jun Jul Aug Sep Oct Nov Dec1991 31 28 31 30 31 30 31 31 30 31 30 311992 31 29 31 30 31 30 31 31 30 31 30 311993 31 28 31 30 31 30 31 31 30 31 30 31
Runoff DepthYear Jan Feb Mar Apr May Jun Jul Aug Sep Oct Nov Dec1991 47 54 152 148 244 142 81 69 88 130 434 3431992 88 73 74 175 175 61 64 60 80 51 184 1191993 108 104 93 106 125 81 83 108 85 143 219 168
Rainfall Loss in Rainy Season1991 0.3401992 0.3681993 0.359
Average 0.356
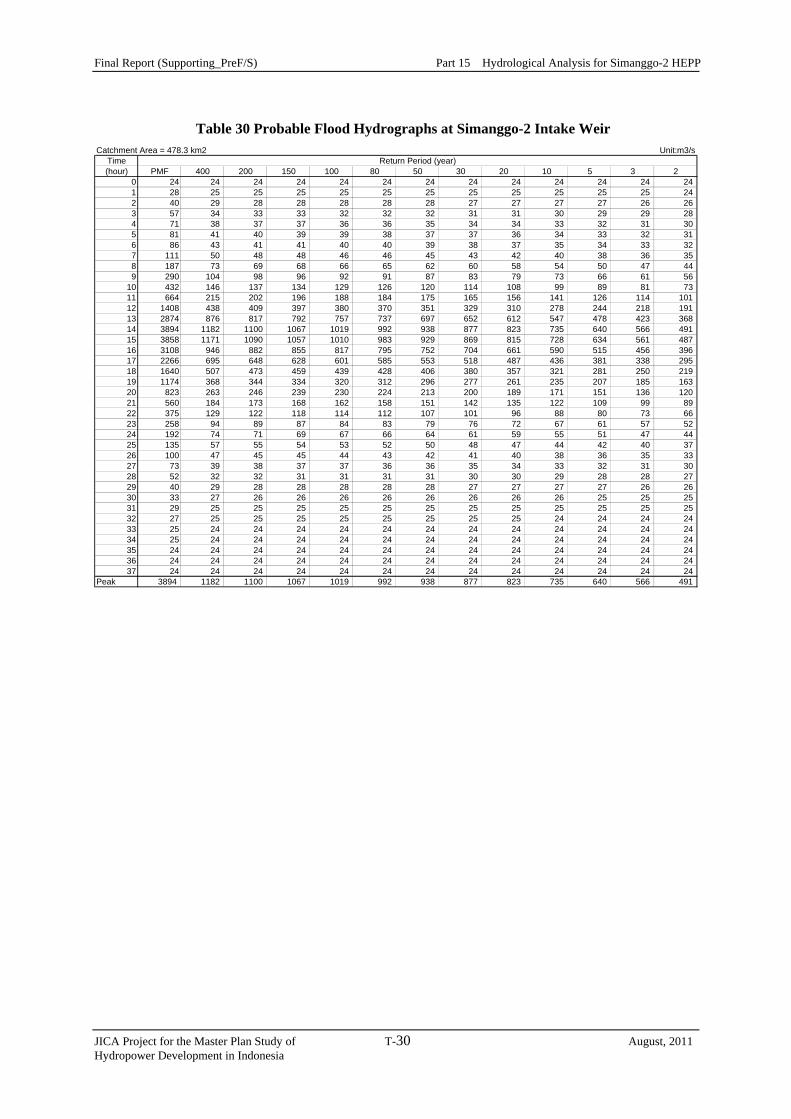
Final Report (Supporting_PreF/S) Part 15 Hydrological Analysis for Simanggo-2 HEPP
JICA Project for the Master Plan Study of T-30 August, 2011 Hydropower Development in Indonesia
Table 30 Probable Flood Hydrographs at Simanggo-2 Intake Weir
Catchment Area = 478.3 km2 Unit:m3/sTime(hour) PMF 400 200 150 100 80 50 30 20 10 5 3 2
0 24 24 24 24 24 24 24 24 24 24 24 24 241 28 25 25 25 25 25 25 25 25 25 25 25 242 40 29 28 28 28 28 28 27 27 27 27 26 263 57 34 33 33 32 32 32 31 31 30 29 29 284 71 38 37 37 36 36 35 34 34 33 32 31 305 81 41 40 39 39 38 37 37 36 34 33 32 316 86 43 41 41 40 40 39 38 37 35 34 33 327 111 50 48 48 46 46 45 43 42 40 38 36 358 187 73 69 68 66 65 62 60 58 54 50 47 449 290 104 98 96 92 91 87 83 79 73 66 61 56
10 432 146 137 134 129 126 120 114 108 99 89 81 7311 664 215 202 196 188 184 175 165 156 141 126 114 10112 1408 438 409 397 380 370 351 329 310 278 244 218 19113 2874 876 817 792 757 737 697 652 612 547 478 423 36814 3894 1182 1100 1067 1019 992 938 877 823 735 640 566 49115 3858 1171 1090 1057 1010 983 929 869 815 728 634 561 48716 3108 946 882 855 817 795 752 704 661 590 515 456 39617 2266 695 648 628 601 585 553 518 487 436 381 338 29518 1640 507 473 459 439 428 406 380 357 321 281 250 21919 1174 368 344 334 320 312 296 277 261 235 207 185 16320 823 263 246 239 230 224 213 200 189 171 151 136 12021 560 184 173 168 162 158 151 142 135 122 109 99 8922 375 129 122 118 114 112 107 101 96 88 80 73 6623 258 94 89 87 84 83 79 76 72 67 61 57 5224 192 74 71 69 67 66 64 61 59 55 51 47 4425 135 57 55 54 53 52 50 48 47 44 42 40 3726 100 47 45 45 44 43 42 41 40 38 36 35 3327 73 39 38 37 37 36 36 35 34 33 32 31 3028 52 32 32 31 31 31 31 30 30 29 28 28 2729 40 29 28 28 28 28 28 27 27 27 27 26 2630 33 27 26 26 26 26 26 26 26 26 25 25 2531 29 25 25 25 25 25 25 25 25 25 25 25 2532 27 25 25 25 25 25 25 25 25 24 24 24 2433 25 24 24 24 24 24 24 24 24 24 24 24 2434 25 24 24 24 24 24 24 24 24 24 24 24 2435 24 24 24 24 24 24 24 24 24 24 24 24 2436 24 24 24 24 24 24 24 24 24 24 24 24 2437 24 24 24 24 24 24 24 24 24 24 24 24 24
Peak 3894 1182 1100 1067 1019 992 938 877 823 735 640 566 491
Return Period (year)
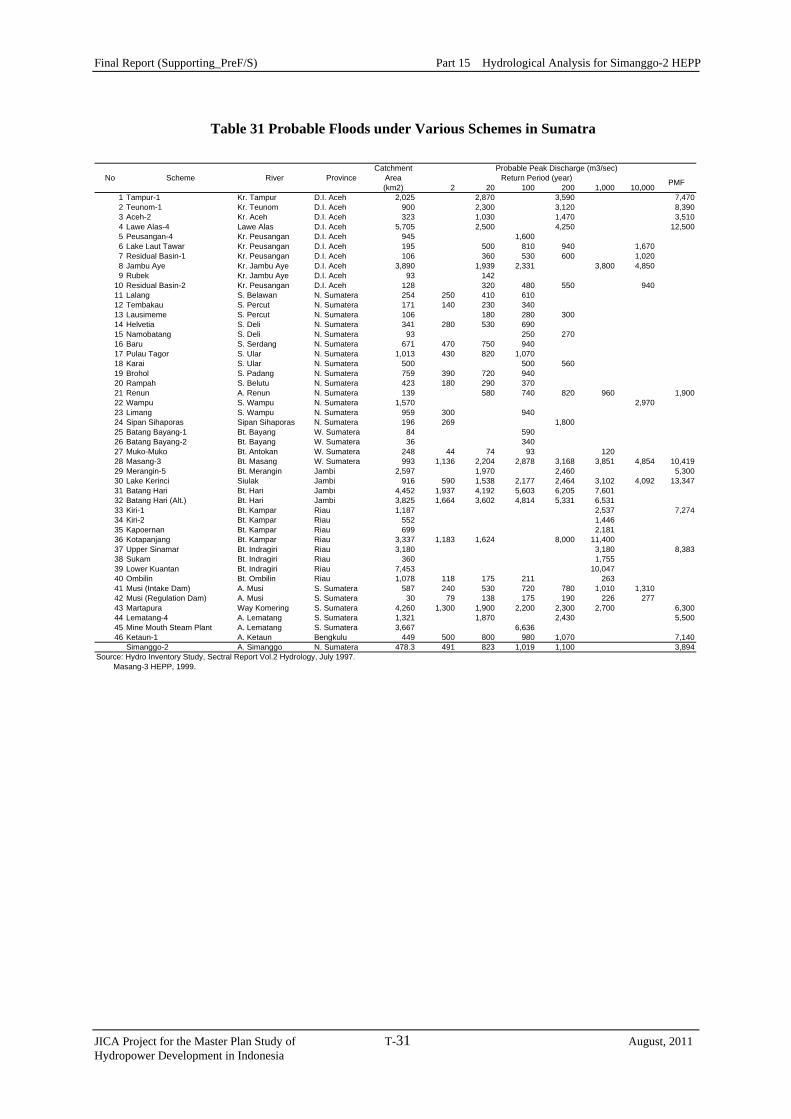
Final Report (Supporting_PreF/S) Part 15 Hydrological Analysis for Simanggo-2 HEPP
JICA Project for the Master Plan Study of T-31 August, 2011 Hydropower Development in Indonesia
Table 31 Probable Floods under Various Schemes in Sumatra
Catchment
No Scheme River Province Area(km2) 2 20 100 200 1,000 10,000
1 Tampur-1 Kr. Tampur D.I. Aceh 2,025 2,870 3,590 7,4702 Teunom-1 Kr. Teunom D.I. Aceh 900 2,300 3,120 8,3903 Aceh-2 Kr. Aceh D.I. Aceh 323 1,030 1,470 3,5104 Lawe Alas-4 Lawe Alas D.I. Aceh 5,705 2,500 4,250 12,5005 Peusangan-4 Kr. Peusangan D.I. Aceh 945 1,6006 Lake Laut Tawar Kr. Peusangan D.I. Aceh 195 500 810 940 1,6707 Residual Basin-1 Kr. Peusangan D.I. Aceh 106 360 530 600 1,0208 Jambu Aye Kr. Jambu Aye D.I. Aceh 3,890 1,939 2,331 3,800 4,8509 Rubek Kr. Jambu Aye D.I. Aceh 93 142
10 Residual Basin-2 Kr. Peusangan D.I. Aceh 128 320 480 550 94011 Lalang S. Belawan N. Sumatera 254 250 410 61012 Tembakau S. Percut N. Sumatera 171 140 230 34013 Lausimeme S. Percut N. Sumatera 106 180 280 30014 Helvetia S. Deli N. Sumatera 341 280 530 69015 Namobatang S. Deli N. Sumatera 93 250 27016 Baru S. Serdang N. Sumatera 671 470 750 94017 Pulau Tagor S. Ular N. Sumatera 1,013 430 820 1,07018 Karai S. Ular N. Sumatera 500 500 56019 Brohol S. Padang N. Sumatera 759 390 720 94020 Rampah S. Belutu N. Sumatera 423 180 290 37021 Renun A. Renun N. Sumatera 139 580 740 820 960 1,90022 Wampu S. Wampu N. Sumatera 1,570 2,97023 Limang S. Wampu N. Sumatera 959 300 94024 Sipan Sihaporas Sipan Sihaporas N. Sumatera 196 269 1,80025 Batang Bayang-1 Bt. Bayang W. Sumatera 84 59026 Batang Bayang-2 Bt. Bayang W. Sumatera 36 34027 Muko-Muko Bt. Antokan W. Sumatera 248 44 74 93 12028 Masang-3 Bt. Masang W. Sumatera 993 1,136 2,204 2,878 3,168 3,851 4,854 10,41929 Merangin-5 Bt. Merangin Jambi 2,597 1,970 2,460 5,30030 Lake Kerinci Siulak Jambi 916 590 1,538 2,177 2,464 3,102 4,092 13,34731 Batang Hari Bt. Hari Jambi 4,452 1,937 4,192 5,603 6,205 7,60132 Batang Hari (Alt.) Bt. Hari Jambi 3,825 1,664 3,602 4,814 5,331 6,53133 Kiri-1 Bt. Kampar Riau 1,187 2,537 7,27434 Kiri-2 Bt. Kampar Riau 552 1,44635 Kapoernan Bt. Kampar Riau 699 2,18136 Kotapanjang Bt. Kampar Riau 3,337 1,183 1,624 8,000 11,40037 Upper Sinamar Bt. Indragiri Riau 3,180 3,180 8,38338 Sukam Bt. Indragiri Riau 360 1,75539 Lower Kuantan Bt. Indragiri Riau 7,453 10,04740 Ombilin Bt. Ombilin Riau 1,078 118 175 211 26341 Musi (Intake Dam) A. Musi S. Sumatera 587 240 530 720 780 1,010 1,31042 Musi (Regulation Dam) A. Musi S. Sumatera 30 79 138 175 190 226 27743 Martapura Way Komering S. Sumatera 4,260 1,300 1,900 2,200 2,300 2,700 6,30044 Lematang-4 A. Lematang S. Sumatera 1,321 1,870 2,430 5,50045 Mine Mouth Steam Plant A. Lematang S. Sumatera 3,667 6,63646 Ketaun-1 A. Ketaun Bengkulu 449 500 800 980 1,070 7,140
Simanggo-2 A. Simanggo N. Sumatera 478.3 491 823 1,019 1,100 3,894Source: Hydro Inventory Study, Sectral Report Vol.2 Hydrology, July 1997. Masang-3 HEPP, 1999.
Probable Peak Discharge (m3/sec)Return Period (year) PMF
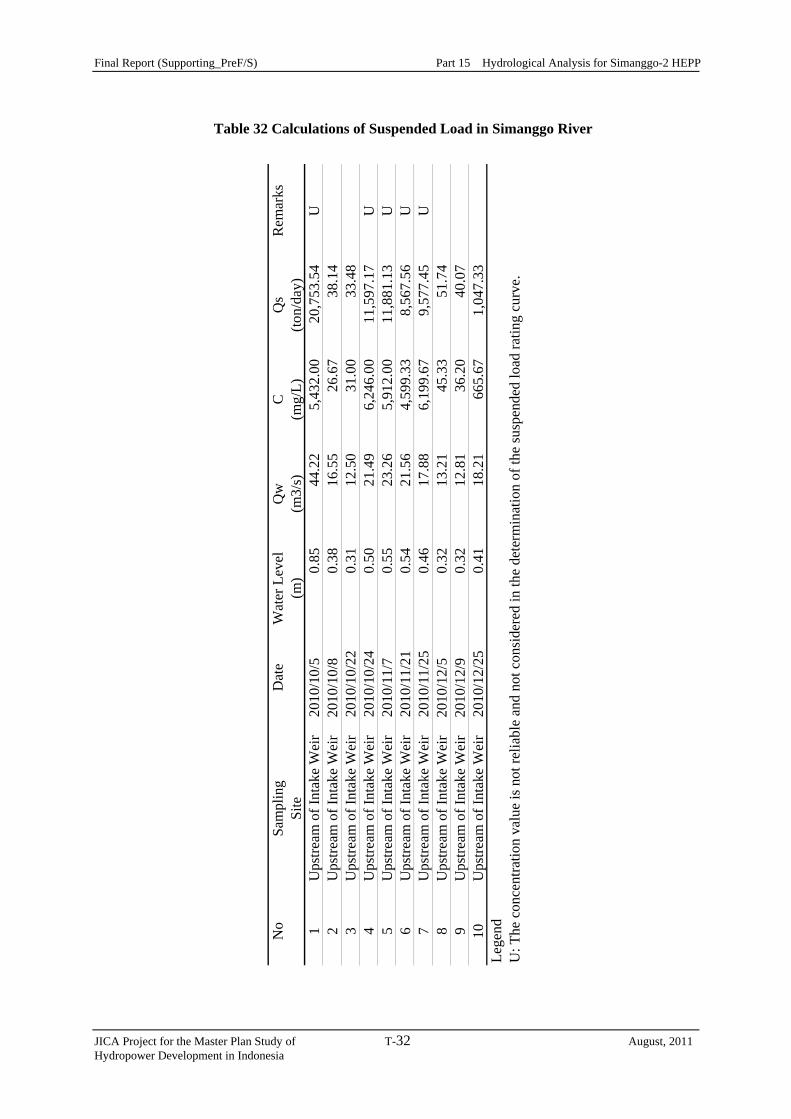
Final Report (Supporting_PreF/S) Part 15 Hydrological Analysis for Simanggo-2 HEPP
JICA Project for the Master Plan Study of T-32 August, 2011 Hydropower Development in Indonesia
Table 32 Calculations of Suspended Load in Simanggo River
No
Sam
plin
gD
ate
Wat
er L
evel
Qw
CQ
sR
emar
ksSi
te(m
)(m
3/s)
(mg/
L)(to
n/da
y)1
Ups
tream
of I
ntak
e W
eir
2010
/10/
50.
8544
.22
5,43
2.00
20,7
53.5
4U
2U
pstre
am o
f Int
ake
Wei
r20
10/1
0/8
0.38
16.5
526
.67
38.1
43
Ups
tream
of I
ntak
e W
eir
2010
/10/
220.
3112
.50
31.0
033
.48
4U
pstre
am o
f Int
ake
Wei
r20
10/1
0/24
0.50
21.4
96,
246.
0011
,597
.17
U5
Ups
tream
of I
ntak
e W
eir
2010
/11/
70.
5523
.26
5,91
2.00
11,8
81.1
3U
6U
pstre
am o
f Int
ake
Wei
r20
10/1
1/21
0.54
21.5
64,
599.
338,
567.
56U
7U
pstre
am o
f Int
ake
Wei
r20
10/1
1/25
0.46
17.8
86,
199.
679,
577.
45U
8U
pstre
am o
f Int
ake
Wei
r20
10/1
2/5
0.32
13.2
145
.33
51.7
49
Ups
tream
of I
ntak
e W
eir
2010
/12/
90.
3212
.81
36.2
040
.07
10U
pstre
am o
f Int
ake
Wei
r20
10/1
2/25
0.41
18.2
166
5.67
1,04
7.33
Lege
ndU
: The
con
cent
ratio
n va
lue
is n
ot re
liabl
e an
d no
t con
side
red
in th
e de
term
inat
ion
of th
e su
spen
ded
load
ratin
g cu
rve.

Final Report (Supporting_PreF/S) Part 15 Hydrological Analysis for Simanggo-2 HEPP
JICA Project for the Master Plan Study of T-33 August, 2011 Hydropower Development in Indonesia
Table 33 Water Quality Analysis of Simanggo River
No Water Quality Parameter Unit Sample-1 Sample-2 Sample-3
Date 2010/10/24 2010/11/25 2010/12/25Weather Clear Clear Cloud
1 pH 6.51 7.34 5.282 Temperature ℃ 25.2 25.4 24.83 Total Hardness mg/l 7.21 9.28 12.44 Temporary Hardness mg/l 1.03 7.22 6.195 Suspended Matter mg/lit 37.7 35.5 1236 Total Solid mg/lit 222 44.5 1267 Ignition Residue mg/lit 0.1 0.08 0.088 Permanganate Value as O2 mg/lit 5.51 13.71 2.939 Carbonates as CaCO3 mg/lit 0 0 0
10 Bicarbonates as CaCO3 mg/lit 10.08 26.88 24.611 Calcium (Ca) mg/lit 2.08 2.49 2.5812 Magnesium (Mg) mg/lit 0.49 0.74 1.4413 Sodium (Na) mg/lit 4.29 8.22 5.2414 Potassium (K) mg/lit 3.56 1.31 3.6715 Iron (Fe) mg/lit 1.09 0.67 0.516 Manganese (Mn) mg/lit 0.07 <0.02 <0.0217 Copper (Cu) mg/lit <0.001 <0.001 0.02118 Turbidity NTU 5.3 5.3 6.319 Color Pt-Co-Unit 25 20 2020 Electric Conductivity µ/Cm 53.5 50.6 54.521 Aluminum (Al) mg/lit 1.14 0.02 0.3422 Silica (SiO2) mg/lit 18.18 53.88 69.923 Lead (Pb) mg/lit <0.001 <0.001 <0.00124 Arsenic (As) mg/lit 0.0028 0.0014 0.00225 Ammonium (NH4) mg/lit 0.47 0.596 0.0226 Albuminoid mg/lit <0.1 <0.1 <0.1 27 Nitrites (NO2) mg/lit 0.004 0.002 <0.000528 Nitrates (NO3) mg/lit 14.08 0.722 0.86329 Sulfities (SO3) mg/lit 0.072 0.072 <0.0230 Sulfates (SO4) mg/lit 7.09 3.07 1.1531 Chlorides (Cl) mg/lit 11.39 3.63 3.6332 Phosphates (PO4) mg/lit <0.002 0.23 0.1433 Oxygen (O2) mg/lit 7.15 7.31 7.2634 Carbon Dioxide (CO2) mg/lit 0 0.87 3.0335 P-value as CaCO3 mg/lit <0.002 0.242 0.13836 M-Value as CaCO3 mg/lit 21.6 21.8 23.2
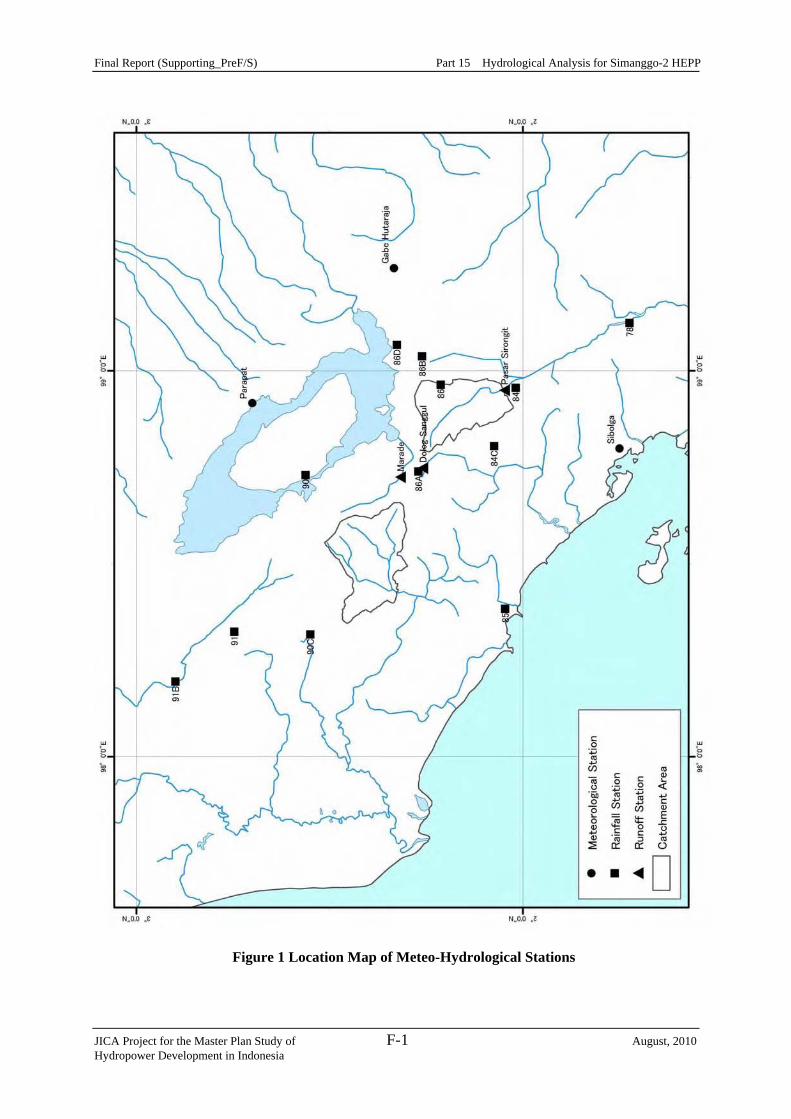
Final Report (Supporting_PreF/S) Part 15 Hydrological Analysis for Simanggo-2 HEPP
JICA Project for the Master Plan Study of F-1 August, 2010 Hydropower Development in Indonesia
Figure 1 Location Map of Meteo-Hydrological Stations
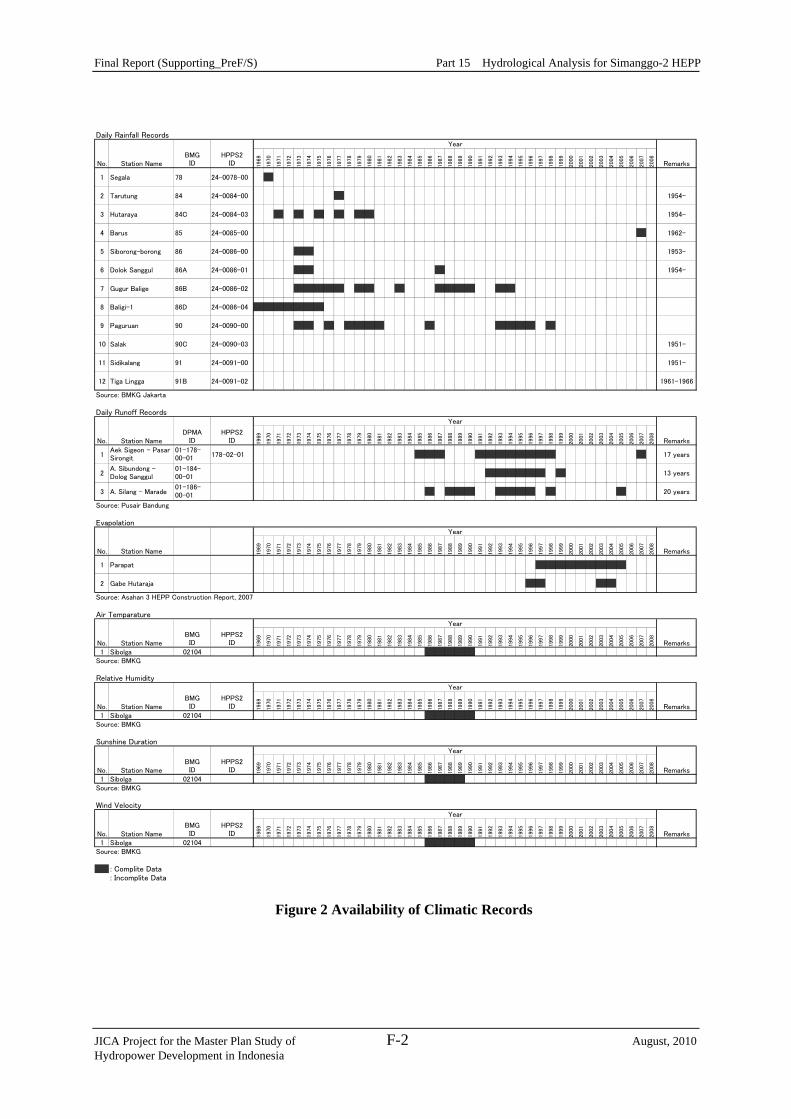
Final Report (Supporting_PreF/S) Part 15 Hydrological Analysis for Simanggo-2 HEPP
JICA Project for the Master Plan Study of F-2 August, 2010 Hydropower Development in Indonesia
Daily Rainfall Records
1969
1970
1971
1972
1973
1974
1975
1976
1977
1978
1979
1980
1981
1982
1983
1984
1985
1986
1987
1988
1989
1990
1991
1992
1993
1994
1995
1996
1997
1998
1999
2000
2001
2002
2003
2004
2005
2006
2007
2008
1 Segala 78 24-0078-00
2 Tarutung 84 24-0084-00 1954-
3 Hutaraya 84C 24-0084-03 1954-
4 Barus 85 24-0085-00 1962-
5 Siborong-borong 86 24-0086-00 1953-
6 Dolok Sanggul 86A 24-0086-01 1954-
7 Gugur Balige 86B 24-0086-02
8 Baligi-1 86D 24-0086-04
9 Paguruan 90 24-0090-00
10 Salak 90C 24-0090-03 1951-
11 Sidikalang 91 24-0091-00 1951-
12 Tiga Lingga 91B 24-0091-02 1961-1966
Source: BMKG Jakarta
Daily Runoff Records
1969
1970
1971
1972
1973
1974
1975
1976
1977
1978
1979
1980
1981
1982
1983
1984
1985
1986
1987
1988
1989
1990
1991
1992
1993
1994
1995
1996
1997
1998
1999
2000
2001
2002
2003
2004
2005
2006
2007
2008
1 178-02-01 17 years
2 13 years
3 A. Silang - Marade 20 years
Source: Pusair Bandung
Evapolation
1969
1970
1971
1972
1973
1974
1975
1976
1977
1978
1979
1980
1981
1982
1983
1984
1985
1986
1987
1988
1989
1990
1991
1992
1993
1994
1995
1996
1997
1998
1999
2000
2001
2002
2003
2004
2005
2006
2007
2008
1 Parapat
2 Gabe Hutaraja
Source: Asahan 3 HEPP Construction Report, 2007
Air Temparature
1969
1970
1971
1972
1973
1974
1975
1976
1977
1978
1979
1980
1981
1982
1983
1984
1985
1986
1987
1988
1989
1990
1991
1992
1993
1994
1995
1996
1997
1998
1999
2000
2001
2002
2003
2004
2005
2006
2007
2008
1 Sibolga 02104Source: BMKG
Relative Humidity
1969
1970
1971
1972
1973
1974
1975
1976
1977
1978
1979
1980
1981
1982
1983
1984
1985
1986
1987
1988
1989
1990
1991
1992
1993
1994
1995
1996
1997
1998
1999
2000
2001
2002
2003
2004
2005
2006
2007
2008
1 Sibolga 02104Source: BMKG
Sunshine Duration
196
9
197
0
197
1
197
2
197
3
197
4
197
5
197
6
197
7
197
8
197
9
198
0
198
1
198
2
198
3
198
4
198
5
198
6
198
7
198
8
198
9
199
0
199
1
199
2
199
3
199
4
199
5
199
6
199
7
199
8
199
9
200
0
200
1
200
2
200
3
200
4
200
5
200
6
200
7
200
8
1 Sibolga 02104Source: BMKG
Wind Velocity
196
9
197
0
197
1
197
2
197
3
197
4
197
5
197
6
197
7
197
8
197
9
198
0
198
1
198
2
198
3
198
4
198
5
198
6
198
7
198
8
198
9
199
0
199
1
199
2
199
3
199
4
199
5
199
6
199
7
199
8
199
9
200
0
200
1
200
2
200
3
200
4
200
5
200
6
200
7
200
8
1 Sibolga 02104Source: BMKG
: Complite Data: Incomplite Data
01-184-00-01
01-186-00-01
Year
RemarksNo. Station NameBMGID
HPPS2ID
No. Station NameBMGID
HPPS2ID
Remarks
Year
Remarks
Year
Remarks
Year
Remarks
No. Station NameBMGID
HPPS2ID
No. Station NameBMGID
HPPS2ID
Remarks
No.DPMA
IDStation Name
Year
Remarks
HPPS2ID
HPPS2ID
Station NameBMGIDNo.
Year
No. Station Name
Year
Aek Sigeon - PasarSirongit
A. Sibundong -Dolog Sanggul
01-178-00-01
Figure 2 Availability of Climatic Records
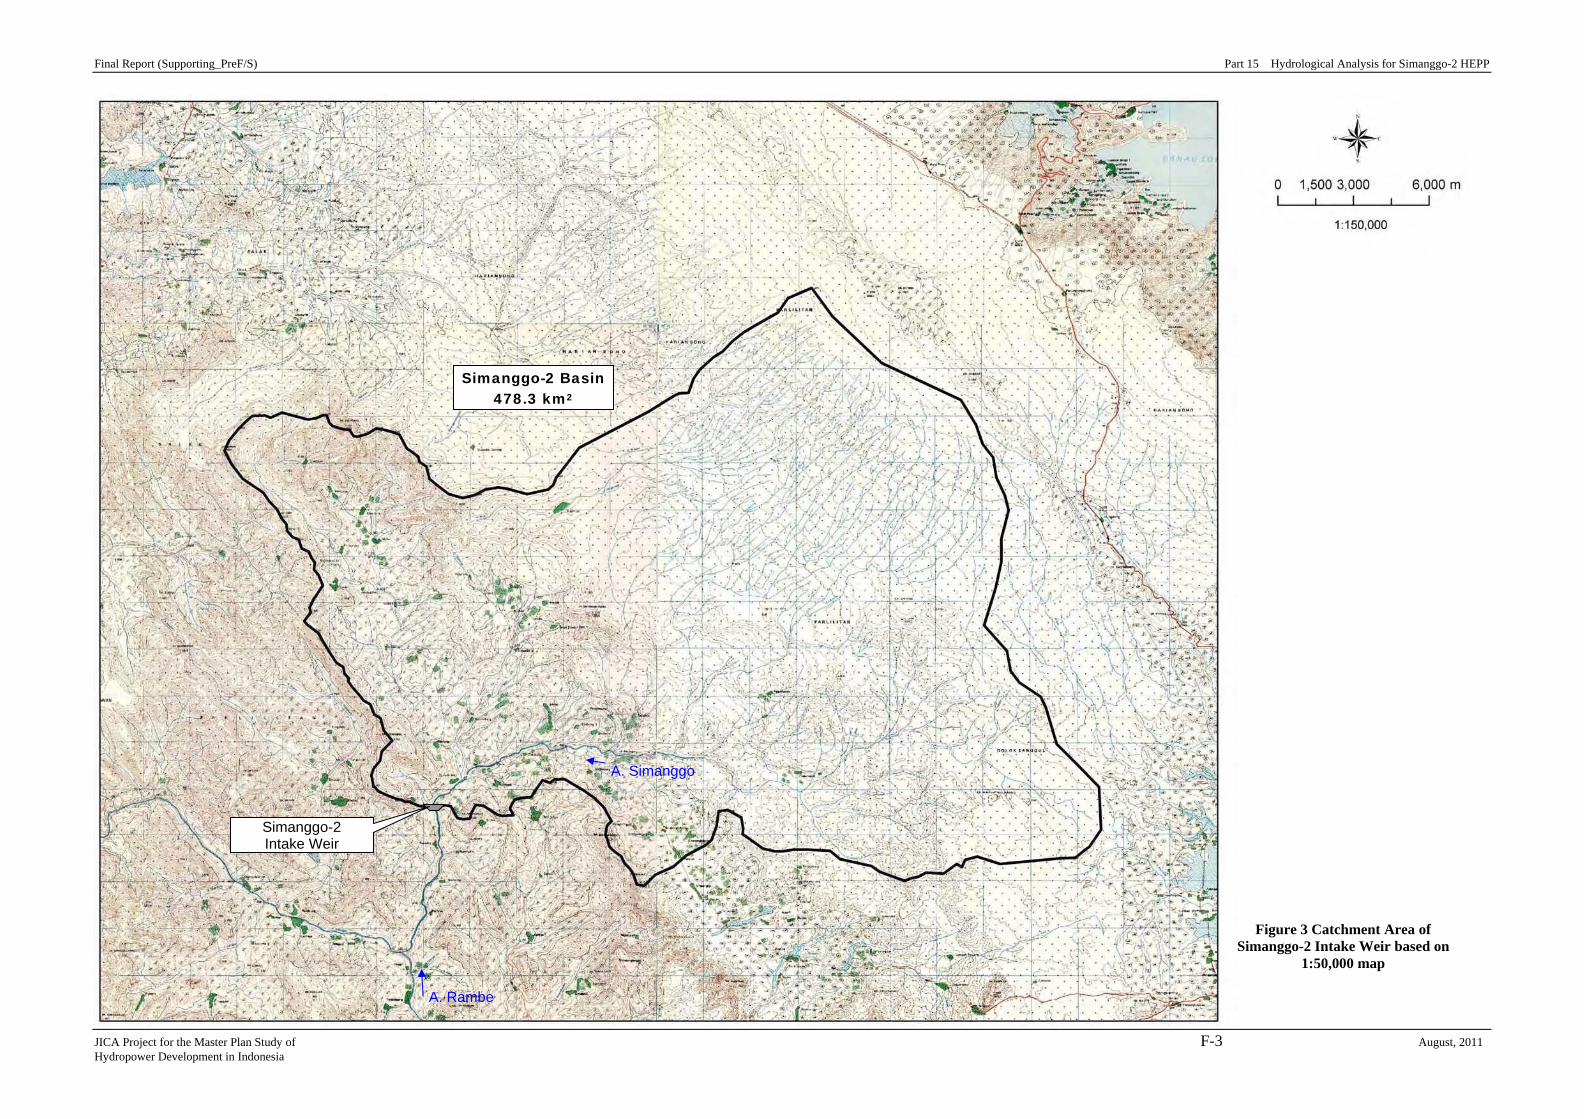
Final Report (Supporting_PreF/S) Part 15 Hydrological Analysis for Simanggo-2 HEPP
JICA Project for the Master Plan Study of F-3 August, 2011 Hydropower Development in Indonesia
Figure 3 Catchment Area of Simanggo-2 Intake Weir based on
1:50,000 map
A. Simanggo
Simanggo-2 Basin 478.3 km2
A. Rambe
Simanggo-2 Intake Weir
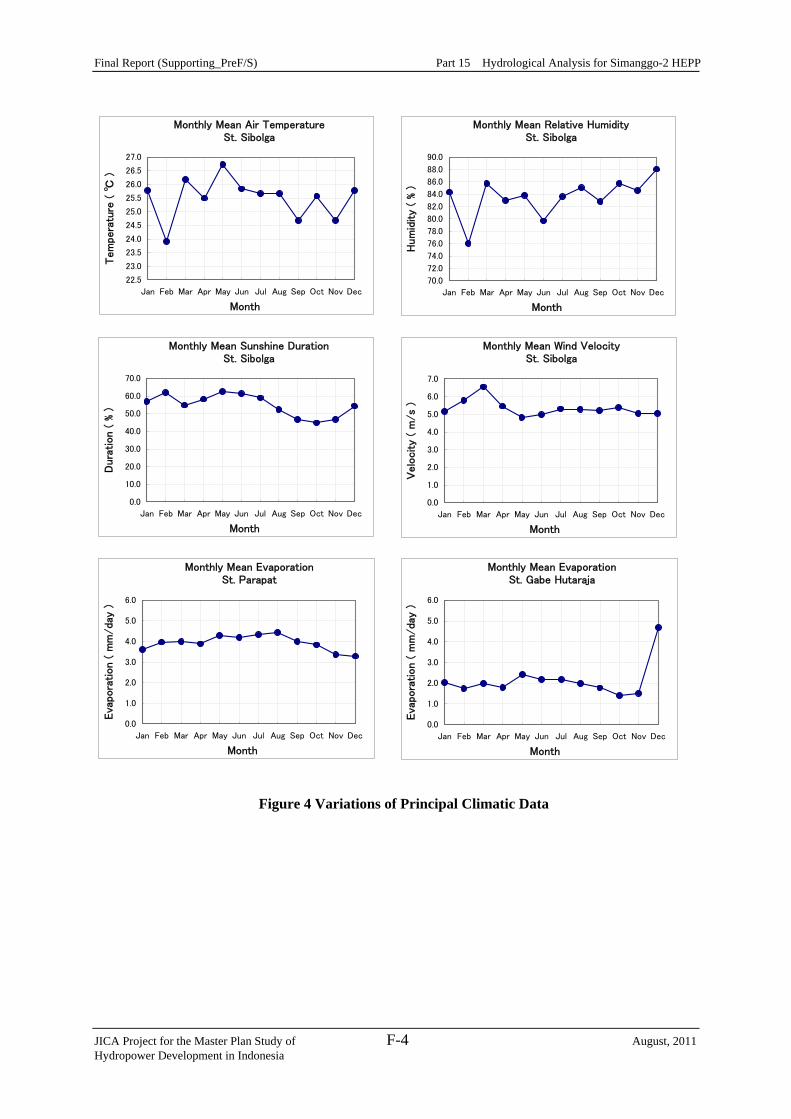
Final Report (Supporting_PreF/S) Part 15 Hydrological Analysis for Simanggo-2 HEPP
JICA Project for the Master Plan Study of F-4 August, 2011 Hydropower Development in Indonesia
Monthly Mean Air Temperature
St. Sibolga
22.5
23.0
23.5
24.0
24.5
25.0
25.5
26.0
26.5
27.0
Jan Feb Mar Apr May Jun Jul Aug Sep Oct Nov Dec
Month
Tem
pera
ture
( ℃
)
Monthly Mean Relative HumiditySt. Sibolga
70.0
72.0
74.0
76.0
78.0
80.0
82.0
84.0
86.0
88.0
90.0
Jan Feb Mar Apr May Jun Jul Aug Sep Oct Nov Dec
Month
Hum
idity
( % )
Monthly Mean Sunshine DurationSt. Sibolga
0.0
10.0
20.0
30.0
40.0
50.0
60.0
70.0
Jan Feb Mar Apr May Jun Jul Aug Sep Oct Nov Dec
Month
Dura
tion (
% )
Monthly Mean Wind VelocitySt. Sibolga
0.0
1.0
2.0
3.0
4.0
5.0
6.0
7.0
Jan Feb Mar Apr May Jun Jul Aug Sep Oct Nov Dec
Month
Velo
city
( m
/s
)
Monthly Mean EvaporationSt. Parapat
0.0
1.0
2.0
3.0
4.0
5.0
6.0
Jan Feb Mar Apr May Jun Jul Aug Sep Oct Nov Dec
Month
Eva
pora
tion (
mm
/day
)
Monthly Mean EvaporationSt. Gabe Hutaraja
0.0
1.0
2.0
3.0
4.0
5.0
6.0
Jan Feb Mar Apr May Jun Jul Aug Sep Oct Nov Dec
Month
Eva
pora
tion (
mm
/day
)
Figure 4 Variations of Principal Climatic Data
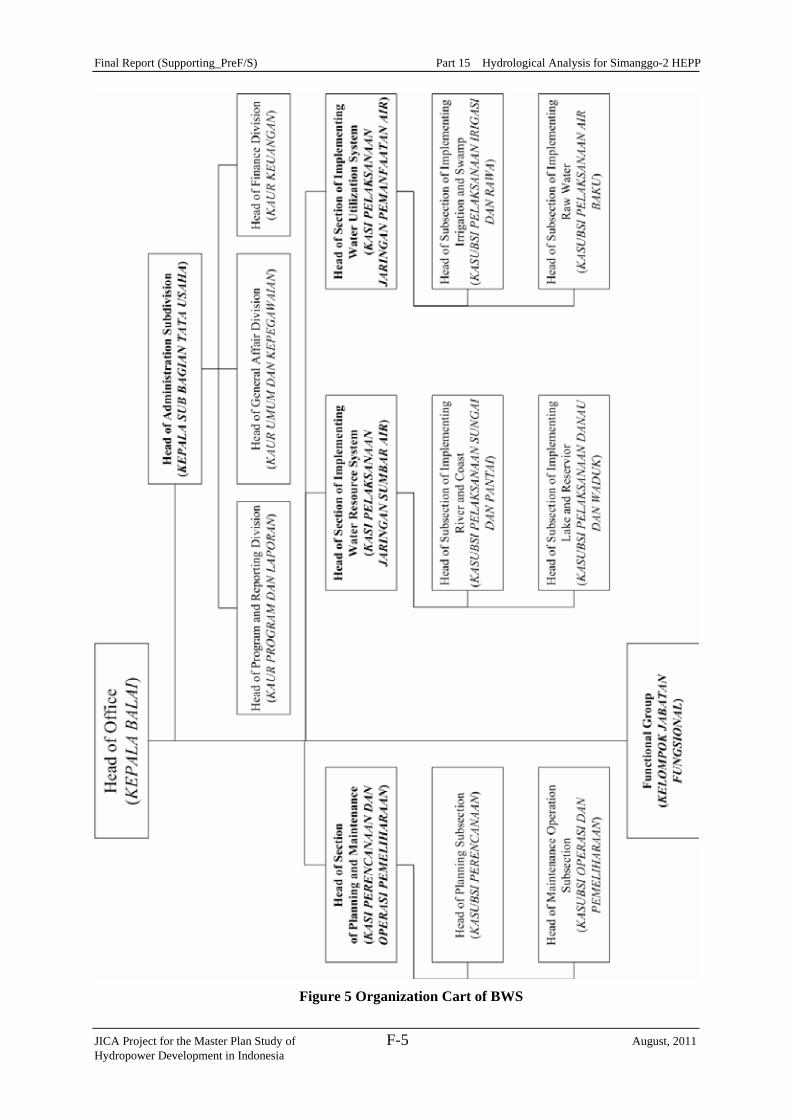
Final Report (Supporting_PreF/S) Part 15 Hydrological Analysis for Simanggo-2 HEPP
JICA Project for the Master Plan Study of F-5 August, 2011 Hydropower Development in Indonesia
Figure 5 Organization Cart of BWS
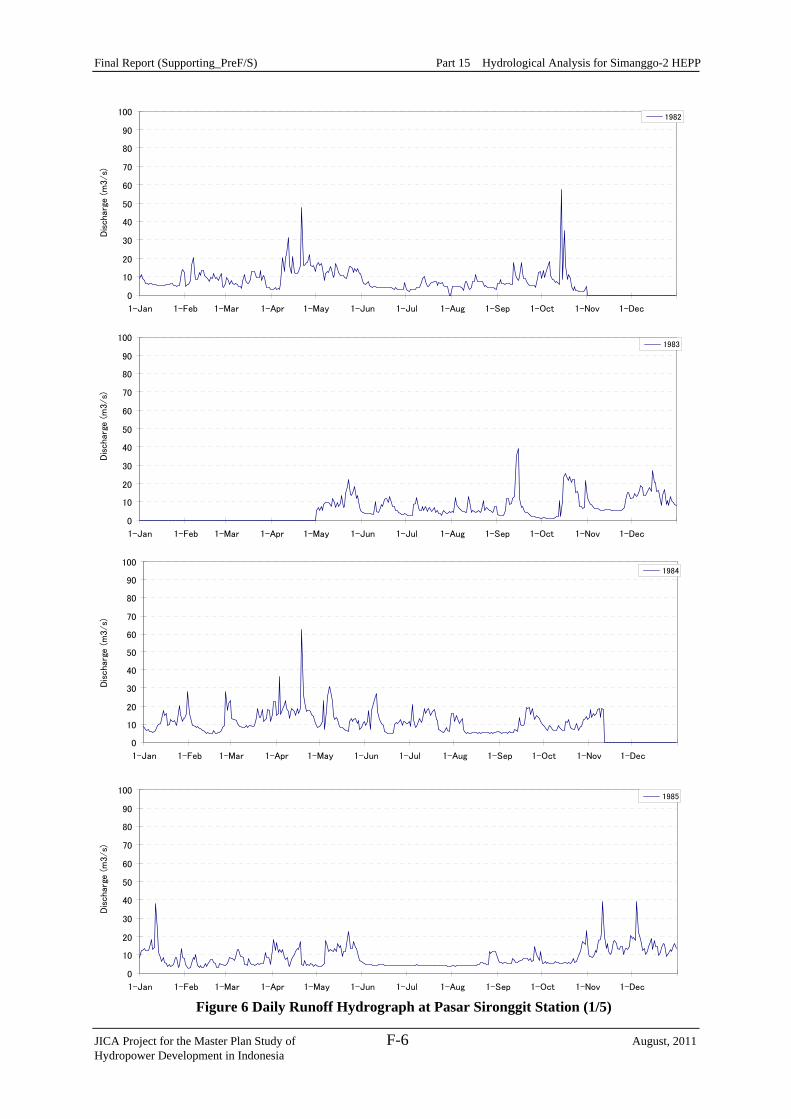
Final Report (Supporting_PreF/S) Part 15 Hydrological Analysis for Simanggo-2 HEPP
JICA Project for the Master Plan Study of F-6 August, 2011 Hydropower Development in Indonesia
0
10
20
30
40
50
60
70
80
90
100
1-Jan 1-Feb 1-Mar 1-Apr 1-May 1-Jun 1-Jul 1-Aug 1-Sep 1-Oct 1-Nov 1-Dec
Dis
cha
rge (
m3/s)
1982
0
10
20
30
40
50
60
70
80
90
100
1-Jan 1-Feb 1-Mar 1-Apr 1-May 1-Jun 1-Jul 1-Aug 1-Sep 1-Oct 1-Nov 1-Dec
Dis
charg
e (
m3/s)
1983
0
10
20
30
40
50
60
70
80
90
100
1-Jan 1-Feb 1-Mar 1-Apr 1-May 1-Jun 1-Jul 1-Aug 1-Sep 1-Oct 1-Nov 1-Dec
Dis
charg
e (
m3/s)
1984
0
10
20
30
40
50
60
70
80
90
100
1-Jan 1-Feb 1-Mar 1-Apr 1-May 1-Jun 1-Jul 1-Aug 1-Sep 1-Oct 1-Nov 1-Dec
Dis
charg
e (
m3/s)
1985
Figure 6 Daily Runoff Hydrograph at Pasar Sironggit Station (1/5)
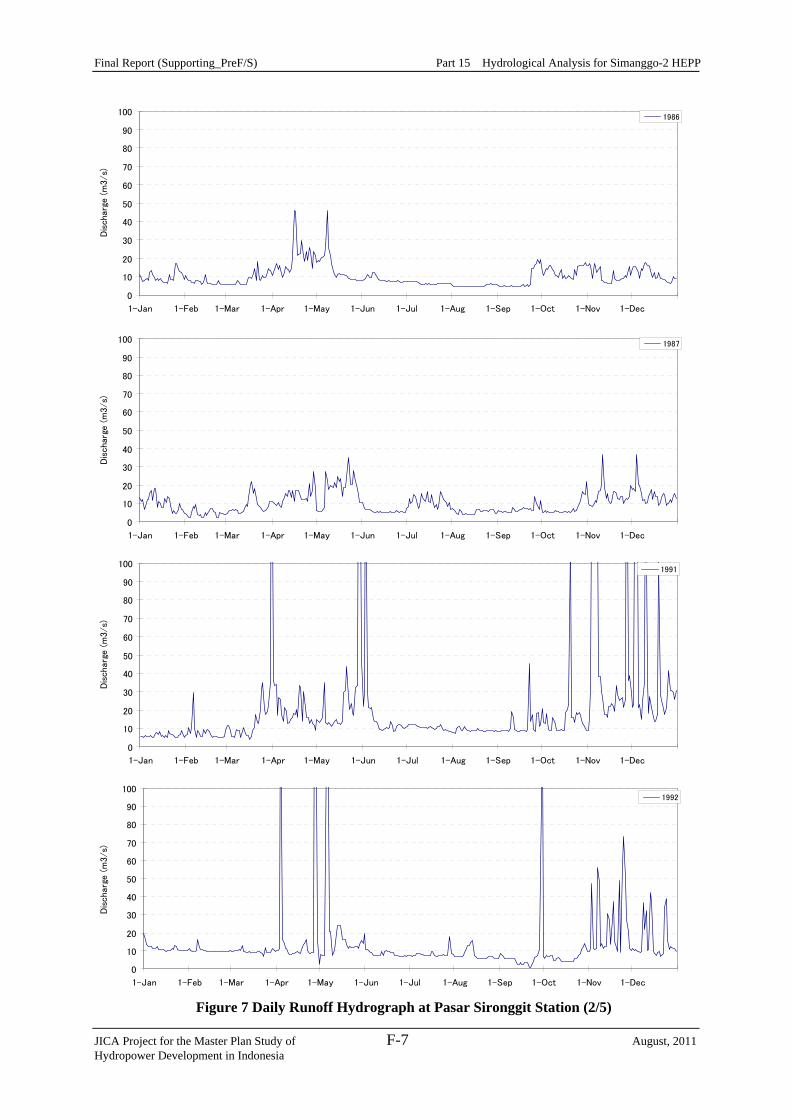
Final Report (Supporting_PreF/S) Part 15 Hydrological Analysis for Simanggo-2 HEPP
JICA Project for the Master Plan Study of F-7 August, 2011 Hydropower Development in Indonesia
0
10
20
30
40
50
60
70
80
90
100
1-Jan 1-Feb 1-Mar 1-Apr 1-May 1-Jun 1-Jul 1-Aug 1-Sep 1-Oct 1-Nov 1-Dec
Dis
cha
rge (
m3/s)
1986
0
10
20
30
40
50
60
70
80
90
100
1-Jan 1-Feb 1-Mar 1-Apr 1-May 1-Jun 1-Jul 1-Aug 1-Sep 1-Oct 1-Nov 1-Dec
Dis
cha
rge (
m3/s)
1987
0
10
20
30
40
50
60
70
80
90
100
1-Jan 1-Feb 1-Mar 1-Apr 1-May 1-Jun 1-Jul 1-Aug 1-Sep 1-Oct 1-Nov 1-Dec
Dis
charg
e (
m3/s)
1991
0
10
20
30
40
50
60
70
80
90
100
1-Jan 1-Feb 1-Mar 1-Apr 1-May 1-Jun 1-Jul 1-Aug 1-Sep 1-Oct 1-Nov 1-Dec
Dis
charg
e (
m3/s)
1992
Figure 7 Daily Runoff Hydrograph at Pasar Sironggit Station (2/5)
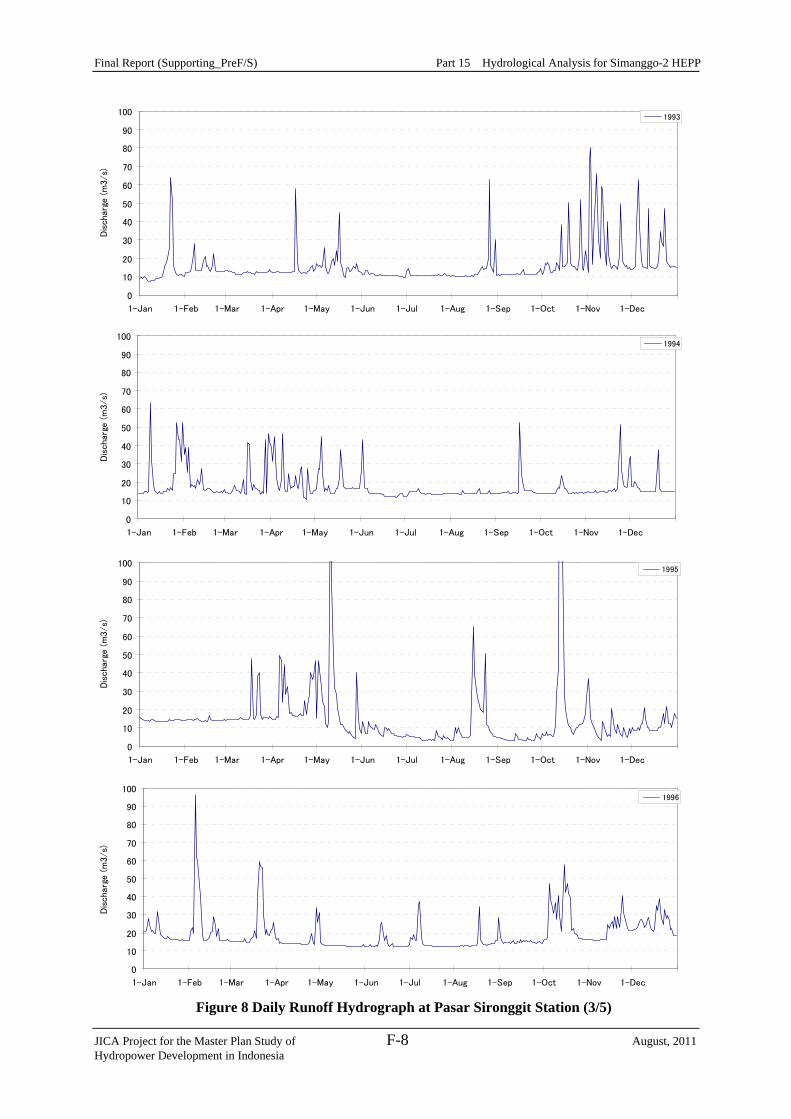
Final Report (Supporting_PreF/S) Part 15 Hydrological Analysis for Simanggo-2 HEPP
JICA Project for the Master Plan Study of F-8 August, 2011 Hydropower Development in Indonesia
0
10
20
30
40
50
60
70
80
90
100
1-Jan 1-Feb 1-Mar 1-Apr 1-May 1-Jun 1-Jul 1-Aug 1-Sep 1-Oct 1-Nov 1-Dec
Dis
cha
rge (
m3/s)
1993
0
10
20
30
40
50
60
70
80
90
100
1-Jan 1-Feb 1-Mar 1-Apr 1-May 1-Jun 1-Jul 1-Aug 1-Sep 1-Oct 1-Nov 1-Dec
Dis
charg
e (
m3/s)
1994
0
10
20
30
40
50
60
70
80
90
100
1-Jan 1-Feb 1-Mar 1-Apr 1-May 1-Jun 1-Jul 1-Aug 1-Sep 1-Oct 1-Nov 1-Dec
Dis
cha
rge (
m3/s)
1995
0
10
20
30
40
50
60
70
80
90
100
1-Jan 1-Feb 1-Mar 1-Apr 1-May 1-Jun 1-Jul 1-Aug 1-Sep 1-Oct 1-Nov 1-Dec
Dis
charg
e (
m3/s)
1996
Figure 8 Daily Runoff Hydrograph at Pasar Sironggit Station (3/5)
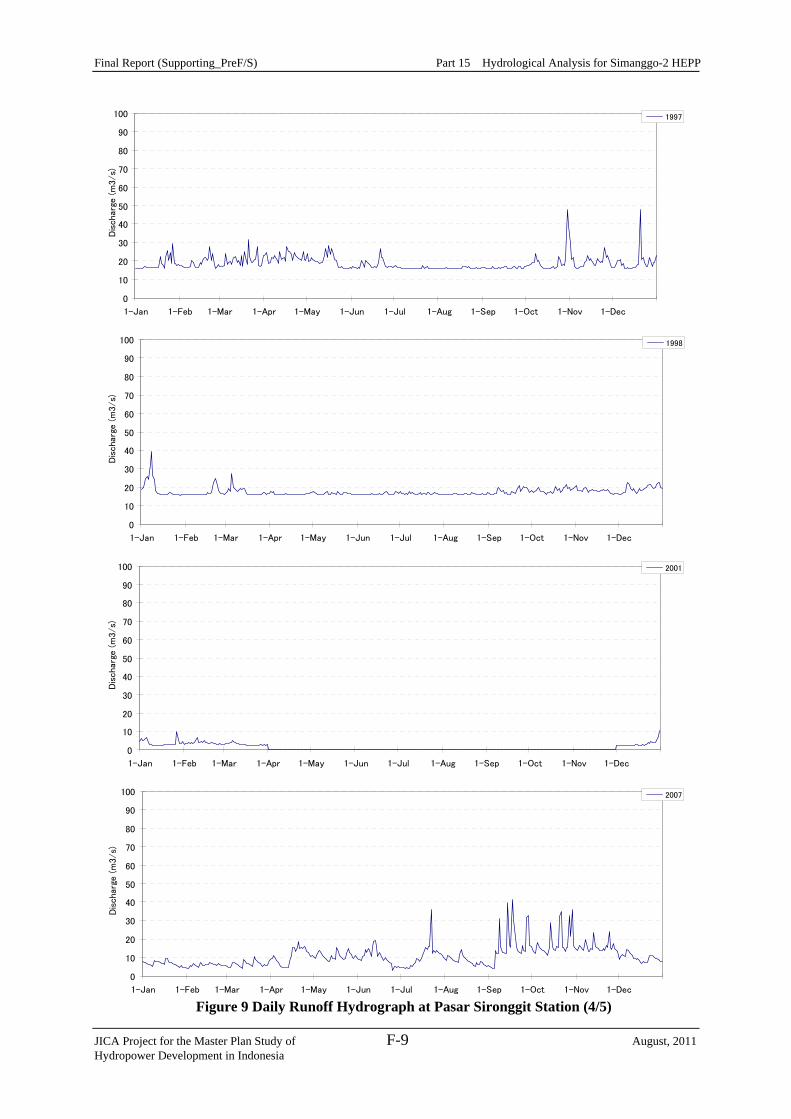
Final Report (Supporting_PreF/S) Part 15 Hydrological Analysis for Simanggo-2 HEPP
JICA Project for the Master Plan Study of F-9 August, 2011 Hydropower Development in Indonesia
0
10
20
30
40
50
60
70
80
90
100
1-Jan 1-Feb 1-Mar 1-Apr 1-May 1-Jun 1-Jul 1-Aug 1-Sep 1-Oct 1-Nov 1-Dec
Dis
cha
rge (
m3/s)
1997
0
10
20
30
40
50
60
70
80
90
100
1-Jan 1-Feb 1-Mar 1-Apr 1-May 1-Jun 1-Jul 1-Aug 1-Sep 1-Oct 1-Nov 1-Dec
Dis
cha
rge (
m3/s)
1998
0
10
20
30
40
50
60
70
80
90
100
1-Jan 1-Feb 1-Mar 1-Apr 1-May 1-Jun 1-Jul 1-Aug 1-Sep 1-Oct 1-Nov 1-Dec
Dis
charg
e (
m3/s)
2001
0
10
20
30
40
50
60
70
80
90
100
1-Jan 1-Feb 1-Mar 1-Apr 1-May 1-Jun 1-Jul 1-Aug 1-Sep 1-Oct 1-Nov 1-Dec
Dis
cha
rge (
m3/s)
2007
Figure 9 Daily Runoff Hydrograph at Pasar Sironggit Station (4/5)

Final Report (Supporting_PreF/S) Part 15 Hydrological Analysis for Simanggo-2 HEPP
JICA Project for the Master Plan Study of F-10 August, 2011 Hydropower Development in Indonesia
0
10
20
30
40
50
60
70
80
90
100
1-Jan 1-Feb 1-Mar 1-Apr 1-May 1-Jun 1-Jul 1-Aug 1-Sep 1-Oct 1-Nov 1-Dec
Dis
char
ge (
m3/
s)2008
Figure 10 Daily Runoff Hydrograph at Pasar Sironggit Station (5/5)
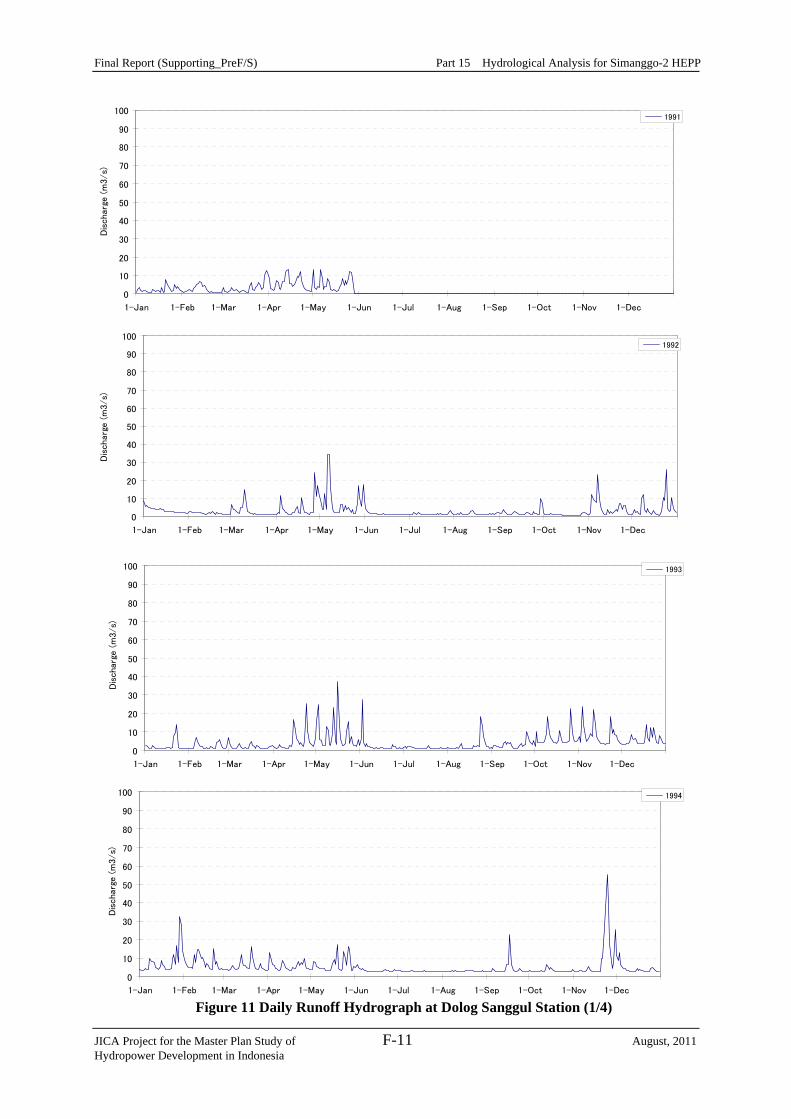
Final Report (Supporting_PreF/S) Part 15 Hydrological Analysis for Simanggo-2 HEPP
JICA Project for the Master Plan Study of F-11 August, 2011 Hydropower Development in Indonesia
0
10
20
30
40
50
60
70
80
90
100
1-Jan 1-Feb 1-Mar 1-Apr 1-May 1-Jun 1-Jul 1-Aug 1-Sep 1-Oct 1-Nov 1-Dec
Dis
cha
rge (
m3/s)
1991
0
10
20
30
40
50
60
70
80
90
100
1-Jan 1-Feb 1-Mar 1-Apr 1-May 1-Jun 1-Jul 1-Aug 1-Sep 1-Oct 1-Nov 1-Dec
Dis
charg
e (
m3/s)
1992
0
10
20
30
40
50
60
70
80
90
100
1-Jan 1-Feb 1-Mar 1-Apr 1-May 1-Jun 1-Jul 1-Aug 1-Sep 1-Oct 1-Nov 1-Dec
Dis
cha
rge (
m3/s)
1993
0
10
20
30
40
50
60
70
80
90
100
1-Jan 1-Feb 1-Mar 1-Apr 1-May 1-Jun 1-Jul 1-Aug 1-Sep 1-Oct 1-Nov 1-Dec
Dis
cha
rge (
m3/s)
1994
Figure 11 Daily Runoff Hydrograph at Dolog Sanggul Station (1/4)
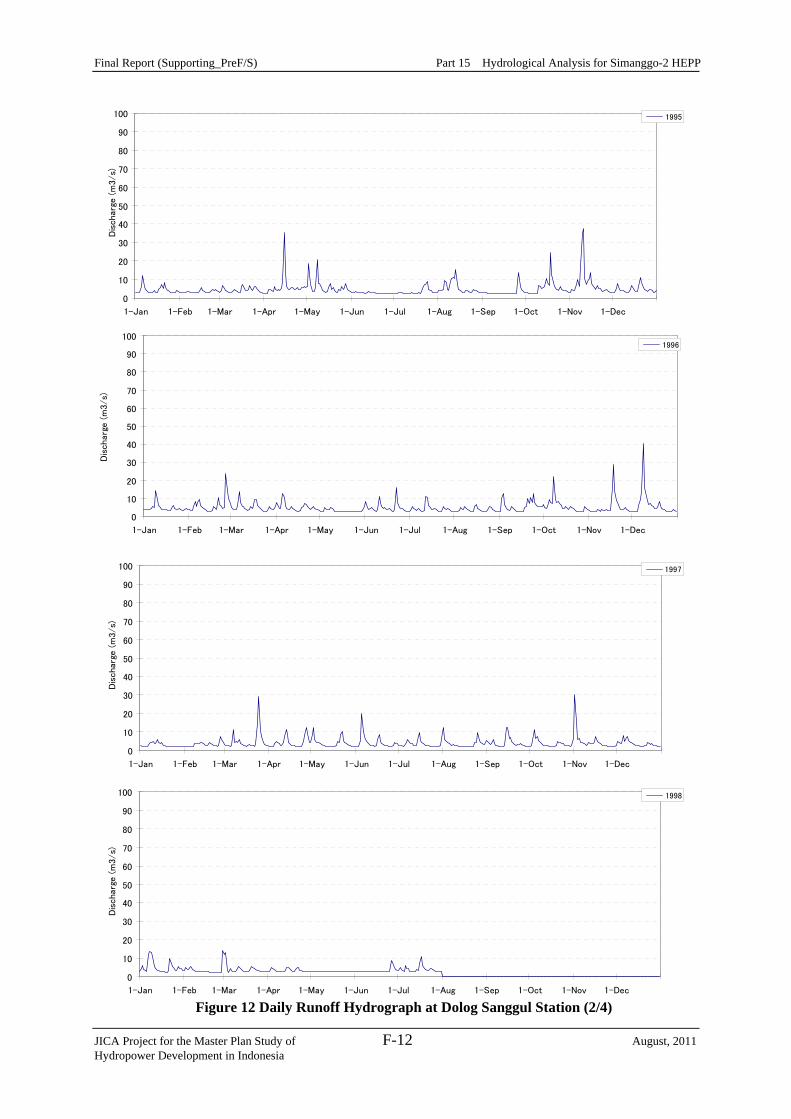
Final Report (Supporting_PreF/S) Part 15 Hydrological Analysis for Simanggo-2 HEPP
JICA Project for the Master Plan Study of F-12 August, 2011 Hydropower Development in Indonesia
0
10
20
30
40
50
60
70
80
90
100
1-Jan 1-Feb 1-Mar 1-Apr 1-May 1-Jun 1-Jul 1-Aug 1-Sep 1-Oct 1-Nov 1-Dec
Dis
cha
rge (
m3/s)
1995
0
10
20
30
40
50
60
70
80
90
100
1-Jan 1-Feb 1-Mar 1-Apr 1-May 1-Jun 1-Jul 1-Aug 1-Sep 1-Oct 1-Nov 1-Dec
Dis
charg
e (
m3/s)
1996
0
10
20
30
40
50
60
70
80
90
100
1-Jan 1-Feb 1-Mar 1-Apr 1-May 1-Jun 1-Jul 1-Aug 1-Sep 1-Oct 1-Nov 1-Dec
Dis
cha
rge (
m3/s)
1997
0
10
20
30
40
50
60
70
80
90
100
1-Jan 1-Feb 1-Mar 1-Apr 1-May 1-Jun 1-Jul 1-Aug 1-Sep 1-Oct 1-Nov 1-Dec
Dis
cha
rge (
m3/s)
1998
Figure 12 Daily Runoff Hydrograph at Dolog Sanggul Station (2/4)
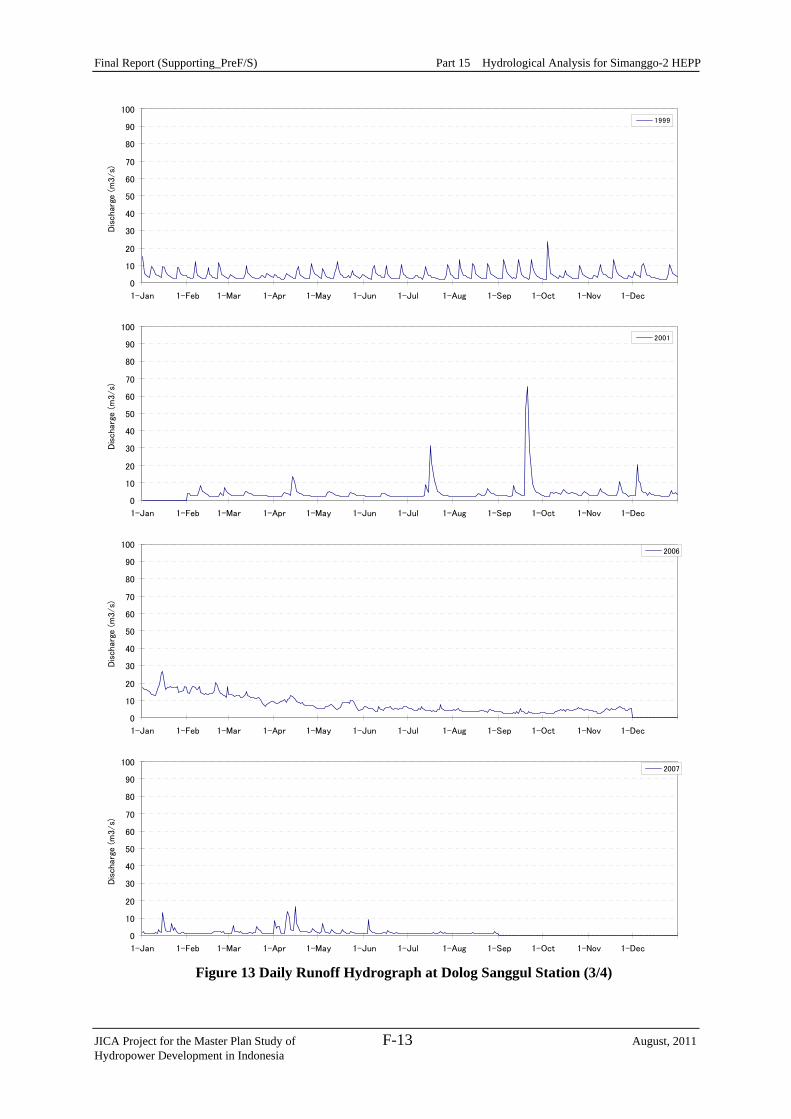
Final Report (Supporting_PreF/S) Part 15 Hydrological Analysis for Simanggo-2 HEPP
JICA Project for the Master Plan Study of F-13 August, 2011 Hydropower Development in Indonesia
0
10
20
30
40
50
60
70
80
90
100
1-Jan 1-Feb 1-Mar 1-Apr 1-May 1-Jun 1-Jul 1-Aug 1-Sep 1-Oct 1-Nov 1-Dec
Dis
char
ge (
m3/s)
1999
0
10
20
30
40
50
60
70
80
90
100
1-Jan 1-Feb 1-Mar 1-Apr 1-May 1-Jun 1-Jul 1-Aug 1-Sep 1-Oct 1-Nov 1-Dec
Dis
charg
e (m
3/s)
2001
0
10
20
30
40
50
60
70
80
90
100
1-Jan 1-Feb 1-Mar 1-Apr 1-May 1-Jun 1-Jul 1-Aug 1-Sep 1-Oct 1-Nov 1-Dec
Dis
charg
e (m
3/s)
2006
0
10
20
30
40
50
60
70
80
90
100
1-Jan 1-Feb 1-Mar 1-Apr 1-May 1-Jun 1-Jul 1-Aug 1-Sep 1-Oct 1-Nov 1-Dec
Dis
charg
e (m
3/s)
2007
Figure 13 Daily Runoff Hydrograph at Dolog Sanggul Station (3/4)
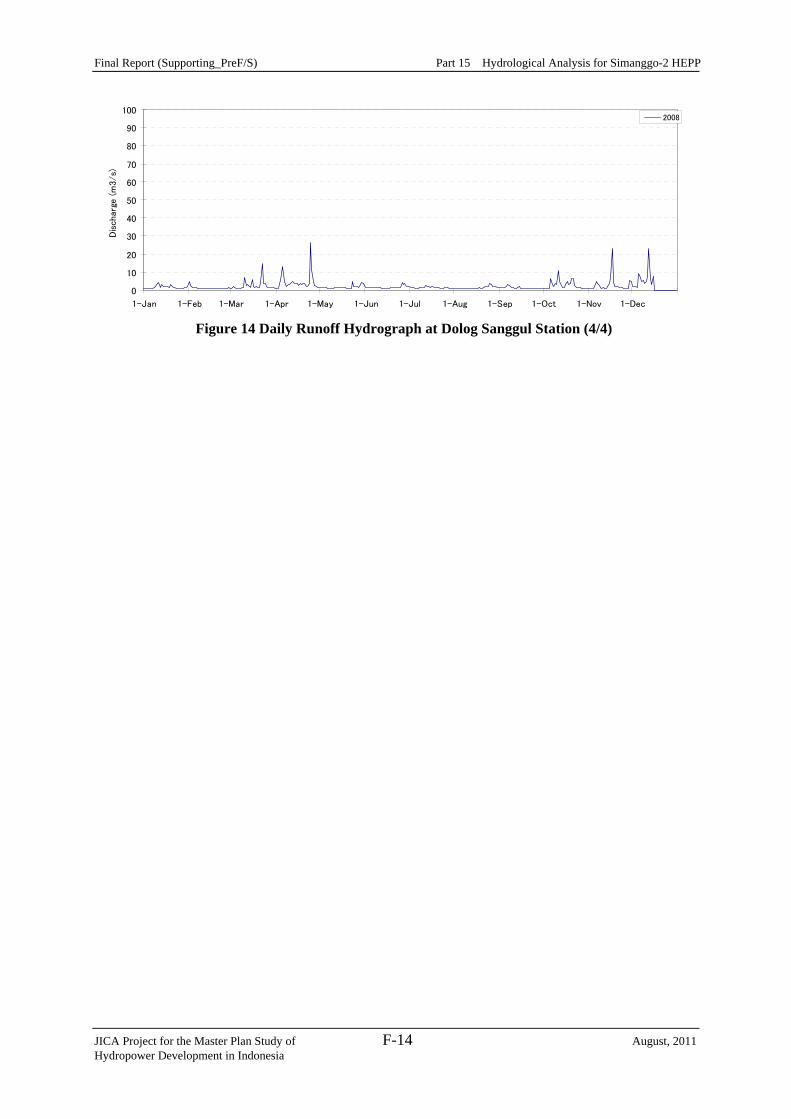
Final Report (Supporting_PreF/S) Part 15 Hydrological Analysis for Simanggo-2 HEPP
JICA Project for the Master Plan Study of F-14 August, 2011 Hydropower Development in Indonesia
0
10
20
30
40
50
60
70
80
90
100
1-Jan 1-Feb 1-Mar 1-Apr 1-May 1-Jun 1-Jul 1-Aug 1-Sep 1-Oct 1-Nov 1-Dec
Dis
charg
e (
m3/s)
2008
Figure 14 Daily Runoff Hydrograph at Dolog Sanggul Station (4/4)

Final Report (Supporting_PreF/S) Part 15 Hydrological Analysis for Simanggo-2 HEPP
JICA Project for the Master Plan Study of F-15 August, 2011 Hydropower Development in Indonesia
0
10
20
30
40
50
60
70
80
90
100
1-Jan 1-Feb 1-Mar 1-Apr 1-May 1-Jun 1-Jul 1-Aug 1-Sep 1-Oct 1-Nov 1-Dec
Dis
char
ge (
m3/s)
1983
0
10
20
30
40
50
60
70
80
90
100
1-Jan 1-Feb 1-Mar 1-Apr 1-May 1-Jun 1-Jul 1-Aug 1-Sep 1-Oct 1-Nov 1-Dec
Dis
charg
e (
m3/s)
1984
0
10
20
30
40
50
60
70
80
90
100
1-Jan 1-Feb 1-Mar 1-Apr 1-May 1-Jun 1-Jul 1-Aug 1-Sep 1-Oct 1-Nov 1-Dec
Dis
charg
e (m
3/s)
1985
0
10
20
30
40
50
60
70
80
90
100
1-Jan 1-Feb 1-Mar 1-Apr 1-May 1-Jun 1-Jul 1-Aug 1-Sep 1-Oct 1-Nov 1-Dec
Dis
charg
e (m
3/s)
1986
Figure 15 Daily Runoff Hydrograph at Marade Station (1/5)
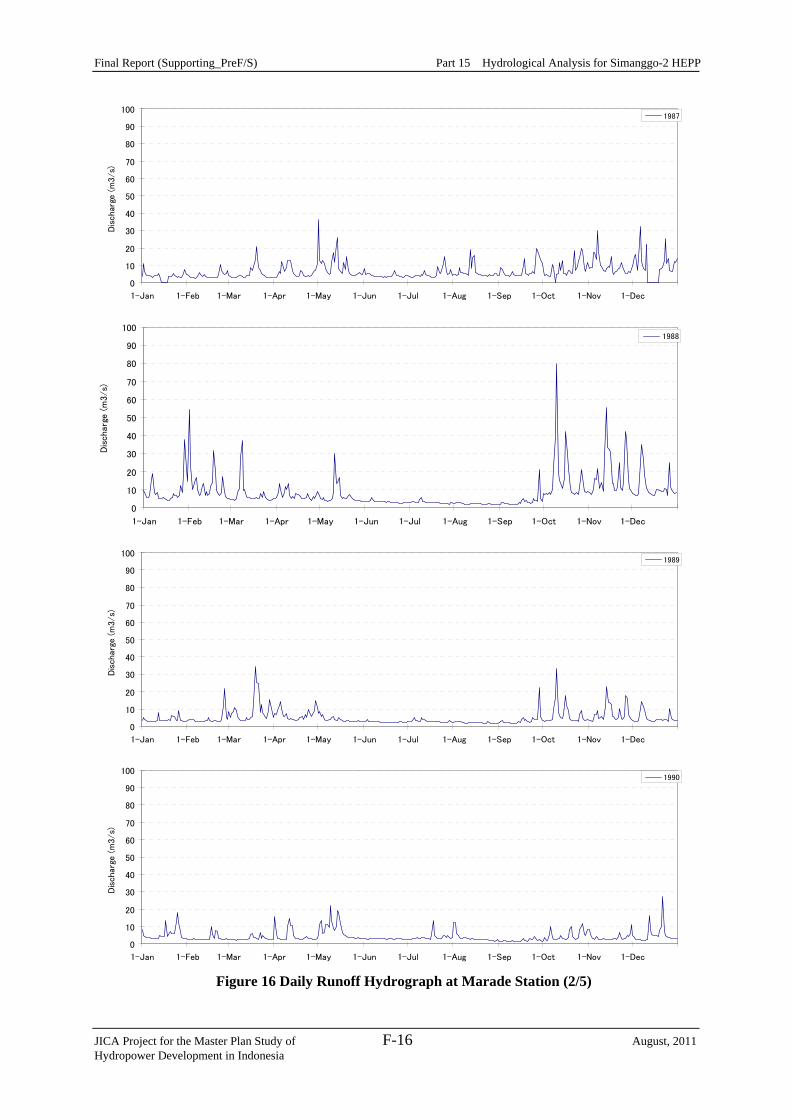
Final Report (Supporting_PreF/S) Part 15 Hydrological Analysis for Simanggo-2 HEPP
JICA Project for the Master Plan Study of F-16 August, 2011 Hydropower Development in Indonesia
0
10
20
30
40
50
60
70
80
90
100
1-Jan 1-Feb 1-Mar 1-Apr 1-May 1-Jun 1-Jul 1-Aug 1-Sep 1-Oct 1-Nov 1-Dec
Dis
char
ge (
m3/s)
1987
0
10
20
30
40
50
60
70
80
90
100
1-Jan 1-Feb 1-Mar 1-Apr 1-May 1-Jun 1-Jul 1-Aug 1-Sep 1-Oct 1-Nov 1-Dec
Dis
charg
e (
m3/s)
1988
0
10
20
30
40
50
60
70
80
90
100
1-Jan 1-Feb 1-Mar 1-Apr 1-May 1-Jun 1-Jul 1-Aug 1-Sep 1-Oct 1-Nov 1-Dec
Dis
charg
e (m
3/s)
1989
0
10
20
30
40
50
60
70
80
90
100
1-Jan 1-Feb 1-Mar 1-Apr 1-May 1-Jun 1-Jul 1-Aug 1-Sep 1-Oct 1-Nov 1-Dec
Dis
charg
e (m
3/s)
1990
Figure 16 Daily Runoff Hydrograph at Marade Station (2/5)
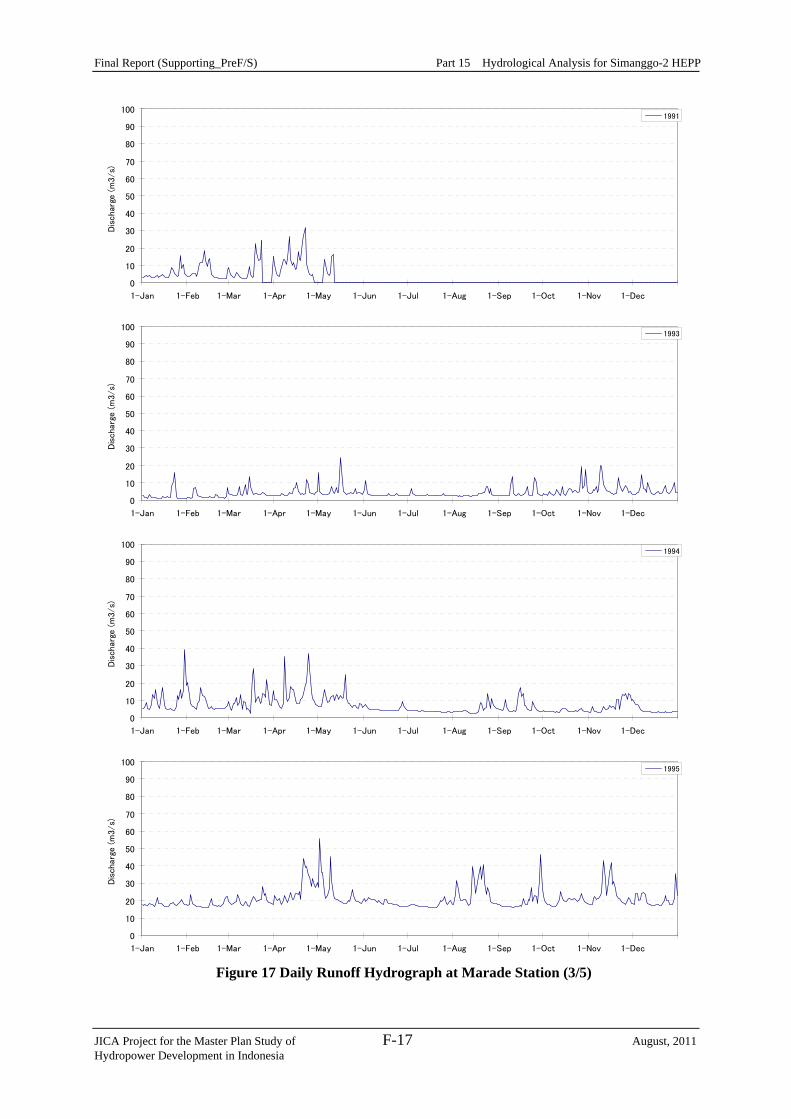
Final Report (Supporting_PreF/S) Part 15 Hydrological Analysis for Simanggo-2 HEPP
JICA Project for the Master Plan Study of F-17 August, 2011 Hydropower Development in Indonesia
0
10
20
30
40
50
60
70
80
90
100
1-Jan 1-Feb 1-Mar 1-Apr 1-May 1-Jun 1-Jul 1-Aug 1-Sep 1-Oct 1-Nov 1-Dec
Dis
char
ge (
m3/s)
1991
0
10
20
30
40
50
60
70
80
90
100
1-Jan 1-Feb 1-Mar 1-Apr 1-May 1-Jun 1-Jul 1-Aug 1-Sep 1-Oct 1-Nov 1-Dec
Dis
charg
e (m
3/s)
1993
0
10
20
30
40
50
60
70
80
90
100
1-Jan 1-Feb 1-Mar 1-Apr 1-May 1-Jun 1-Jul 1-Aug 1-Sep 1-Oct 1-Nov 1-Dec
Dis
charg
e (m
3/s)
1994
0
10
20
30
40
50
60
70
80
90
100
1-Jan 1-Feb 1-Mar 1-Apr 1-May 1-Jun 1-Jul 1-Aug 1-Sep 1-Oct 1-Nov 1-Dec
Dis
charg
e (m
3/s)
1995
Figure 17 Daily Runoff Hydrograph at Marade Station (3/5)
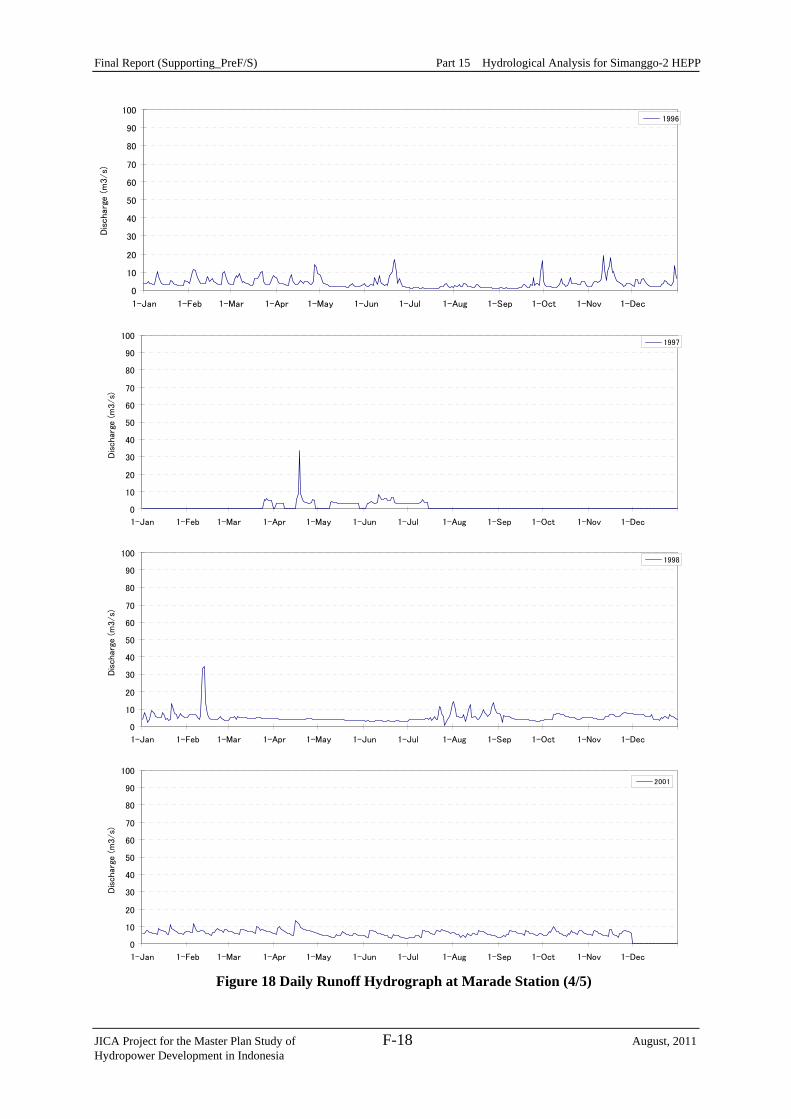
Final Report (Supporting_PreF/S) Part 15 Hydrological Analysis for Simanggo-2 HEPP
JICA Project for the Master Plan Study of F-18 August, 2011 Hydropower Development in Indonesia
0
10
20
30
40
50
60
70
80
90
100
1-Jan 1-Feb 1-Mar 1-Apr 1-May 1-Jun 1-Jul 1-Aug 1-Sep 1-Oct 1-Nov 1-Dec
Dis
charg
e (
m3/s)
1996
0
10
20
30
40
50
60
70
80
90
100
1-Jan 1-Feb 1-Mar 1-Apr 1-May 1-Jun 1-Jul 1-Aug 1-Sep 1-Oct 1-Nov 1-Dec
Dis
char
ge (
m3/s)
1997
0
10
20
30
40
50
60
70
80
90
100
1-Jan 1-Feb 1-Mar 1-Apr 1-May 1-Jun 1-Jul 1-Aug 1-Sep 1-Oct 1-Nov 1-Dec
Dis
charg
e (m
3/s)
1998
0
10
20
30
40
50
60
70
80
90
100
1-Jan 1-Feb 1-Mar 1-Apr 1-May 1-Jun 1-Jul 1-Aug 1-Sep 1-Oct 1-Nov 1-Dec
Dis
charg
e (m
3/s)
2001
Figure 18 Daily Runoff Hydrograph at Marade Station (4/5)
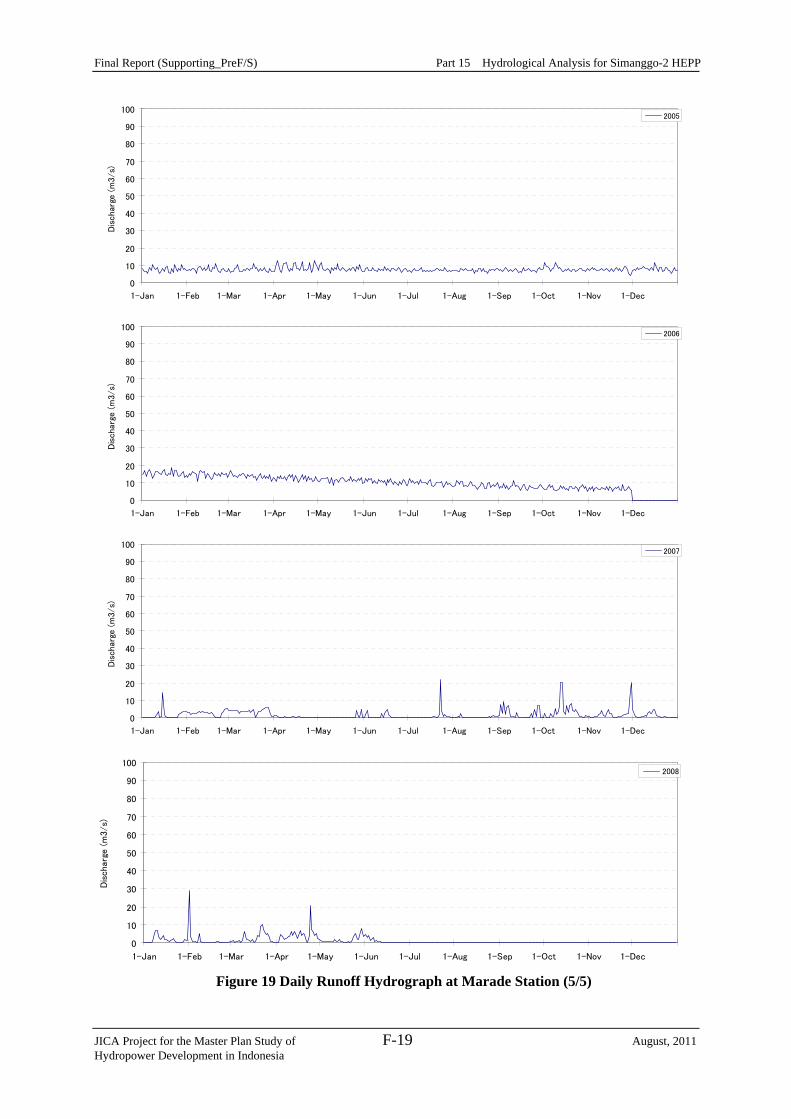
Final Report (Supporting_PreF/S) Part 15 Hydrological Analysis for Simanggo-2 HEPP
JICA Project for the Master Plan Study of F-19 August, 2011 Hydropower Development in Indonesia
0
10
20
30
40
50
60
70
80
90
100
1-Jan 1-Feb 1-Mar 1-Apr 1-May 1-Jun 1-Jul 1-Aug 1-Sep 1-Oct 1-Nov 1-Dec
Dis
char
ge (
m3/s)
2005
0
10
20
30
40
50
60
70
80
90
100
1-Jan 1-Feb 1-Mar 1-Apr 1-May 1-Jun 1-Jul 1-Aug 1-Sep 1-Oct 1-Nov 1-Dec
Dis
charg
e (m
3/s)
2006
0
10
20
30
40
50
60
70
80
90
100
1-Jan 1-Feb 1-Mar 1-Apr 1-May 1-Jun 1-Jul 1-Aug 1-Sep 1-Oct 1-Nov 1-Dec
Dis
charg
e (m
3/s)
2007
0
10
20
30
40
50
60
70
80
90
100
1-Jan 1-Feb 1-Mar 1-Apr 1-May 1-Jun 1-Jul 1-Aug 1-Sep 1-Oct 1-Nov 1-Dec
Dis
charg
e (
m3/s)
2008
Figure 19 Daily Runoff Hydrograph at Marade Station (5/5)
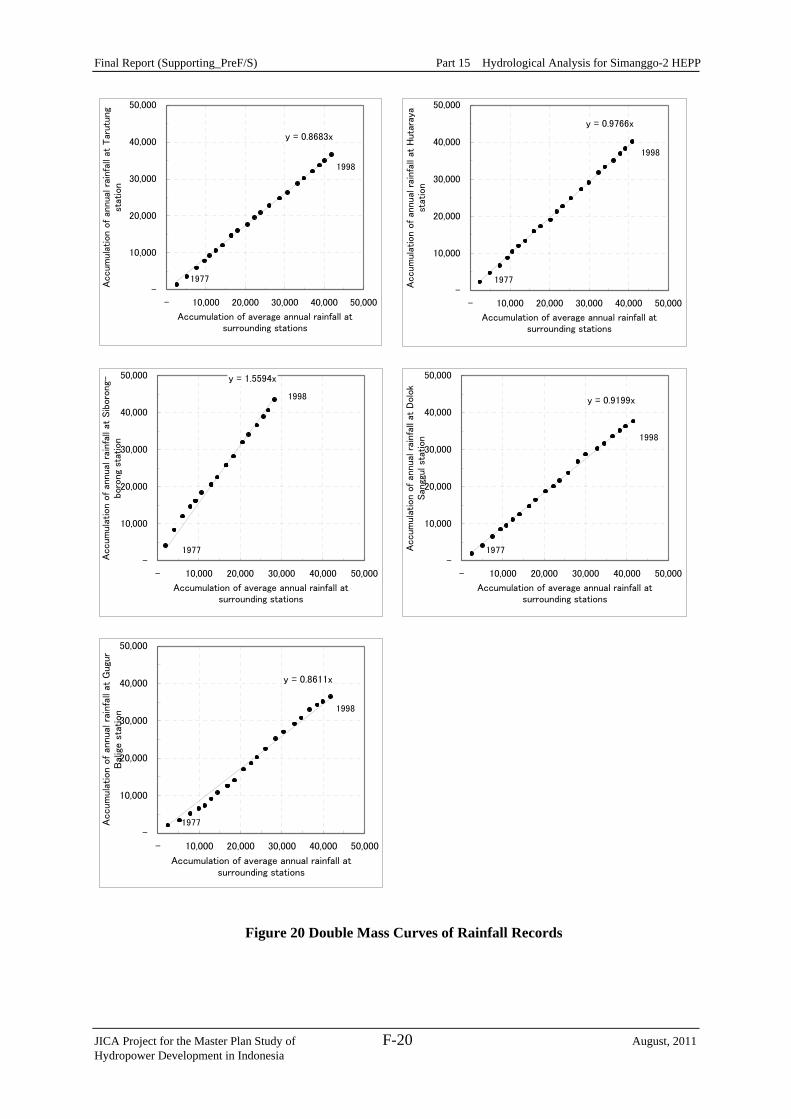
Final Report (Supporting_PreF/S) Part 15 Hydrological Analysis for Simanggo-2 HEPP
JICA Project for the Master Plan Study of F-20 August, 2011 Hydropower Development in Indonesia
y = 0.8683x
-
10,000
20,000
30,000
40,000
50,000
- 10,000 20,000 30,000 40,000 50,000
Accumulation of average annual rainfall atsurrounding stations
Accum
ula
tion o
f an
nual
rai
nfa
ll at
Tar
utu
ng
stat
ion
1977
1998
y = 0.9766x
-
10,000
20,000
30,000
40,000
50,000
- 10,000 20,000 30,000 40,000 50,000
Accumulation of average annual rainfall atsurrounding stations
Accum
ula
tion o
f an
nual
rai
nfa
ll at
Huta
raya
stat
ion
1977
1998
y = 1.5594x
-
10,000
20,000
30,000
40,000
50,000
- 10,000 20,000 30,000 40,000 50,000
Accumulation of average annual rainfall atsurrounding stations
Accum
ula
tion o
f an
nual
rai
nfa
ll at
Sib
oro
ng-
boro
ng
stat
ion
1977
1998 y = 0.9199x
-
10,000
20,000
30,000
40,000
50,000
- 10,000 20,000 30,000 40,000 50,000
Accumulation of average annual rainfall atsurrounding stations
Accum
ula
tion o
f an
nual
rai
nfa
ll at
Dolo
kSan
ggul st
atio
n
1977
1998
y = 0.8611x
-
10,000
20,000
30,000
40,000
50,000
- 10,000 20,000 30,000 40,000 50,000
Accumulation of average annual rainfall atsurrounding stations
Accum
ula
tion o
f an
nua
l ra
infa
ll at
Gug
urB
alig
e st
atio
n
1977
1998
Figure 20 Double Mass Curves of Rainfall Records
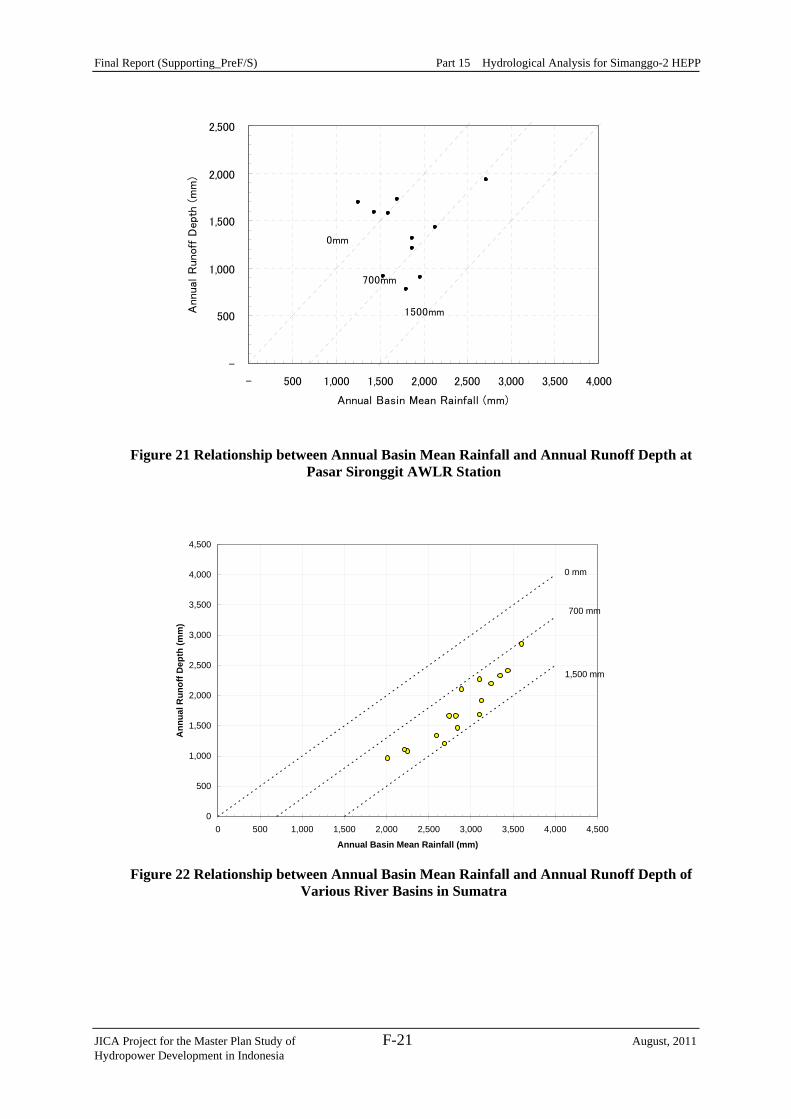
Final Report (Supporting_PreF/S) Part 15 Hydrological Analysis for Simanggo-2 HEPP
JICA Project for the Master Plan Study of F-21 August, 2011 Hydropower Development in Indonesia
-
500
1,000
1,500
2,000
2,500
- 500 1,000 1,500 2,000 2,500 3,000 3,500 4,000
Annual Basin Mean Rainfall (mm)
Annual R
unoff
Depth
(m
m)
0mm
700mm
1500mm
Figure 21 Relationship between Annual Basin Mean Rainfall and Annual Runoff Depth at
Pasar Sironggit AWLR Station
700 mm
1,500 mm
0 mm
0
500
1,000
1,500
2,000
2,500
3,000
3,500
4,000
4,500
0 500 1,000 1,500 2,000 2,500 3,000 3,500 4,000 4,500
Annual Basin Mean Rainfall (mm)
Ann
ual R
unof
f Dep
th (m
m)
Figure 22 Relationship between Annual Basin Mean Rainfall and Annual Runoff Depth of
Various River Basins in Sumatra
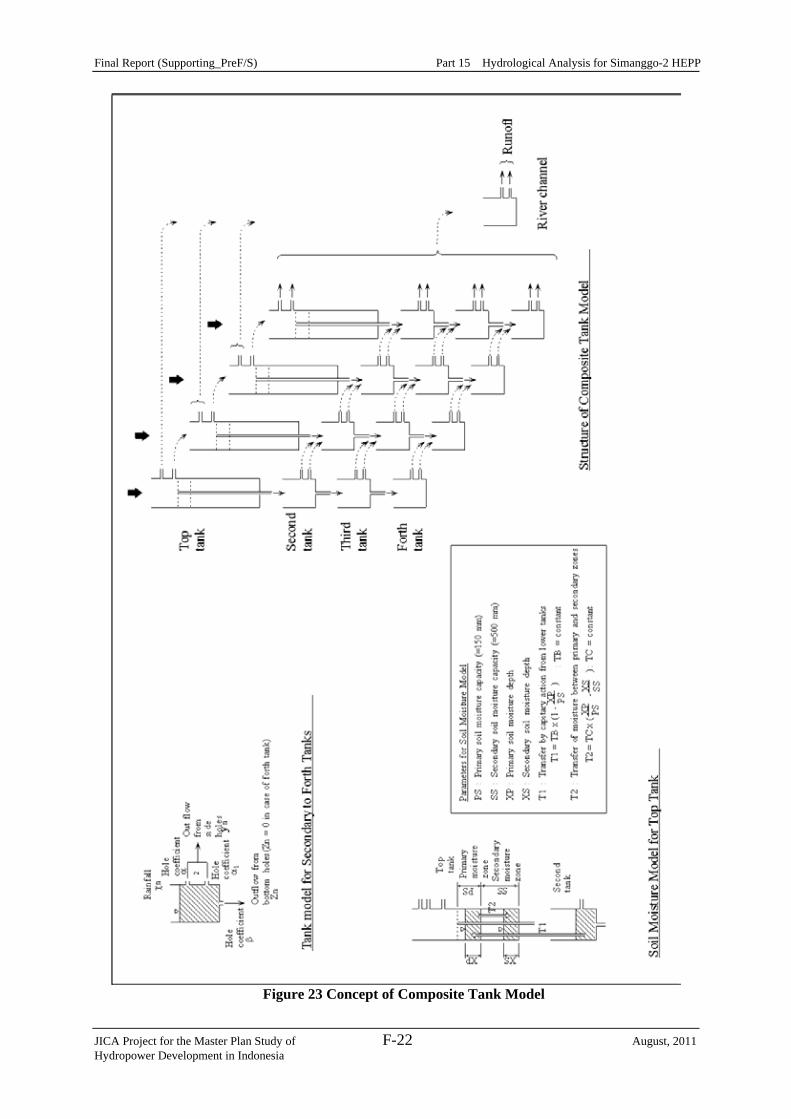
Final Report (Supporting_PreF/S) Part 15 Hydrological Analysis for Simanggo-2 HEPP
JICA Project for the Master Plan Study of F-22 August, 2011 Hydropower Development in Indonesia
Figure 23 Concept of Composite Tank Model
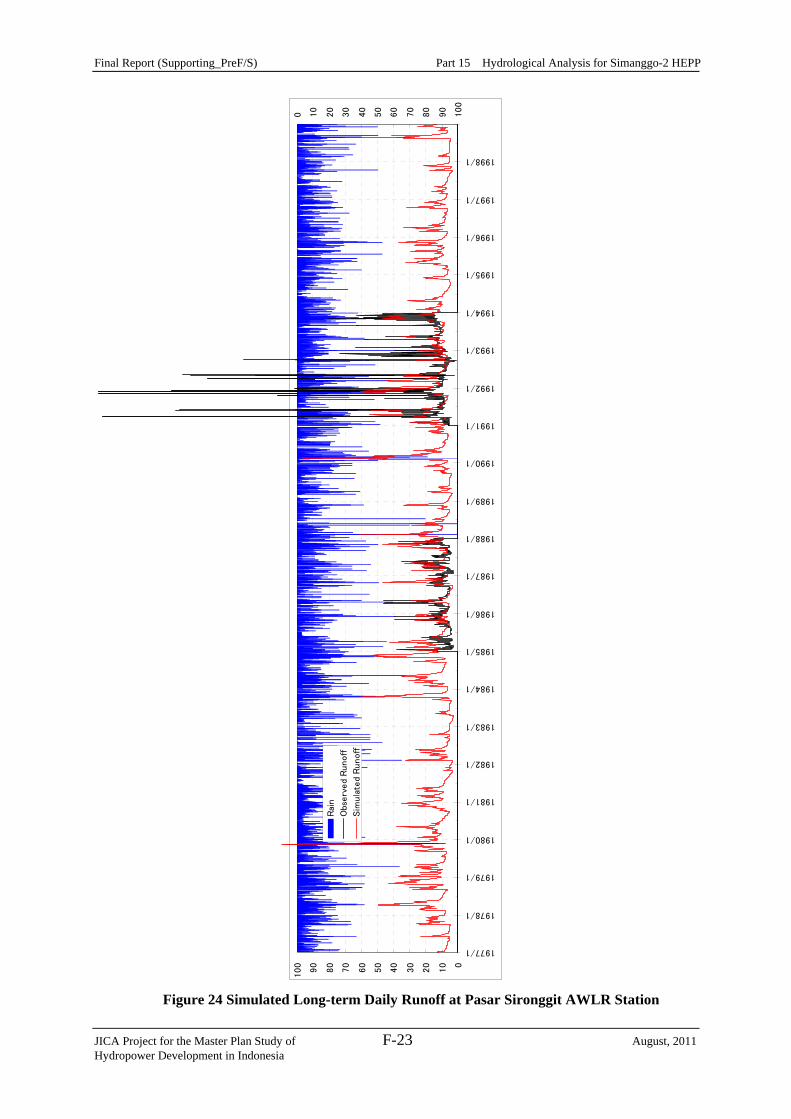
Final Report (Supporting_PreF/S) Part 15 Hydrological Analysis for Simanggo-2 HEPP
JICA Project for the Master Plan Study of F-23 August, 2011 Hydropower Development in Indonesia
Figure 24 Simulated Long-term Daily Runoff at Pasar Sironggit AWLR Station
0
10
20
30
40
50
60
70
80
90
100
1977/1
1978/1
1979/1
1980/1
1981/1
1982/1
1983/1
1984/1
1985/1
1986/1
1987/1
1988/1
1989/1
1990/1
1991/1
1992/1
1993/1
1994/1
1995/1
1996/1
1997/1
1998/1
0 10
20
30
40
50
60
70
80
90
100
Rai
n
Obs
erv
ed
Runoff
Sim
ula
ted
Runoff
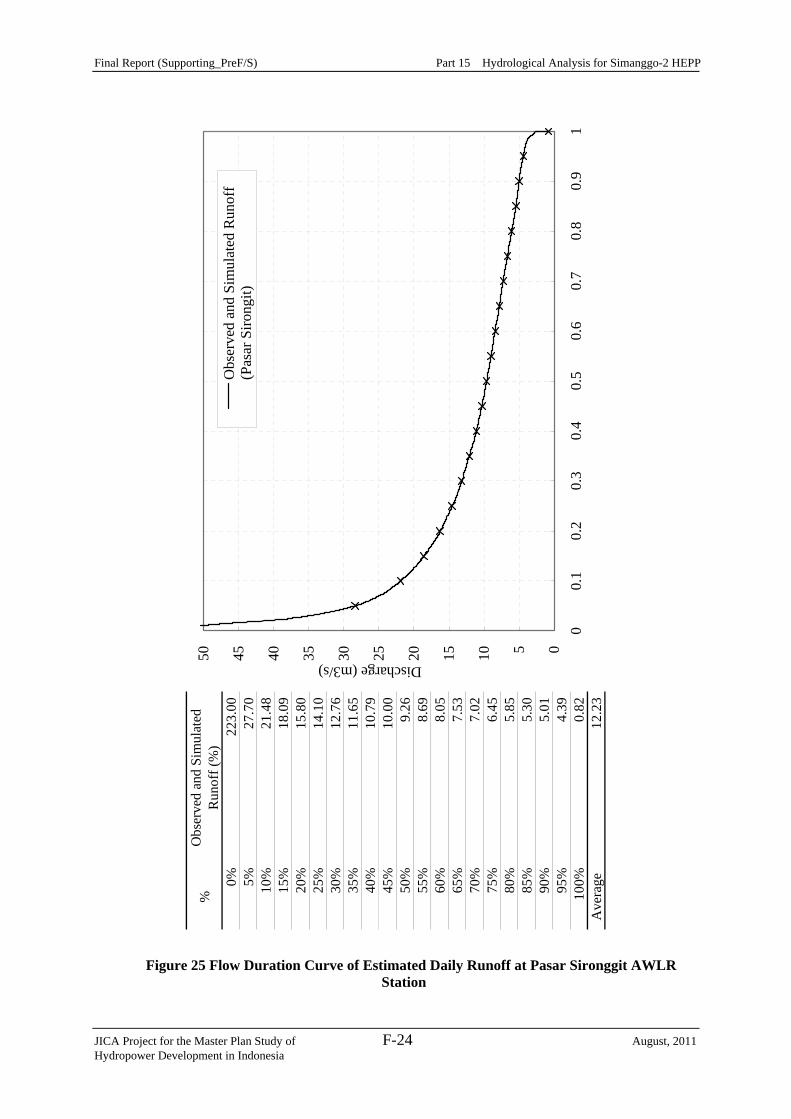
Final Report (Supporting_PreF/S) Part 15 Hydrological Analysis for Simanggo-2 HEPP
JICA Project for the Master Plan Study of F-24 August, 2011 Hydropower Development in Indonesia
Figure 25 Flow Duration Curve of Estimated Daily Runoff at Pasar Sironggit AWLR Station
%O
bser
ved
and
Sim
ulat
edR
unof
f (%
)0%
223.
005%
27.7
010
%21
.48
15%
18.0
920
%15
.80
25%
14.1
030
%12
.76
35%
11.6
540
%10
.79
45%
10.0
050
%9.
2655
%8.
6960
%8.
0565
%7.
5370
%7.
0275
%6.
4580
%5.
8585
%5.
3090
%5.
0195
%4.
3910
0%0.
82A
vera
ge12
.23
05101520253035404550
00.
10.
20.
30.
40.
50.
60.
70.
80.
91
Discharge (m3/s)
Obs
erve
d an
d Si
mul
ated
Run
off
(Pas
ar S
irong
it)
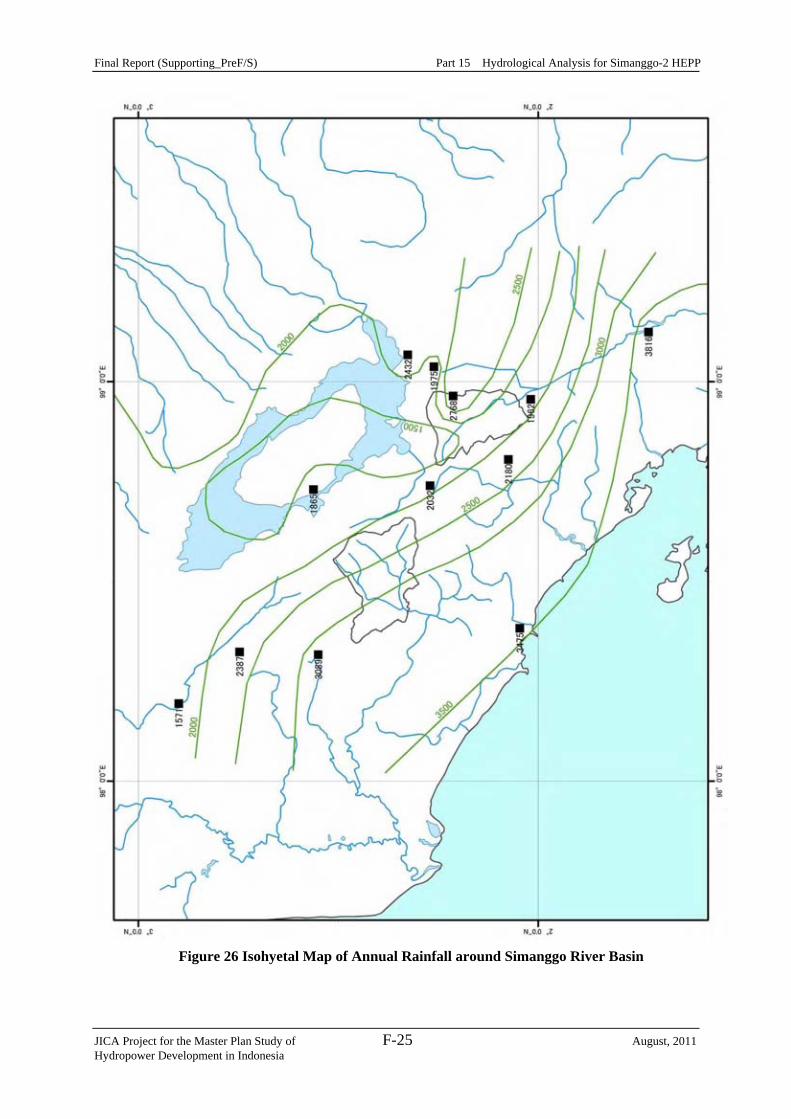
Final Report (Supporting_PreF/S) Part 15 Hydrological Analysis for Simanggo-2 HEPP
JICA Project for the Master Plan Study of F-25 August, 2011 Hydropower Development in Indonesia
Figure 26 Isohyetal Map of Annual Rainfall around Simanggo River Basin
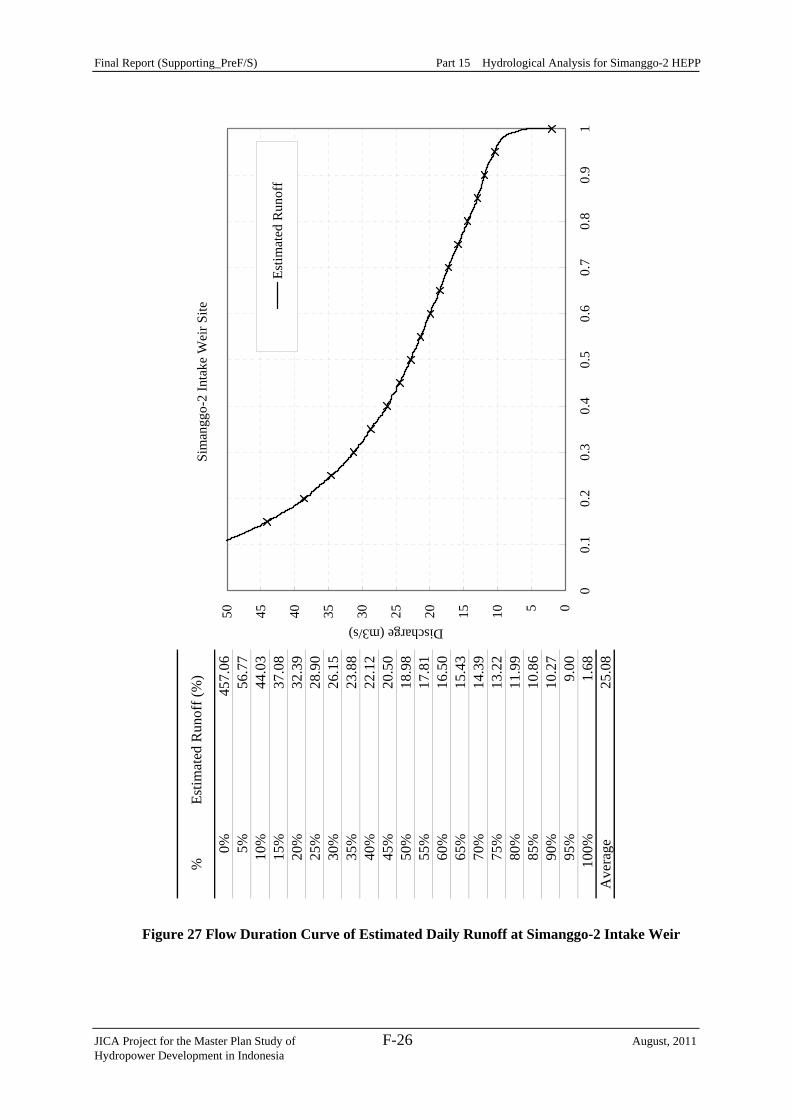
Final Report (Supporting_PreF/S) Part 15 Hydrological Analysis for Simanggo-2 HEPP
JICA Project for the Master Plan Study of F-26 August, 2011 Hydropower Development in Indonesia
Figure 27 Flow Duration Curve of Estimated Daily Runoff at Simanggo-2 Intake Weir
%Es
timat
ed R
unof
f (%
)
0%45
7.06
5%56
.77
10%
44.0
315
%37
.08
20%
32.3
925
%28
.90
30%
26.1
535
%23
.88
40%
22.1
245
%20
.50
50%
18.9
855
%17
.81
60%
16.5
065
%15
.43
70%
14.3
975
%13
.22
80%
11.9
985
%10
.86
90%
10.2
795
%9.
0010
0%1.
68A
vera
ge25
.08
Sim
angg
o-2
Inta
ke W
eir S
ite
05101520253035404550
00.
10.
20.
30.
40.
50.
60.
70.
80.
91
Discharge (m3/s)
Estim
ated
Run
off
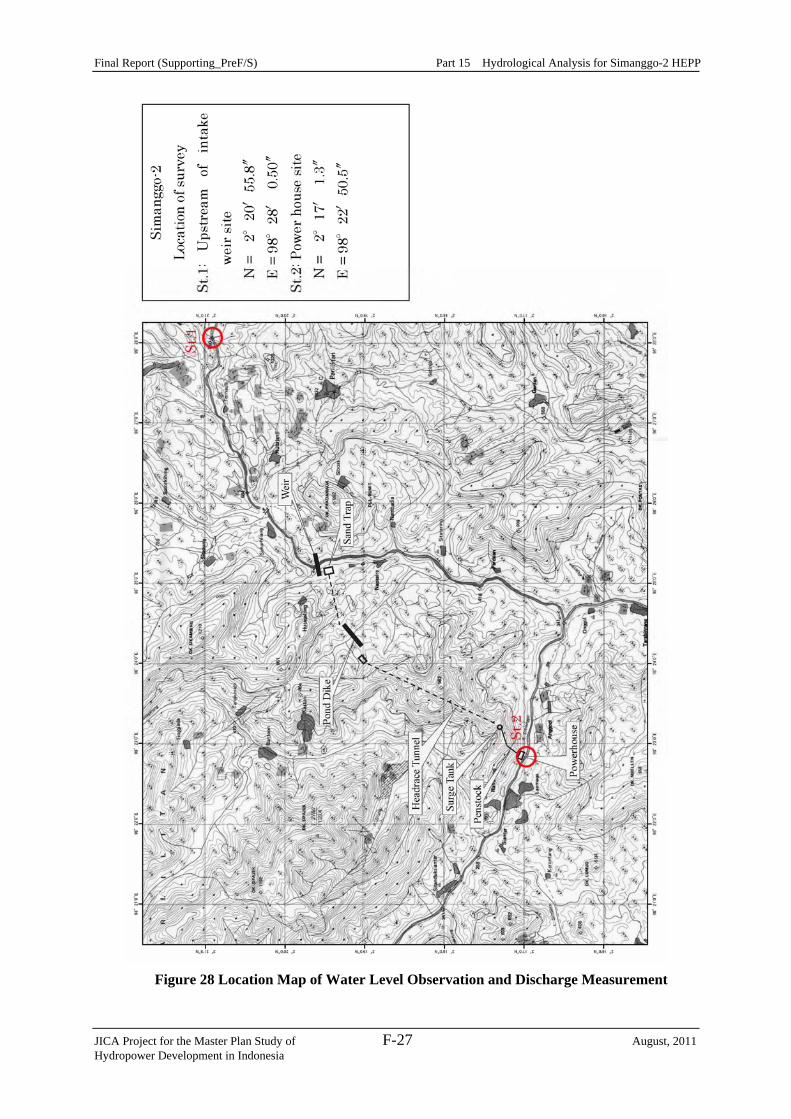
Final Report (Supporting_PreF/S) Part 15 Hydrological Analysis for Simanggo-2 HEPP
JICA Project for the Master Plan Study of F-27 August, 2011 Hydropower Development in Indonesia
Figure 28 Location Map of Water Level Observation and Discharge Measurement
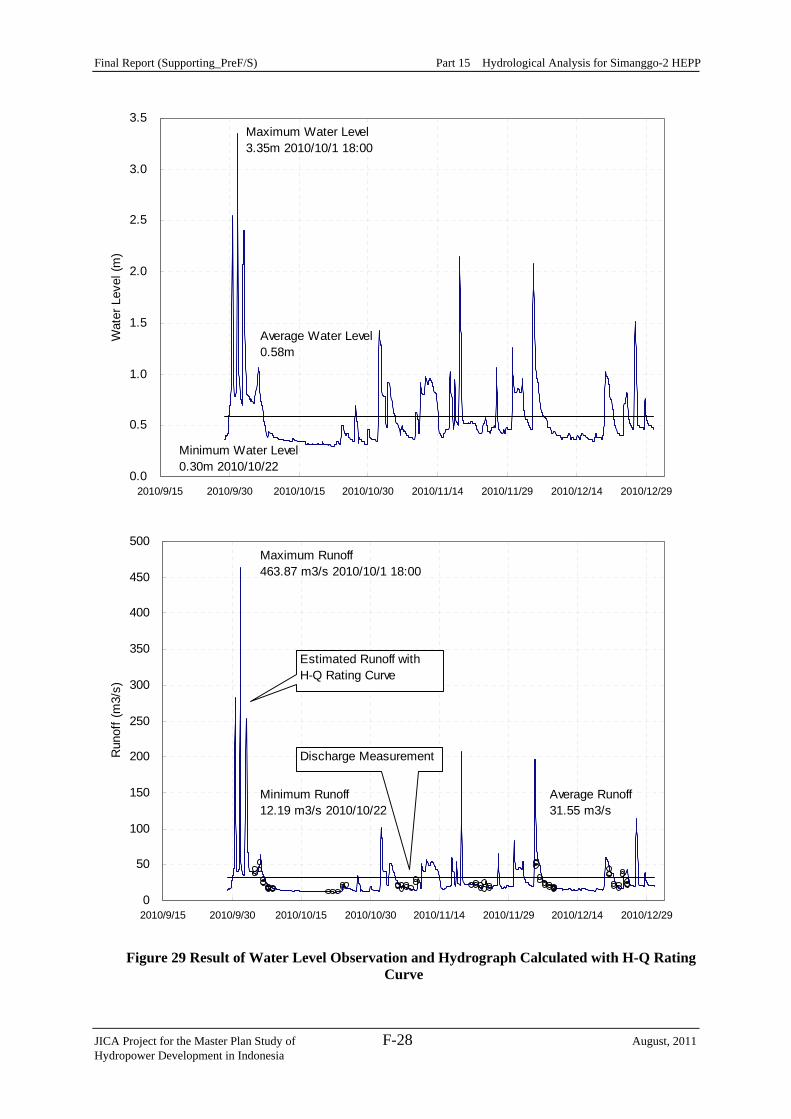
Final Report (Supporting_PreF/S) Part 15 Hydrological Analysis for Simanggo-2 HEPP
JICA Project for the Master Plan Study of F-28 August, 2011 Hydropower Development in Indonesia
0.0
0.5
1.0
1.5
2.0
2.5
3.0
3.5
2010/9/15 2010/9/30 2010/10/15 2010/10/30 2010/11/14 2010/11/29 2010/12/14 2010/12/29
Wat
er L
evel
(m)
Maximum Water Level3.35m 2010/10/1 18:00
Minimum Water Level0.30m 2010/10/22
Average Water Level0.58m
0
50
100
150
200
250
300
350
400
450
500
2010/9/15 2010/9/30 2010/10/15 2010/10/30 2010/11/14 2010/11/29 2010/12/14 2010/12/29
Run
off (
m3/
s)
Maximum Runoff463.87 m3/s 2010/10/1 18:00
Minimum Runoff12.19 m3/s 2010/10/22
Average Runoff31.55 m3/s
Discharge Measurement
Estimated Runoff withH-Q Rating Curve
Figure 29 Result of Water Level Observation and Hydrograph Calculated with H-Q Rating
Curve
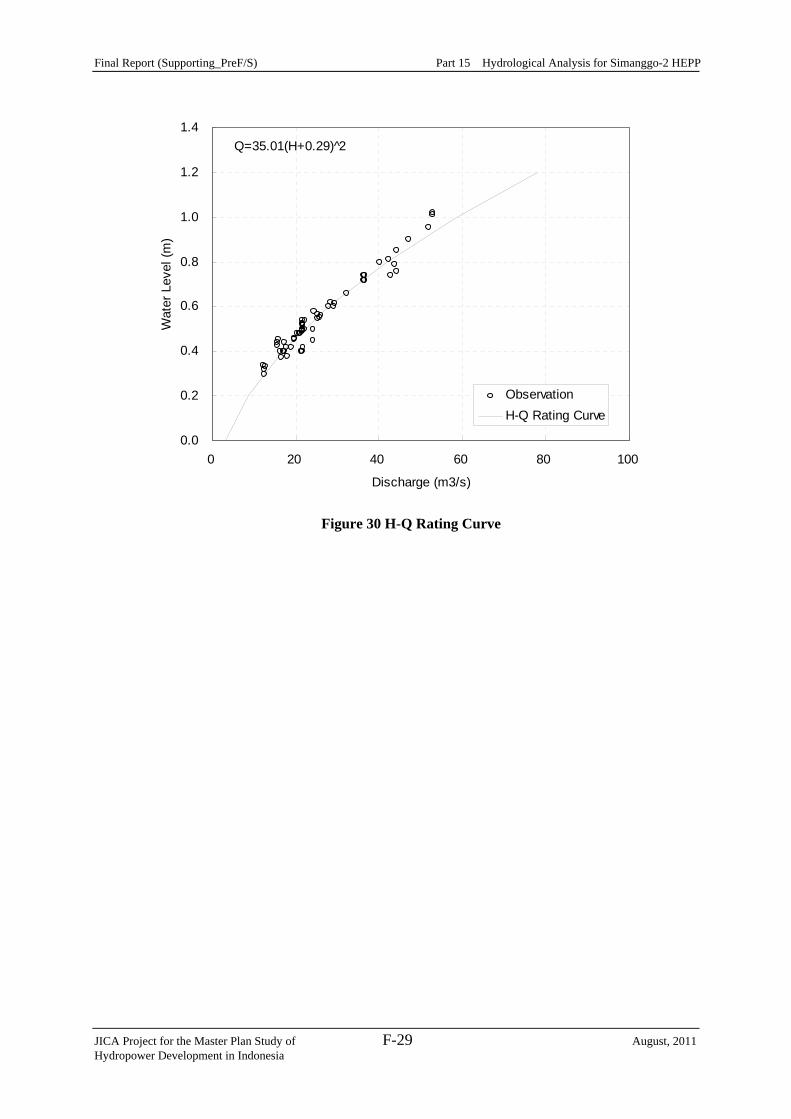
Final Report (Supporting_PreF/S) Part 15 Hydrological Analysis for Simanggo-2 HEPP
JICA Project for the Master Plan Study of F-29 August, 2011 Hydropower Development in Indonesia
0.0
0.2
0.4
0.6
0.8
1.0
1.2
1.4
0 20 40 60 80 100
Discharge (m3/s)
Wat
er L
evel
(m)
ObservationH-Q Rating Curve
Q=35.01(H+0.29)^2
Figure 30 H-Q Rating Curve
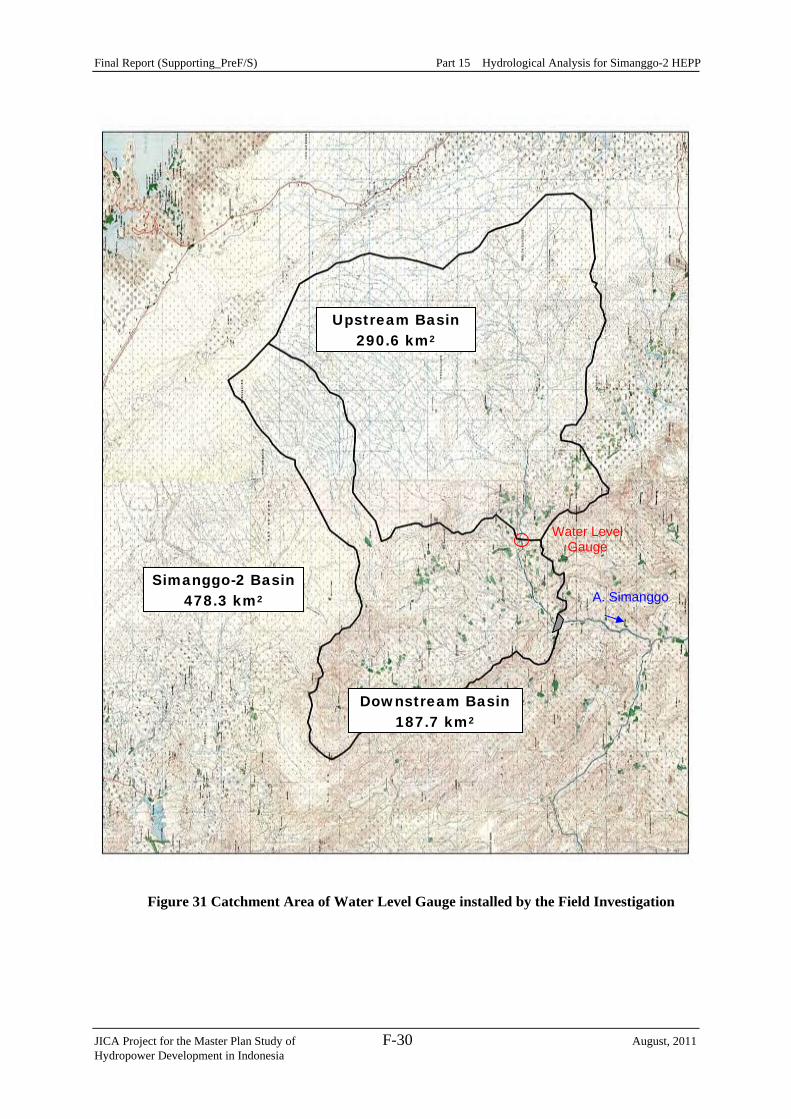
Final Report (Supporting_PreF/S) Part 15 Hydrological Analysis for Simanggo-2 HEPP
JICA Project for the Master Plan Study of F-30 August, 2011 Hydropower Development in Indonesia
Figure 31 Catchment Area of Water Level Gauge installed by the Field Investigation
A. Simanggo
Water Level Gauge
Simanggo-2 Basin 478.3 km2
Upstream Basin 290.6 km2
Downstream Basin 187.7 km2
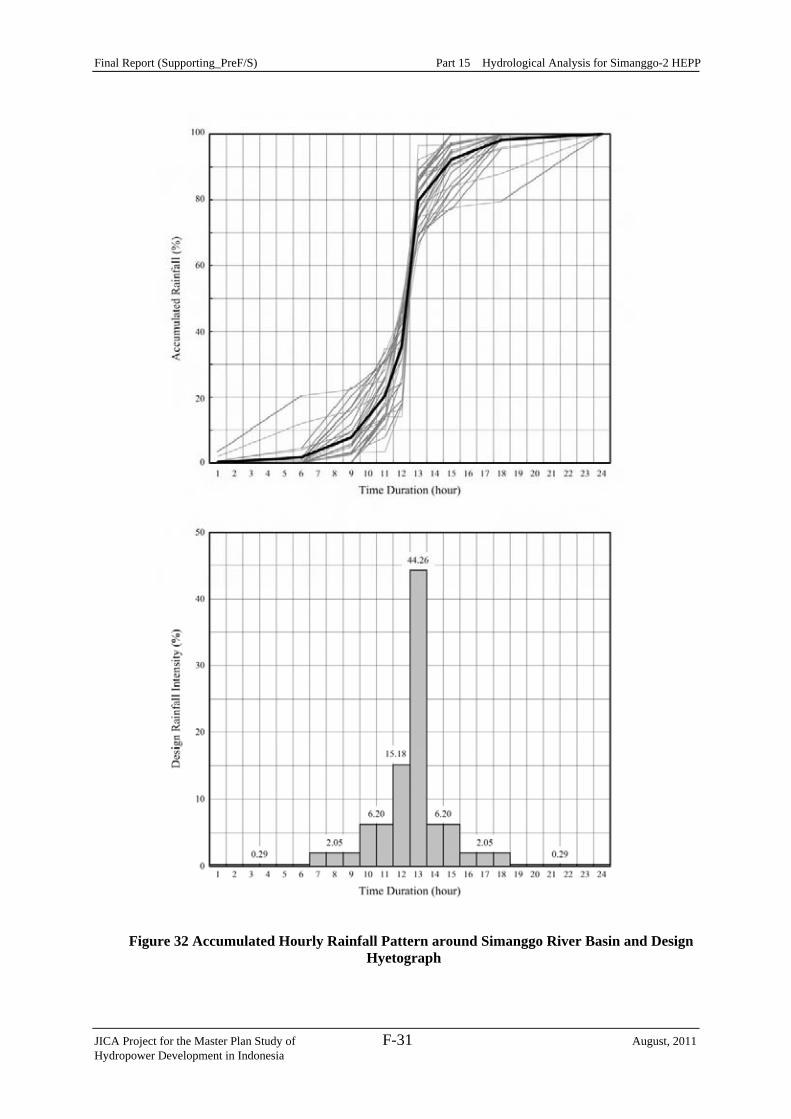
Final Report (Supporting_PreF/S) Part 15 Hydrological Analysis for Simanggo-2 HEPP
JICA Project for the Master Plan Study of F-31 August, 2011 Hydropower Development in Indonesia
Figure 32 Accumulated Hourly Rainfall Pattern around Simanggo River Basin and Design Hyetograph
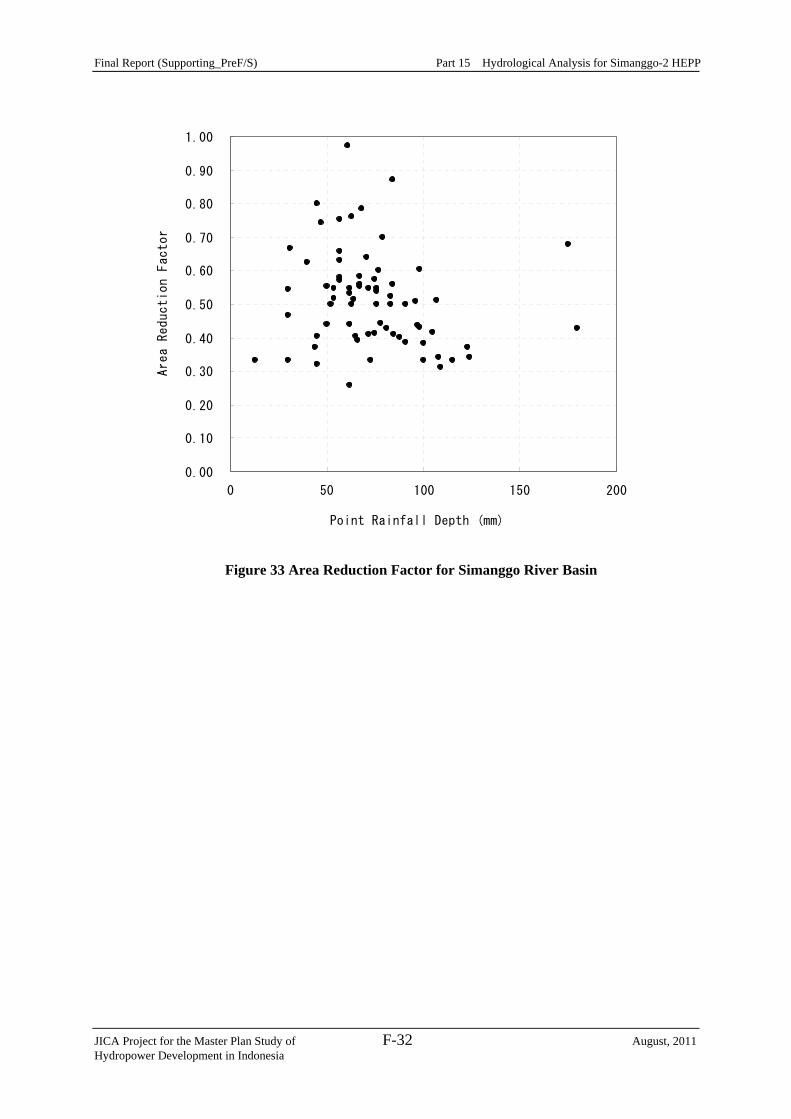
Final Report (Supporting_PreF/S) Part 15 Hydrological Analysis for Simanggo-2 HEPP
JICA Project for the Master Plan Study of F-32 August, 2011 Hydropower Development in Indonesia
0.00
0.10
0.20
0.30
0.40
0.50
0.60
0.70
0.80
0.90
1.00
0 50 100 150 200
Point Rainfall Depth (mm)
Area Reduction Factor
Figure 33 Area Reduction Factor for Simanggo River Basin
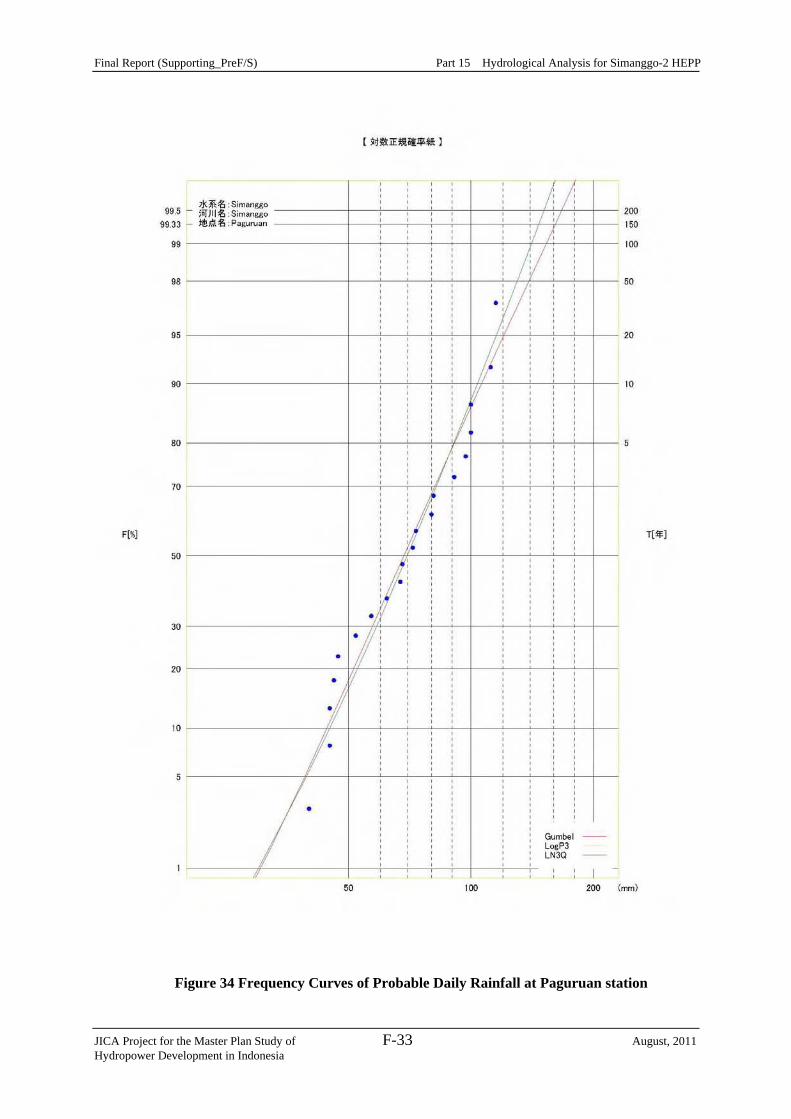
Final Report (Supporting_PreF/S) Part 15 Hydrological Analysis for Simanggo-2 HEPP
JICA Project for the Master Plan Study of F-33 August, 2011 Hydropower Development in Indonesia
Figure 34 Frequency Curves of Probable Daily Rainfall at Paguruan station
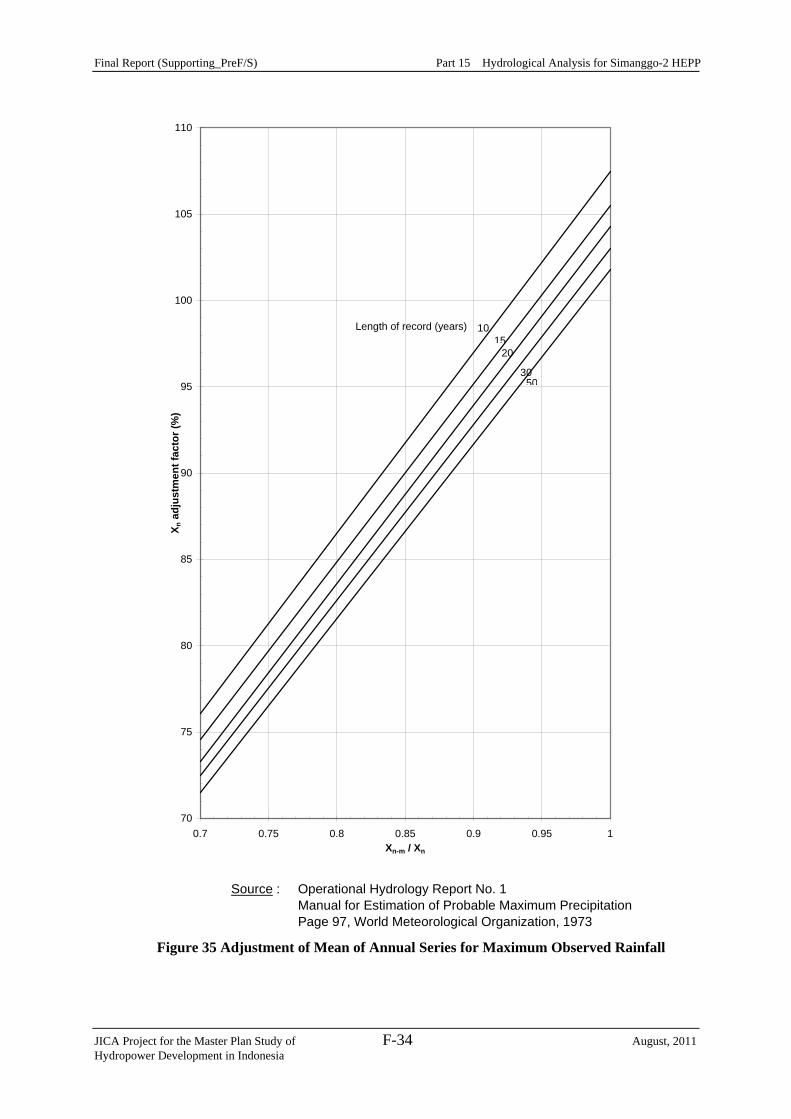
Final Report (Supporting_PreF/S) Part 15 Hydrological Analysis for Simanggo-2 HEPP
JICA Project for the Master Plan Study of F-34 August, 2011 Hydropower Development in Indonesia
Source : Operational Hydrology Report No. 1Manual for Estimation of Probable Maximum PrecipitationPage 97, World Meteorological Organization, 1973
70
75
80
85
90
95
100
105
110
0.7 0.75 0.8 0.85 0.9 0.95 1Xn-m / Xn
X n a
djus
tmen
t fac
tor (
%)
10Length of record (years)15
20
3050
Figure 35 Adjustment of Mean of Annual Series for Maximum Observed Rainfall
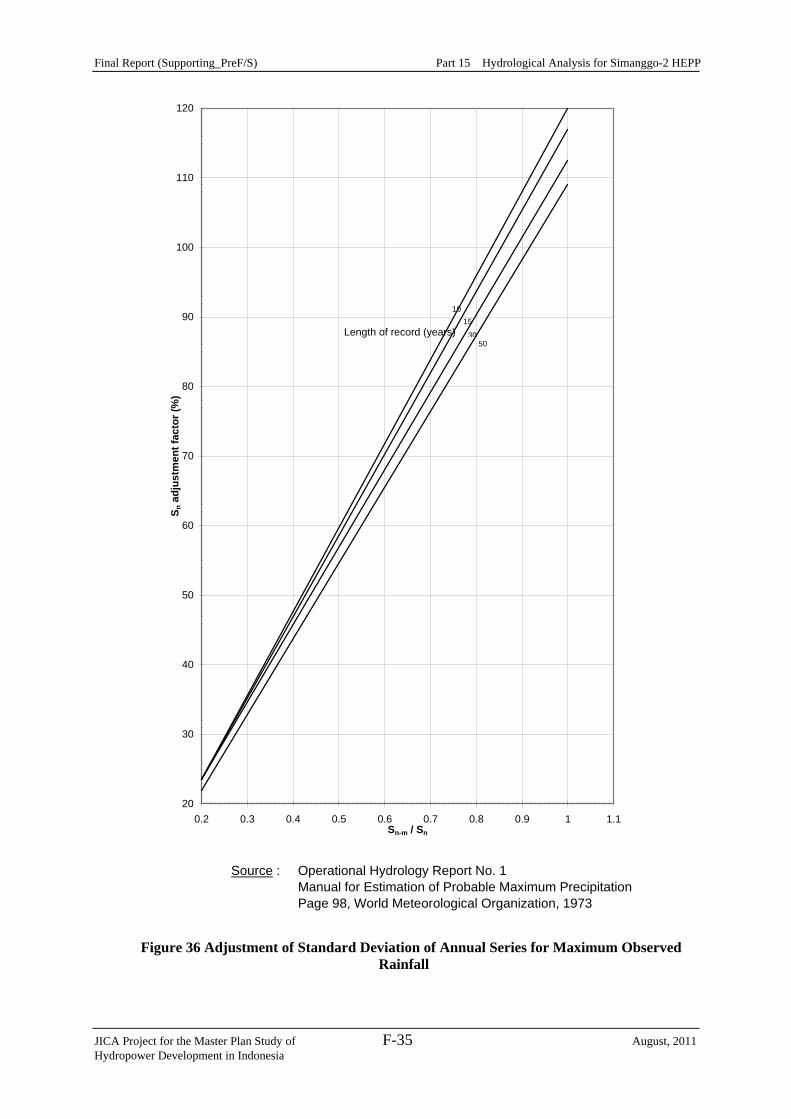
Final Report (Supporting_PreF/S) Part 15 Hydrological Analysis for Simanggo-2 HEPP
JICA Project for the Master Plan Study of F-35 August, 2011 Hydropower Development in Indonesia
Source : Operational Hydrology Report No. 1Manual for Estimation of Probable Maximum PrecipitationPage 98, World Meteorological Organization, 1973
20
30
40
50
60
70
80
90
100
110
120
0.2 0.3 0.4 0.5 0.6 0.7 0.8 0.9 1 1.1Sn-m / Sn
S n a
djus
tmen
t fac
tor (
%)
10
Length of record (years)15
3050
Figure 36 Adjustment of Standard Deviation of Annual Series for Maximum Observed Rainfall

Final Report (Supporting_PreF/S) Part 15 Hydrological Analysis for Simanggo-2 HEPP
JICA Project for the Master Plan Study of F-36 August, 2011 Hydropower Development in Indonesia
Source : Operational Hydrology Report No. 1Manual for Estimation of Probable Maximum PrecipitationPage 99, World Meteorological Organization, 1973
100
105
110
115
120
125
130
10 15 20 25 30 35 40 45 50 55
Length of Record (years)
Adj
ustm
ent F
acto
r (%
)
Standard Deviation
Mean
Figure 37 Adjustment of Mean and Standard Deviation of Annual Series for Length of Record
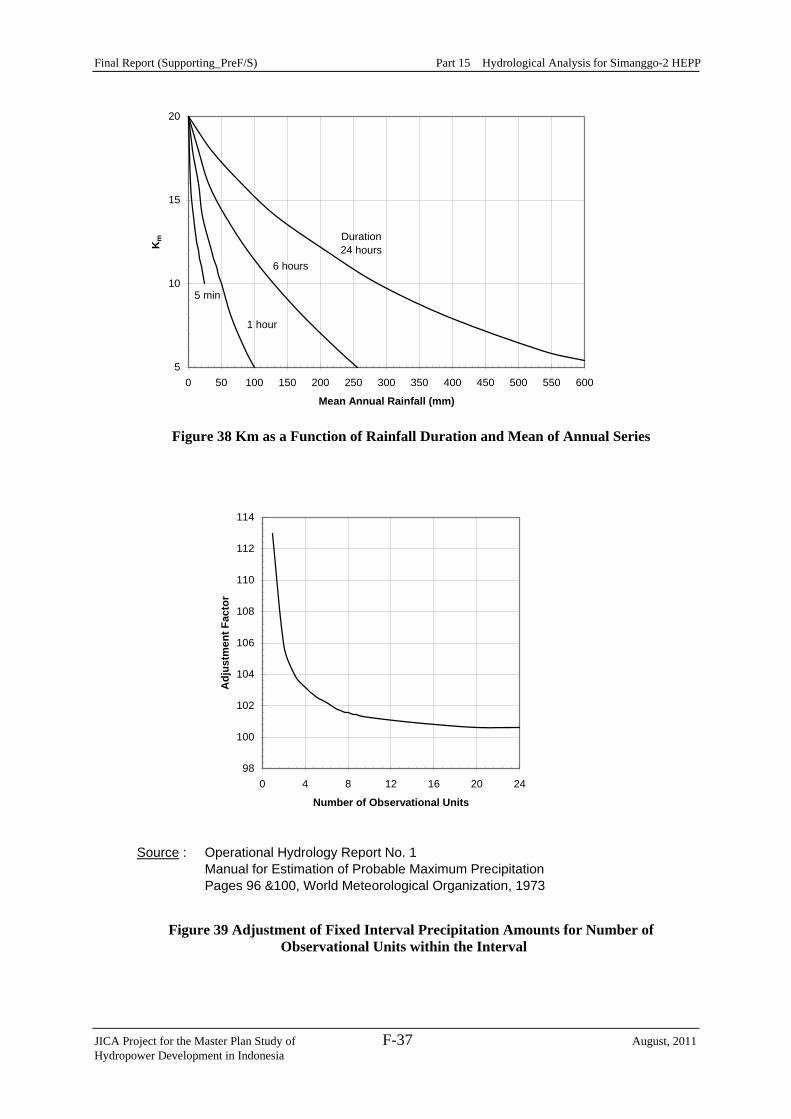
Final Report (Supporting_PreF/S) Part 15 Hydrological Analysis for Simanggo-2 HEPP
JICA Project for the Master Plan Study of F-37 August, 2011 Hydropower Development in Indonesia
5
10
15
20
0 50 100 150 200 250 300 350 400 450 500 550 600
Mean Annual Rainfall (mm)
Km Duration
24 hours6 hours
1 hour
5 min
Figure 38 Km as a Function of Rainfall Duration and Mean of Annual Series
Source : Operational Hydrology Report No. 1Manual for Estimation of Probable Maximum PrecipitationPages 96 &100, World Meteorological Organization, 1973
98
100
102
104
106
108
110
112
114
0 4 8 12 16 20 24
Number of Observational Units
Adj
ustm
ent F
acto
r
Figure 39 Adjustment of Fixed Interval Precipitation Amounts for Number of Observational Units within the Interval
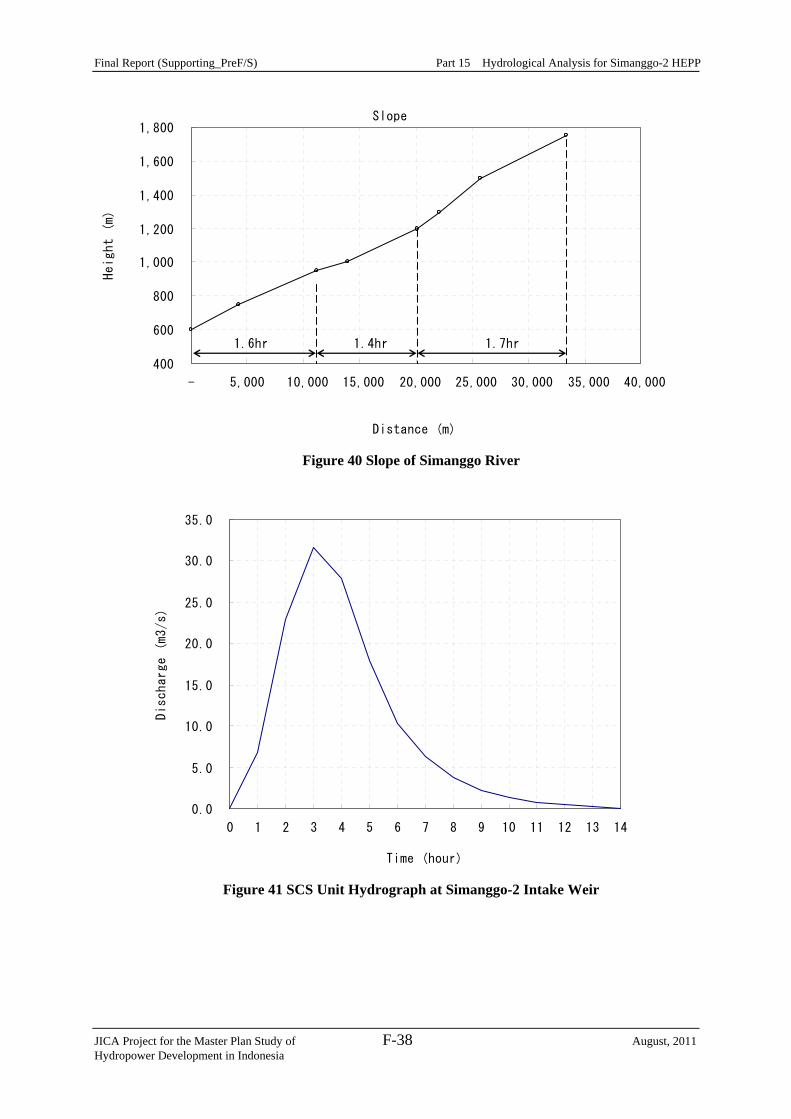
Final Report (Supporting_PreF/S) Part 15 Hydrological Analysis for Simanggo-2 HEPP
JICA Project for the Master Plan Study of F-38 August, 2011 Hydropower Development in Indonesia
Slope
400
600
800
1,000
1,200
1,400
1,600
1,800
- 5,000 10,000 15,000 20,000 25,000 30,000 35,000 40,000
Distance (m)
Height (m)
1.6hr 1.4hr 1.7hr
Figure 40 Slope of Simanggo River
0.0
5.0
10.0
15.0
20.0
25.0
30.0
35.0
0 1 2 3 4 5 6 7 8 9 10 11 12 13 14
Time (hour)
Discharge (m3/s)
Figure 41 SCS Unit Hydrograph at Simanggo-2 Intake Weir
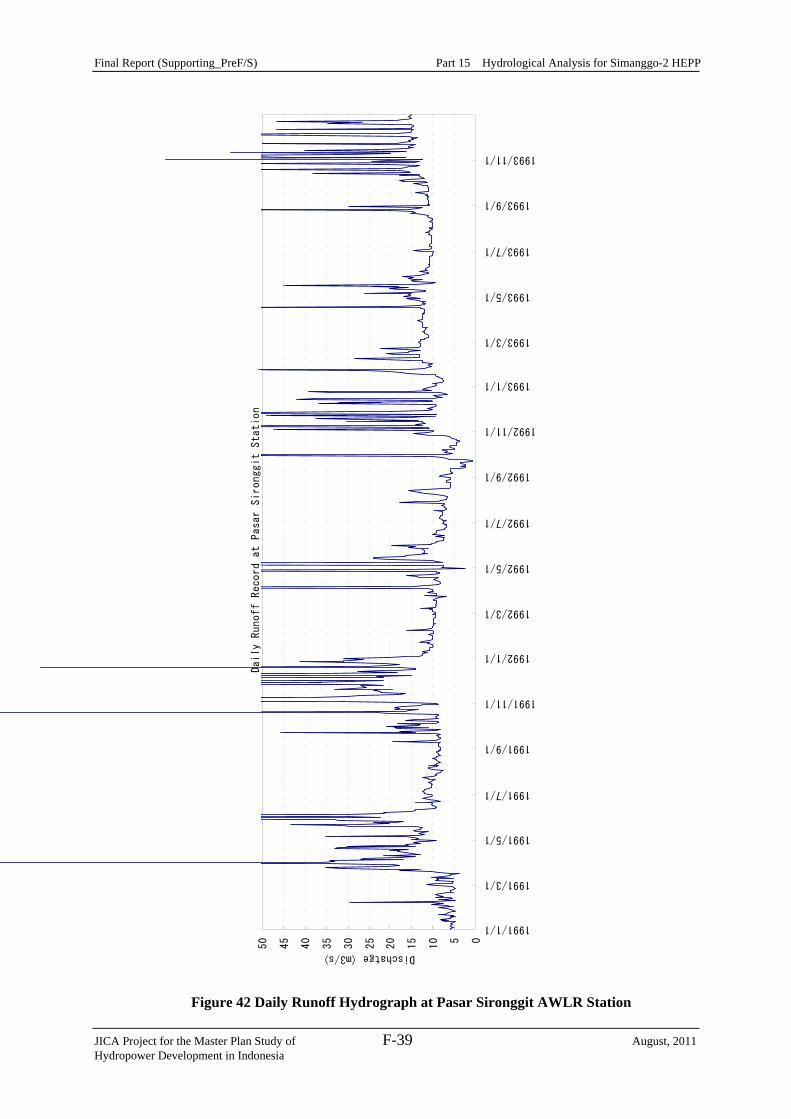
Final Report (Supporting_PreF/S) Part 15 Hydrological Analysis for Simanggo-2 HEPP
JICA Project for the Master Plan Study of F-39 August, 2011 Hydropower Development in Indonesia
Figure 42 Daily Runoff Hydrograph at Pasar Sironggit AWLR Station
Daily Runoff Record at Pasar Sironggit Station
05
10
15
20
25
30
35
40
45
50
1991/1/1
1991/3/1
1991/5/1
1991/7/1
1991/9/1
1991/11/1
1992/1/1
1992/3/1
1992/5/1
1992/7/1
1992/9/1
1992/11/1
1993/1/1
1993/3/1
1993/5/1
1993/7/1
1993/9/1
1993/11/1
Dischatge (m3/s)
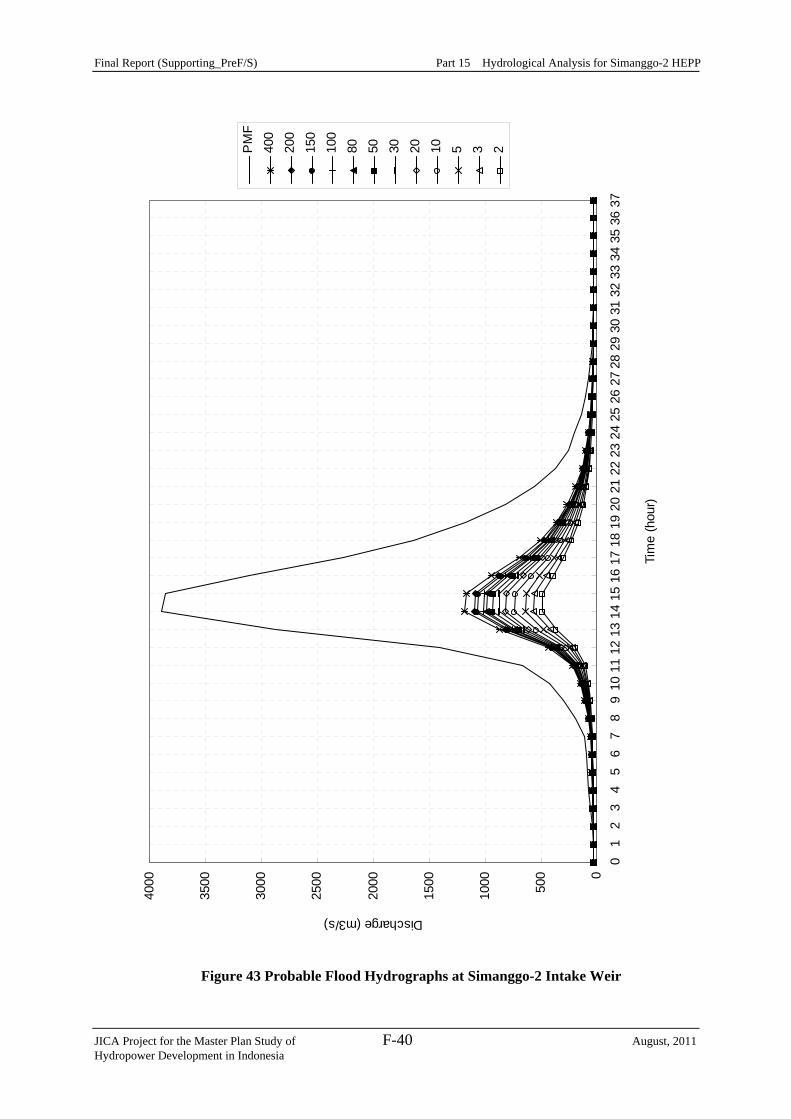
Final Report (Supporting_PreF/S) Part 15 Hydrological Analysis for Simanggo-2 HEPP
JICA Project for the Master Plan Study of F-40 August, 2011 Hydropower Development in Indonesia
Figure 43 Probable Flood Hydrographs at Simanggo-2 Intake Weir
0
500
1000
1500
2000
2500
3000
3500
4000
01
23
45
67
89
1011
1213
1415
1617
1819
2021
2223
2425
2627
2829
3031
3233
3435
3637
Tim
e (h
our)
Discharge (m3/s)
PM
F40
020
015
010
080 50 30 20 10 5 3 2
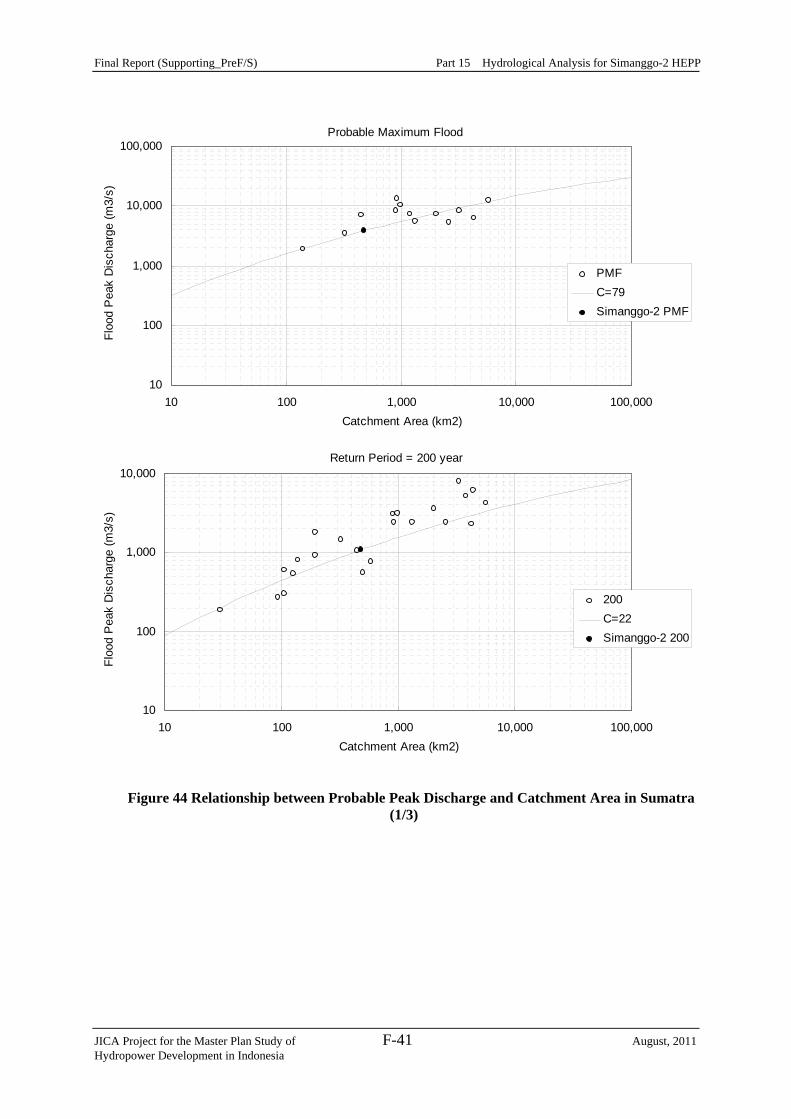
Final Report (Supporting_PreF/S) Part 15 Hydrological Analysis for Simanggo-2 HEPP
JICA Project for the Master Plan Study of F-41 August, 2011 Hydropower Development in Indonesia
Probable Maximum Flood
10
100
1,000
10,000
100,000
10 100 1,000 10,000 100,000Catchment Area (km2)
Floo
d P
eak
Dis
char
ge (m
3/s)
PMFC=79Simanggo-2 PMF
Return Period = 200 year
10
100
1,000
10,000
10 100 1,000 10,000 100,000Catchment Area (km2)
Floo
d P
eak
Dis
char
ge (m
3/s)
200C=22Simanggo-2 200
Figure 44 Relationship between Probable Peak Discharge and Catchment Area in Sumatra (1/3)
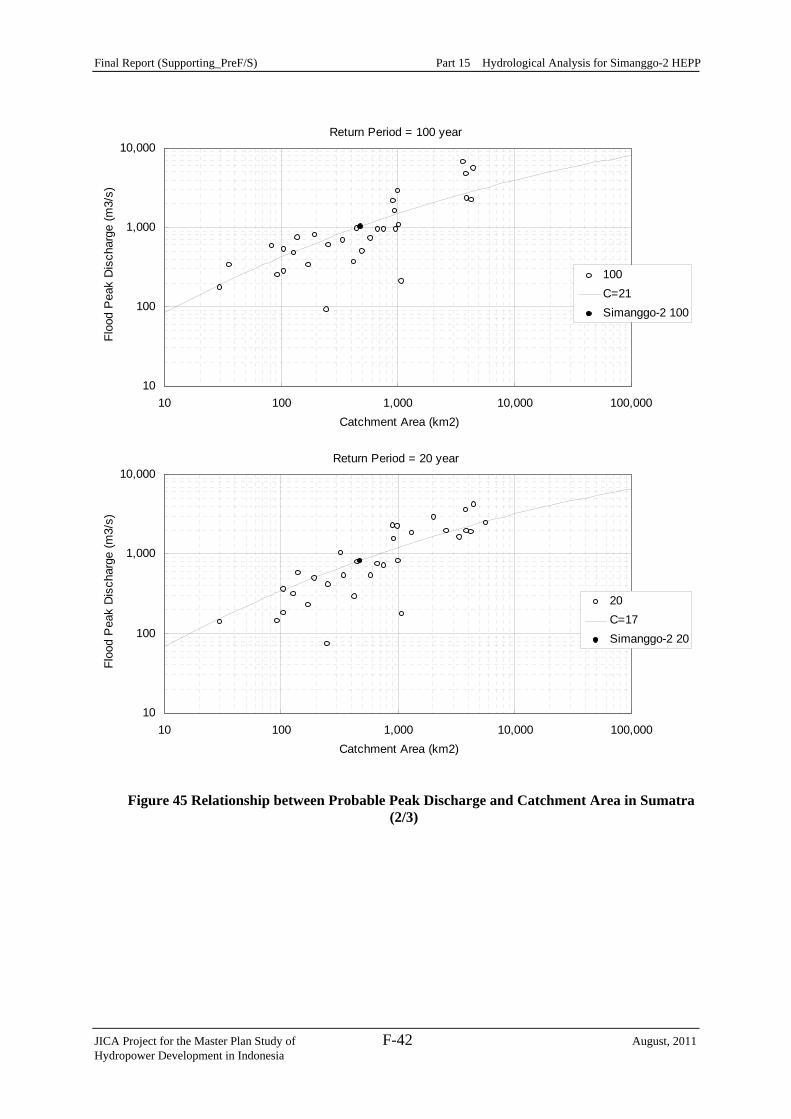
Final Report (Supporting_PreF/S) Part 15 Hydrological Analysis for Simanggo-2 HEPP
JICA Project for the Master Plan Study of F-42 August, 2011 Hydropower Development in Indonesia
Return Period = 100 year
10
100
1,000
10,000
10 100 1,000 10,000 100,000Catchment Area (km2)
Floo
d P
eak
Dis
char
ge (m
3/s)
100C=21Simanggo-2 100
Return Period = 20 year
10
100
1,000
10,000
10 100 1,000 10,000 100,000Catchment Area (km2)
Floo
d P
eak
Dis
char
ge (m
3/s)
20C=17Simanggo-2 20
Figure 45 Relationship between Probable Peak Discharge and Catchment Area in Sumatra (2/3)
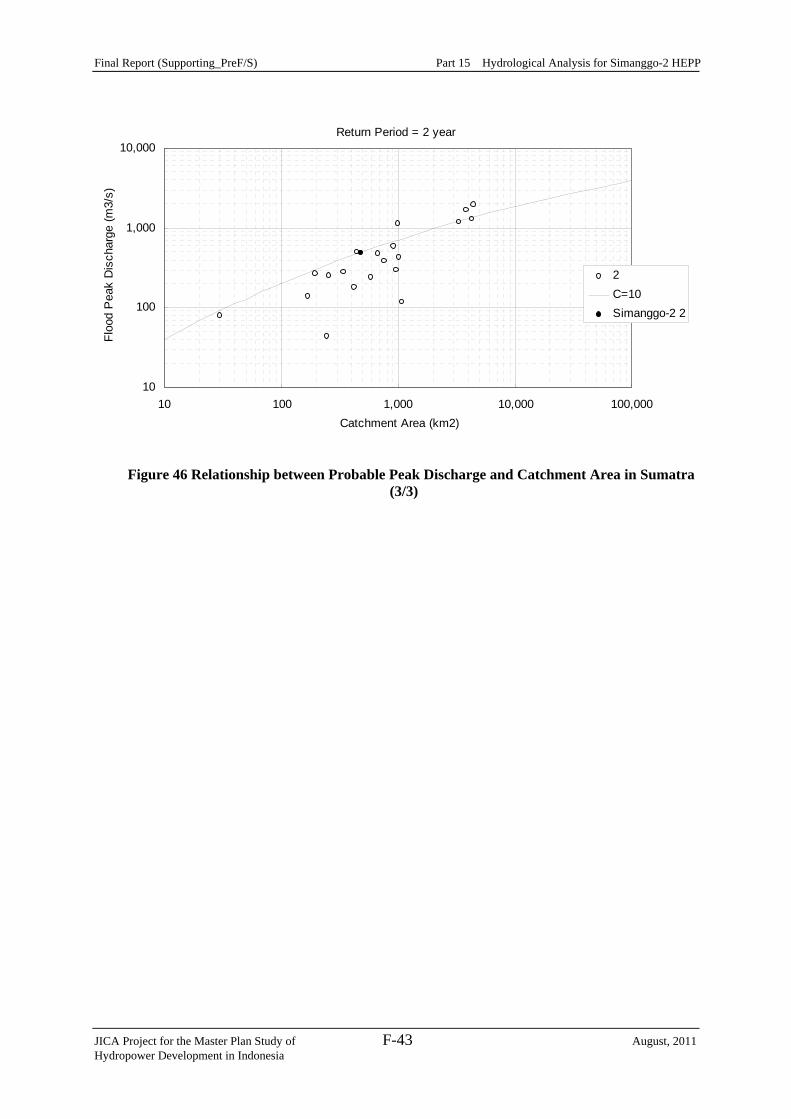
Final Report (Supporting_PreF/S) Part 15 Hydrological Analysis for Simanggo-2 HEPP
JICA Project for the Master Plan Study of F-43 August, 2011 Hydropower Development in Indonesia
Return Period = 2 year
10
100
1,000
10,000
10 100 1,000 10,000 100,000Catchment Area (km2)
Floo
d P
eak
Dis
char
ge (m
3/s)
2C=10Simanggo-2 2
Figure 46 Relationship between Probable Peak Discharge and Catchment Area in Sumatra (3/3)
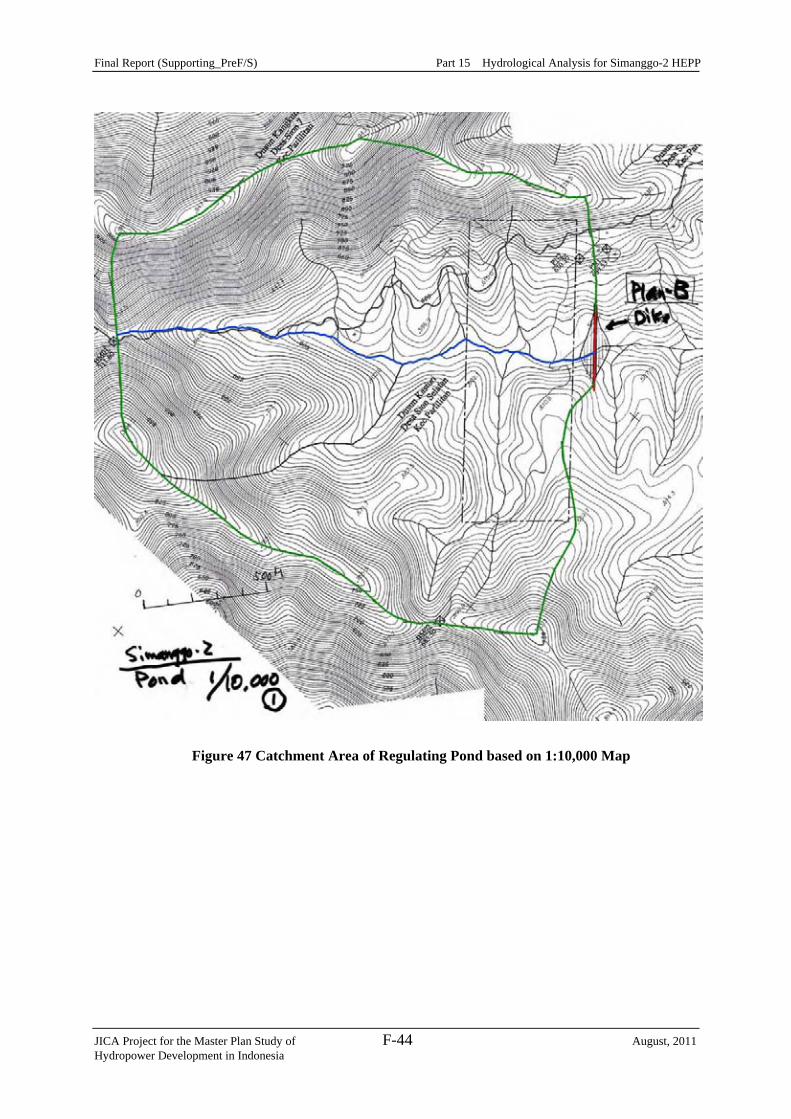
Final Report (Supporting_PreF/S) Part 15 Hydrological Analysis for Simanggo-2 HEPP
JICA Project for the Master Plan Study of F-44 August, 2011 Hydropower Development in Indonesia
Figure 47 Catchment Area of Regulating Pond based on 1:10,000 Map
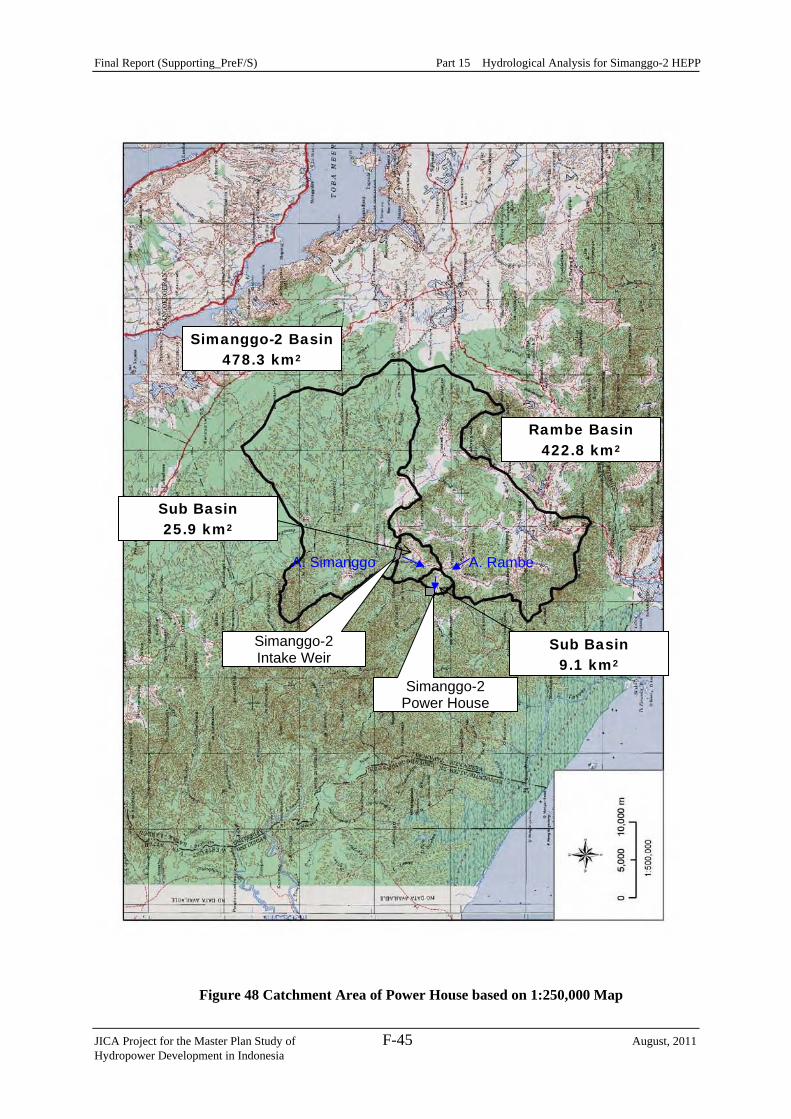
Final Report (Supporting_PreF/S) Part 15 Hydrological Analysis for Simanggo-2 HEPP
JICA Project for the Master Plan Study of F-45 August, 2011 Hydropower Development in Indonesia
Figure 48 Catchment Area of Power House based on 1:250,000 Map
Simanggo-2 Basin 478.3 km2
A. Simanggo
Simanggo-2 Power House
A. Rambe
Simanggo-2 Intake Weir
Rambe Basin 422.8 km2
Sub Basin 25.9 km2
Sub Basin 9.1 km2
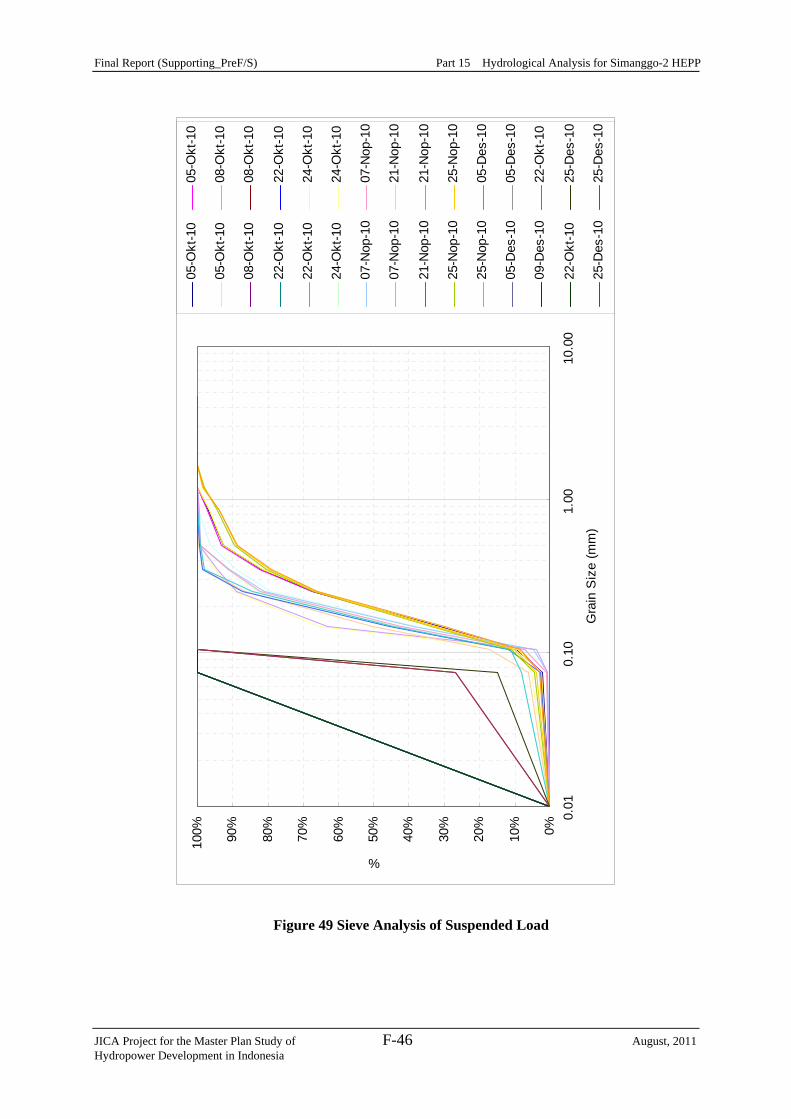
Final Report (Supporting_PreF/S) Part 15 Hydrological Analysis for Simanggo-2 HEPP
JICA Project for the Master Plan Study of F-46 August, 2011 Hydropower Development in Indonesia
Figure 49 Sieve Analysis of Suspended Load
0%10%
20%
30%
40%
50%
60%
70%
80%
90%
100%
0.01
0.10
1.00
10.0
0
Gra
in S
ize
(mm
)
%
05-O
kt-1
005
-Okt
-10
05-O
kt-1
008
-Okt
-10
08-O
kt-1
008
-Okt
-10
22-O
kt-1
022
-Okt
-10
22-O
kt-1
024
-Okt
-10
24-O
kt-1
024
-Okt
-10
07-N
op-1
007
-Nop
-10
07-N
op-1
021
-Nop
-10
21-N
op-1
021
-Nop
-10
25-N
op-1
025
-Nop
-10
25-N
op-1
005
-Des
-10
05-D
es-1
005
-Des
-10
09-D
es-1
022
-Okt
-10
22-O
kt-1
025
-Des
-10
25-D
es-1
025
-Des
-10
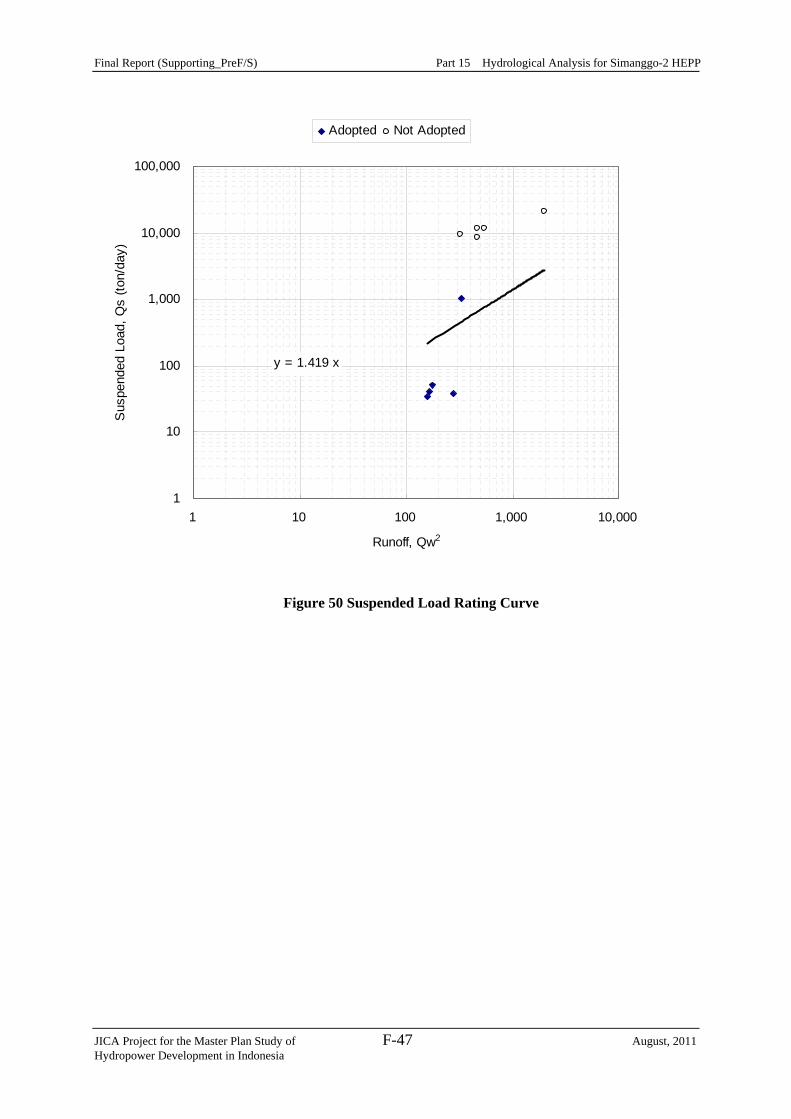
Final Report (Supporting_PreF/S) Part 15 Hydrological Analysis for Simanggo-2 HEPP
JICA Project for the Master Plan Study of F-47 August, 2011 Hydropower Development in Indonesia
y = 1.419 x
1
10
100
1,000
10,000
100,000
1 10 100 1,000 10,000
Runoff, Qw2
Sus
pend
ed L
oad,
Qs
(ton/
day)
Adopted Not Adopted
Figure 50 Suspended Load Rating Curve