Embed Size (px)
Citation preview
Parental Background and Children’s Human Capital
Development Throughout Childhood and Adolescence: Evidence from Four Low- and Middle-
Income Countries
Andreas Georgiadis Young Lives Study
Department of International Development University of Oxford
CSAE Conference
19 March 2012
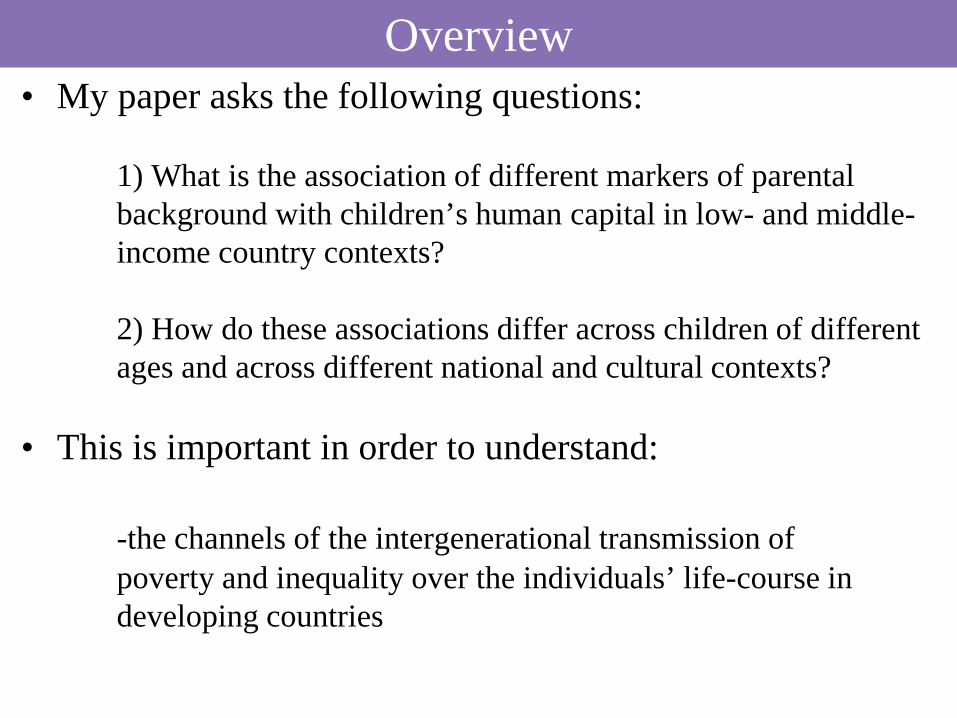
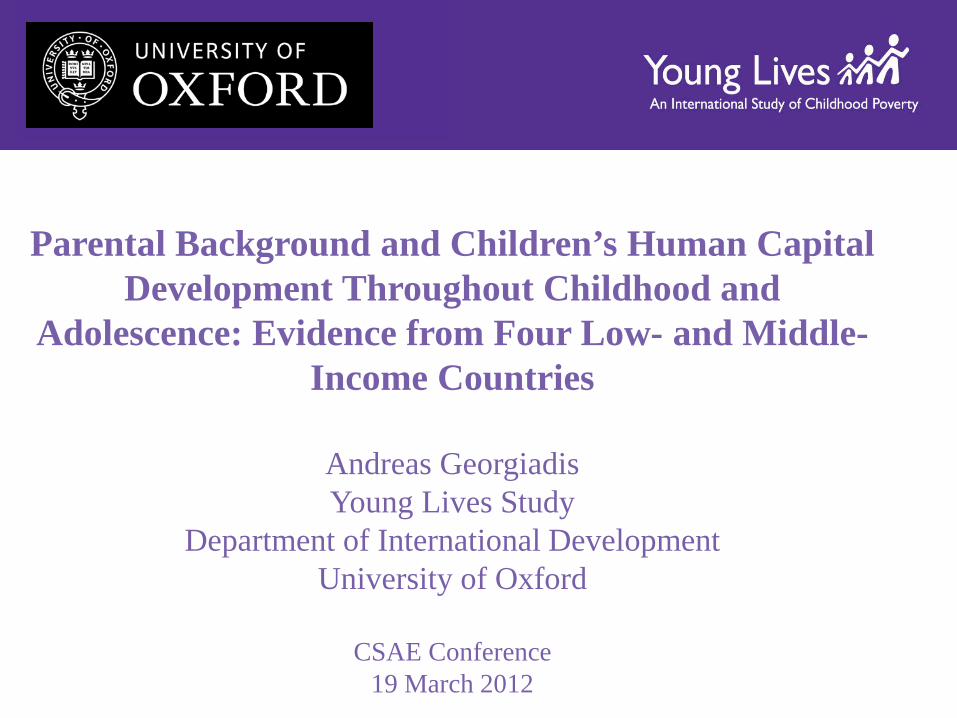
• My paper asks the following questions: 1) What is the association of different markers of parental background with children’s human capital in low- and middle- income country contexts? 2) How do these associations differ across children of different ages and across different national and cultural contexts? • This is important in order to understand: -the channels of the intergenerational transmission of poverty and inequality over the individuals’ life-course in developing countries
Overview
• There are the following gaps in existing work: 1) there is not much evidence on the association of SES with child’s cognitive and non-cognitive skills 2) the vast majority of empirical studies consider parental background factors in isolation that makes the interpretation of results uncertain 3) evidence on the evolution of the association between parental background factors and child’s human capital over the child’s life-course are almost non-existent
Overview
• We address the gaps in existing work by: 1) using data from the Young Lives cohort study in Ethiopia, India, Peru and Vietnam 2) considering, simultaneously, the association of a wide-range of parental background dimensions with measures of children’s human capital at different ages of the child’s life-course
Overview
• We find evidence that: -parental income is the most important predictor of child’s nutritional status and cognitive achievement across countries and at all stages of childhood -parental education has a weak or no association with children’s human capital measures -mother’s personality traits are the most important predictors of children’s noncognitive skills across countries and at all stages of childhood -the association of mother’s aspirations for child’s education with the child’s cognitive and noncognitive skills increases with children’s age
Overview
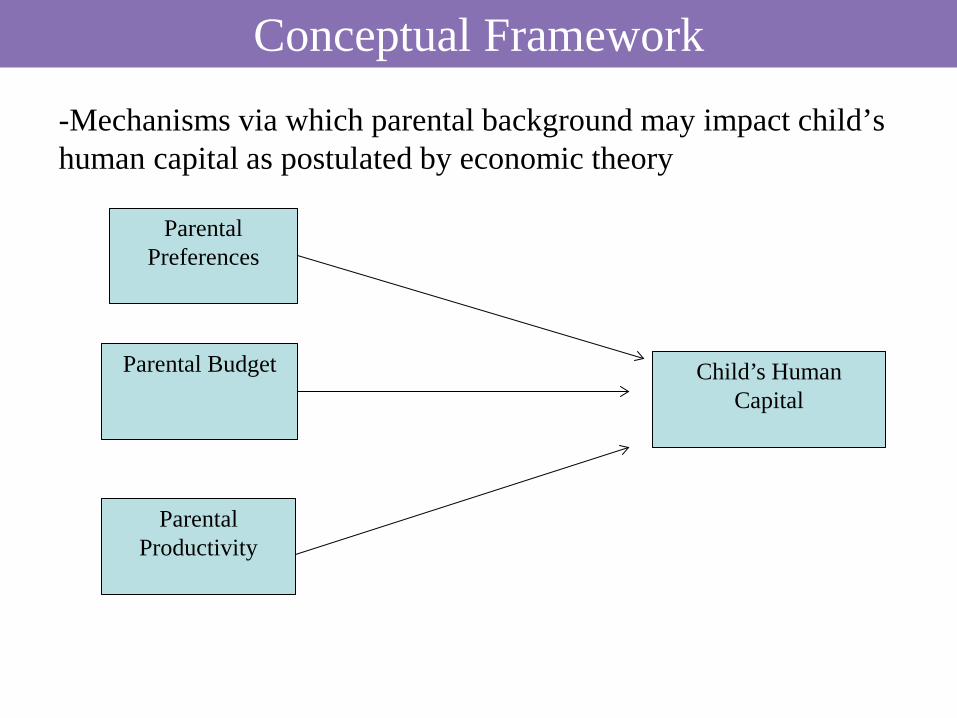
-Mechanisms via which parental background may impact child’s human capital as postulated by economic theory
Conceptual Framework
Parental Budget
Parental Preferences
Parental Productivity
Child’s Human Capital
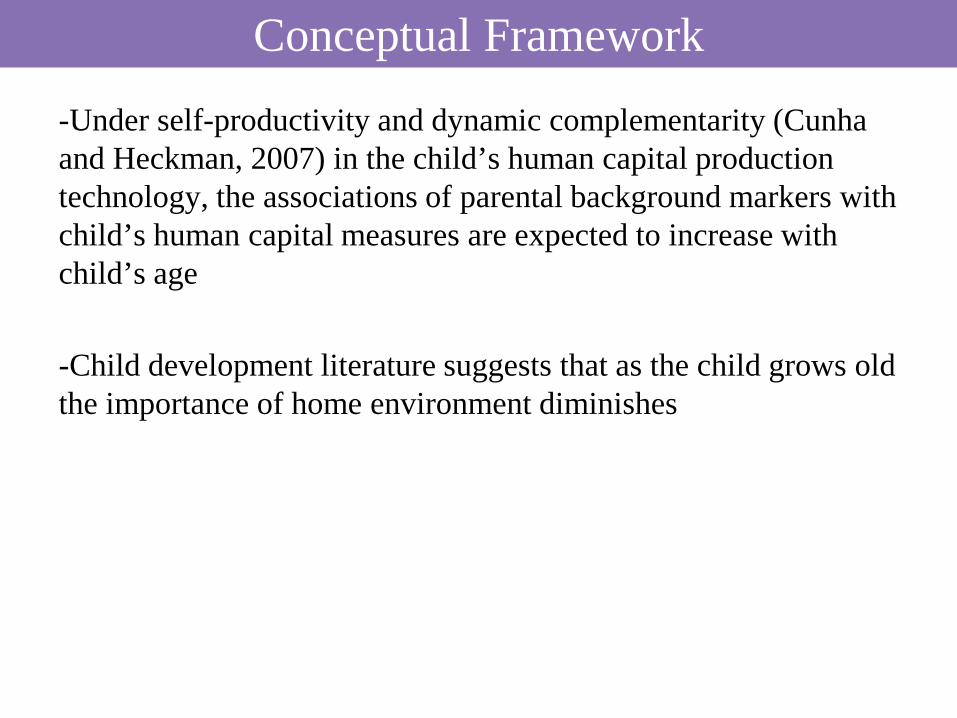
-Under self-productivity and dynamic complementarity (Cunha and Heckman, 2007) in the child’s human capital production technology, the associations of parental background markers with child’s human capital measures are expected to increase with child’s age -Child development literature suggests that as the child grows old the importance of home environment diminishes
Conceptual Framework
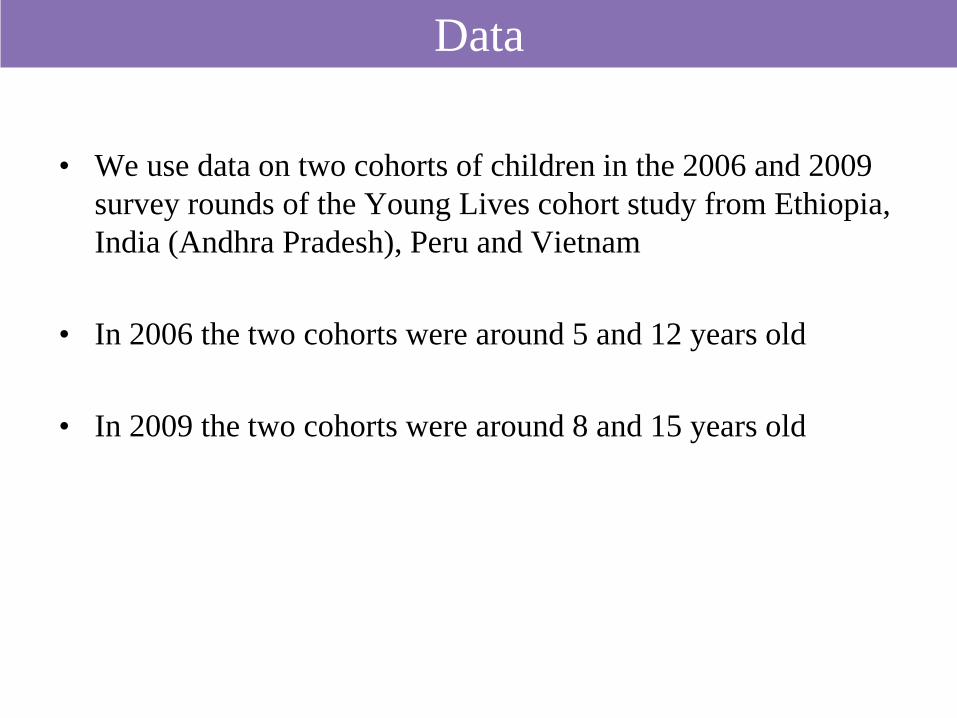
• We use data on two cohorts of children in the 2006 and 2009
survey rounds of the Young Lives cohort study from Ethiopia, India (Andhra Pradesh), Peru and Vietnam
• In 2006 the two cohorts were around 5 and 12 years old • In 2009 the two cohorts were around 8 and 15 years old
Data
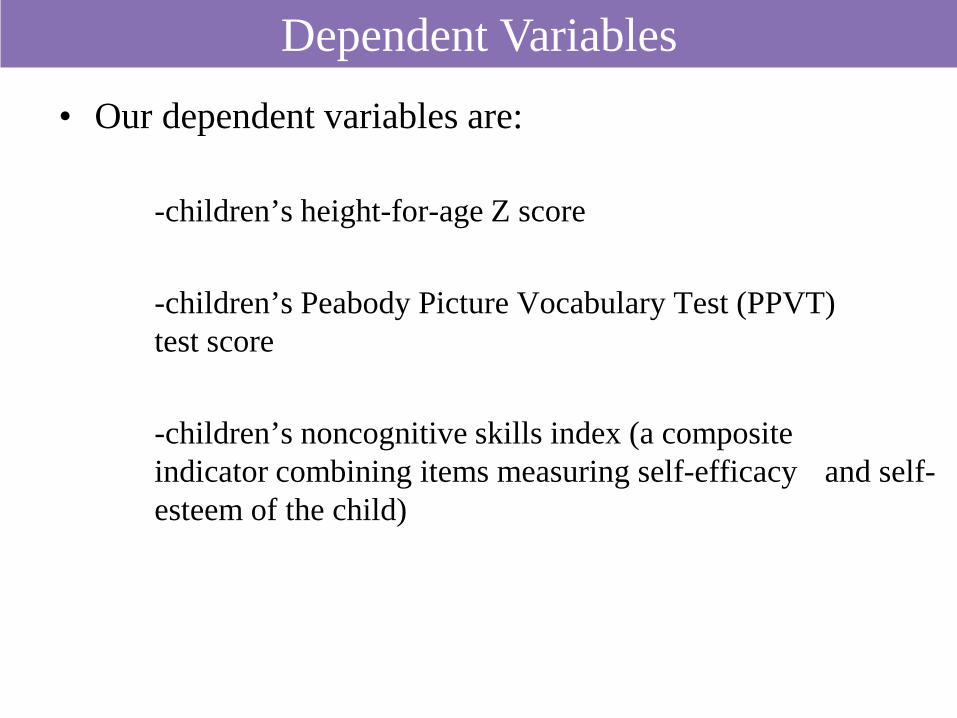
• Our dependent variables are: -children’s height-for-age Z score -children’s Peabody Picture Vocabulary Test (PPVT) test score -children’s noncognitive skills index (a composite indicator combining items measuring self-efficacy and self- esteem of the child)
Dependent Variables
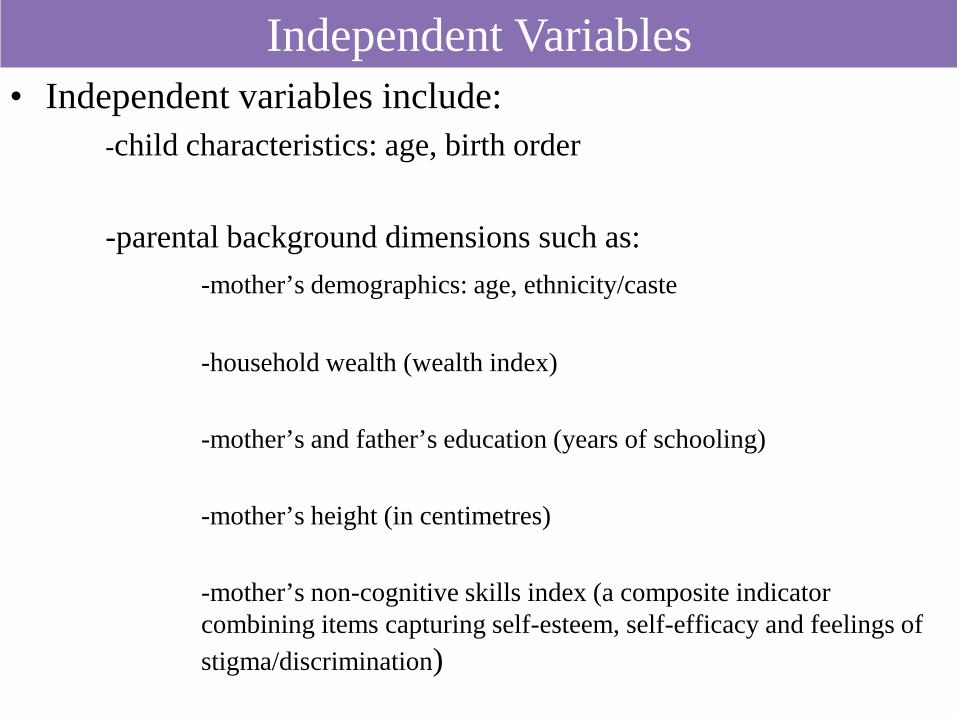
• Independent variables include: -child characteristics: age, birth order -parental background dimensions such as: -mother’s demographics: age, ethnicity/caste -household wealth (wealth index) -mother’s and father’s education (years of schooling) -mother’s height (in centimetres) -mother’s non-cognitive skills index (a composite indicator combining items capturing self-esteem, self-efficacy and feelings of stigma/discrimination)
Independent Variables
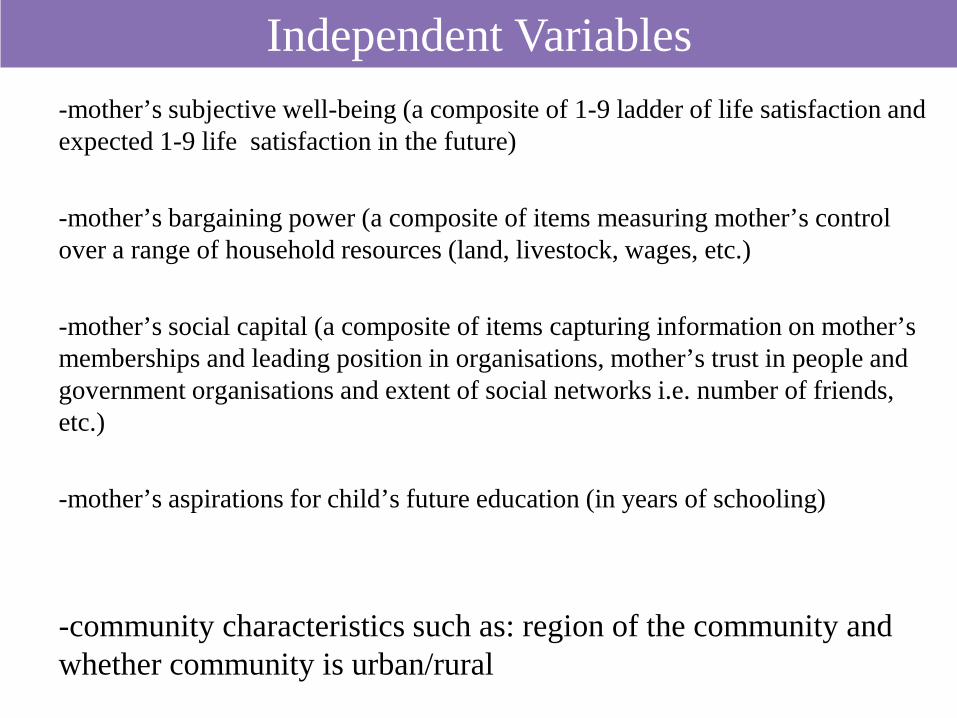
-mother’s subjective well-being (a composite of 1-9 ladder of life satisfaction and expected 1-9 life satisfaction in the future) -mother’s bargaining power (a composite of items measuring mother’s control over a range of household resources (land, livestock, wages, etc.) -mother’s social capital (a composite of items capturing information on mother’s memberships and leading position in organisations, mother’s trust in people and government organisations and extent of social networks i.e. number of friends, etc.) -mother’s aspirations for child’s future education (in years of schooling)
-community characteristics such as: region of the community and whether community is urban/rural
Independent Variables
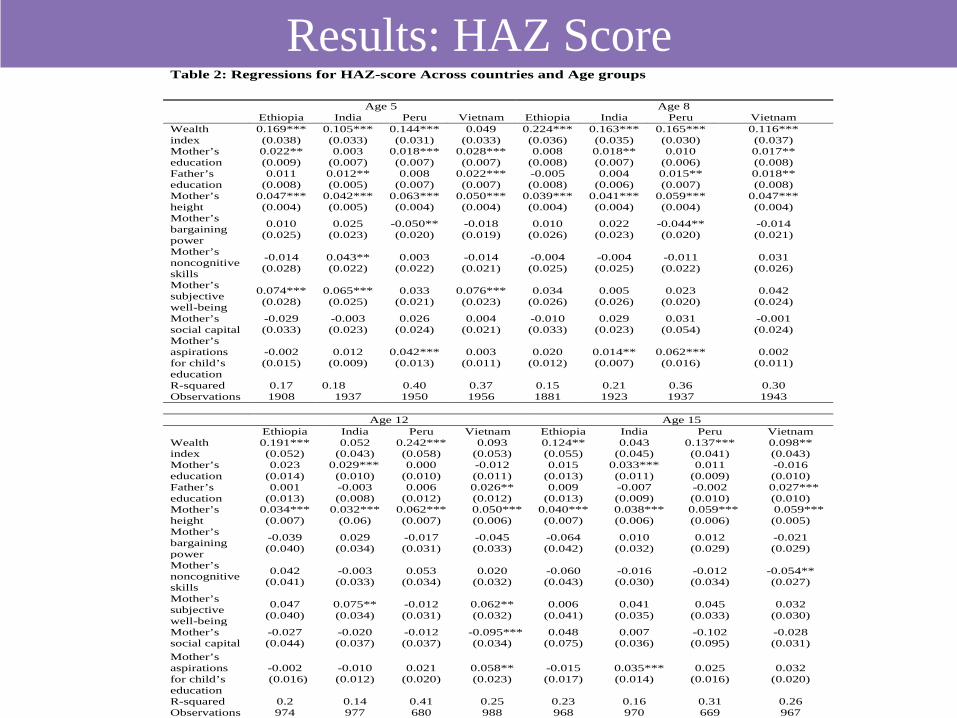
Results: HAZ Score
Table 2: Regressions for HAZ-score Across countries and Age groups
Age 5 Age 8 Ethiopia India Peru Vietnam Ethiopia India Peru Vietnam Wealth index
0.169*** 0.105*** 0.144*** 0.049 0.224*** 0.163*** 0.165*** 0.116*** (0.038) (0.033) (0.031) (0.033) (0.036) (0.035) (0.030) (0.037)
Mother’s education
0.022** 0.003 0.018*** 0.028*** 0.008 0.018** 0.010 0.017** (0.009) (0.007) (0.007) (0.007) (0.008) (0.007) (0.006) (0.008)
Father’s education
0.011 0.012** 0.008 0.022*** -0.005 0.004 0.015** 0.018** (0.008) (0.005) (0.007) (0.007) (0.008) (0.006) (0.007) (0.008)
Mother’s height
0.047*** 0.042*** 0.063*** 0.050*** 0.039*** 0.041*** 0.059*** 0.047*** (0.004) (0.005) (0.004) (0.004) (0.004) (0.004) (0.004) (0.004)
Mother’s bargaining power
0.010 (0.025)
0.025 (0.023)
-0.050** (0.020)
-0.018 (0.019)
0.010 (0.026)
0.022 (0.023)
-0.044** (0.020)
-0.014 (0.021)
Mother’s noncognitive skills
-0.014 (0.028)
0.043** (0.022)
0.003 (0.022)
-0.014 (0.021)
-0.004 (0.025)
-0.004 (0.025)
-0.011 (0.022)
0.031 (0.026)
Mother’s subjective well-being
0.074***(0.028)
0.065*** (0.025)
0.033 (0.021)
0.076*** (0.023)
0.034 (0.026)
0.005 (0.026)
0.023 (0.020)
0.042 (0.024)
Mother’s social capital
-0.029 -0.003 0.026 0.004 -0.010 0.029 0.031 -0.001 (0.033) (0.023) (0.024) (0.021) (0.033) (0.023) (0.054) (0.024)
Mother’s aspirations for child’s education
-0.002 (0.015)
0.012 (0.009)
0.042*** (0.013)
0.003 (0.011)
0.020 (0.012)
0.014** (0.007)
0.062*** (0.016)
0.002 (0.011)
R-squared 0.17 0.18 0.40 0.37 0.15 0.21 0.36 0.30 Observations 1908 1937 1950 1956 1881 1923 1937 1943 Age 12 Age 15 Ethiopia India Peru Vietnam Ethiopia India Peru Vietnam Wealth index
0.191*** 0.052 0.242*** 0.093 0.124** 0.043 0.137*** 0.098** (0.052) (0.043) (0.058) (0.053) (0.055) (0.045) (0.041) (0.043)
Mother’s education
0.023 0.029*** 0.000 -0.012 0.015 0.033*** 0.011 -0.016 (0.014) (0.010) (0.010) (0.011) (0.013) (0.011) (0.009) (0.010)
Father’s education
0.001 -0.003 0.006 0.026** 0.009 -0.007 -0.002 0.027*** (0.013) (0.008) (0.012) (0.012) (0.013) (0.009) (0.010) (0.010)
Mother’s height
0.034*** 0.032*** 0.062*** 0.050*** 0.040*** 0.038*** 0.059*** 0.059*** (0.007) (0.06) (0.007) (0.006) (0.007) (0.006) (0.006) (0.005)
Mother’s bargaining power
-0.039 (0.040)
0.029 (0.034)
-0.017 (0.031)
-0.045 (0.033)
-0.064 (0.042)
0.010 (0.032)
0.012 (0.029)
-0.021 (0.029)
Mother’s noncognitive skills
0.042 (0.041)
-0.003 (0.033)
0.053 (0.034)
0.020 (0.032)
-0.060 (0.043)
-0.016 (0.030)
-0.012 (0.034)
-0.054** (0.027)
Mother’s subjective well-being
0.047 (0.040)
0.075** (0.034)
-0.012 (0.031)
0.062** (0.032)
0.006 (0.041)
0.041 (0.035)
0.045 (0.033)
0.032 (0.030)
Mother’s social capital
-0.027 (0.044)
-0.020 (0.037)
-0.012 (0.037)
-0.095*** (0.034)
0.048 (0.075)
0.007 (0.036)
-0.102 (0.095)
-0.028 (0.031)
Mother’s aspirations for child’s education
-0.002 (0.016)
-0.010 (0.012)
0.021 (0.020)
0.058** (0.023)
-0.015 (0.017)
0.035*** (0.014)
0.025 (0.016)
0.032 (0.020)
R-squared 0.2 0.14 0.41 0.25 0.23 0.16 0.31 0.26 Observations 974 977 680 988 968 970 669 967
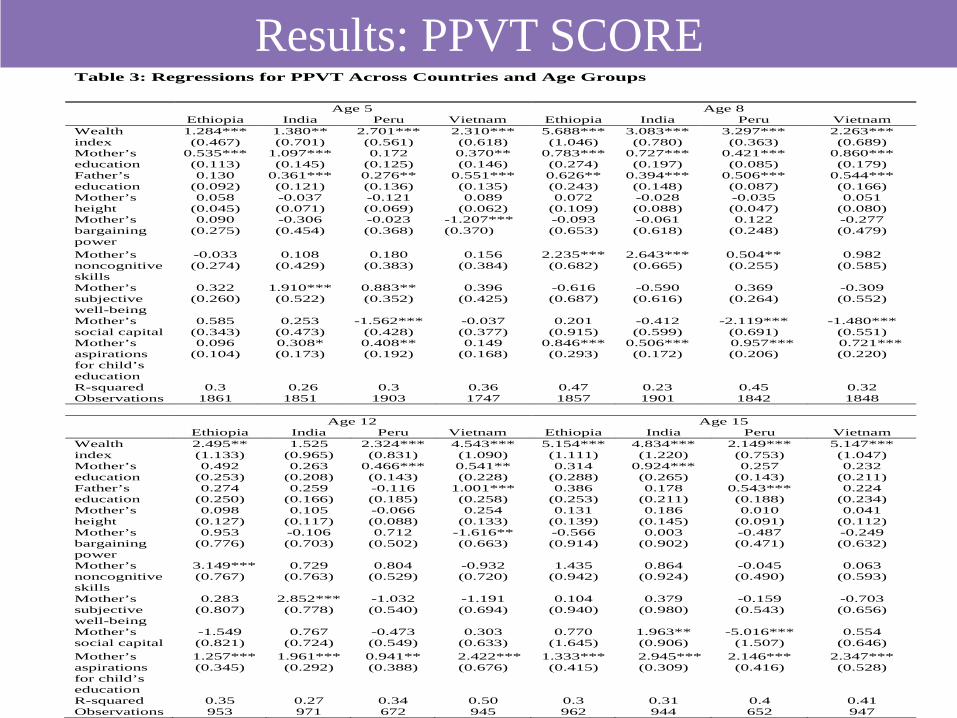
Results: PPVT SCORE
Table 3: Regressions for PPVT Across Countries and Age Groups
Age 5 Age 8 Ethiopia India Peru Vietnam Ethiopia India Peru Vietnam Wealth index
1.284*** 1.380** 2.701*** 2.310*** 5.688*** 3.083*** 3.297*** 2.263*** (0.467) (0.701) (0.561) (0.618) (1.046) (0.780) (0.363) (0.689)
Mother’s education
0.535*** 1.097*** 0.172 0.370** 0.783*** 0.727*** 0.421*** 0.860*** (0.113) (0.145) (0.125) (0.146) (0.274) (0.197) (0.085) (0.179)
Father’s education
0.130 0.361*** 0.276** 0.551*** 0.626** 0.394*** 0.506*** 0.544*** (0.092) (0.121) (0.136) (0.135) (0.243) (0.148) (0.087) (0.166)
Mother’s height
0.058 -0.037 -0.121 0.089 0.072 -0.028 -0.035 0.051 (0.045) (0.071) (0.069) (0.062) (0.109) (0.088) (0.047) (0.080)
Mother’s bargaining power
0.090 (0.275)
-0.306 (0.454)
-0.023 (0.368)
-1.207*** (0.370)
-0.093 (0.653)
-0.061 (0.618)
0.122 (0.248)
-0.277 (0.479)
Mother’s noncognitive skills
-0.033 (0.274)
0.108 (0.429)
0.180 (0.383)
0.156 (0.384)
2.235*** (0.682)
2.643*** (0.665)
0.504** (0.255)
0.982 (0.585)
Mother’s subjective well-being
0.322 (0.260)
1.910*** (0.522)
0.883** (0.352)
0.396 (0.425)
-0.616 (0.687)
-0.590 (0.616)
0.369 (0.264)
-0.309 (0.552)
Mother’s social capital
0.585 0.253 -1.562*** -0.037 0.201 -0.412 -2.119*** -1.480*** (0.343) (0.473) (0.428) (0.377) (0.915) (0.599) (0.691) (0.551)
Mother’s aspirations for child’s education
0.096 (0.104)
0.308* (0.173)
0.408** (0.192)
0.149 (0.168)
0.846*** (0.293)
0.506*** (0.172)
0.957*** (0.206)
0.721*** (0.220)
R-squared 0.3 0.26 0.3 0.36 0.47 0.23 0.45 0.32 Observations 1861 1851 1903 1747 1857 1901 1842 1848 Age 12 Age 15 Ethiopia India Peru Vietnam Ethiopia India Peru Vietnam Wealth index
2.495** 1.525 2.324*** 4.543*** 5.154*** 4.834*** 2.149*** 5.147*** (1.133) (0.965) (0.831) (1.090) (1.111) (1.220) (0.753) (1.047)
Mother’s education
0.492 0.263 0.466*** 0.541** 0.314 0.924*** 0.257 0.232 (0.253) (0.208) (0.143) (0.228) (0.288) (0.265) (0.143) (0.211)
Father’s education
0.274 0.259 -0.116 1.001*** 0.386 0.178 0.543*** 0.224 (0.250) (0.166) (0.185) (0.258) (0.253) (0.211) (0.188) (0.234)
Mother’s height
0.098 0.105 -0.066 0.254 0.131 0.186 0.010 0.041 (0.127) (0.117) (0.088) (0.133) (0.139) (0.145) (0.091) (0.112)
Mother’s bargaining power
0.953 (0.776)
-0.106 (0.703)
0.712 (0.502)
-1.616** (0.663)
-0.566 (0.914)
0.003 (0.902)
-0.487 (0.471)
-0.249 (0.632)
Mother’s noncognitive skills
3.149*** (0.767)
0.729 (0.763)
0.804 (0.529)
-0.932 (0.720)
1.435 (0.942)
0.864 (0.924)
-0.045 (0.490)
0.063 (0.593)
Mother’s subjective well-being
0.283 (0.807)
2.852*** (0.778)
-1.032 (0.540)
-1.191 (0.694)
0.104 (0.940)
0.379 (0.980)
-0.159 (0.543)
-0.703 (0.656)
Mother’s social capital
-1.549 (0.821)
0.767 (0.724)
-0.473 (0.549)
0.303 (0.633)
0.770 (1.645)
1.963** (0.906)
-5.016*** (1.507)
0.554 (0.646)
Mother’s aspirations for child’s education
1.257*** (0.345)
1.961*** (0.292)
0.941** (0.388)
2.422*** (0.676)
1.333*** (0.415)
2.945*** (0.309)
2.146*** (0.416)
2.347*** (0.528)
R-squared 0.35 0.27 0.34 0.50 0.3 0.31 0.4 0.41 Observations 953 971 672 945 962 944 652 947
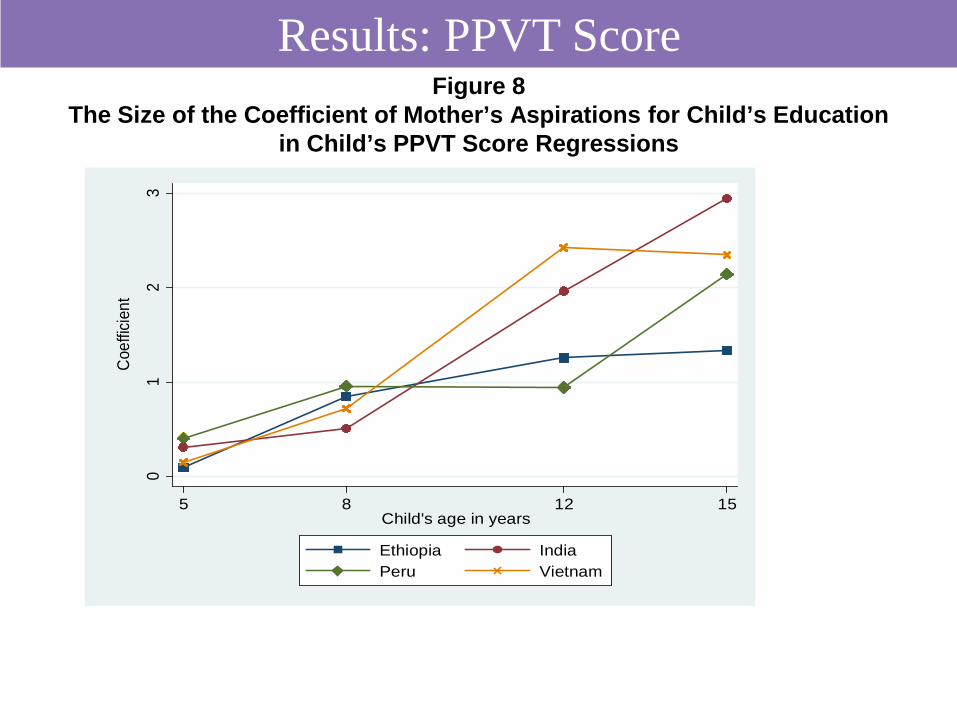
Figure 8 The Size of the Coefficient of Mother’s Aspirations for Child’s Education
in Child’s PPVT Score Regressions
Results: PPVT Score
01
23
Coef
ficie
nt
5 8 12 15Child's age in years
Ethiopia IndiaPeru Vietnam
Results: Noncognitive Skills Index
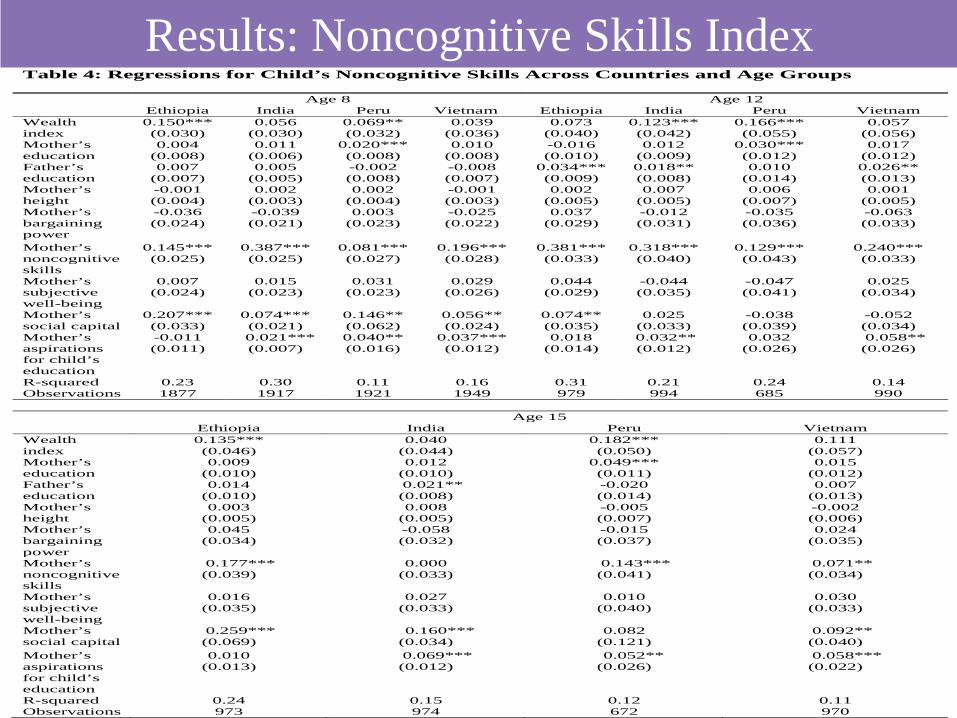
Table 4: Regressions for Child’s Noncognitive Skills Across Countries and Age Groups
Age 8 Age 12 Ethiopia India Peru Vietnam Ethiopia India Peru Vietnam Wealth index
0.150*** 0.056 0.069** 0.039 0.073 0.123*** 0.166*** 0.057 (0.030) (0.030) (0.032) (0.036) (0.040) (0.042) (0.055) (0.056)
Mother’s education
0.004 0.011 0.020*** 0.010 -0.016 0.012 0.030*** 0.017 (0.008) (0.006) (0.008) (0.008) (0.010) (0.009) (0.012) (0.012)
Father’s education
0.007 0.005 -0.002 -0.008 0.034*** 0.018** 0.010 0.026** (0.007) (0.005) (0.008) (0.007) (0.009) (0.008) (0.014) (0.013)
Mother’s height
-0.001 0.002 0.002 -0.001 0.002 0.007 0.006 0.001 (0.004) (0.003) (0.004) (0.003) (0.005) (0.005) (0.007) (0.005)
Mother’s bargaining power
-0.036 (0.024)
-0.039 (0.021)
0.003 (0.023)
-0.025 (0.022)
0.037 (0.029)
-0.012 (0.031)
-0.035 (0.036)
-0.063 (0.033)
Mother’s noncognitive skills
0.145*** (0.025)
0.387*** (0.025)
0.081*** (0.027)
0.196*** (0.028)
0.381*** (0.033)
0.318*** (0.040)
0.129*** (0.043)
0.240*** (0.033)
Mother’s subjective well-being
0.007 (0.024)
0.015 (0.023)
0.031 (0.023)
0.029 (0.026)
0.044 (0.029)
-0.044 (0.035)
-0.047 (0.041)
0.025 (0.034)
Mother’s social capital
0.207*** 0.074*** 0.146** 0.056** 0.074** 0.025 -0.038 -0.052 (0.033) (0.021) (0.062) (0.024) (0.035) (0.033) (0.039) (0.034)
Mother’s aspirations for child’s education
-0.011 (0.011)
0.021*** (0.007)
0.040** (0.016)
0.037*** (0.012)
0.018 (0.014)
0.032** (0.012)
0.032 (0.026)
0.058** (0.026)
R-squared 0.23 0.30 0.11 0.16 0.31 0.21 0.24 0.14 Observations 1877 1917 1921 1949 979 994 685 990 Age 15 Ethiopia India Peru Vietnam Wealth index
0.135*** 0.040 0.182*** 0.111 (0.046) (0.044) (0.050) (0.057)
Mother’s education
0.009 0.012 0.049*** 0.015 (0.010) (0.010) (0.011) (0.012)
Father’s education
0.014 0.021** -0.020 0.007 (0.010) (0.008) (0.014) (0.013)
Mother’s height
0.003 0.008 -0.005 -0.002 (0.005) (0.005) (0.007) (0.006)
Mother’s bargaining power
0.045 (0.034)
-0.058 (0.032)
-0.015 (0.037)
0.024 (0.035)
Mother’s noncognitive skills
0.177*** (0.039)
0.000 (0.033)
0.143*** (0.041)
0.071** (0.034)
Mother’s subjective well-being
0.016 (0.035)
0.027 (0.033)
0.010 (0.040)
0.030 (0.033)
Mother’s social capital
0.259*** (0.069)
0.160*** (0.034)
0.082 (0.121)
0.092** (0.040)
Mother’s aspirations for child’s education
0.010 (0.013)
0.069*** (0.012)
0.052** (0.026)
0.058*** (0.022)
R-squared 0.24 0.15 0.12 0.11 Observations 973 974 672 970
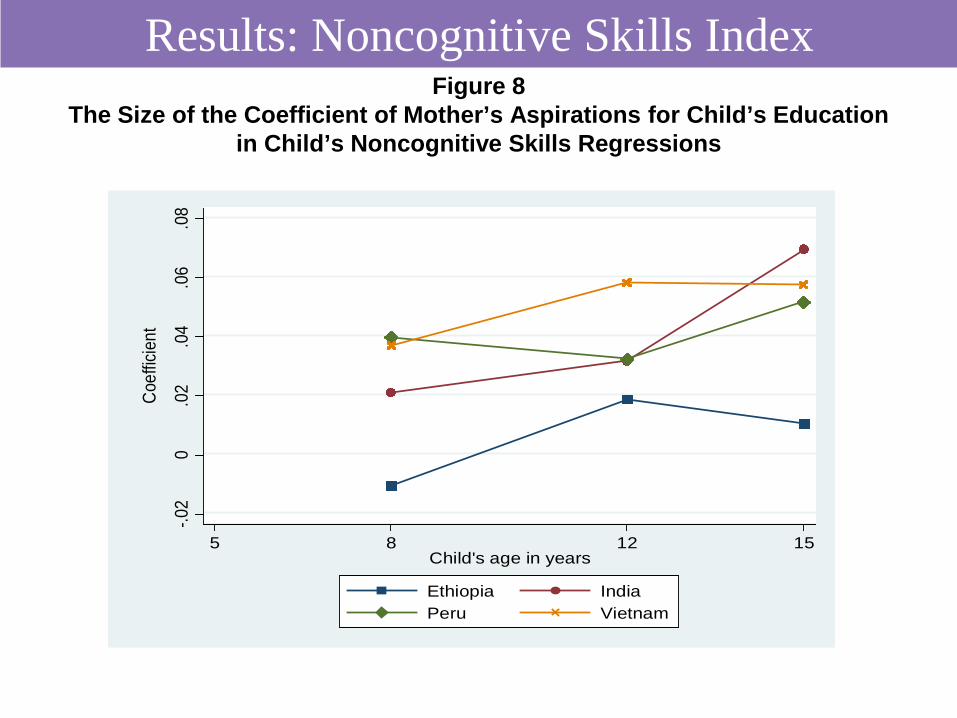
Figure 8 The Size of the Coefficient of Mother’s Aspirations for Child’s Education
in Child’s Noncognitive Skills Regressions
Results: Noncognitive Skills Index
-.02
0.0
2.0
4.0
6.0
8
Coef
ficie
nt
5 8 12 15Child's age in years
Ethiopia IndiaPeru Vietnam
• The most important predictors for height-for-age across countries and ages include:
-household wealth -mother’s height and -parental education
• no systematic pattern is found on the magnitude of these associations across age groups
• The most important predictors for cognitive achievement across countries and ages include :
-household wealth -parental education and -mother’s aspirations for the child’s education
• The only systematic pattern in the magnitude of the associations across age groups is observed for mother’s aspirations for the child’s education
Summary of Results
• The most important predictors for noncognitive skills across countries and ages include:
-mother’s noncognitive skills -social capital -household wealth -mother’s aspirations for the child’s education -parental education
• The only systematic pattern in the magnitude of the associations across age groups is observed for mother’s aspirations for the child’s education
Summary of Results
• There is a lack of studies in the development literature on that consider simultaneously the association of a wide range of parental background markers with children’s human capital across countries and how these associations may change with children’s age
• We address this gap by using data from the Young Lives cohort study in Ethiopia,
India, Peru and Vietnam to investigate the association of parental background factors with indicators of child’s human capital at ages 5, 8, 12 and 15 years
• Our key findings are that across countries and age groups: -parental income is the most important predictor of child’s nutritional status and cognitive achievement across countries and at all stages of childhood -parental education has a weak or no association with children’s human capital measures -mother’s personality traits are the most important predictors of children’s noncognitive skills across countries and at all stages of childhood -the association of mother’s aspirations for child’s education with the child’s cognitive and noncognitive skills increases with children’s age
Conclusions