Embed Size (px)
Citation preview
PARaDIM: A PHITS-Based Monte Carlo Tool for InternalDosimetry with Tetrahedral Mesh Computational Phantoms
Lukas M. Carter*1, Troy M. Crawford*2, Tatsuhiko Sato3,4, Takuya Furuta3, Chansoo Choi5, Chan Hyeong Kim5,Justin L. Brown6, Wesley E. Bolch6, Pat B. Zanzonico7, and Jason S. Lewis1,8
1Program in Pharmacology, the Radiochemistry and Molecular Imaging Probes Core, and the Department of Radiology, MemorialSloan Kettering Cancer Center, New York, New York; 2Department of Physics, University of Rhode Island, Kingston, Rhode Island;3Japan Atomic Energy Agency, Ibaraki, Japan; 4Research Center for Nuclear Physics, Osaka University, Osaka, Japan; 5Departmentof Nuclear Engineering, Hanyang University, Seoul, Korea; 6J. Crayton Pruitt Family Department of Biomedical Engineering,University of Florida, Gainesville, Florida; 7Department of Medical Physics, Memorial Sloan Kettering Cancer Center, New York,New York; and 8Department of Radiology and Department of Pharmacology, Weill Cornell Medical College, New York, New York
Mesh-type and voxel-based computational phantoms comprise thecurrent state of the art for internal dose assessment via Monte Carlo
simulations but excel in different aspects, with mesh-type phantoms
offering advantages over their voxel counterparts in terms of their
flexibility and realistic representation of detailed patient- or subject-specific anatomy. We have developed PARaDIM (pronounced “para-
digm”: Particle and Heavy Ion Transport Code System–Based Application
for Radionuclide Dosimetry in Meshes), a freeware application for
implementing tetrahedral mesh-type phantoms in absorbed dose cal-culations. It considers all medically relevant radionuclides, including
α, β, γ, positron, and Auger/conversion electron emitters, and han-
dles calculation of mean dose to individual regions, as well as 3-di-mensional dose distributions for visualization and analysis in a variety
of medical imaging software. This work describes the development of
PARaDIM, documents the measures taken to test and validate its
performance, and presents examples of its uses. Methods: Human,small-animal, and cell-level dose calculations were performed with
PARaDIM and the results compared with those of widely accepted
dosimetry programs and literature data. Several tetrahedral phantoms
were developed or adapted using computer-aided modeling tech-niques for these comparisons. Results: For human dose calculations,
agreement of PARaDIM with OLINDA 2.0 was good—within 10%–
20% for most organs—despite geometric differences among the
phantoms tested. Agreement with MIRDcell for cell-level S value cal-culations was within 5% in most cases. Conclusion: PARaDIM ex-
tends the use of Monte Carlo dose calculations to the broader
community in nuclear medicine by providing a user-friendly graphicaluser interface for calculation setup and execution. PARaDIM lever-
ages the enhanced anatomic realism provided by advanced compu-
tational reference phantoms or bespoke image-derived phantoms to
enable improved assessments of radiation doses in a variety of ra-diopharmaceutical use cases, research, and preclinical development.
PARaDIM can be downloaded freely at www.paradim-dose.org.
Key Words: PARaDIM; PHITS; dosimetry; tetrahedral mesh;
phantom
J Nucl Med 2019; 60:1802–1811DOI: 10.2967/jnumed.119.229013
Radiopharmaceutical use demands consideration of dosimetricimplications in clinical use cases, preclinical animal studies, and
cell-based assays. For human use, accurate dosimetry is a requisite
for meaningful risk projection from low-dose imaging procedures, as
well as for reliable pre–radionuclide therapy dose planning, response
assessment, and characterization of potential toxicities. In the pre-
clinical setting, the considerations are similar but more nuanced. For
example, the high activities per unit mass used in preclinical PET and
SPECT investigations generally deliver elevated absorbed doses to
small-animal hosts and thus have the potential to induce radiotoxicity,
alter gene expression, or present other biologic anomalies complicat-
ing interpretation of the scientific output. Tools have been developed
to perform organ-level dosimetry in humans and mice (1) but gener-
ally implement a limited set of phantoms and have limited or no
provisions for assessment of nonuniform dose deposition within
phantom regions. Alternatively, several image-based dosimetry tools
exist (2–5), but their accuracy is dependent on the quantitative accu-
racy of PET/SPECT imaging. A versatile methodology that combines
the advantages of both approaches would be beneficial. Finally, the
dose to cell components has been shown to be sensitive to the cell
size or shape and to the location of the decay site (6,7), particularly
for radiation with high linear energy transfer. MIRDcell (8) has been
a reliable tool for cell-level dose assessment for some time and
models the dose to single cells or cell clusters. However, all cells
within MIRDcell are modeled as concentric spheres, which in certain
cases can be limiting. Considering the increasing emphasis on high-
linear-energy-transfer radionuclide therapies, a practical option for
cell-level dose modeling to irregular cell geometries would be timely.We have developed PARaDIM (pronounced ‘‘paradigm’’: Particle
and Heavy Ion Transport Code System [PHITS]–Based Application
for Radionuclide Dosimetry in Meshes), a program that uses PHITS
version 3.07 or later (9,10) for dose computation. No knowledge of the
PHITS source code, input file format, or parameter syntax is re-
quired for its use. Similar to other programs for mean organ-level dose
Received Mar. 22, 2019; revision accepted May 29, 2019.For correspondence or reprints contact: Jason S. Lewis, Department of
Radiology, Memorial Sloan Kettering Cancer Center, 1275 York Ave., NewYork, NY 10065.E-mail: [email protected]*Contributed equally to this work.Published online Jun. 14, 2019.COPYRIGHT© 2019 by the Society of Nuclear Medicine and Molecular Imaging.
1802 THE JOURNAL OF NUCLEAR MEDICINE • Vol. 60 • No. 12 • December 2019

assessment based on precomputed S values, PARaDIM implements auser-friendly graphical user interface for input of time-integrated ac-tivity coefficients (11) and generates organ-level mean absorbed dosesunder the assumption that the activity is uniformly distributed through-out each source region. Additionally, PARaDIM provides voxelized 3-dimensional (3D) dose maps at a user-specified resolution, supportingassessment of heterogeneity of dose deposition. PARaDIM supportscell-level dosimetry based on modeling single cells or cell clusters ofarbitrary shape or spacing and with arbitrary components throughcharacterization of cells and clusters as a tetrahedral mesh.It is our expectation that PARaDIM will allow researchers in
preclinical nuclear medicine to make improved assessments of radiationdose in small-animal imaging and therapy studies and cell-based assays,as well as provide more accurate projections of absorbed dose topotential patients of various body habitus in support of radiopharma-ceutical development and investigational new drug applications. Forhuman dosimetry, PARaDIM will provide a robust supplement toimage-based methods, primarily offering a level of nonuniform doseassessment applicable to patient populations and personalized outputfrom patient-specific phantoms derived from tomographic image data.
MATERIALS AND METHODS
Code Development and Functionality
PARaDIM is provided as a stand-alone tool executable for Micro-soft Windows operating systems. The source code was entirely written
in Python (version 3.6; www.python.org) within the PyCharm inte-
grated-development environment (https://www.jetbrains.com/pycharm/).
The graphical user interface was created using Python’s built-in Tkinter
and Ttk libraries, and the external libraries Numpy (12) and NiBabel
(13) are utilized for select data-processing functions. The code was
compiled using PyInstaller (www.pyinstaller.org). Each portion of the
code was tested with PHITS versions 3.07–3.101 on Windows 7 and
Windows 10 platforms, as the code was developed.PHITS is a multipurpose particle-transport code handling transport of
virtually all known particle types for applications in medical physics and
radiation protection, among other fields. PARaDIM assembles user-specified
phantom geometry, source definition, and simulation parameters into a
PHITS-compatible input file for execution (Fig. 1). After submission
of a simulation from PARaDIM, PHITS initiates and transports the
various particle and photon emissions within the phantom geometry
and tallies energy deposition within phantom regions or in a voxel grid.
For all simulations, PARaDIM uses tetrahedral mesh-type compu-tational phantoms (14–19). Yeom et al. (18) provide a detailed dis-
cussion of computation speeds and memory requirements of this
phantom format relative to voxel phantoms. The PHITS code was
recently updated to support such phantoms, and their use within
PHITS for absorbed dose calculations has been well validated (14).
A library of tetrahedral phantoms has been provided with PARaDIM
(Table 1). Phantoms can be accessed through PARaDIM’s ‘‘Phantom
Selection’’ module (Fig. 2). Importantly, user-defined phantoms are
also supported, including, for example, personalized phantoms derived
FIGURE 1. Flowchart describing function of PARaDIM for organ-level and 3D dose calculation and relationships with relevant techniques. CAD 5computer-aided design; MIP 5 maximum-intensity projection.
PARADIM: A PHITS-BASED DOSIMETRY TOOL • Carter et al. 1803

from segmentations of data from tomographic anatomic imaging mo-
dalities (e.g., CT or MR) that have been converted to the standardtetrahedral *.ele/*.node format.
The calculation type, radionuclide, and simulation options (e.g.,resolution and physical model options) are specified in the ‘‘Parameter
Setting’’ module. Three general types of calculation can be config-
ured: absorbed dose, dose rate, and computation of S values to be usedin outside calculations of mean region-level absorbed dose. Each out-
put mode may be calculated at the tetrahedral region level or in 3dimensions (voxel level). The EGS5 mode (20) of PHITS is used for
TABLE 1Preconfigured Tetrahedral Phantoms Available for PARaDIM
Phantom Type Size (MB) Description
MRCP series* Human ∼380 Collection of 9 female and 9 male percentile-specific reference phantoms (19)
MRKP series* Human ∼380 Set of reference Korean phantoms (male/female) (17)
THRK-man* Human ∼20 Reference Korean man for accelerated simulations
Digimouse Mouse Original Digimouse tessellated atlas (32)
Digimouse-HR series† Mouse ∼67 High-resolution series of Digimouse phantom
SC10 series† Cell ∼1 Collection of concentric spheric cell phantoms of 10-μm outer diameterand various nuclear diameters, scalable for modeling larger/smaller cells
Unit-mass sphere† Geometricprimitive
∼0.5 Unit-mass icosphere (4 subdivisions), scalable for modeling tumors orfor benchmark calculations
*Denotes phantom requiring license agreement.†Denotes phantom created or modified in this work.
MRCP 5 mesh-type reference computational phantoms; THRK 5 Tetrahedral Reference Korean Man.
FIGURE 2. Snapshot of “Phantom Selection” module in PARaDIM. Here user may select phantom from library or may add phantom to standard
library via “Import New Phantom” function. Tissues and masses for currently selected phantom may be viewed or exported. Phantoms may be
scaled to particular mass by providing entry in “Scale to Mass” input field.
1804 THE JOURNAL OF NUCLEAR MEDICINE • Vol. 60 • No. 12 • December 2019

positron, negatron/electron, and photon transport; the default PHITS
algorithm is used for a-decay when applicable. The accuracy of the
EGS5 mode of PHITS in calculating dose-point kernels for monoenergetic
electrons and b-emitting isotopes has been well validated (21). PARaDIM
does not automatically account for decay of radionuclide progeny; that is,
the user must therefore ensure that if the radionuclide is part of a decay
chain, the time-integrated activity coefficients for the progeny are charac-
terized appropriately and simulated separately. Energy deposition arising
from recoiling daughter nuclei is not scored.Source particles for each phantom organ are generated using the
PHITS multisource method. Particle type is sampled on the basis of
weighted intensities defined by the PHITS radioisotope source libraries
(equivalent to International Commission on Radiological Protection
[ICRP] publication 107) (22), and the particle is given an initial energy
sampled from the same libraries (full spectrum for b-particles and
monoenergetic spectrum for photons/Auger electrons/internal conver-
sion electrons/a-particles). For radionuclides with multiple emission
types, the user may specify which particles to include in the simulation.
Statistical uncertainties h for voxels or tetrahedral regions are calcu-
lated using the ‘‘History Variance Mode’’ of PHITS, where the relative
error is given as
h 51�X
ffiffiffiffiffiffiffiffiffiffiffiffiffiffiffiffiffiffiffiffiffiffiffiffiffiffiffiffiffiffiffiffiffiffiffiffiffiffiffiffiffiffiffiffiffiffiffi+N
i51ðxiwi
��w�2
2 N �X2
NðN 2 1Þ ;
vuutEq. 1
N is the total history number; xi and wi are tally results and the source
weight of each sample, respectively; and �X and �w are the respective
mean values of the tally results and source weights of N samples.
For the default absorbed dose calculation mode of PARaDIM, thesource intensities are defined by whole-region time-integrated activity
coefficients specified by the user within the ‘‘Source Definition’’ module.
For the dose rate calculation mode, input is given as either activities in
source regions or fraction of administered activity in source regions. To
configure an S value calculation, one simply specifies the source region.Several import–export and data-processing options are provided to
streamline workflow and, particularly for 3D mode, enable visualiza-
tion and analysis (e.g., dose–volume histogram generation) in numer-
ous types of imaging software. Organ-level absorbed doses that are
output from PHITS are viewable in the PARaDIM graphical user in-
terface for convenient readout.
Example Dose Calculations in Human Phantoms
Dosimetric estimates for an 18F-labeled reference PET tracer, 18F-AlF-peptide, were obtained separately in PARaDIM and OLINDA 2.0
for the reference adult Korean man and woman using time-integrated
activity coefficients extrapolated from mouse biodistribution data
(Table 2 and supplemental information [supplemental materials are
available at http://jnm.snmjournals.org]). For these comparisons, male
and female Mesh-Type Reference Korean Phantoms (MRKPs) (17)
were used in PARaDIM, whereas the adult male and female ICRP
89 (23) and legacy Oak Ridge National Laboratory phantoms (24) were
used in OLINDAwith organ weights scaled to equivalent masses of the
MRKPs. For organs in the MRKPs that are subdivided (e.g., kidney,
comprising separate tetrahedral regions defining the renal cortex, me-
dulla, and pelvis as opposed to the entire kidney), the time-integrated
activity coefficient was allocated to each constituent component as the
product of the component’s mass fraction and the total time-integrated
activity coefficient for the whole organ. One million total source particles
were simulated in each phantom, and PARaDIM defaults were used for all
other parameters.
Organ-level mean absorbed doses for whole organs uniquely definedin the MRKPs (e.g., liver and brain) were output directly from
PARaDIM. To facilitate comparison of the results of PARaDIM with
those of OLINDA 2.0, whole-organ mean absorbed doses DðrT:W ;TDÞfor target organs that are subdivided into components rT:C of massmT :C were calculated as
DðrT :W ;TDÞ 5+TDðrT:C; TDÞ � mðrT:CÞ
+TmðrT :CÞ: Eq. 2
For further comparison and validation independent of the distributionof decays and geometry, the supplemental information provides S
values for selected sources and targets for 18F in the MRKPs, whichenables comparison of PARaDIMwith other Monte Carlo transport codes.
Additionally, dose rates were calculated with PARaDIM in aphantom derived from segmentation of a PET/CT dataset (data
obtained from the Cancer Imaging Archive anti–PD-1 melanomacollection) (25), demonstrating the use of patient-specific phantoms
in PARaDIM. The parameters for this simulation were as describedabove.
Example Dose Calculation in Small-Animal Phantoms
The mouse whole-body (MOBY) phantom has been implemented
by several investigators for mouse dosimetry calculations (26–28). Us-ing methodology described in the supplemental information, MOBY
was converted to tetrahedral geometry to enable its use within PARa-DIM; 18F self–S values for MOBY’s constituent organs were calculated
and compared with previous literature that used voxel-based methodswith this phantom (27). One million source particles were simulated
separately from each organ, resulting in less than 1% relative uncer-tainty for each self–S value. Additionally, decay of 18F, 90Y, and 186Re
was simulated from MOBY liver sources in 3D mode (106 events, 0.75-mm resolution).
Example Cell-Level Dose Calculations
PARaDIM was compared with MIRDcell for validation of accuracy
of absorbed dose computation at the cell level. MIRDcell modelscells as concentric spheres, with the radii of the cell nucleus and the
TABLE 2Time-Integrated Activity Coefficients Used for Absorbed
Dose Calculations in PARaDIM and OLINDA 2.0, Calculatedfor Male and Female MRKP Based on Mouse Biodistribution
of Reference Peptide
Time-integrated activity
coefficient (MBq⋅h/MBq)
Organ Male Female
Left colon contents 0.00283 0.00281
Small intestine contents 0.00743 0.0073
Stomach contents 0.00443 0.00423
Right colon contents 0.00283 0.00281
Heart contents 0.111 0.103
Heart wall 0.025 0.028
Kidneys 0.111 0.124
Liver 0.119 0.13
Lungs 0.121 0.116
Pancreas 0.00309 0.0034
Spleen 0.00812 0.00949
Urinary bladder contents 0.0954 0.0954
Remainder 1.53 1.51
PARADIM: A PHITS-BASED DOSIMETRY TOOL • Carter et al. 1805
complete cell specified in integer increments of micrometers. The cell
membrane, cytoplasm, nucleus, or entire cell may be used as sourcesor targets. Selected S values for cells of various dimensions were
generated with MIRDcell and compared with those computed with
PARaDIM using a series of tetrahedral cell phantoms constructed with
equivalent dimensions (supplemental information). One million sourceparticles were simulated for 18F and 211At using PARaDIM’s parameter
defaults; calculations with MIRDcell used the full b-spectrum whenapplicable.
In contrast to MIRDcell, PARaDIM is notlimited to cells modeled as concentric spheres
with regular spacing. Within the constraints of
computation time and memory, detailed arraysof cells with complicated geometry, arbitrary
size, and nonuniform spacing may be defined asa tetrahedral mesh and used in dose calculations.
As an illustration, a calculation for a hypotheticalcell geometry similar to one encountered com-
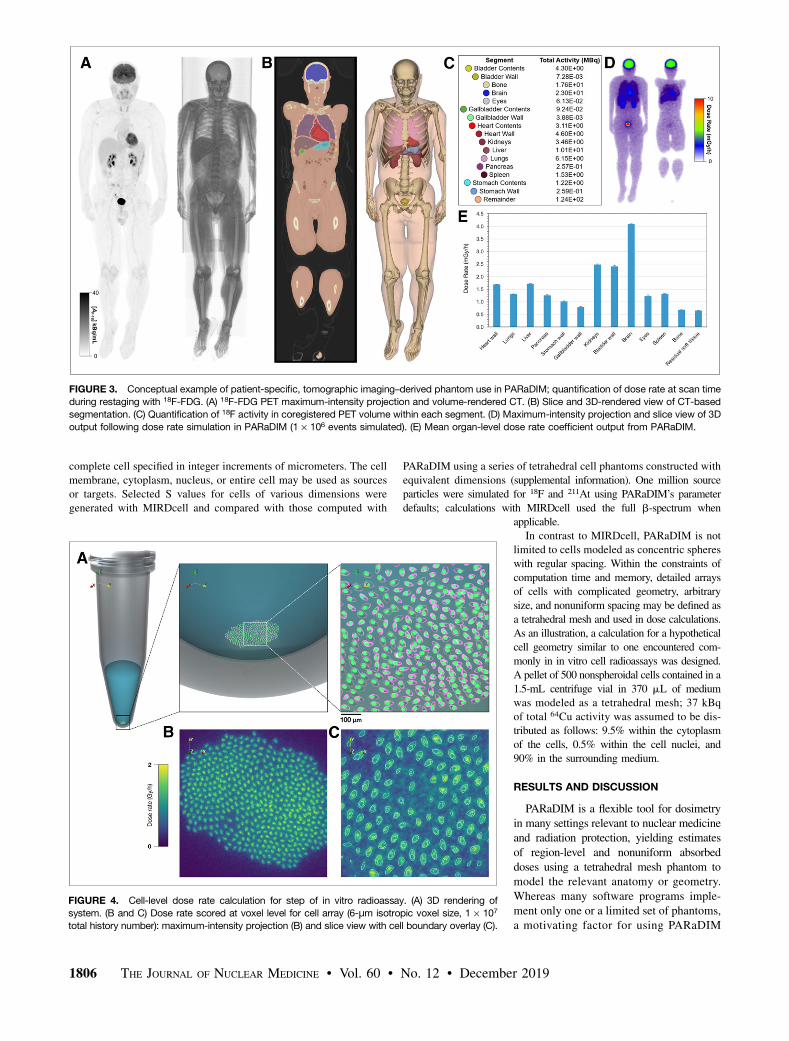
monly in in vitro cell radioassays was designed.A pellet of 500 nonspheroidal cells contained in a
1.5-mL centrifuge vial in 370 mL of mediumwas modeled as a tetrahedral mesh; 37 kBq
of total 64Cu activity was assumed to be dis-tributed as follows: 9.5% within the cytoplasm
of the cells, 0.5% within the cell nuclei, and90% in the surrounding medium.
RESULTS AND DISCUSSION
PARaDIM is a flexible tool for dosimetryin many settings relevant to nuclear medicineand radiation protection, yielding estimatesof region-level and nonuniform absorbeddoses using a tetrahedral mesh phantom tomodel the relevant anatomy or geometry.Whereas many software programs imple-ment only one or a limited set of phantoms,a motivating factor for using PARaDIM
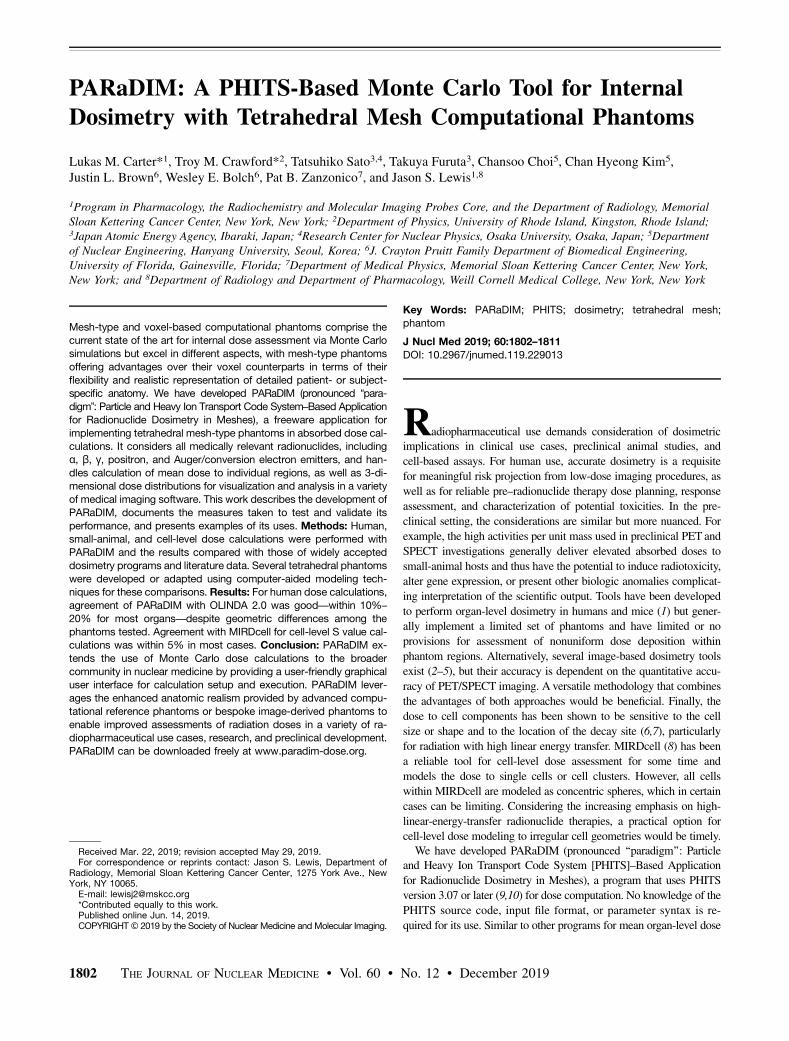
FIGURE 3. Conceptual example of patient-specific, tomographic imaging–derived phantom use in PARaDIM; quantification of dose rate at scan time
during restaging with 18F-FDG. (A) 18F-FDG PET maximum-intensity projection and volume-rendered CT. (B) Slice and 3D-rendered view of CT-based
segmentation. (C) Quantification of 18F activity in coregistered PET volume within each segment. (D) Maximum-intensity projection and slice view of 3D
output following dose rate simulation in PARaDIM (1 · 106 events simulated). (E) Mean organ-level dose rate coefficient output from PARaDIM.
FIGURE 4. Cell-level dose rate calculation for step of in vitro radioassay. (A) 3D rendering of
system. (B and C) Dose rate scored at voxel level for cell array (6-μm isotropic voxel size, 1 · 107
total history number): maximum-intensity projection (B) and slice view with cell boundary overlay (C).
1806 THE JOURNAL OF NUCLEAR MEDICINE • Vol. 60 • No. 12 • December 2019

is the ability to easily simulate dose in novel phantoms. It isdesigned to integrate well with modern imaging software foroutput postprocessing and visualization and with workflows fordevelopment of bespoke phantoms—for example, from segmenta-tion of medical imaging data (Fig. 3). Figure 4 gives a cell-based example that is necessarily situational but further illustratesPARaDIM’s utility for dose calculation in truly unique or custom-ized settings, especially when allied with computer-aided designworkflows for custom phantom generation (this is facilitated byPARaDIM’s use of tetrahedral mesh phantoms). Other use-cases inwhich PARaDIM excels include advanced phantoms for which com-plex source and target regions are detailed, computational referencephantoms for which S values have not yet been calculated, and ref-erence phantoms that have been deformed (e.g., to match a particular
subject’s geometry). PARaDIM is also capable of dose calculationin brachytherapy and certain external-radionuclide-exposure scenar-ios. Such calculations can be accomplished, for example, by definingbrachytherapy or external sources along with the biologic systemtogether within a single tetrahedral mesh (Supplemental Fig. 2); how-ever, validation of the program for these purposes is outside the scopeof the present article. Finally, 4-dimensional dose calculations may beconducted in PARaDIM by importing a dynamic geometry as sepa-rate static frames.
Agreement of PARaDIM with Other Methods
We have compared absorbed doses computed with PARaDIM to 2widely used and well-validated applications for internal dosimetry:OLINDA 2.0 and MIRDcell. Although the validation presented is not
FIGURE 5. Absorbed dose estimation for intravenous administration of 18F-AlF-peptide in reference Koreans: comparison of organ-level absorbed
dose coefficients computed with PARaDIM vs. OLINDA 2.0 for males (top) and females (bottom). Asterisks represent tissues not defined in re-
spective phantom. AF 5 adult female; AM 5 adult male; LLI 5 lower large intestine; ULI 5 upper large intestine; ORNL 5 Oak Ridge National
Laboratory; SI 5 small intestine; UB 5 urinary bladder.
PARADIM: A PHITS-BASED DOSIMETRY TOOL • Carter et al. 1807

exhaustive, the agreement provides some confidence in PARaDIM’sresults and illustrates the value of PARaDIM as both a stand-alonedosimetry tool and a complement to these well-established methods.Human organ-level absorbed doses calculated with PARaDIM andOLINDA agreed well, within approximately 20% for most organs,
with differences attributed primarily to geometric and spatial differencesbetween the MRKPs used in PARaDIM and the ICRP 89 seriesand stylized Oak Ridge National Laboratory reference humanphantoms used in the latter program (Fig. 5). The most significantdifferences observed were for organs comprising separate wall and
FIGURE 6. Absorbed dose coefficients and corresponding relative uncertainties scored at voxel level in MRKPs, with phantom geometry juxta-
posed for anatomic reference. AF 5 adult female; AM 5 adult male; MIP 5 maximum-intensity projection.
1808 THE JOURNAL OF NUCLEAR MEDICINE • Vol. 60 • No. 12 • December 2019
content components (e.g., urinary bladder wall and heart wall), forwhich doses computed with OLINDA were higher than those com-puted with PARaDIM. These differences were not unexpected, asOLINDA calculates doses to the wall target regions rT from contentsources rs by assuming that the specific absorbed fractionFðrT)rsÞfor b-radiation is approximated by the following (30):
FðrT)rsÞ 5 1=2 �MðrsÞ; Eq. 3
which is known to yield conservatively high estimates for low-energy b-emitters, including 18F. The corresponding 3D output ofPARaDIM for these simulations is shown in Figure 6.Self–S values for the MOBY phantom showed good agreement
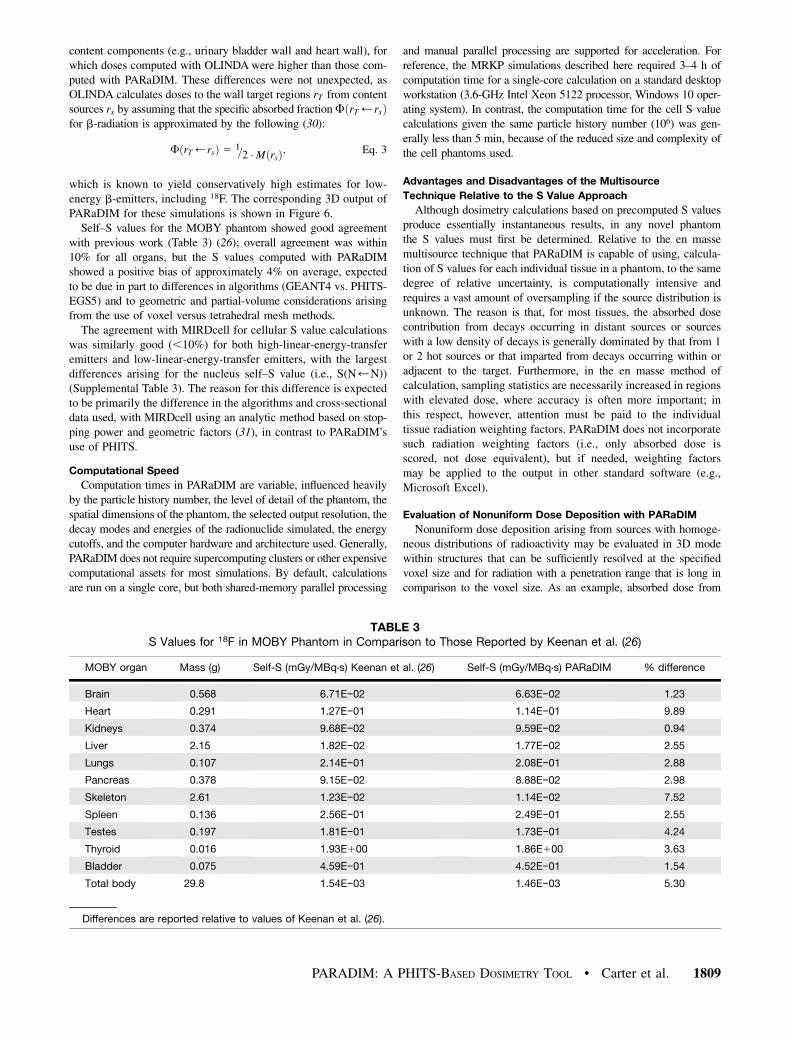
with previous work (Table 3) (26); overall agreement was within10% for all organs, but the S values computed with PARaDIMshowed a positive bias of approximately 4% on average, expectedto be due in part to differences in algorithms (GEANT4 vs. PHITS-EGS5) and to geometric and partial-volume considerations arisingfrom the use of voxel versus tetrahedral mesh methods.The agreement with MIRDcell for cellular S value calculations
was similarly good (,10%) for both high-linear-energy-transferemitters and low-linear-energy-transfer emitters, with the largestdifferences arising for the nucleus self–S value (i.e., S(N)N))(Supplemental Table 3). The reason for this difference is expectedto be primarily the difference in the algorithms and cross-sectionaldata used, with MIRDcell using an analytic method based on stop-ping power and geometric factors (31), in contrast to PARaDIM’suse of PHITS.
Computational Speed
Computation times in PARaDIM are variable, influenced heavilyby the particle history number, the level of detail of the phantom, thespatial dimensions of the phantom, the selected output resolution, thedecay modes and energies of the radionuclide simulated, the energycutoffs, and the computer hardware and architecture used. Generally,PARaDIM does not require supercomputing clusters or other expensivecomputational assets for most simulations. By default, calculationsare run on a single core, but both shared-memory parallel processing
and manual parallel processing are supported for acceleration. Forreference, the MRKP simulations described here required 3–4 h ofcomputation time for a single-core calculation on a standard desktopworkstation (3.6-GHz Intel Xeon 5122 processor, Windows 10 oper-ating system). In contrast, the computation time for the cell S valuecalculations given the same particle history number (106) was gen-erally less than 5 min, because of the reduced size and complexity ofthe cell phantoms used.
Advantages and Disadvantages of the Multisource
Technique Relative to the S Value Approach
Although dosimetry calculations based on precomputed S valuesproduce essentially instantaneous results, in any novel phantomthe S values must first be determined. Relative to the en massemultisource technique that PARaDIM is capable of using, calcula-tion of S values for each individual tissue in a phantom, to the samedegree of relative uncertainty, is computationally intensive andrequires a vast amount of oversampling if the source distribution isunknown. The reason is that, for most tissues, the absorbed dosecontribution from decays occurring in distant sources or sourceswith a low density of decays is generally dominated by that from 1or 2 hot sources or that imparted from decays occurring within oradjacent to the target. Furthermore, in the en masse method ofcalculation, sampling statistics are necessarily increased in regionswith elevated dose, where accuracy is often more important; inthis respect, however, attention must be paid to the individualtissue radiation weighting factors. PARaDIM does not incorporatesuch radiation weighting factors (i.e., only absorbed dose isscored, not dose equivalent), but if needed, weighting factorsmay be applied to the output in other standard software (e.g.,Microsoft Excel).
Evaluation of Nonuniform Dose Deposition with PARaDIM
Nonuniform dose deposition arising from sources with homoge-neous distributions of radioactivity may be evaluated in 3D modewithin structures that can be sufficiently resolved at the specifiedvoxel size and for radiation with a penetration range that is long incomparison to the voxel size. As an example, absorbed dose from
TABLE 3S Values for 18F in MOBY Phantom in Comparison to Those Reported by Keenan et al. (26)
MOBY organ Mass (g) Self-S (mGy/MBq⋅s) Keenan et al. (26) Self-S (mGy/MBq⋅s) PARaDIM % difference
Brain 0.568 6.71E−02 6.63E−02 1.23
Heart 0.291 1.27E−01 1.14E−01 9.89
Kidneys 0.374 9.68E−02 9.59E−02 0.94
Liver 2.15 1.82E−02 1.77E−02 2.55
Lungs 0.107 2.14E−01 2.08E−01 2.88
Pancreas 0.378 9.15E−02 8.88E−02 2.98
Skeleton 2.61 1.23E−02 1.14E−02 7.52
Spleen 0.136 2.56E−01 2.49E−01 2.55
Testes 0.197 1.81E−01 1.73E−01 4.24
Thyroid 0.016 1.93E100 1.86E100 3.63
Bladder 0.075 4.59E−01 4.52E−01 1.54
Total body 29.8 1.54E−03 1.46E−03 5.30
Differences are reported relative to values of Keenan et al. (26).
PARADIM: A PHITS-BASED DOSIMETRY TOOL • Carter et al. 1809
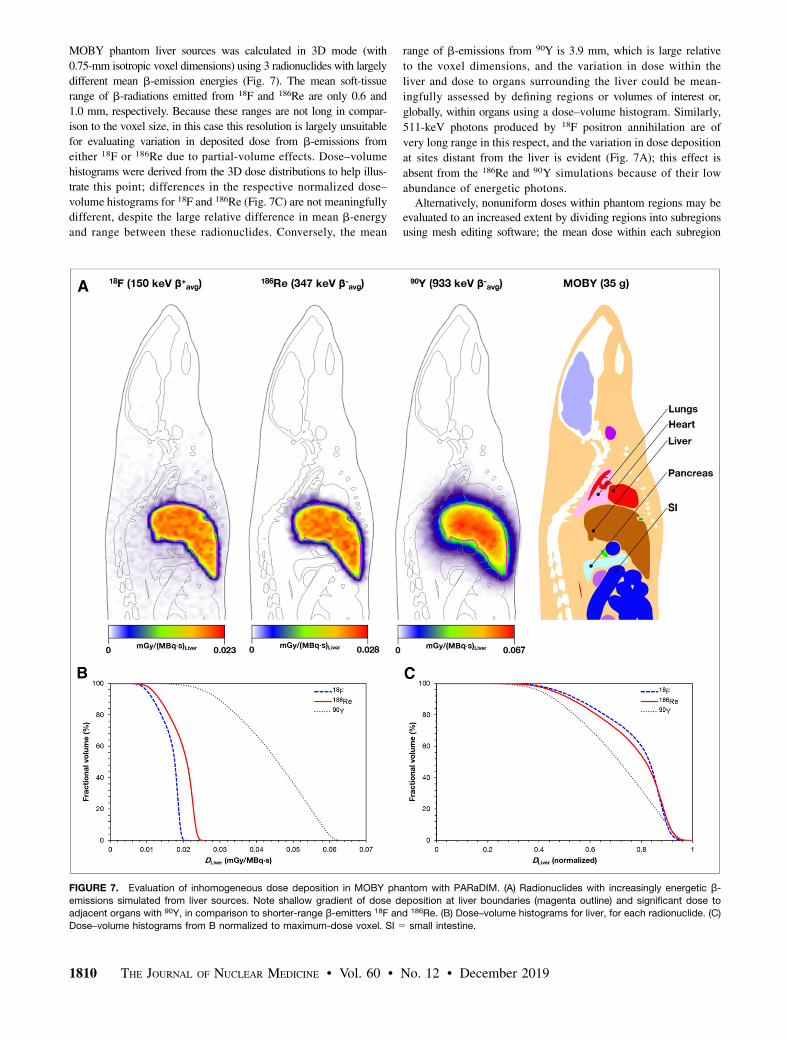
MOBY phantom liver sources was calculated in 3D mode (with
0.75-mm isotropic voxel dimensions) using 3 radionuclides with largely
different mean b-emission energies (Fig. 7). The mean soft-tissue
range of b-radiations emitted from 18F and 186Re are only 0.6 and
1.0 mm, respectively. Because these ranges are not long in compar-
ison to the voxel size, in this case this resolution is largely unsuitable
for evaluating variation in deposited dose from b-emissions from
either 18F or 186Re due to partial-volume effects. Dose–volume
histograms were derived from the 3D dose distributions to help illus-
trate this point; differences in the respective normalized dose–
volume histograms for 18F and 186Re (Fig. 7C) are not meaningfully
different, despite the large relative difference in mean b-energy
and range between these radionuclides. Conversely, the mean
range of b-emissions from 90Y is 3.9 mm, which is large relative
to the voxel dimensions, and the variation in dose within the
liver and dose to organs surrounding the liver could be mean-
ingfully assessed by defining regions or volumes of interest or,
globally, within organs using a dose–volume histogram. Similarly,
511-keV photons produced by 18F positron annihilation are of
very long range in this respect, and the variation in dose deposition
at sites distant from the liver is evident (Fig. 7A); this effect is
absent from the 186Re and 90Y simulations because of their low
abundance of energetic photons.Alternatively, nonuniform doses within phantom regions may be
evaluated to an increased extent by dividing regions into subregionsusing mesh editing software; the mean dose within each subregion
FIGURE 7. Evaluation of inhomogeneous dose deposition in MOBY phantom with PARaDIM. (A) Radionuclides with increasingly energetic β-emissions simulated from liver sources. Note shallow gradient of dose deposition at liver boundaries (magenta outline) and significant dose to
adjacent organs with 90Y, in comparison to shorter-range β-emitters 18F and 186Re. (B) Dose–volume histograms for liver, for each radionuclide. (C)
Dose–volume histograms from B normalized to maximum-dose voxel. SI 5 small intestine.
1810 THE JOURNAL OF NUCLEAR MEDICINE • Vol. 60 • No. 12 • December 2019

would then be tallied individually in PARaDIM. This approach avoidsthe partial-volume effects associated with voxel-format dose tallies.
CONCLUSION
Advancements in medical image segmentation, 3D geometricmodeling/manipulation/representation/visualization, and MonteCarlo particle transport simulation have enabled accurate calcula-tion of absorbed doses in tetrahedral mesh phantoms that intricatelycharacterize the anatomy of subjects, including humans, animals,and cells. The use of such phantoms in dosimetric simulations haspreviously been restricted largely to investigators with an advancedunderstanding of select Monte Carlo transport codes. PARaDIMextends the benefits of this powerful simulation technique to allinvestigators in the field, without the need for advanced computerexpertise, and can be obtained freely at www.paradim-dose.org,along with its terms of use, disclaimer, and documentation.
DISCLOSURE
This work was supported by the Memorial Sloan KetteringRadiochemistry and Molecular Imaging Probes Core, which wassupported in part by National Institutes of Health grant P30CA08748. This work was also supported by NIH grant R35CA232130, the Mr. William H. and Mrs. Alice Goodwin and theCommonwealth Foundation for Cancer Research and by theCenter for Experimental Therapeutics of Memorial Sloan Ketter-ing Cancer Center (Jason Lewis). Lukas Carter acknowledgessupport from a Ruth L. Kirschstein NRSA postdoctoral fellowship(NIH F32 EB025050). No other potential conflict of interestrelevant to this article was reported.
KEY POINTS
QUESTION: Can we facilitate the use of advanced methods in
Monte Carlo–based internal dosimetry by scientists and clinicians?
PERTINENT FINDINGS: PARaDIM, a user-friendly graphical user
interface for internal dose calculations via PHITS, was developed,
tested, and validated in this work.
IMPLICATIONS FOR PATIENT CARE: PARaDIM will benefit the
field by facilitating setup of internal dose calculations with modern
computational reference phantoms and subject-specific phantoms
derived from anatomic imaging, offering an advanced alternative to
existing methods for radiation dose assessment.
REFERENCES
1. Stabin MG, Sparks RB, Crowe E. OLINDA/EXM: the second-generation per-
sonal computer software for internal dose assessment in nuclear medicine. J Nucl
Med. 2005;46:1023–1027.
2. Kost SD, Dewaraja YK, Abramson RG, Stabin MG. VIDA: a voxel-based do-
simetry method for targeted radionuclide therapy using Geant4. Cancer Biother
Radiopharm. 2015;30:16–26.
3. Bednarz B, Grudzinski J, Marsh I, et al. Murine-specific internal dosimetry for
preclinical investigations of imaging and therapeutic agents. Health Phys. 2018;
114:450–459.
4. Sgouros G, Frey E, Wahl R, He B, Prideaux A, Hobbs R. Three-dimensional
imaging-based radiobiological dosimetry. Semin Nucl Med. 2008;38:321–334.
5. Prideaux AR, Song H, Hobbs RF, et al. Three-dimensional radiobiologic dosim-
etry: application of radiobiologic modeling to patient-specific 3-dimensional
imaging-based internal dosimetry. J Nucl Med. 2007;48:1008–1016.
6. Goddu SM, Rao DV, Howell RW. Multicellular dosimetry for micrometastases:
dependence of self-dose versus cross-dose to cell nuclei on type and energy of radiation
and subcellular distribution of radionuclides. J Nucl Med. 1994;35:521–530.
7. Makrigiorgos GM, Adelstein SJ, Kassis AI. Limitations of conventional internal
dosimetry at the cellular level. J Nucl Med. 1989;30:1856–1864.
8. Vaziri B, Wu H, Dhawan AP, et al. MIRD pamphlet no. 25: MIRDcell V2.0
software tool for dosimetric analysis of biologic response of multicellular pop-
ulations. J Nucl Med. 2014;55:1557–1564.
9. Sato T, Iwamoto Y, Hashimoto S, et al. Features of Particle and Heavy Ion
Transport code System (PHITS) version 3.02. J Nucl Sci Technol. 2018;55:
684–690.
10. Iwamoto Y, Sato T, Hashimoto S, et al. Benchmark study of the recent version of
the PHITS code. J Nucl Sci Technol. 2017;54:617–635.
11. Bolch WE, Eckerman KF, Sgouros G, Thomas SR. MIRD pamphlet no. 21: a
generalized schema for radiopharmaceutical dosimetry—standardization of no-
menclature. J Nucl Med. 2009;50:477–484.
12. van der Walt S, Colbert SC, Varoquaux G. The NumPy array: a structure for
efficient numerical computation. Comput Sci Eng. 2011;13:22–30.
13. NiBabel development changelog, version 2.3.2. nipy.org website. https://
nipy.org/nibabel/changelog.html#wednesday-2-january-2019. Accessed August
29, 2019.
14. Furuta T, Sato T, Han MC, et al. Implementation of tetrahedral-mesh geometry in
Monte Carlo radiation transport code PHITS. Phys Med Biol. 2017;62:4798–
4810.
15. Yeom YS, Jeong JH, Han MC, Kim CH. Tetrahedral-mesh-based computational
human phantom for fast Monte Carlo dose calculations. Phys Med Biol. 2014;59:
3173–3185.
16. Kim CH, Yeom YS, Nguyen TT, et al. The reference phantoms: voxel vs poly-
gon. Ann ICRP. 2016;45:188–201.
17. Choi C, Nguyen TT, Yeom YS, et al. Mesh-type reference Korean phantoms
(MRKPs) for adult male and female for use in radiation protection dosimetry.
Phys Med Biol. 2019;64:085020.
18. Yeom YS, Han MC, Choi C, et al. Computation speeds and memory require-
ments of mesh-type ICRP reference computational phantoms in Geant4, MCNP6,
and PHITS. Health Phys. 2019;116:664–676.
19. Lee H, Yeom YS, Nguyen TT, et al. Percentile-specific computational phantoms
constructed from ICRP mesh-type reference computational phantoms (MRCPs).
Phys Med Biol. 2019;64:045005.
20. Hirayama H, Namito Y, Bielajew AF, Wilderman SJ, Nelson WR. The EGS5
Code System. Tsukuba, Japan: High Energy Accelerator Research Organization;
2005.
21. Shiiba T, Kuga N, Kuroiwa Y, Sato T. Evaluation of the accuracy of mono-ener-
getic electron and beta-emitting isotope dose-point kernels using particle and heavy
ion transport code system: PHITS. Appl Radiat Isot. 2017;128:199–203.
22. Eckerman K, Endo A. ICRP publication 107: nuclear decay data for dosimetric
calculations. Ann ICRP. 2008;38:7–96.
23. Basic anatomical and physiological data for use in radiological protection: ref-
erence values—a report of age- and gender-related differences in the anatomical
and physiological characteristics of reference individuals. ICRP Publication 89.
Ann ICRP. 2002;32:5–265.
24. Cristy M, Eckerman KF. Specific Absorbed Fractions of Energy at Various Ages
from Internal Photon Sources: 7, Adult Male. Oak Ridge, TN: Oak Ridge Na-
tional Laboratory; 1987.
25. Clark K, Vendt B, Smith K, et al. The Cancer Imaging Archive (TCIA): main-
taining and operating a public information repository. J Digit Imaging. 2013;26:
1045–1057.
26. Keenan MA, Stabin MG, Segars WP, Fernald MJ. RADAR realistic animal
model series for dose assessment. J Nucl Med. 2010;51:471–476.
27. Kostou T, Papadimitroulas P, Loudos G, Kagadis GC. A preclinical simulated
dataset of S-values and investigation of the impact of rescaled organ masses
using the MOBY phantom. Phys Med Biol. 2016;61:2333–2355.
28. Larsson E, Ljungberg M, Strand S-E, Jonsson B-A. Monte Carlo calculations of
absorbed doses in tumours using a modified MOBY mouse phantom for pre-
clinical dosimetry studies. Acta Oncol. 2011;50:973–980.
29. Si H. TetGen, a Delaunay-based quality tetrahedral mesh generator. ACM Trans
Math Software. 2015;41:11.
30. Stabin MG, Siegel J. Physical models and dose factors for use in internal dose
assessment. Health Phys. 2003;85:294–310.
31. Goddu SM, Howell RW, Rao DV. Cellular dosimetry: absorbed fractions for
monoenergetic electron and alpha particle sources and S-values for radionu-
clides uniformly distributed in different cell compartments. J Nucl Med.
1994;35:303–316.
32. Dogdas B, Stout D, Chatziioannou AF, Leahy RM. Digimouse: a 3D whole
body mouse atlas from CT and cryosection data. Phys Med Biol. 2007;52:
577–587.
PARADIM: A PHITS-BASED DOSIMETRY TOOL • Carter et al. 1811