Embed Size (px)
Citation preview
Paper Number: 1856
Title: Failure Predictions of Out-of-Autoclave Sandwich Joints
with Delaminations under Flexure Loads
Authors:
Nikolas Nordendale#, Vinay Goyal*, Eric Lundgren*, Dhruv Patel*, Babak Farrokh+,
Justin Jones+, Grace Fischetti+, and Kenneth Segal+
https://ntrs.nasa.gov/search.jsp?R=20150018414 2018-05-22T15:05:18+00:00Z
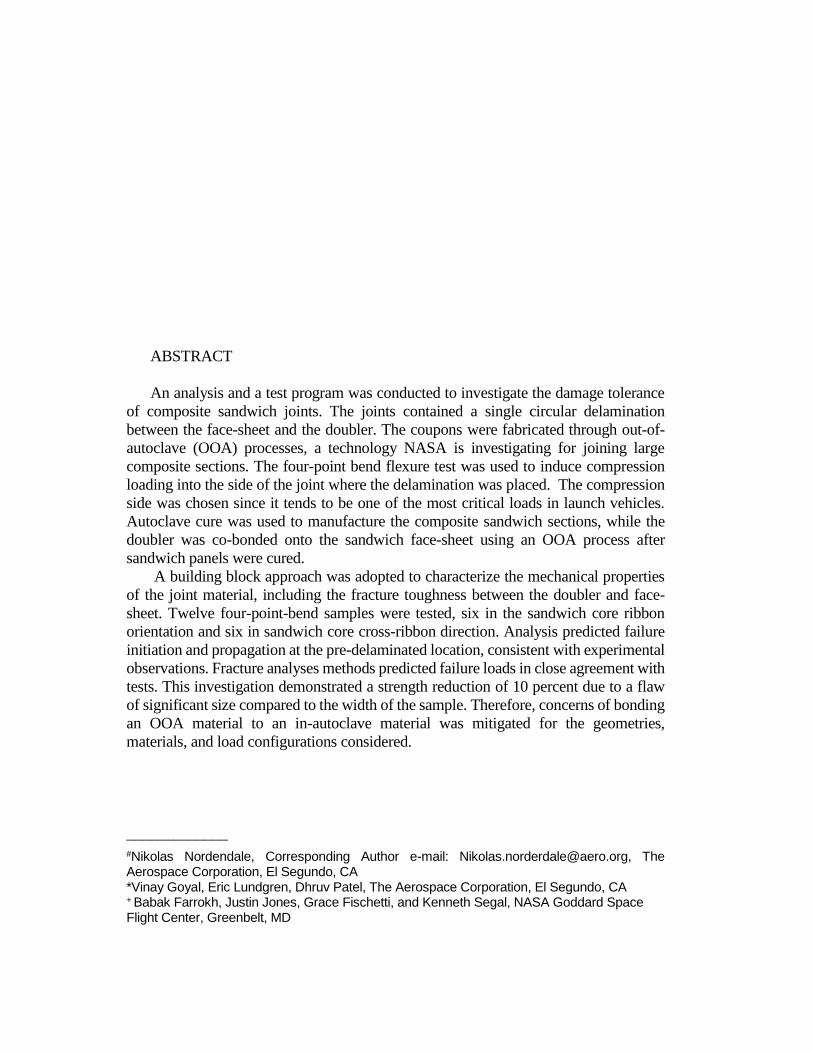
ABSTRACT
An analysis and a test program was conducted to investigate the damage tolerance
of composite sandwich joints. The joints contained a single circular delamination
between the face-sheet and the doubler. The coupons were fabricated through out-of-
autoclave (OOA) processes, a technology NASA is investigating for joining large
composite sections. The four-point bend flexure test was used to induce compression
loading into the side of the joint where the delamination was placed. The compression
side was chosen since it tends to be one of the most critical loads in launch vehicles.
Autoclave cure was used to manufacture the composite sandwich sections, while the
doubler was co-bonded onto the sandwich face-sheet using an OOA process after
sandwich panels were cured.
A building block approach was adopted to characterize the mechanical properties
of the joint material, including the fracture toughness between the doubler and face-
sheet. Twelve four-point-bend samples were tested, six in the sandwich core ribbon
orientation and six in sandwich core cross-ribbon direction. Analysis predicted failure
initiation and propagation at the pre-delaminated location, consistent with experimental
observations. Fracture analyses methods predicted failure loads in close agreement with
tests. This investigation demonstrated a strength reduction of 10 percent due to a flaw
of significant size compared to the width of the sample. Therefore, concerns of bonding
an OOA material to an in-autoclave material was mitigated for the geometries,
materials, and load configurations considered.
_____________
#Nikolas Nordendale, Corresponding Author e-mail: [email protected], The Aerospace Corporation, El Segundo, CA *Vinay Goyal, Eric Lundgren, Dhruv Patel, The Aerospace Corporation, El Segundo, CA + Babak Farrokh, Justin Jones, Grace Fischetti, and Kenneth Segal, NASA Goddard Space Flight Center, Greenbelt, MD
INTRODUCTION
Composite structures for heavy-lift launch vehicles are projected to be the largest
composites ever built (around 27.5 feet in diameter and 70 feet in length) [3]. There are
no autoclaves large enough to process large composite barrel section structures of this
size [1, 5] in one piece. Processing composites out-of-autoclave (OOA) includes
automated tape placement, filament winding, vacuum assisted resin transfer molding,
resin transfer mold, and out-of-autoclave vacuum bag only. Materials used in OOA
vacuum-bag-only processing must have low viscosity before curing at elevated
temperatures; otherwise, voids can arise and degrade mechanical properties of the
composite.
The approach being considered is to join in-autoclave (IA) composite sections with
bonded OOA doublers to achieve a large size full barrel section. Two aspects were
investigated: (1) Strength reduction associated with a large flaw between the OOA
material and the IA material, and (2) Predictive capability of fracture methods to
estimate the failure load due to a flaw in the joint. These aspects were investigated by
testing and analyzing four-point bend sandwich structures with flaws between the
facesheets and the doublers.
This investigation required a characterization program to develop mechanical
properties for the OOA materials and the fracture characterization of the interface
between these two material systems. The results of this investigation are organized as
follows: mechanical properties of the IA and OOA material systems, test setup and test
results, and finite element model and results.
CHARACTERIZATION OF MATERIAL SYSTEMS
Panels were fabricated with IA curable unidirectional prepreg IM7/977-3 (ply
thickness is 0.0053 inch) and OOA woven fabric T40-800/5320-1 (ply thickness is
0.008 inch). Both of these materials are produced commercially and were used in a
testing published by NASA (NASA/TM-2013-217822/PART1). The following
mechanical tests were performed to verify the T40-800/5320-1 material: (1) In-plane
tension (panel 0-degree aligned with axial direction), (2) Compression (panel 90-degree
aligned with axial direction), (3) In-plane shear (V-notched method), and (4) Flatwise
tension (out-of-plane). All sandwich coupons used 1.125-inch thick Aluminum 5052
Honeycomb Core, 1/8 cell, and 0.0007 Gauge 3.1pcf. The adhesive splice material is
9396.6 MD with assumed linear elastic, isotropic properties of Young’s Modulus, 𝐸 =
300,000 psi, and Poisson’s Ratio, 𝜈 = 0.40. It should be noted that the mechanical
properties for IM7/977-3 and T40-800/5320-1 were obtained from the Composite for
Exploration (CoEx) program.
Two panels were fabricated to measure the Mode I interlaminar fracture toughness
using the double cantilever beam (DCB) test, per ASTM D5528-0. Finite element
modeling was used to size the stacking sequence on either side of the crack, to ensure
that the bending stiffness of each cantilever arm was nearly equal. Panels were
fabricated with 0-degree 30-ply unidirectional IM7/977-3 substrate (0.16-inch thick)
and 0-degree 26-ply T-40-800/5320-1 woven fabric doubler (0.21-inch thick). The
IM7/977-3 was first autoclave cured, and the surface was abrasion treated prior to out-
of-autoclave bonding of the T-40-800/5320-1. The joint doubler was cured to the
IM7/977-3 substrate using vacuum bag pressure only, per manufacturer’s
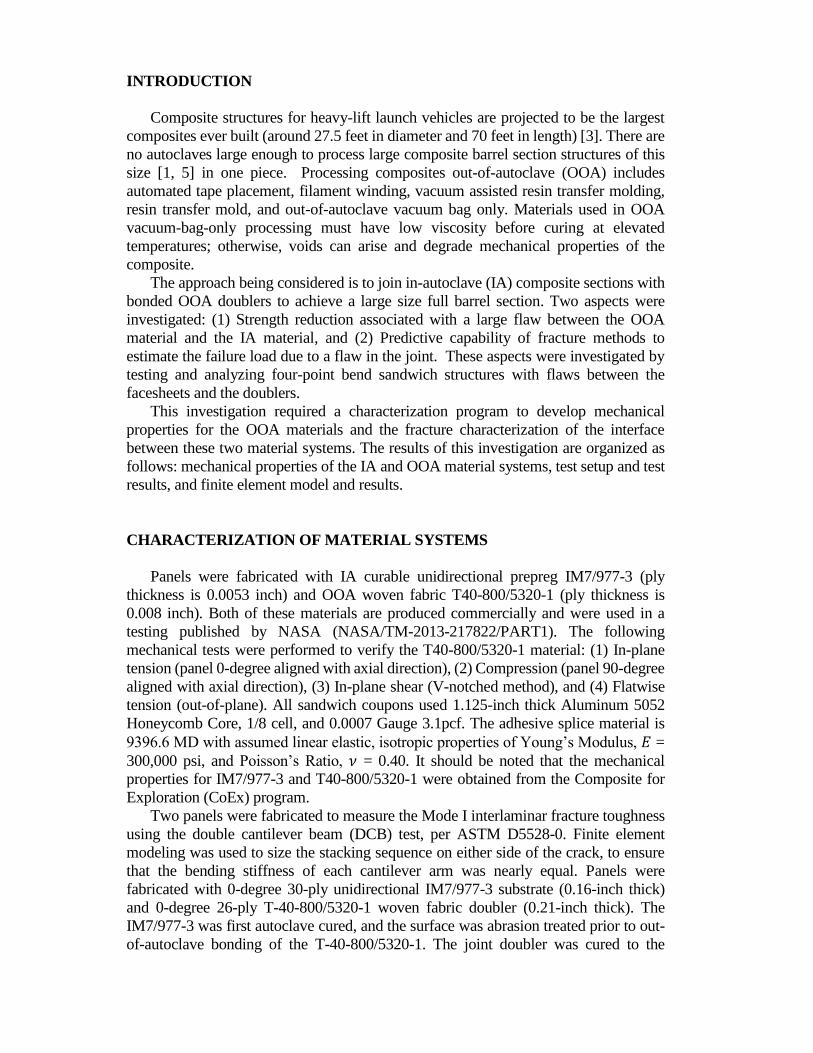
recommendation. Three coupons were tested with a 2.5-inch long flaw (Figure 1) and
three coupons with a 3.5 inch long flaw. A displacement gauge was used for accurate
measurement of crack opening displacement. Keyence digital microscope images were
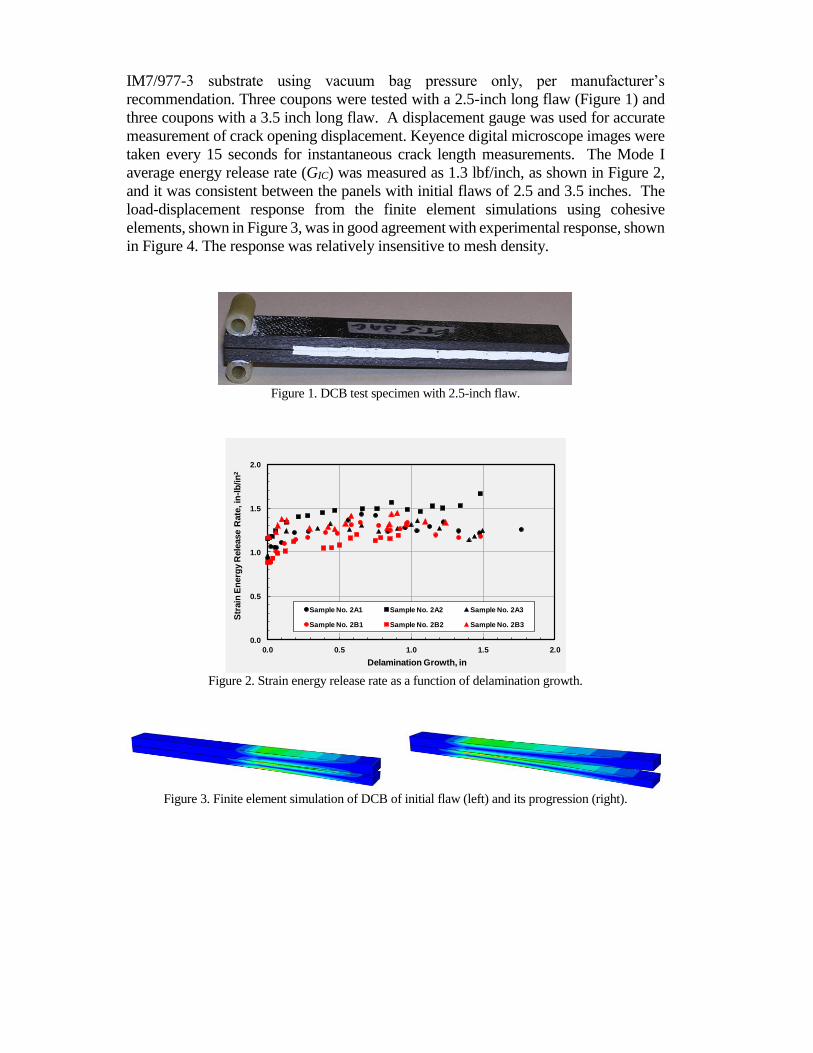
taken every 15 seconds for instantaneous crack length measurements. The Mode I
average energy release rate (GIC) was measured as 1.3 lbf/inch, as shown in Figure 2,
and it was consistent between the panels with initial flaws of 2.5 and 3.5 inches. The
load-displacement response from the finite element simulations using cohesive
elements, shown in Figure 3, was in good agreement with experimental response, shown
in Figure 4. The response was relatively insensitive to mesh density.
Figure 1. DCB test specimen with 2.5-inch flaw.
Figure 2. Strain energy release rate as a function of delamination growth.
Figure 3. Finite element simulation of DCB of initial flaw (left) and its progression (right).
0.0
0.5
1.0
1.5
2.0
0.0 0.5 1.0 1.5 2.0
Str
ain
En
erg
y R
ele
ase R
ate
, in
-lb
/in
2
Delamination Growth, in
Sample No. 2A1 Sample No. 2A2 Sample No. 2A3
Sample No. 2B1 Sample No. 2B2 Sample No. 2B3
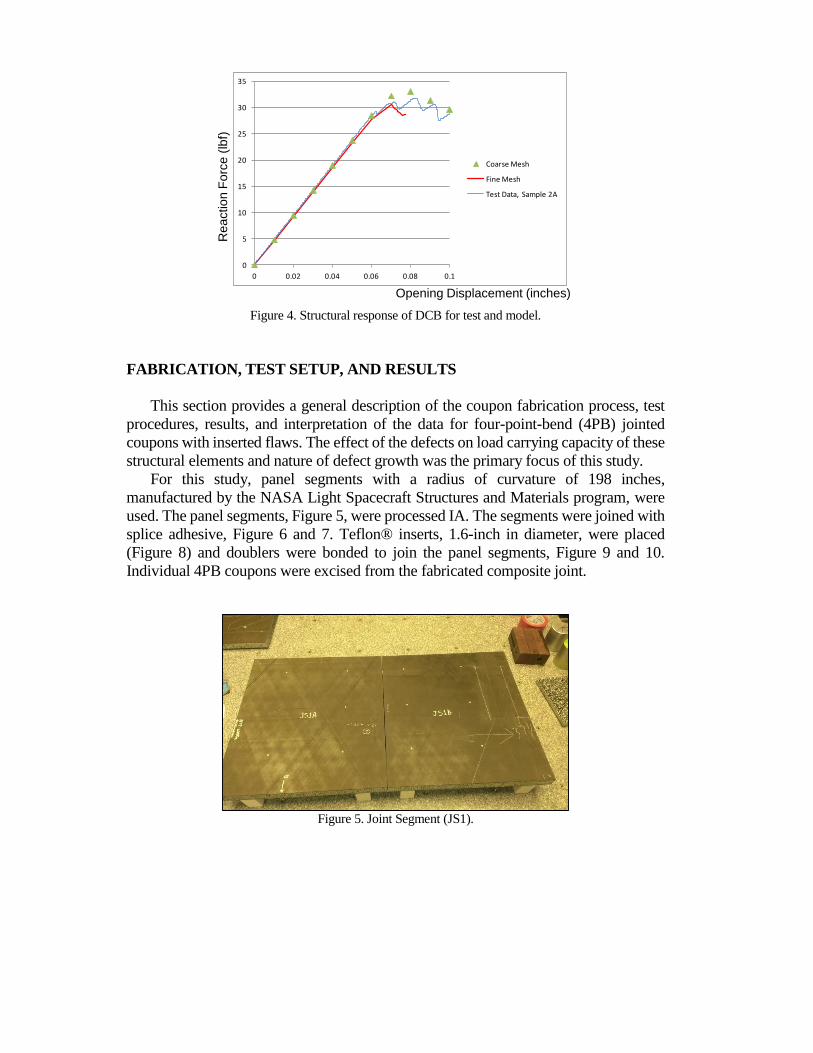
Figure 4. Structural response of DCB for test and model.
FABRICATION, TEST SETUP, AND RESULTS
This section provides a general description of the coupon fabrication process, test
procedures, results, and interpretation of the data for four-point-bend (4PB) jointed
coupons with inserted flaws. The effect of the defects on load carrying capacity of these
structural elements and nature of defect growth was the primary focus of this study.
For this study, panel segments with a radius of curvature of 198 inches,
manufactured by the NASA Light Spacecraft Structures and Materials program, were
used. The panel segments, Figure 5, were processed IA. The segments were joined with
splice adhesive, Figure 6 and 7. Teflon® inserts, 1.6-inch in diameter, were placed
(Figure 8) and doublers were bonded to join the panel segments, Figure 9 and 10.
Individual 4PB coupons were excised from the fabricated composite joint.
Figure 5. Joint Segment (JS1).
0
5
10
15
20
25
30
35
0 0.02 0.04 0.06 0.08 0.1
Coarse Mesh
Fine Mesh
Test Data, Sample 2A
Opening Displacement (inches)
Rea
ctio
n F
orc
e (
lbf)
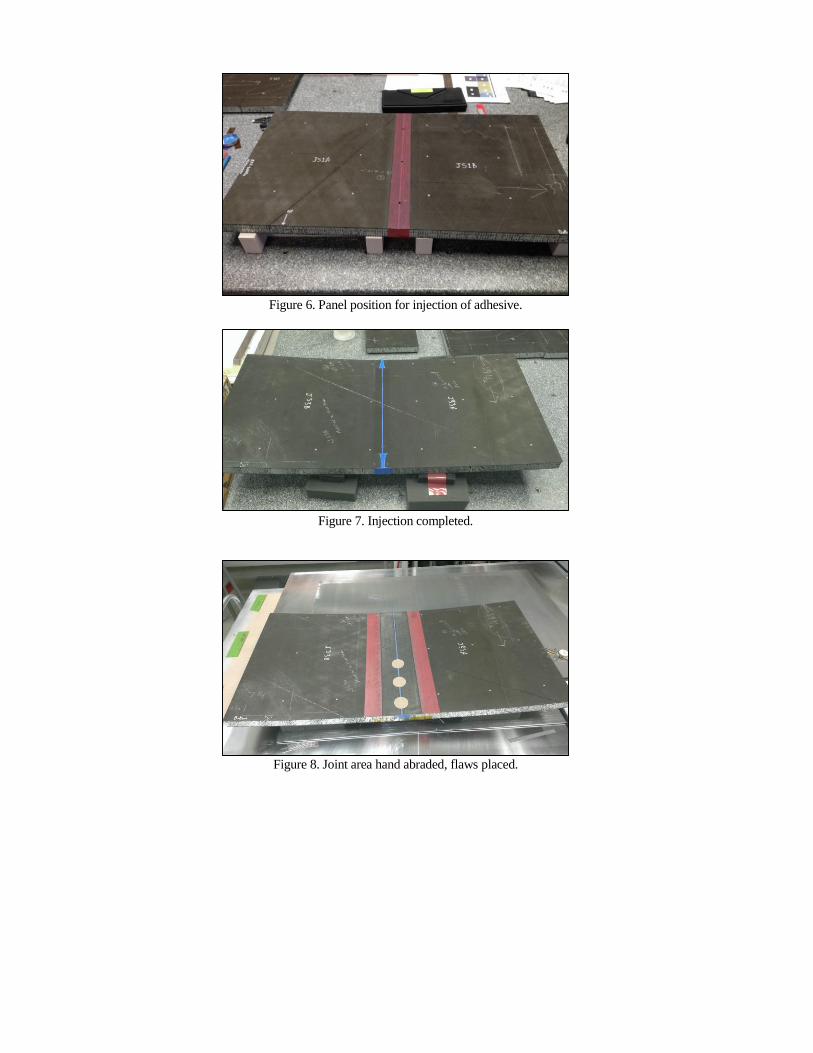
Figure 6. Panel position for injection of adhesive.
Figure 7. Injection completed.
Figure 8. Joint area hand abraded, flaws placed.
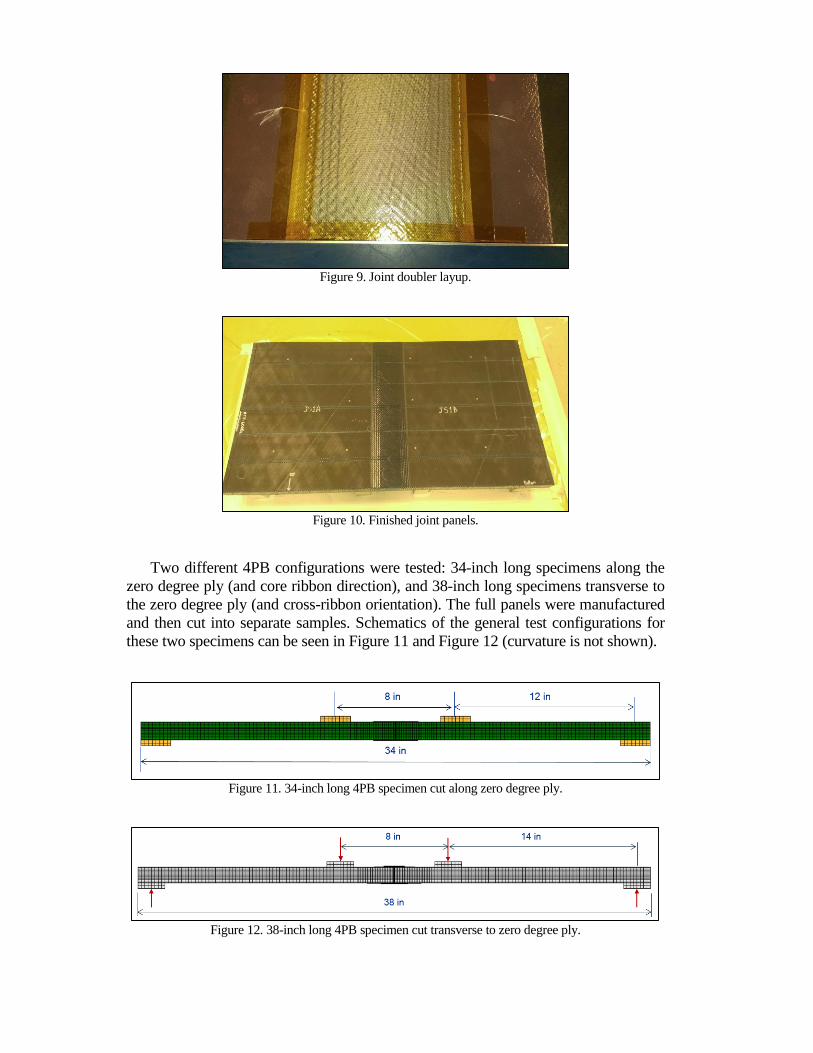
Figure 9. Joint doubler layup.
Figure 10. Finished joint panels.
Two different 4PB configurations were tested: 34-inch long specimens along the
zero degree ply (and core ribbon direction), and 38-inch long specimens transverse to
the zero degree ply (and cross-ribbon orientation). The full panels were manufactured
and then cut into separate samples. Schematics of the general test configurations for
these two specimens can be seen in Figure 11 and Figure 12 (curvature is not shown).
Figure 11. 34-inch long 4PB specimen cut along zero degree ply.
Figure 12. 38-inch long 4PB specimen cut transverse to zero degree ply.
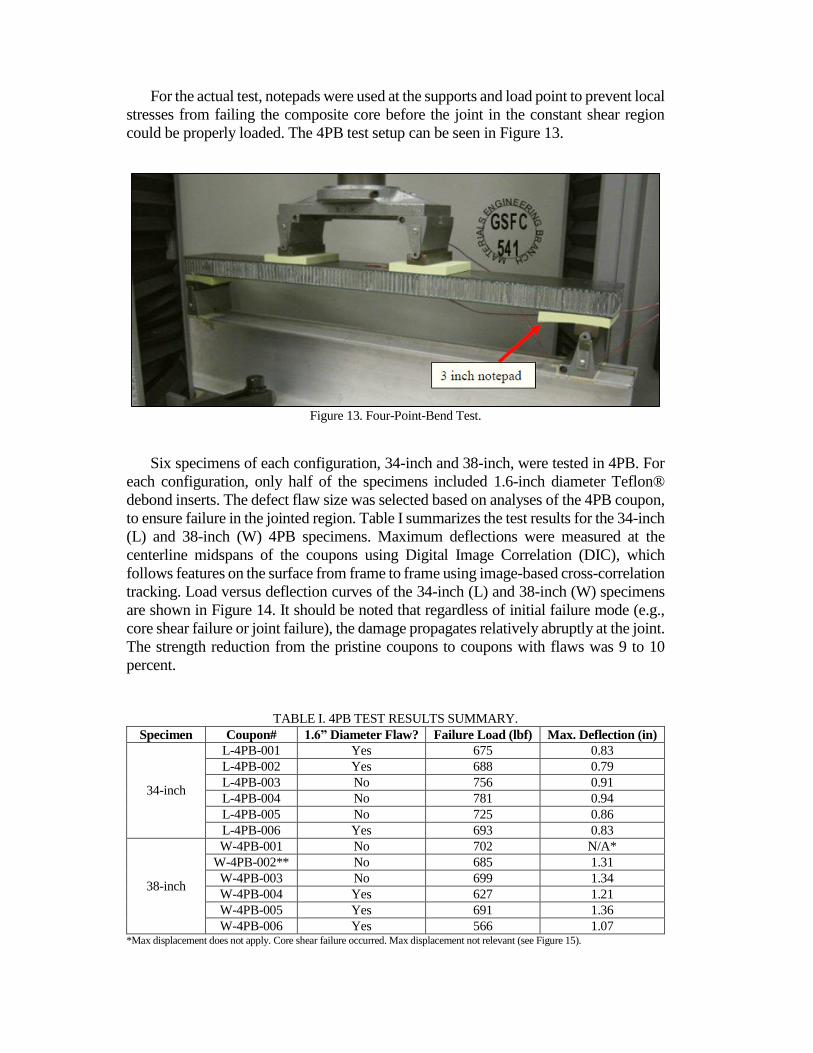
For the actual test, notepads were used at the supports and load point to prevent local
stresses from failing the composite core before the joint in the constant shear region
could be properly loaded. The 4PB test setup can be seen in Figure 13.
Figure 13. Four-Point-Bend Test.
Six specimens of each configuration, 34-inch and 38-inch, were tested in 4PB. For
each configuration, only half of the specimens included 1.6-inch diameter Teflon®
debond inserts. The defect flaw size was selected based on analyses of the 4PB coupon,
to ensure failure in the jointed region. Table I summarizes the test results for the 34-inch
(L) and 38-inch (W) 4PB specimens. Maximum deflections were measured at the
centerline midspans of the coupons using Digital Image Correlation (DIC), which
follows features on the surface from frame to frame using image-based cross-correlation
tracking. Load versus deflection curves of the 34-inch (L) and 38-inch (W) specimens
are shown in Figure 14. It should be noted that regardless of initial failure mode (e.g.,
core shear failure or joint failure), the damage propagates relatively abruptly at the joint.
The strength reduction from the pristine coupons to coupons with flaws was 9 to 10
percent.
TABLE I. 4PB TEST RESULTS SUMMARY.
Specimen Coupon# 1.6” Diameter Flaw? Failure Load (lbf) Max. Deflection (in)
34-inch
L-4PB-001 Yes 675 0.83
L-4PB-002 Yes 688 0.79
L-4PB-003 No 756 0.91
L-4PB-004 No 781 0.94
L-4PB-005 No 725 0.86
L-4PB-006 Yes 693 0.83
38-inch
W-4PB-001 No 702 N/A*
W-4PB-002** No 685 1.31
W-4PB-003 No 699 1.34
W-4PB-004 Yes 627 1.21
W-4PB-005 Yes 691 1.36
W-4PB-006 Yes 566 1.07 *Max displacement does not apply. Core shear failure occurred. Max displacement not relevant (see Figure 15).
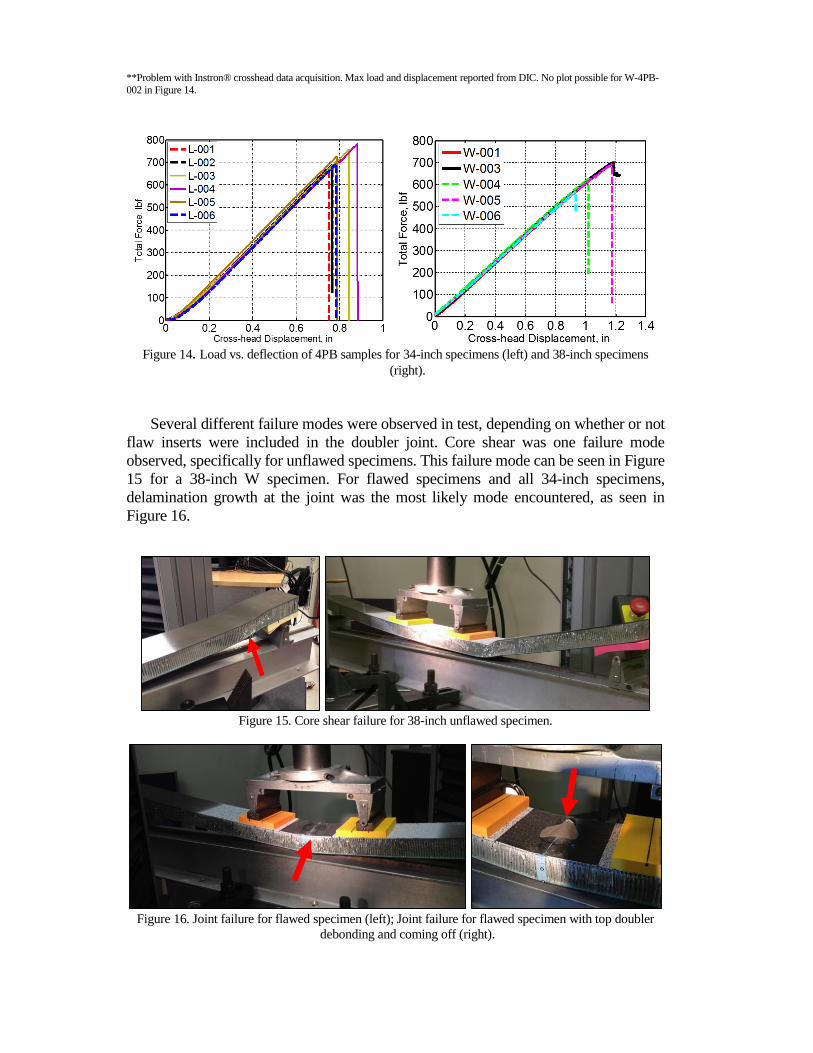
**Problem with Instron® crosshead data acquisition. Max load and displacement reported from DIC. No plot possible for W-4PB-
002 in Figure 14.
Figure 14. Load vs. deflection of 4PB samples for 34-inch specimens (left) and 38-inch specimens
(right).
Several different failure modes were observed in test, depending on whether or not
flaw inserts were included in the doubler joint. Core shear was one failure mode
observed, specifically for unflawed specimens. This failure mode can be seen in Figure
15 for a 38-inch W specimen. For flawed specimens and all 34-inch specimens,
delamination growth at the joint was the most likely mode encountered, as seen in
Figure 16.
Figure 15. Core shear failure for 38-inch unflawed specimen.
Figure 16. Joint failure for flawed specimen (left); Joint failure for flawed specimen with top doubler
debonding and coming off (right).
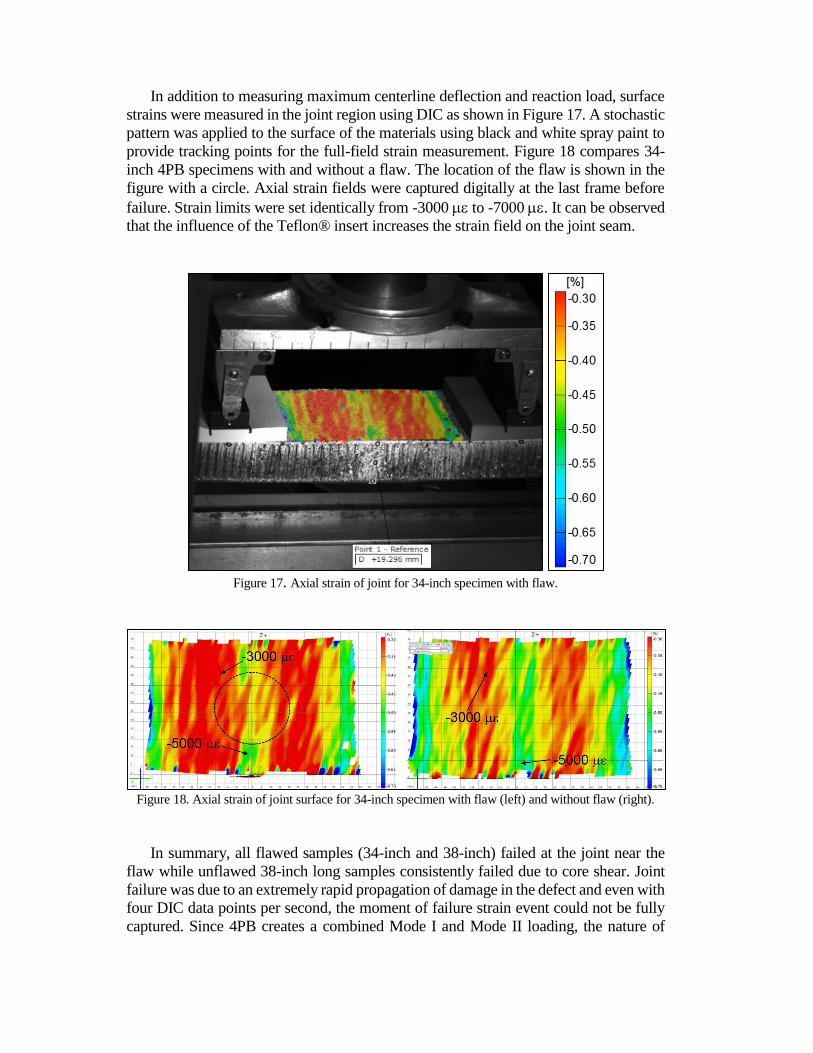
In addition to measuring maximum centerline deflection and reaction load, surface
strains were measured in the joint region using DIC as shown in Figure 17. A stochastic
pattern was applied to the surface of the materials using black and white spray paint to
provide tracking points for the full-field strain measurement. Figure 18 compares 34-
inch 4PB specimens with and without a flaw. The location of the flaw is shown in the
figure with a circle. Axial strain fields were captured digitally at the last frame before
failure. Strain limits were set identically from -3000 to -7000 . It can be observed
that the influence of the Teflon® insert increases the strain field on the joint seam.
Figure 17. Axial strain of joint for 34-inch specimen with flaw.
Figure 18. Axial strain of joint surface for 34-inch specimen with flaw (left) and without flaw (right).
In summary, all flawed samples (34-inch and 38-inch) failed at the joint near the
flaw while unflawed 38-inch long samples consistently failed due to core shear. Joint
failure was due to an extremely rapid propagation of damage in the defect and even with
four DIC data points per second, the moment of failure strain event could not be fully
captured. Since 4PB creates a combined Mode I and Mode II loading, the nature of
delamination may be different from a purely Mode I delamination. Overall the strength
reduction was measured to be 9-10 percent due to the inclusion of flaws.
FINITE ELEMENT MODEL
Finite element models (FEMs) were created to simulate the 4PB test performed in
the previous section using the commercial FEA suite, Abaqus. Both the 34-inch and 38-
inch specimens were modeled with and without flaws to compare to test results. To
simulate the bond behavior and damage propagation between the composite panels and
the joint doubler, two cohesive element formulations were used: (1) a user-defined solid
cohesive element using the Abaqus user element (UEL) subroutine, and (2) a surface-
based cohesive interaction using the built-in Abaqus contact formulations. Since 4PB
creates a mixed-mode failure, it was necessary to formulate some basis for determining
appropriate values of Mode II and Mode III fracture energies, GIIC and GIIIC,
respectively (GIIC ≈ GIIIC). To narrow down the range of potential values, each specimen
configuration was analyzed using three values: (1) GIIC = 1*GIC, (2) GIIC = 2*GIC, and
(3) GIIC = 3*GIC.
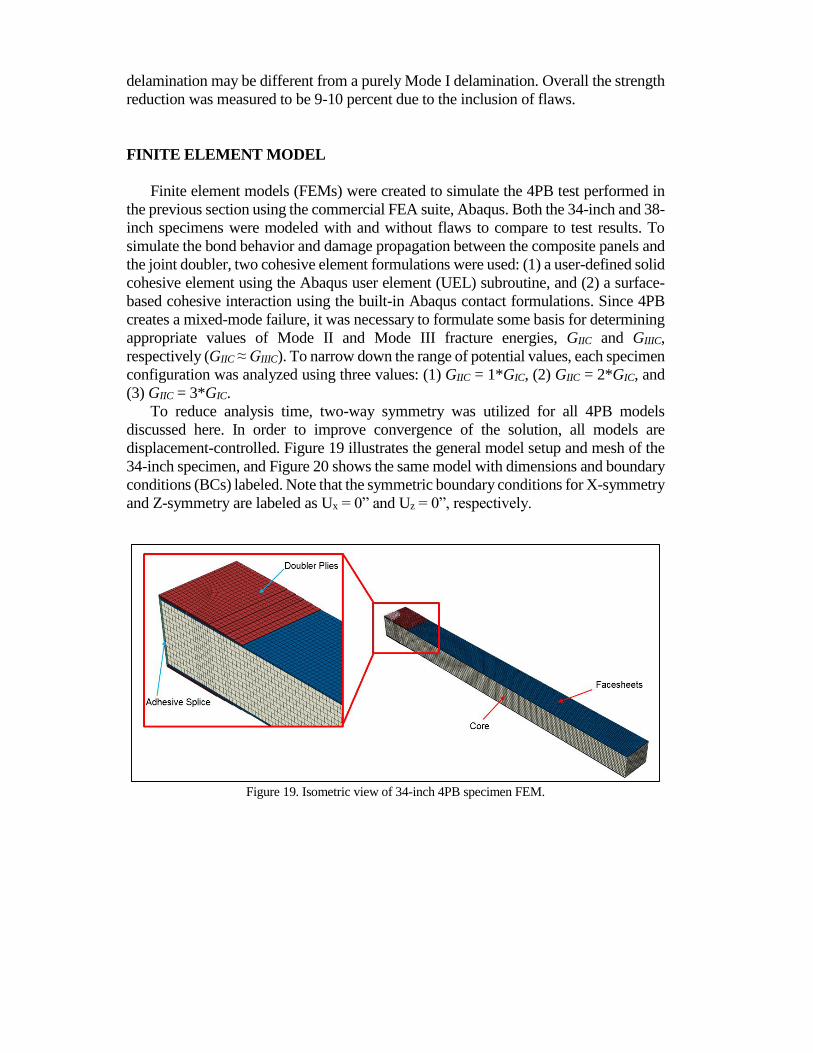
To reduce analysis time, two-way symmetry was utilized for all 4PB models
discussed here. In order to improve convergence of the solution, all models are
displacement-controlled. Figure 19 illustrates the general model setup and mesh of the
34-inch specimen, and Figure 20 shows the same model with dimensions and boundary
conditions (BCs) labeled. Note that the symmetric boundary conditions for X-symmetry
and Z-symmetry are labeled as Ux = 0” and Uz = 0”, respectively.
Figure 19. Isometric view of 34-inch 4PB specimen FEM.
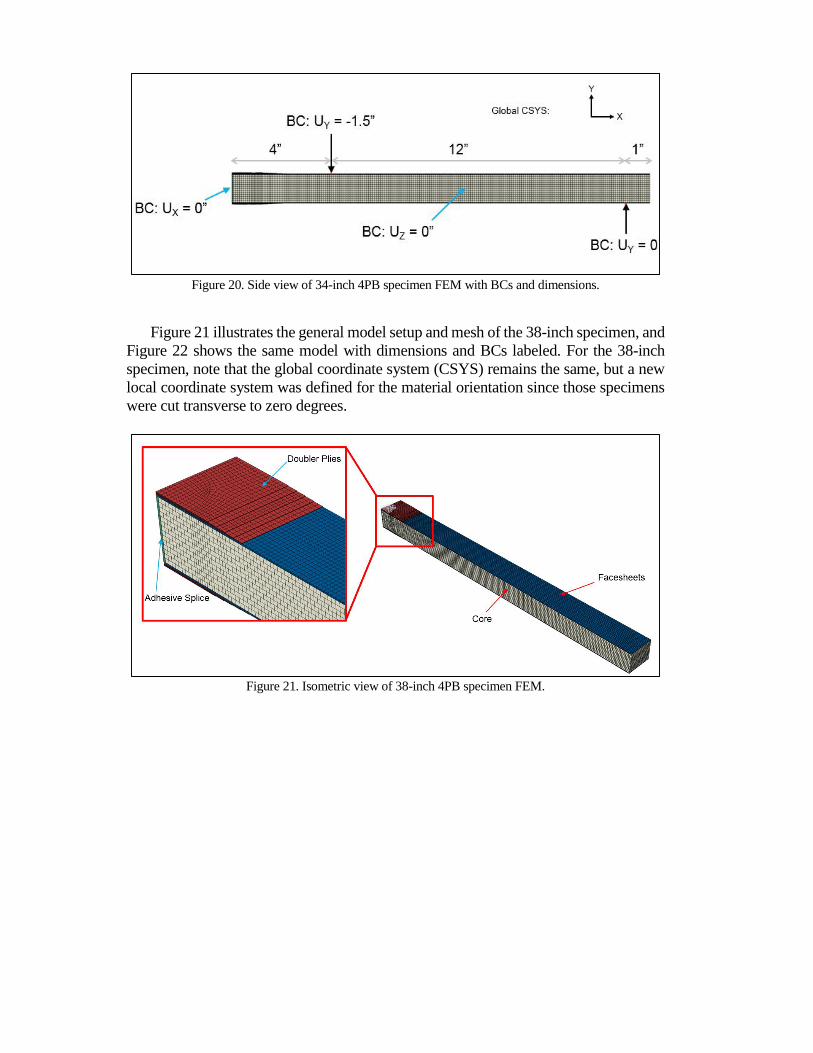
Figure 20. Side view of 34-inch 4PB specimen FEM with BCs and dimensions.
Figure 21 illustrates the general model setup and mesh of the 38-inch specimen, and
Figure 22 shows the same model with dimensions and BCs labeled. For the 38-inch
specimen, note that the global coordinate system (CSYS) remains the same, but a new
local coordinate system was defined for the material orientation since those specimens
were cut transverse to zero degrees.
Figure 21. Isometric view of 38-inch 4PB specimen FEM.
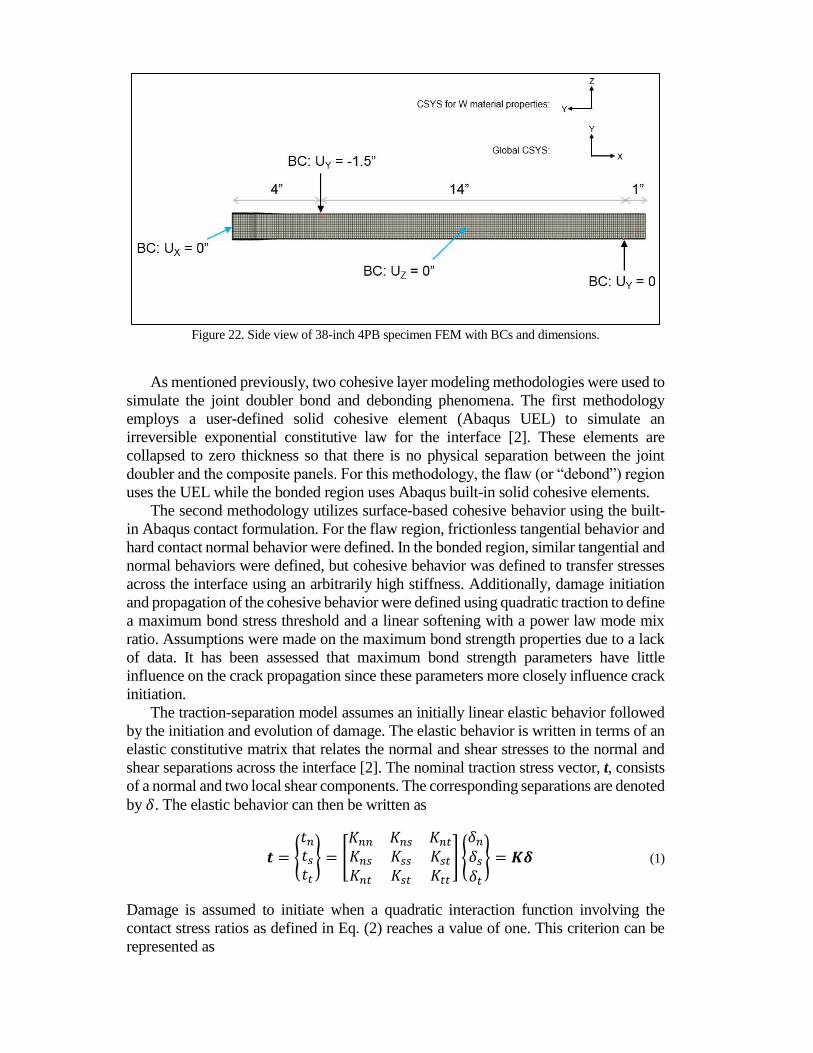
Figure 22. Side view of 38-inch 4PB specimen FEM with BCs and dimensions.
As mentioned previously, two cohesive layer modeling methodologies were used to
simulate the joint doubler bond and debonding phenomena. The first methodology
employs a user-defined solid cohesive element (Abaqus UEL) to simulate an
irreversible exponential constitutive law for the interface [2]. These elements are
collapsed to zero thickness so that there is no physical separation between the joint
doubler and the composite panels. For this methodology, the flaw (or “debond”) region
uses the UEL while the bonded region uses Abaqus built-in solid cohesive elements.
The second methodology utilizes surface-based cohesive behavior using the built-
in Abaqus contact formulation. For the flaw region, frictionless tangential behavior and
hard contact normal behavior were defined. In the bonded region, similar tangential and
normal behaviors were defined, but cohesive behavior was defined to transfer stresses
across the interface using an arbitrarily high stiffness. Additionally, damage initiation
and propagation of the cohesive behavior were defined using quadratic traction to define
a maximum bond stress threshold and a linear softening with a power law mode mix
ratio. Assumptions were made on the maximum bond strength properties due to a lack
of data. It has been assessed that maximum bond strength parameters have little
influence on the crack propagation since these parameters more closely influence crack
initiation.
The traction-separation model assumes an initially linear elastic behavior followed
by the initiation and evolution of damage. The elastic behavior is written in terms of an
elastic constitutive matrix that relates the normal and shear stresses to the normal and
shear separations across the interface [2]. The nominal traction stress vector, t, consists
of a normal and two local shear components. The corresponding separations are denoted
by 𝛿. The elastic behavior can then be written as
𝒕 = {
𝑡𝑛
𝑡𝑠
𝑡𝑡
} = [𝐾𝑛𝑛 𝐾𝑛𝑠 𝐾𝑛𝑡
𝐾𝑛𝑠 𝐾𝑠𝑠 𝐾𝑠𝑡
𝐾𝑛𝑡 𝐾𝑠𝑡 𝐾𝑡𝑡
] {
𝛿𝑛
𝛿𝑠
𝛿𝑡
} = 𝑲𝜹 (1)
Damage is assumed to initiate when a quadratic interaction function involving the
contact stress ratios as defined in Eq. (2) reaches a value of one. This criterion can be
represented as
{⟨𝑡𝑛⟩
𝑡𝑛𝑜 }
2
+ {𝑡𝑠
𝑡𝑠𝑜}
2
+ {𝑡𝑡
𝑡𝑡𝑜}
2
= 1 (2)
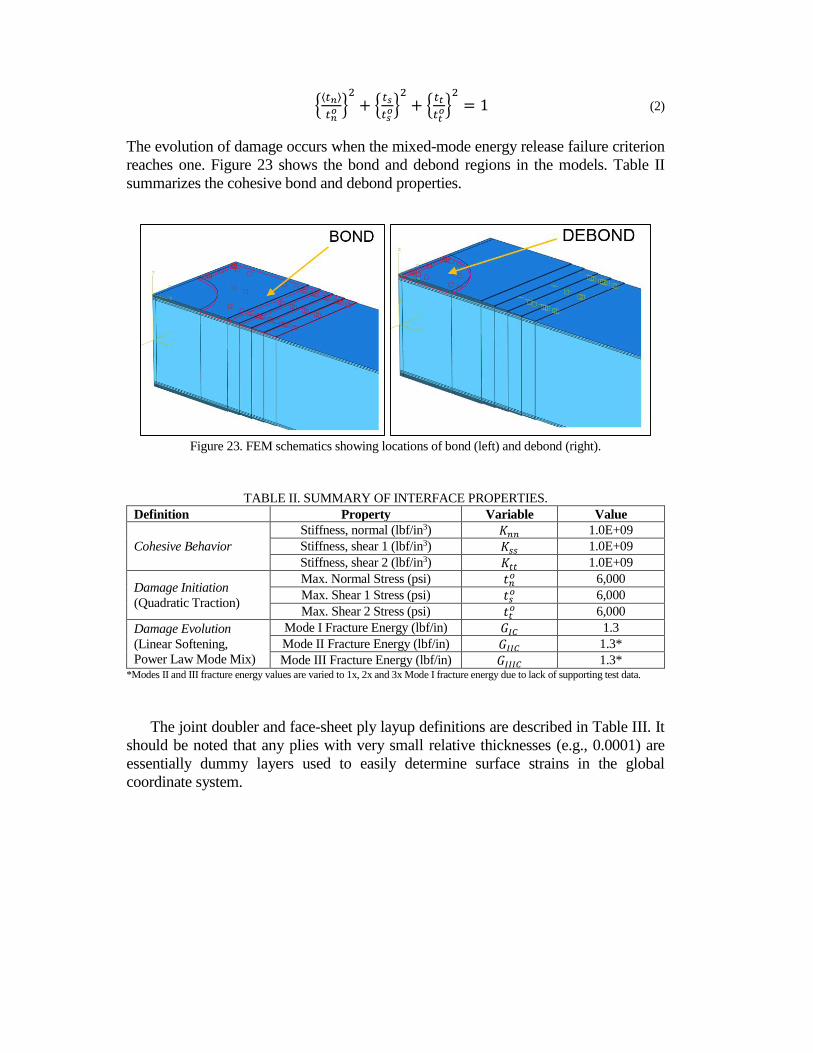
The evolution of damage occurs when the mixed-mode energy release failure criterion
reaches one. Figure 23 shows the bond and debond regions in the models. Table II
summarizes the cohesive bond and debond properties.
Figure 23. FEM schematics showing locations of bond (left) and debond (right).
TABLE II. SUMMARY OF INTERFACE PROPERTIES.
Definition Property Variable Value
Cohesive Behavior
Stiffness, normal (lbf/in3) 𝐾𝑛𝑛 1.0E+09
Stiffness, shear 1 (lbf/in3) 𝐾𝑠𝑠 1.0E+09
Stiffness, shear 2 (lbf/in3) 𝐾𝑡𝑡 1.0E+09
Damage Initiation
(Quadratic Traction)
Max. Normal Stress (psi) 𝑡𝑛𝑜 6,000
Max. Shear 1 Stress (psi) 𝑡𝑠𝑜 6,000
Max. Shear 2 Stress (psi) 𝑡𝑡𝑜 6,000
Damage Evolution
(Linear Softening,
Power Law Mode Mix)
Mode I Fracture Energy (lbf/in) 𝐺𝐼𝐶 1.3
Mode II Fracture Energy (lbf/in) 𝐺𝐼𝐼𝐶 1.3*
Mode III Fracture Energy (lbf/in) 𝐺𝐼𝐼𝐼𝐶 1.3* *Modes II and III fracture energy values are varied to 1x, 2x and 3x Mode I fracture energy due to lack of supporting test data.
The joint doubler and face-sheet ply layup definitions are described in Table III. It
should be noted that any plies with very small relative thicknesses (e.g., 0.0001) are
essentially dummy layers used to easily determine surface strains in the global
coordinate system.
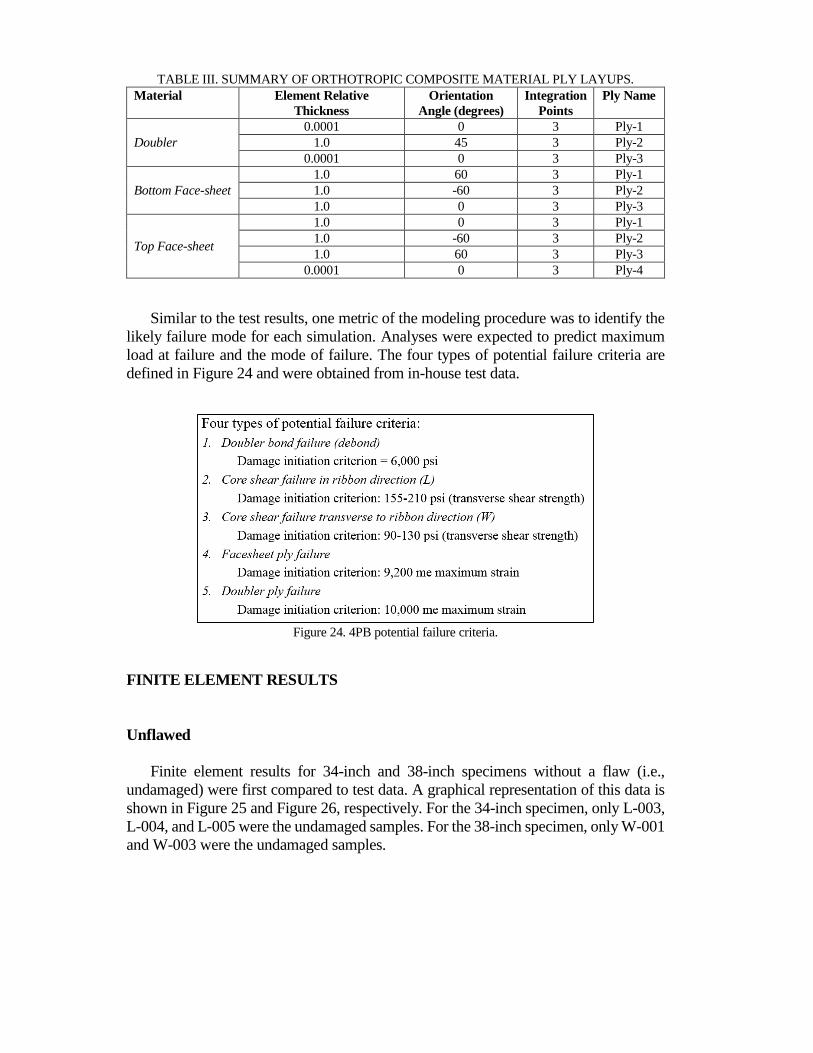
TABLE III. SUMMARY OF ORTHOTROPIC COMPOSITE MATERIAL PLY LAYUPS.
Material Element Relative
Thickness
Orientation
Angle (degrees)
Integration
Points
Ply Name
Doubler
0.0001 0 3 Ply-1
1.0 45 3 Ply-2
0.0001 0 3 Ply-3
Bottom Face-sheet
1.0 60 3 Ply-1
1.0 -60 3 Ply-2
1.0 0 3 Ply-3
Top Face-sheet
1.0 0 3 Ply-1
1.0 -60 3 Ply-2
1.0 60 3 Ply-3
0.0001 0 3 Ply-4
Similar to the test results, one metric of the modeling procedure was to identify the
likely failure mode for each simulation. Analyses were expected to predict maximum
load at failure and the mode of failure. The four types of potential failure criteria are
defined in Figure 24 and were obtained from in-house test data.
Figure 24. 4PB potential failure criteria.
FINITE ELEMENT RESULTS
Unflawed
Finite element results for 34-inch and 38-inch specimens without a flaw (i.e.,
undamaged) were first compared to test data. A graphical representation of this data is
shown in Figure 25 and Figure 26, respectively. For the 34-inch specimen, only L-003,
L-004, and L-005 were the undamaged samples. For the 38-inch specimen, only W-001
and W-003 were the undamaged samples.
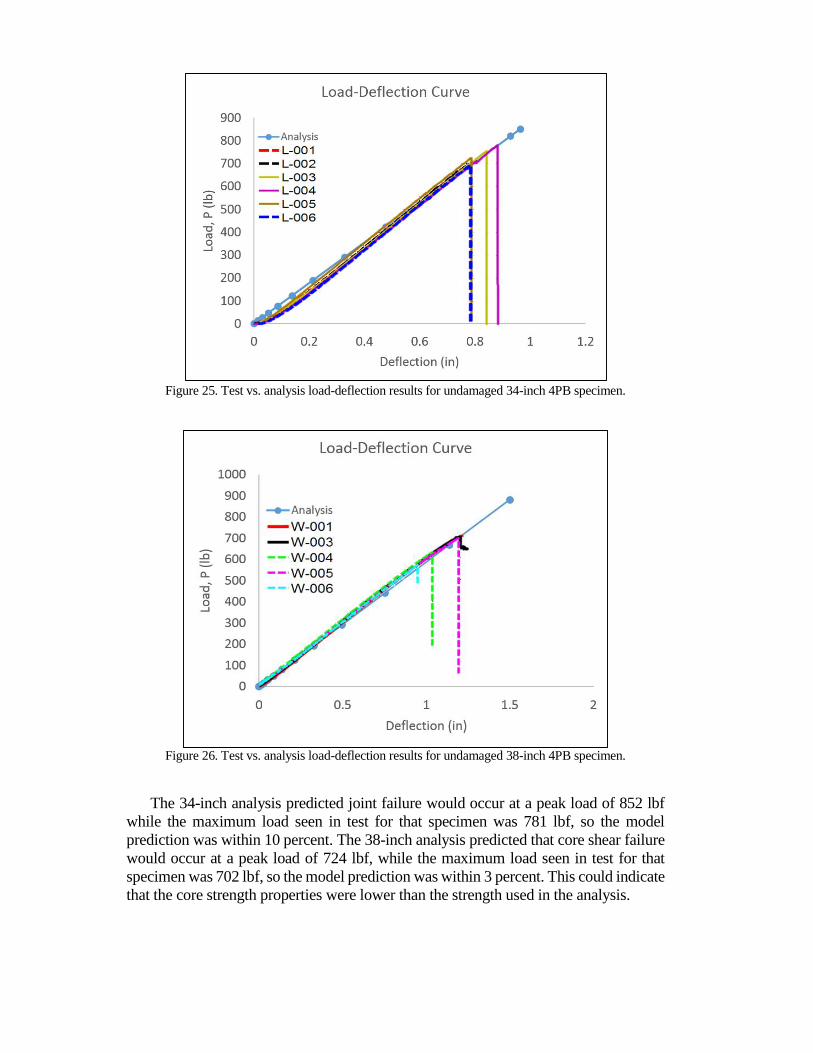
Figure 25. Test vs. analysis load-deflection results for undamaged 34-inch 4PB specimen.
Figure 26. Test vs. analysis load-deflection results for undamaged 38-inch 4PB specimen.
The 34-inch analysis predicted joint failure would occur at a peak load of 852 lbf
while the maximum load seen in test for that specimen was 781 lbf, so the model
prediction was within 10 percent. The 38-inch analysis predicted that core shear failure
would occur at a peak load of 724 lbf, while the maximum load seen in test for that
specimen was 702 lbf, so the model prediction was within 3 percent. This could indicate
that the core strength properties were lower than the strength used in the analysis.
Flawed
Next, finite element results for 34-inch and 38-inch specimens with a flaw insert
(debond) were compared to test data. Maximum face-sheet and doubler ply strains were
checked for all plies, and it was determined that since no face-sheet ply and no doubler
ply strains exceeded the strength values, then none of the models predicts -ply failure.
Similarly, maximum core shear stresses were checked throughout the honeycomb core.
Away from singularities near BCs, none of the honeycomb core shear stresses exceeds
the maximum transverse shear strength of 210 psi. Therefore, the models do not predict
core shear failure to occur in the specimens with flaws. All failures for flawed specimens
occurred by means of joint failure due to debonding, which is consistent to the mode
seen in tests.
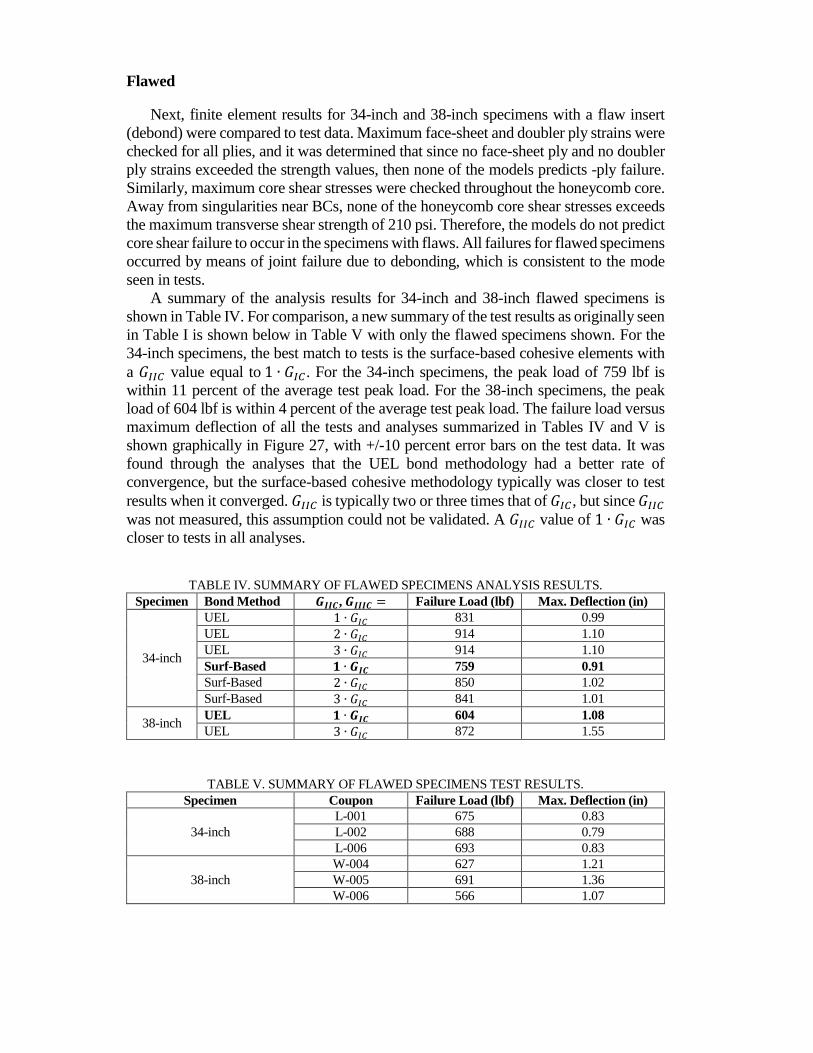
A summary of the analysis results for 34-inch and 38-inch flawed specimens is
shown in Table IV. For comparison, a new summary of the test results as originally seen
in Table I is shown below in Table V with only the flawed specimens shown. For the
34-inch specimens, the best match to tests is the surface-based cohesive elements with
a 𝐺𝐼𝐼𝐶 value equal to 1 ∙ 𝐺𝐼𝐶. For the 34-inch specimens, the peak load of 759 lbf is
within 11 percent of the average test peak load. For the 38-inch specimens, the peak
load of 604 lbf is within 4 percent of the average test peak load. The failure load versus
maximum deflection of all the tests and analyses summarized in Tables IV and V is
shown graphically in Figure 27, with +/-10 percent error bars on the test data. It was
found through the analyses that the UEL bond methodology had a better rate of
convergence, but the surface-based cohesive methodology typically was closer to test
results when it converged. 𝐺𝐼𝐼𝐶 is typically two or three times that of 𝐺𝐼𝐶, but since 𝐺𝐼𝐼𝐶
was not measured, this assumption could not be validated. A 𝐺𝐼𝐼𝐶 value of 1 ∙ 𝐺𝐼𝐶 was
closer to tests in all analyses.
TABLE IV. SUMMARY OF FLAWED SPECIMENS ANALYSIS RESULTS.
Specimen Bond Method 𝑮𝑰𝑰𝑪, 𝑮𝑰𝑰𝑰𝑪 = Failure Load (lbf) Max. Deflection (in)
34-inch
UEL 1 ∙ 𝐺𝐼𝐶 831 0.99
UEL 2 ∙ 𝐺𝐼𝐶 914 1.10
UEL 3 ∙ 𝐺𝐼𝐶 914 1.10
Surf-Based 𝟏 ∙ 𝑮𝑰𝑪 759 0.91
Surf-Based 2 ∙ 𝐺𝐼𝐶 850 1.02
Surf-Based 3 ∙ 𝐺𝐼𝐶 841 1.01
38-inch UEL 𝟏 ∙ 𝑮𝑰𝑪 604 1.08
UEL 3 ∙ 𝐺𝐼𝐶 872 1.55
TABLE V. SUMMARY OF FLAWED SPECIMENS TEST RESULTS.
Specimen Coupon Failure Load (lbf) Max. Deflection (in)
34-inch
L-001 675 0.83
L-002 688 0.79
L-006 693 0.83
38-inch
W-004 627 1.21
W-005 691 1.36
W-006 566 1.07
Figure 27. Failure load vs. max deflection of flawed 4PB tests and analyses.
The analysis that proved closest to tests was the 38-inch W specimen, with UEL
flaw and 𝐺𝐼𝐼𝐶 = 1 ∙ 𝐺𝐼𝐶, and was inspected for damage propagation at the joint doubler
interface to the panels. The scalar stiffness degradation (SDEG) variable, a measure of
an element’s residual stiffness, was monitored at the interface through the analyses. The
SDEG has a value from zero to one where a value of one corresponds to a fully damaged
bond element. A plot of this variable through the analysis step is shown in Figure 28 for
the element where bond failure is first initiated. From Figure 28 it can be concluded that
bond failure initiates at approximately 35 percent of the maximum displacement
applied, which corresponds to a load of 308 lbf. Ultimate failure is predicted to occur at
close to 72 percent of the maximum displacement applied. Figure 29 shows a contour
plot of SDEG in the region of the specimen where bond failure is occurring.
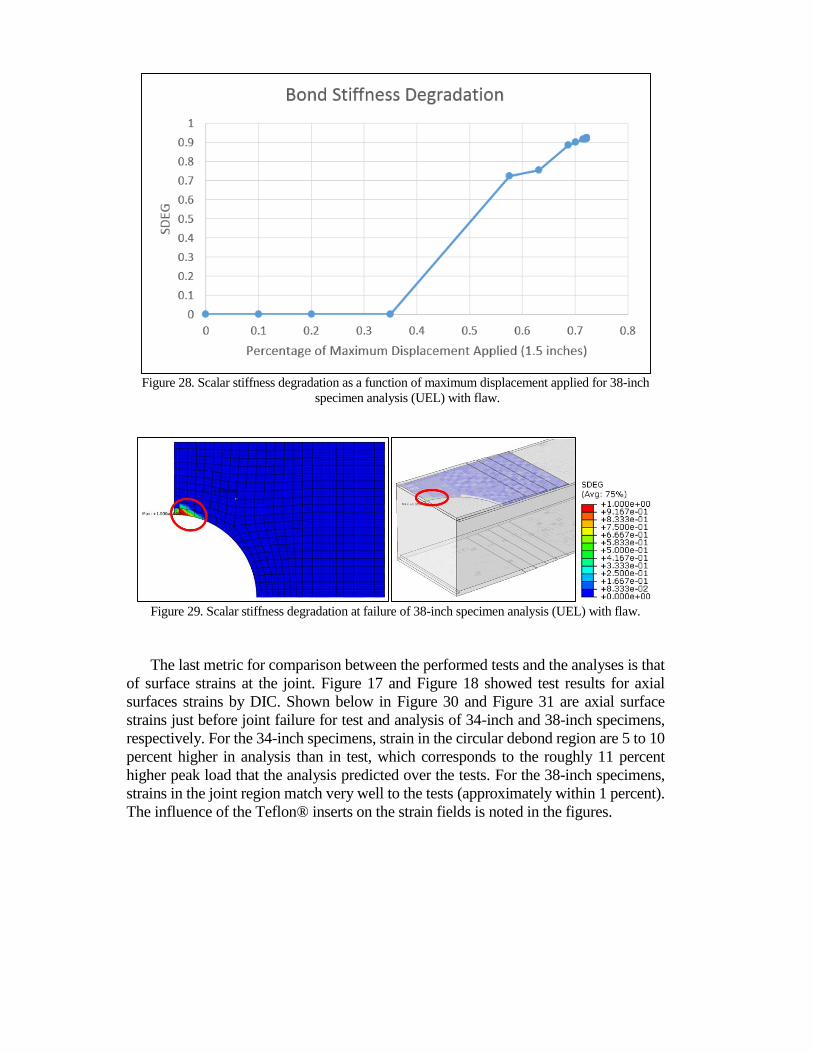
Figure 28. Scalar stiffness degradation as a function of maximum displacement applied for 38-inch
specimen analysis (UEL) with flaw.
Figure 29. Scalar stiffness degradation at failure of 38-inch specimen analysis (UEL) with flaw.
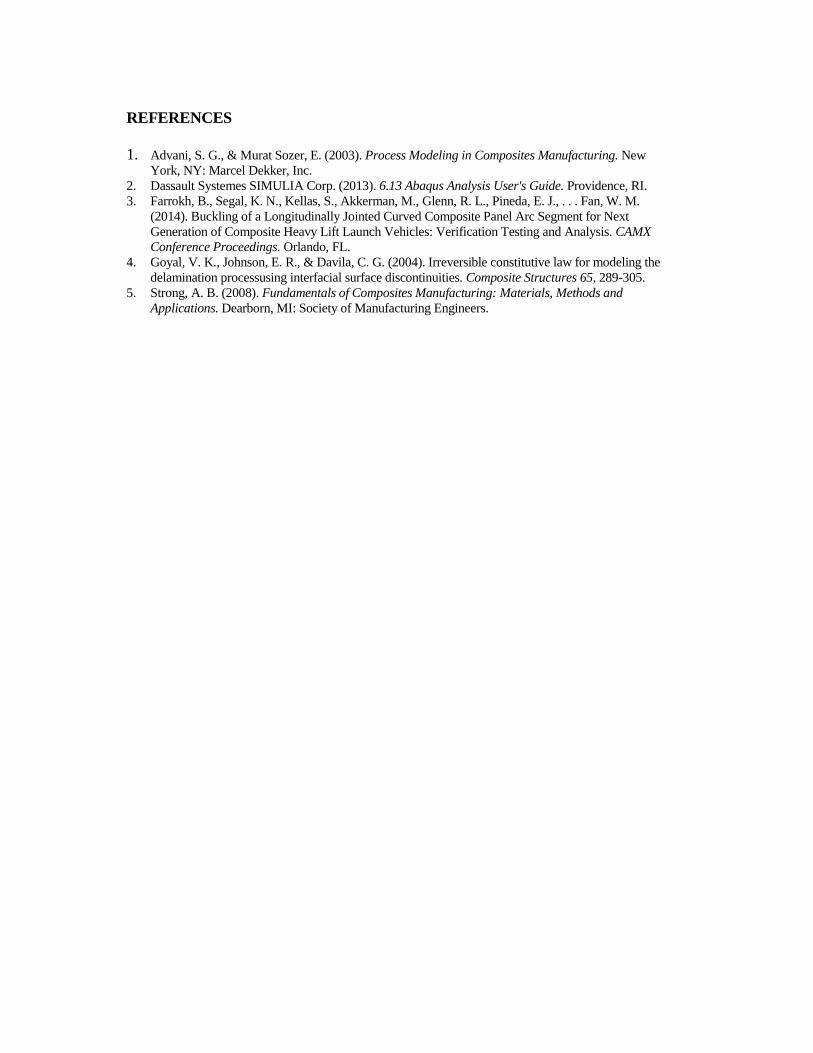
The last metric for comparison between the performed tests and the analyses is that
of surface strains at the joint. Figure 17 and Figure 18 showed test results for axial
surfaces strains by DIC. Shown below in Figure 30 and Figure 31 are axial surface
strains just before joint failure for test and analysis of 34-inch and 38-inch specimens,
respectively. For the 34-inch specimens, strain in the circular debond region are 5 to 10
percent higher in analysis than in test, which corresponds to the roughly 11 percent
higher peak load that the analysis predicted over the tests. For the 38-inch specimens,
strains in the joint region match very well to the tests (approximately within 1 percent).
The influence of the Teflon® inserts on the strain fields is noted in the figures.
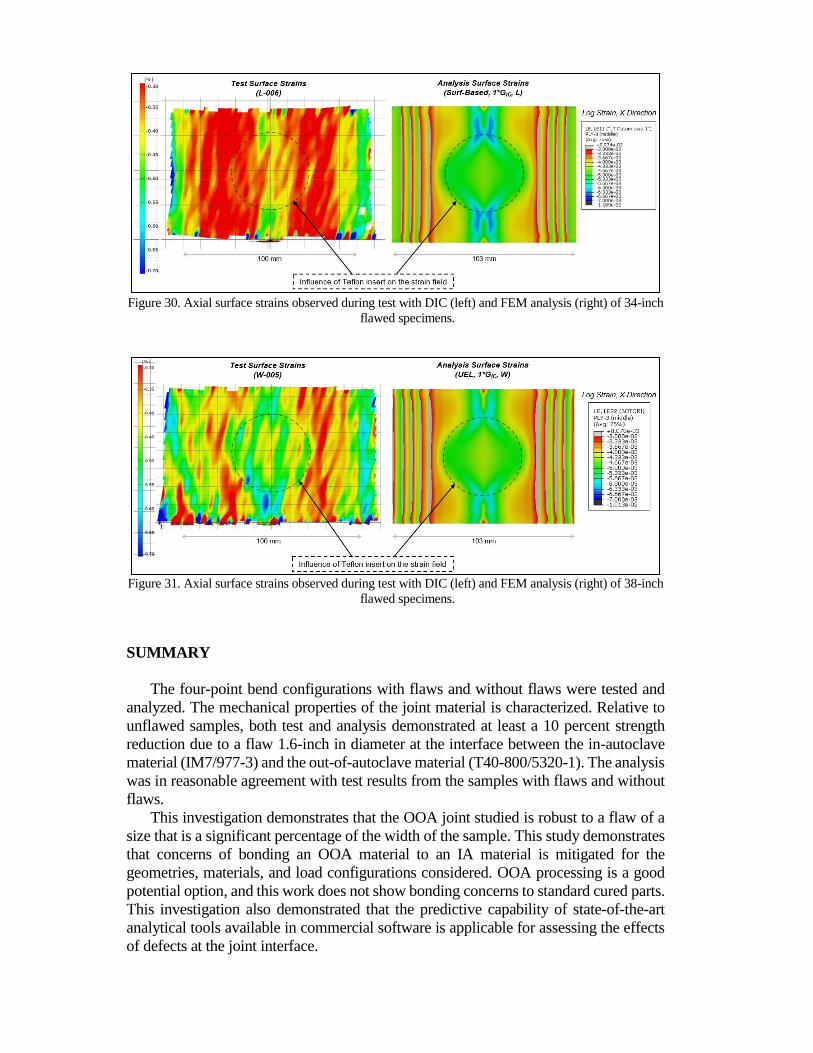
Figure 30. Axial surface strains observed during test with DIC (left) and FEM analysis (right) of 34-inch
flawed specimens.
Figure 31. Axial surface strains observed during test with DIC (left) and FEM analysis (right) of 38-inch
flawed specimens.
SUMMARY
The four-point bend configurations with flaws and without flaws were tested and
analyzed. The mechanical properties of the joint material is characterized. Relative to
unflawed samples, both test and analysis demonstrated at least a 10 percent strength
reduction due to a flaw 1.6-inch in diameter at the interface between the in-autoclave
material (IM7/977-3) and the out-of-autoclave material (T40-800/5320-1). The analysis
was in reasonable agreement with test results from the samples with flaws and without
flaws.
This investigation demonstrates that the OOA joint studied is robust to a flaw of a
size that is a significant percentage of the width of the sample. This study demonstrates
that concerns of bonding an OOA material to an IA material is mitigated for the
geometries, materials, and load configurations considered. OOA processing is a good
potential option, and this work does not show bonding concerns to standard cured parts.
This investigation also demonstrated that the predictive capability of state-of-the-art
analytical tools available in commercial software is applicable for assessing the effects
of defects at the joint interface.
REFERENCES
1. Advani, S. G., & Murat Sozer, E. (2003). Process Modeling in Composites Manufacturing. New
York, NY: Marcel Dekker, Inc. 2. Dassault Systemes SIMULIA Corp. (2013). 6.13 Abaqus Analysis User's Guide. Providence, RI.
3. Farrokh, B., Segal, K. N., Kellas, S., Akkerman, M., Glenn, R. L., Pineda, E. J., . . . Fan, W. M.
(2014). Buckling of a Longitudinally Jointed Curved Composite Panel Arc Segment for Next
Generation of Composite Heavy Lift Launch Vehicles: Verification Testing and Analysis. CAMX
Conference Proceedings. Orlando, FL.
4. Goyal, V. K., Johnson, E. R., & Davila, C. G. (2004). Irreversible constitutive law for modeling the
delamination processusing interfacial surface discontinuities. Composite Structures 65, 289-305.
5. Strong, A. B. (2008). Fundamentals of Composites Manufacturing: Materials, Methods and
Applications. Dearborn, MI: Society of Manufacturing Engineers.