Embed Size (px)
Citation preview
[email protected] Jindal School of Government and Public Policy OP Jindal Global University Sonipat Narela Road Near Jagdishpur Village, Sonipat, Haryana 131001
Pandemic and the Crisis of Extreme Inequality in India
Ishan Anand, Anjana Thampi
JSGP Working Paper No. JSGP-20-001
Date: 19th October, 2020

1
Pandemic and the Crisis of Extreme Inequality in India
Ishan Anand Anjana ThampiAssistant Professor Assistant Professor
Jindal Global Law School Jindal Global Law School
O. P. Jindal Global University O. P. Jindal Global University
Sonepat, India Sonepat, India
[email protected] [email protected]
Abstract
The pandemic and the subsequent lockdown created a public health and humanitarian crisis formillions of workers and families in India. Through extensive data analyses of multiple nationallyrepresentative sample surveys, we argue that the effects of the pandemic and the associatedlockdown have been exacerbated by the pre-existing crisis of extreme inequalities in the country.Multiple dimensions of inequality are explored, such as the disparities in the labour market andin the access to basic amenities. We briefly indicate our most striking findings. 63 percent ofthe workers and 53 percent of the households in India earned less than Rs 10,000 per monthin 2018-19. Substantial gaps in earnings by gender, caste and area of residence persist – onaverage, female earnings was 63 percent of male earnings, SC earnings was 55 percent of non-ST/SC/OBC earnings and rural earnings was only half of urban earnings in 2018-19. About 905million people did not have access to piped water, 287 million did not have access to toilets, 127million lived in rented accommodations, and one-fourth of the population lived in single-roomdwellings in 2017-18. The implications of the long-term neglect of the public healthcare systemand the disparities in the access to education are discussed. In addition to inequality measuresof monetary measures such as household earnings, we construct a multi-dimensional inequalityindex that combines indicators in housing, water and sanitation. This gives insights on the ex-tent of inequality in non-monetary dimensions. The evidence in this paper clearly identifies thatextreme multi-dimensional disparities and disadvantages lie at the heart of the current crisis inIndia and highlights the need to put redistribution at the centre stage of the development agenda.
Keywords: COVID-19, inequality, labour, earnings, multidimensional inequality, India
© Ishan Anand and Anjana Thampi
2
1 Introduction
The COVID-19 pandemic and the lockdown have exposed and exacerbated the crisis of extremeinequalities and the several layers of disadvantages that many in India face. The pandemic hitIndia at a time when the economy was already reeling from a sustained economic slowdown.The disproportionate burden of the public health and economic crisis fell on migrants, manuallabourers, petty producers and informal workers, who had little cushion of policy or communitysupport. The pandemic and an unplanned lockdown unleashed an unprecedented humanitariancrisis for millions, but the vulnerabilities they face have been building for decades.
In this paper, we delve into the nature and extent of the existing inequalities, some evidence ofwhich has become starkly clear over the course of the pandemic. We analyse the disparities in thelabour market and present findings on inequalities in household earnings. The inequality in theaccess to health, education, and basic amenities such as drinking water, sanitation and housingfacilities is then examined. We use nationally representative household sample survey data thatwere collected before the pandemic and the ensuing lockdown. Our results therefore point tothe inequality in multiple dimensions that exacerbated the impact of the pandemic on certainsections of the society and highlight the areas where urgent policy intervention is required.
2 Inequality with Indian characteristics – and why it mat-
ters
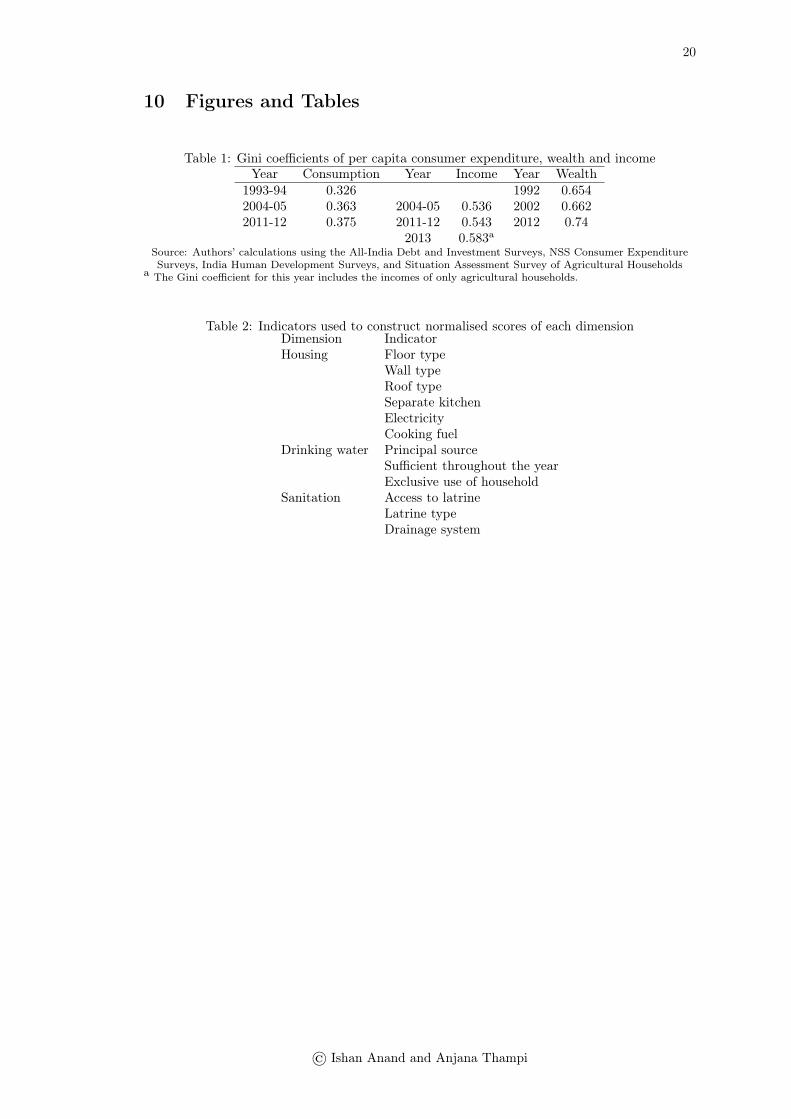
The dominant view in policy circles and among a section of influential economists has been toeither deny the rise in inequality altogether or to dismiss the concerns of distribution citingincrease in economic growth and fall in poverty levels. For instance, studies use householdconsumer expenditure survey data to argue that neither the levels of nor the trends in inequalityare alarming (Ahluwalia, 2011; Bhagwati & Panagariya, 2013; Bhalla, 2017). The Gini coefficientof monthly per capita consumer expenditure increased from 0.326 in 1993-94 to 0.375 in 2011-12(Table 1).1 The argument that a Gini coefficient of 0.375, or that its rise by 4.9 percentagepoints between 1993-94 and 2011-12, is not high enough to be alarmed is misleading for severalreasons. First, the distribution of consumption expenditure is usually more equitable than thedistribution of income and wealth. Even so, a Gini coefficient of 0.375 is tantamount to adistribution where 37.5 percent of the population consume nothing (consumption expenditureis zero), while the total consumption expenditure is equally divided between the rest of thepopulation.2 Second, India is not a low-inequality country when compared to the rest of theworld, even in the distribution of consumption expenditure. As per the Gini coefficient ofconsumption expenditure data compiled by the Global Consumption and Income Project, Indiaranked 83rd out of 161 countries in 2012.3 The distribution of wealth in India is far more unequal,with a Gini coefficient of 0.740 in 2012. So is the income distribution, with a Gini of 0.543 in2011-12 as per the India Human Development Survey. As per the Situation Assessment Survey,the Gini coefficient of per capita income of agricultural households was 0.587 in 2013. Eventhese high levels of consumption, income, and wealth inequality are likely to be under-estimates.
1The last round of the consumer expenditure survey for which the unit-level data is available in the publicdomain is 2011-12. The latest round of the survey was conducted in 2017-18, but the data and the report werenever released.
2This comparison is inspired by Milanovic and Yitzhaki (2002).3http://gcip.info/
© Ishan Anand and Anjana Thampi
3
It is well-acknowledged that household sample surveys tend to underestimate inequality due tounder-reporting and under-sampling of the very rich (Weisskopf, 2011).
The rise in inequality is also defended on the grounds that it is intrinsic to the growth processthat has helped alleviate poverty. India’s poverty headcount ratio, as per the poverty linerecommended by the Tendulkar Committee, declined from 45.3 percent in 1993-94 to 37.2 percentin 2004-05 and 21.9 percent in 2011-12. The Rangarajan committee estimated the proportionof people below poverty line at 29.5 percent in 2011-12. The successive official poverty lineshave been criticised on the grounds of being abysmally low. It has also been argued that themethodologies of poverty estimation are based on shaky conceptual foundations and do not allowverification of the trend, let alone the magnitude of changes in the poverty ratio (Subramanian,2019). Moreover, the most recent data shows a rise in the poverty rate between 2011-12 and2017-18 (Bhattacharya & Devulapalli, 2019).
Alternatively, inequality can be seen as leading to intrinsic as well as instrumental problems.Rise in inequality is an important concern even in a poor country like India. Economic equalityis needed for the creation of a society where people are treated as fundamentally equal, to bridgethe gap between identity groups, for greater representation of the historically marginalised,and for providing equality of opportunity to all (Weisskopf, 2011). Inequality can also leadto economic instability and crisis, and decline in critical public investment in sectors such aseducation, infrastructure, and research (Stiglitz, 2012). A recent empirical study shows thatthe falling wage share in India negatively affected aggregate demand through its effects on theconsumption and import propensity in India (Dasgupta, 2020). Further, even if the concentrationof income at the top end does not reduce the average income levels at the bottom, it is possiblethat a large segment of the population loses out in dimensions of well-being other than income(Deaton, 2013). For instance, unequal distribution of incomes could be one of the explanationsfor the limited role of economic growth in improving child anthropometry in India over the pasttwo decades (Thampi, 2019).
Extreme inequality in India arises not only from the skewed functional distributions, but alsofrom the persistence of social disparities and hierarchies. Caste, as B R Ambedkar (1936) noted,is not just a division of labour, but a division of labourers in a graded hierarchy. The caste systemhas left prominent traces on the modern Indian society, much more than status disparities thatwere a product of European societies of order (Piketty, 2020). The durability of caste inequalities– in land ownership (Anand, 2016), in wealth (Tagade, Naik, & Thorat, 2018), through the con-tinued practice of untouchability (Thorat & Joshi, 2020) and through caste-based discriminationin the labour market – has been recorded (Thorat & Attewell, 2010; Madheswaran & Attewell,2010). Gendered inequalities are also stark and are reflected in women’s low participation in thelabour market and the disproportionate burden of care work (Ghosh, 2019), significant pay gapsand evidence of gender discrimination in the labour market (Duraisamy & Duraisamy, 2006;Deshpande, Goel, & Khanna, 2018). The persistence of ‘conjugated oppression’4 produces worseoutcomes for certain sections of the population. Among the worst sufferers of caste-gender-classoppression are the 1.2 million manual scavengers, who are considered ‘untouchables among theuntouchables’, and of whom over 95 percent are women (Kumar & Preet, 2020).
While the traditional forms of disparities continue to persist, the rise in neoliberalism has super-imposed an inequality-inducing regime on the existing stratified society. Studies have warnedof the dangers of an uneven growth process, reflected in the high and rising levels of wealth
4Lerche & Shah (2018) discuss the process of conjugated oppression and its relation to capitalist class relationsin India.
© Ishan Anand and Anjana Thampi
4
inequality during the neoliberal period (Anand & Thampi, 2016) and in the dramatic and un-precedented rise in the income share of the top 1 percent of the population (Chancel & Piketty,2019). This has led to worsening class inequalities (Vakulabharanam, 2010), and rise in ur-ban inequality has been identified as one of the drivers of rising disparity (Vakulabharanam &Motiram, 2019), along with uneven regional growth patterns and the rising rural-urban gap.
A “unique cocktail of lethal divisions and disparities” (Drèze & Sen, 2013, p. 213) characterisesinequality in India. Although advances have been made in social life and in access to amenitiesover the years, wide disparities continue, and have worsened the effects of the pandemic. Earlierstudies have covered various dimensions of inequality in India (Thorat & Newman (eds.), 2010;Himanshu, 2018; Haque & Reddy (eds.), 2019). This paper contributes to the existing literatureby presenting the latest estimates of inequalities across dimensions and analysing them in thecontext of the pandemic and the stringent lockdown in India.
3 Data and methodology
This study uses nationally representative household sample surveys relating to several aspectsof well-being. For the aspects related to the labour market and household earnings, we use thePeriodic Labour Force Survey (PLFS) data for 2018-19. To study inequality in other dimensions,we use the Household Social Consumption: Health and Education modules (2017-18), and theDrinking Water, Sanitation, Hygiene and Housing Condition (2018) surveys conducted by theNational Sample Survey Office.
The PLFS replaces the quinquennial Employment and Unemployment Survey (EUS), which waslast conducted in 2011-12. The differences between the PLFS and the EUS have been discussedin detail elsewhere (Anand & Thampi, 2019). In a useful departure from the earlier EUS, thePLFS captures the earnings of the self-employed who constitute a majority of India’s workforce.With the PLFS, it is now possible to estimate the earnings from three sources – casual labour,self-employment, and regular wage/salaried jobs in India. While the earnings for self-employmentand regular wage/salaried jobs were reported on a monthly basis, the earnings of casual workerswere reported for the week of the survey. We reached an estimate of the monthly earnings ofcasual workers by multiplying their weekly earnings by four.
We arrived at a measure of household earnings by adding up the earnings of its members fromthe three sources of employment, but there is no information available on rental income, pen-sions, remittances, interest, or income from financial assets. The estimates of household earningstherefore do not represent the distribution of total income, which could seriously underestimatethe levels of inequality. In various data sources on Indian agriculture, such as the Situation As-sessment Surveys of agricultural households 2003 and 2013 and the Cost of Cultivation Surveys,more than six percent of agricultural households reported negative incomes – cultivators facinglosses in agriculture. However, no negative incomes have been reported in the agricultural sectorin the PLFS 2018-19, which may be due to the absence of detailed questions on the compo-nents of costs and returns. Unreported negative incomes would inflate the average earnings andunderestimate inequality.
We use the Yitzhaki (1994) method to compute the Gini coefficient for household earnings anddecompose it into the between and within group components by different axes such as sector,
© Ishan Anand and Anjana Thampi
5
caste and occupation.5 We reach the population estimates by multiplying the ratios obtainedfrom the NSS surveys with projected population in India, as estimated by the World Bank.6 Amultidimensional inequality index is then constructed to bring together some dimensions thatcannot be compared in monetary terms but are essential for sustaining a decent standard of living.We assess the extent of inequality by combining the dimensions of housing, drinking water andsanitation using relevant indicators (Table 2). The analysis uses the Hybrid MultidimensionalIndex of Inequality (MDI) developed by Araar (2009). The normalised scores on each of thethree dimensions are generated using Multiple Correspondence Analysis as follows:
Wi =
∑Kk=1
∑Jk
jk=1 ωjkIi,jk
K
where Wi denotes the well-being of individual i for the dimension, K is the number of indicatorvariables used to measure the dimension, Jk is the number of categories for indicator k, Ii,jkis the binary indicator that takes the value 1 if individual i belongs to category jk and ωjk isthe normalised first axis score of the category jk. The MDI is then calculated by combining thescores in the three dimensions by the absolute approach and relative approaches. The generalform of the index is given by:
IR =
K∑i=1
ϕk[λkIk + (1− λk)Ck
where ϕk is the weight assigned to the kth dimension, Ik is the relative or absolute Gini coefficientand Ck is the relative or absolute coefficient of concentration. The relative or absolute MDI iscalculated using the relative or absolute values of the coefficients respectively.λk is the sensitivityindex between different dimensions that take values between 0 and 1. Zero value of λk impliesthat the dimensions of well-being are taken to be perfect substitutes; value of λk at 1 implies thatthe dimensions are perfect complements. In the context of our paper, where we are consideringhousing, water and sanitation, all of which are essentials that could not substitute for each other,considering a value closer to 1 would give a more realistic value of the MDI. We have shown therelative MDI corresponding to multiple values of λk indicating the sensitivity of the index tothis value.
4 Labour market
4.1 Employment type
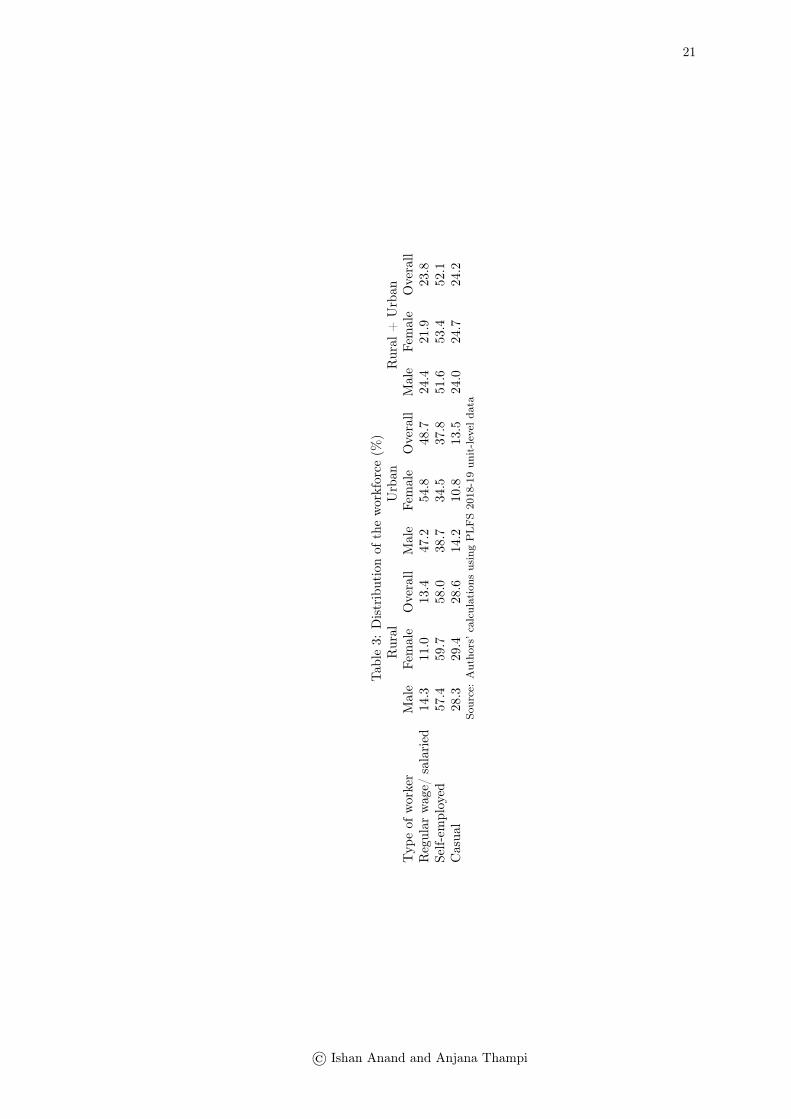
Around 60 percent of the workforce in rural areas and 38 percent in urban areas are self-employed(Table 3). About one in four people in India are casual labourers, with the proportion in ruralIndia close to 30 percent. They work mainly as agricultural labourers, construction workersor in public works. Casual workers typically do not work in the same occupation or industry
5For a description of the method, see (Vakulabharanam, 2010). We do not discuss the overlap component ofthe Gini decomposition in this paper for brevity.
6The mid-year population projections of the World Bank have been used(https://databank.worldbank.org/source/population-estimates-and-projections). We use linear interpola-tion to reach the monthly projected population figures and report the population estimates for the mid-pointof the sample survey. For instance, if the survey was conducted between July-December 2018, the populationestimates using the survey data and population projections are reported for October 2018 (1356 million).
© Ishan Anand and Anjana Thampi
6
throughout the year, and many among them are engaged in short-term circular migration fromrural to urban areas. Self-employed and casual wage workers are predominantly informallyemployed. Regular wage/salaried workers have a stable source of income, although there isheterogeneity between them in terms of job security and pay structure. Only about 30 percentof them had a written job contract in 2018-19.
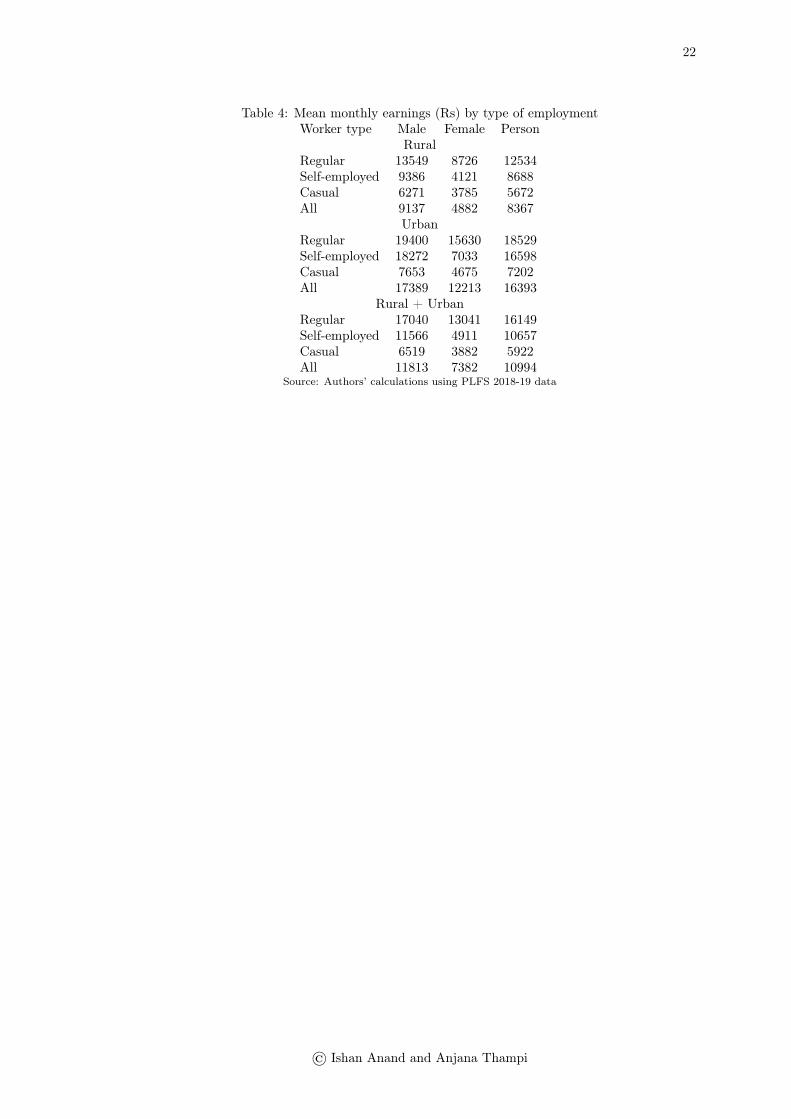
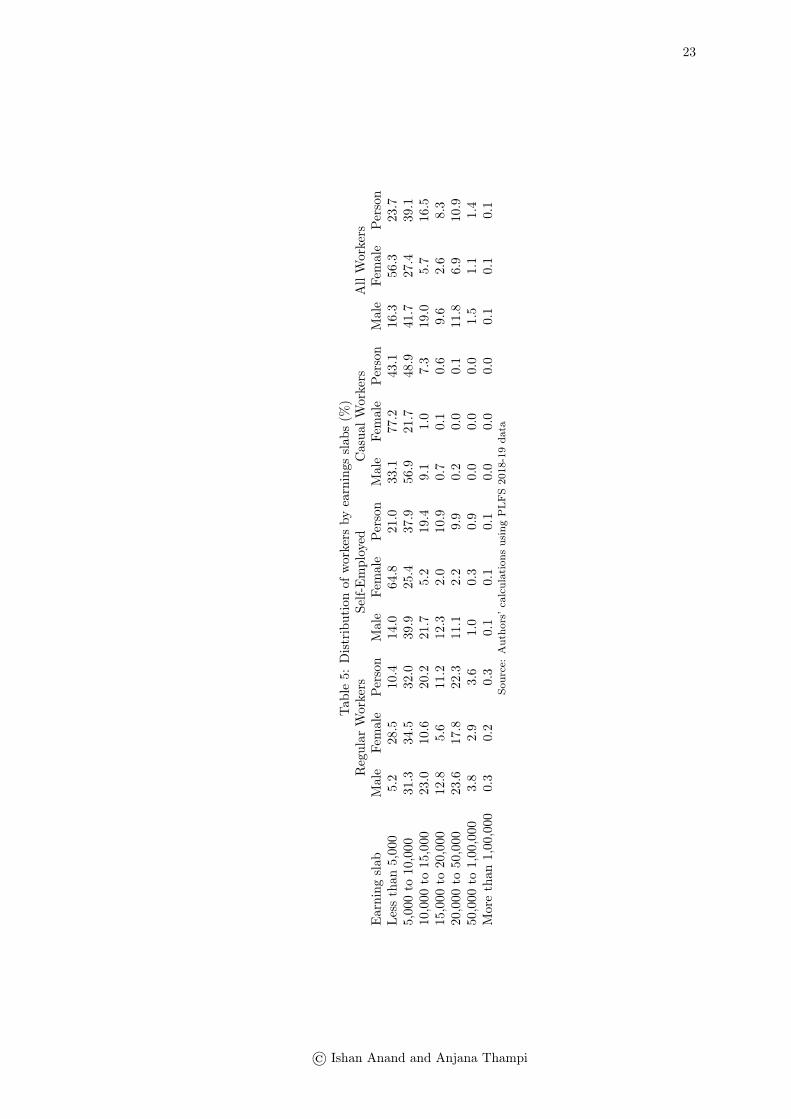
There is a clear hierarchy in the earnings structure by type of worker, gender and area ofresidence (Table 4). In spite of being the best-paid worker category in India, regular workershave quite low earnings on average. In 2018-19, the mean monthly wage of a regular workerwas Rs 16,149, and the median wage was Rs 10,000 – far below Rs. 18000, the minimum payrecommendation of the Seventh Central Pay Commission (Government of India, 2015). About42 percent of the regular workers earned below Rs 10,000 per month (Table 5). This included63 percent of female regular workers, as compared to 37 percent of male regular workers. Onthe other end, only about 4 percent of such workers earned more than Rs 50,000 a month.The workers in the other categories are heavily concentrated at the lower end of the earningsdistribution. 92 percent of casual workers and close to 60 percent of the self-employed earnedless than Rs 10,000 per month. This included as much as 90 percent of the female self-employed.On the whole, 24 percent of Indian workers earned less than Rs 5000 per month and 63 percentearned less than Rs 10,000 per month in 2018-19.7 In absolute numbers, of the total workforceof 480 million, 114 million workers earned less than Rs 5000 per month and 301 million workersearned less than Rs 10,000 per month.8 With the pandemic and the ensuing lockdown, eventhese meagre earnings were no longer available to many (Kosuru, 2020; Mukherjee, 2020; SWAN,2020; Thakur, 2020).9 Primary surveys indicate that a large proportion of households had tocut down on food consumption, and did not have enough money left to pay rent or meet dailyexpenses (Kesar, Abraham, Lahoti, Nath, & Basole, 2020).
4.2 Household earnings
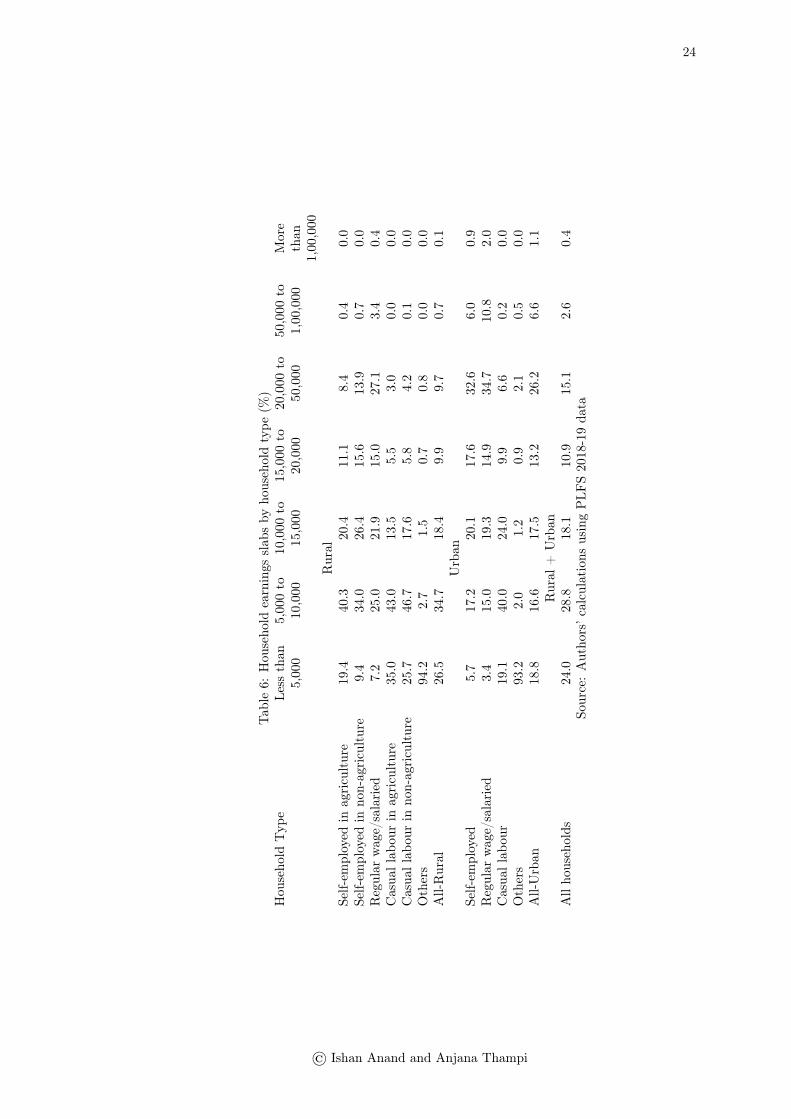
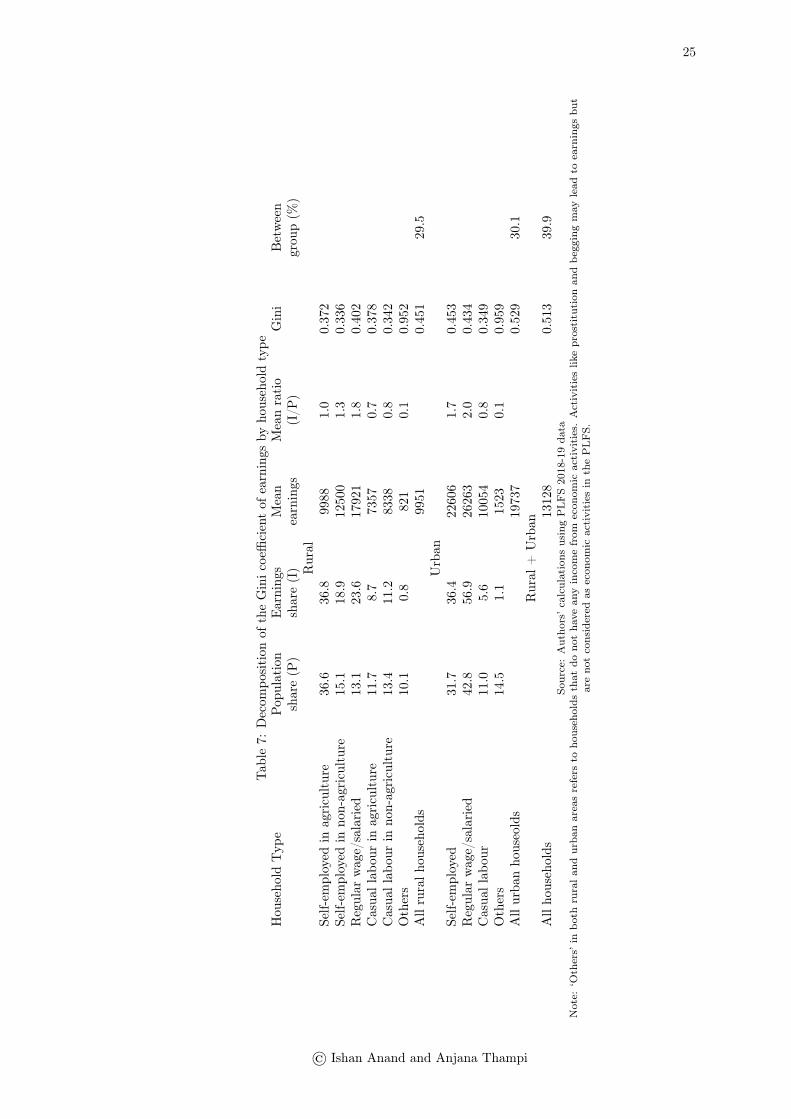
The PLFS categorises each surveyed household into household types on the basis of its meansof livelihood and source of income. The average household earnings (wages and earnings fromregular employment, casual labour and self-employment) was around Rs 10,000 in rural areasand Rs 20,000 in urban areas in 2018-19. The transfer of Rs 500 per month (for three months)by the central government to Jan Dhan accounts is only 5 percent of the average monthly incomeof a rural household. About 61 percent of the rural, 35 percent of the urban and 53 percent of allhouseholds earned less than Rs 10,000 per month in 2018-19 (Table 6). Less than 0.5 percent ofall households earned over a lakh in monthly earnings. The Gini coefficient of household earningswas 0.513, which is fairly high even with these under-estimated earnings (Table 7). In urbanareas, the households that rely on the regular wage/ salaried employment of its members arethe most well-off, earning a share that is twice the population share. Such households are alsorelatively well-off in rural areas, with a mean ratio (ratio of earnings share to population share)of 1.4. The urban self-employed also earn relatively well. Households employed in agricultureaccount for around one-fourth of the total population in the country but earn only around 19
7This analysis excludes the unpaid family helpers, who are considered as self-employed workers, but earningsare not recorded against their days of work. About 13 percent of the total workforce as per the usual status wasrecorded as unpaid family helper in 2018-19.
8We compute these figures using the projected population for January 2019 (1359 million) and the workforceparticipation rate from the PLFS (35.29 percent).
9A recent study estimated the proportion of jobs that could be performed from home (work from home) inIndia to be around 13.5 percent (Sharma, Gupta, & Estupinan, 2020).
© Ishan Anand and Anjana Thampi
7
percent of the total. Households that rely on casual labour in rural areas earn the least ascompared to their population share, followed by the corresponding households in urban areas.
4.3 Area of residence
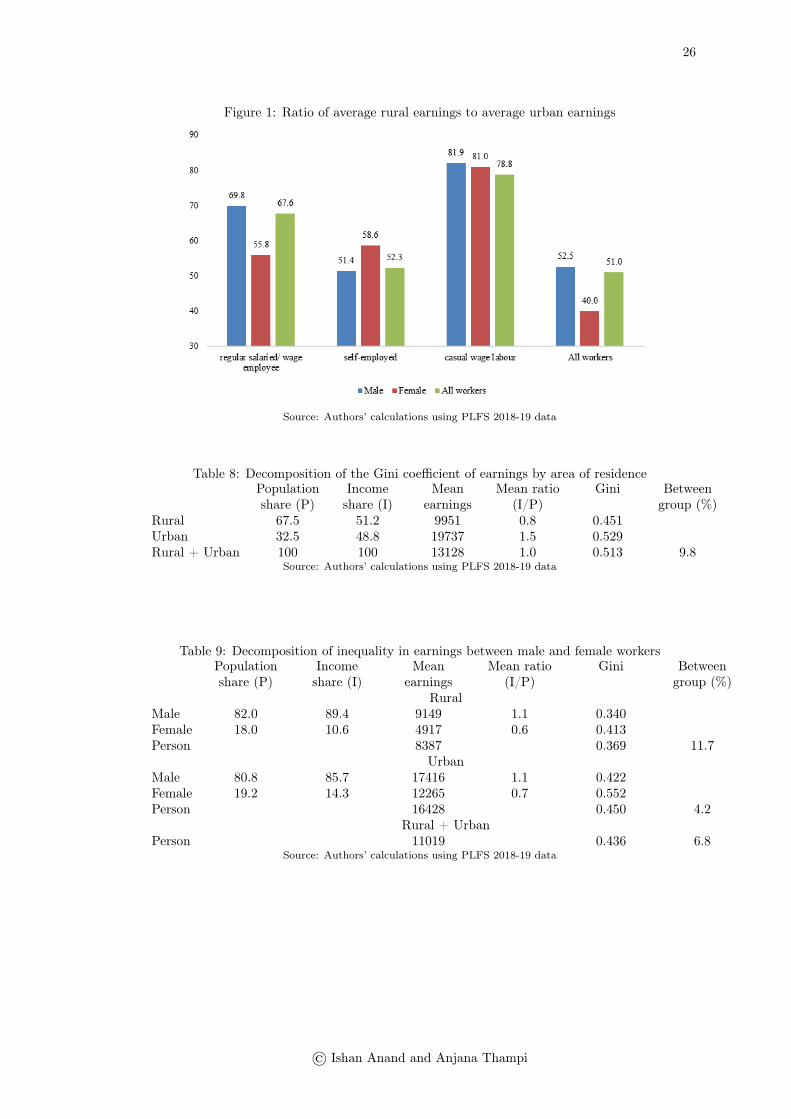
Across worker categories, the average earnings of a rural worker was close to half that of anurban worker. A rural female worker earned only 40 percent of that of an urban female workeron average. The rural-urban earnings gap is also reflected in the aggregate household earnings.The average monthly household earnings was Rs 13,128 in 2018-19 (Table 8). The relativeposition of the areas of residence was highly skewed, with the mean ratio of urban areas at1.5. Considering urban areas alone gives a Gini coefficient of 0.529. About 10 percent of theoverall inequality is explained by the disparity between rural and urban areas. Along with therural-urban gap, there also exists significant inequalities between states and regions that driveIndia’s internal migration.
4.4 Gender gap in earnings
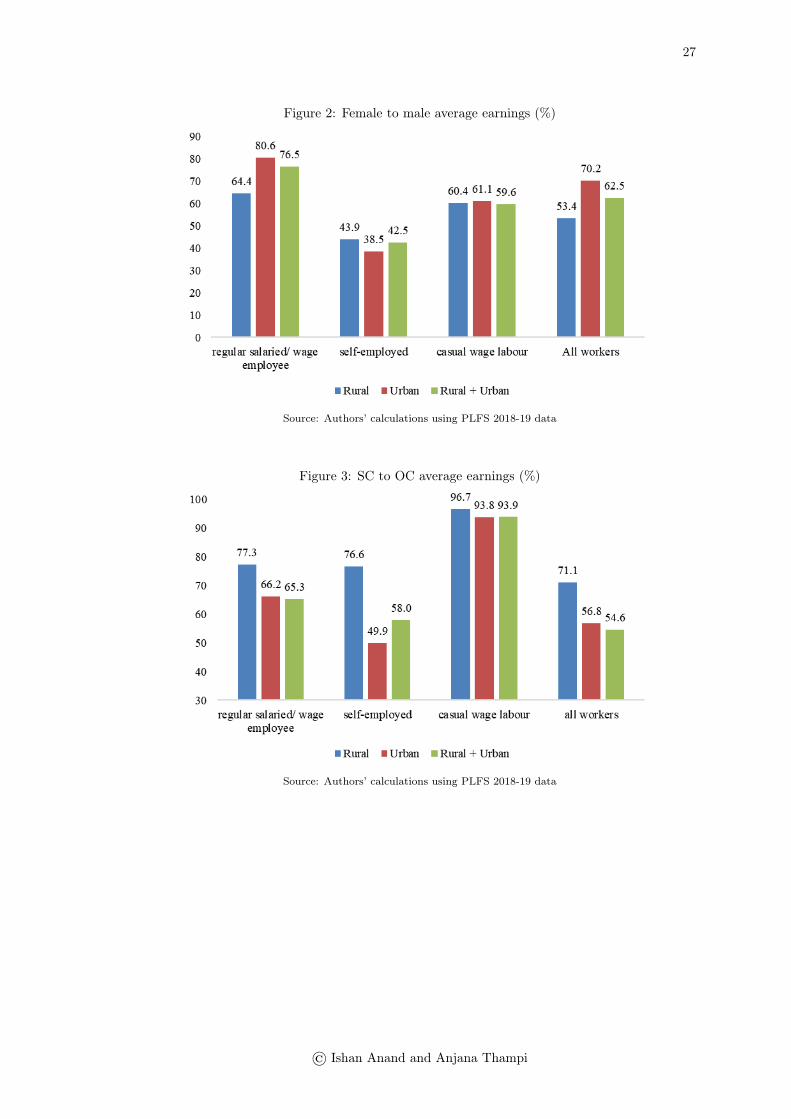
It is well-documented that the female labour force participation has been low and declining inIndia over the past few decades. As such, female workers are only 18–19 percent of the paidworkforce in rural and urban areas (Table 9).10 They earn even lower shares of the earnings,with a mean ratio of 0.6–0.7. The average earnings of female workers as a proportion of maleearnings was only 54 percent in rural areas, 70 percent in urban areas and 63 percent for bothareas combined. On average, female workers earned only 43 percent of male workers when theywere self-employed, 60 percent as casual workers and 77 percent as regular workers (Figure 2).The overall Gini coefficient of earnings is 0.436 and the inequality between male and femaleworkers accounts for around 7 percent of the total inequality, and this proportion is close to 12percent in rural areas.
4.5 Caste gap in earnings
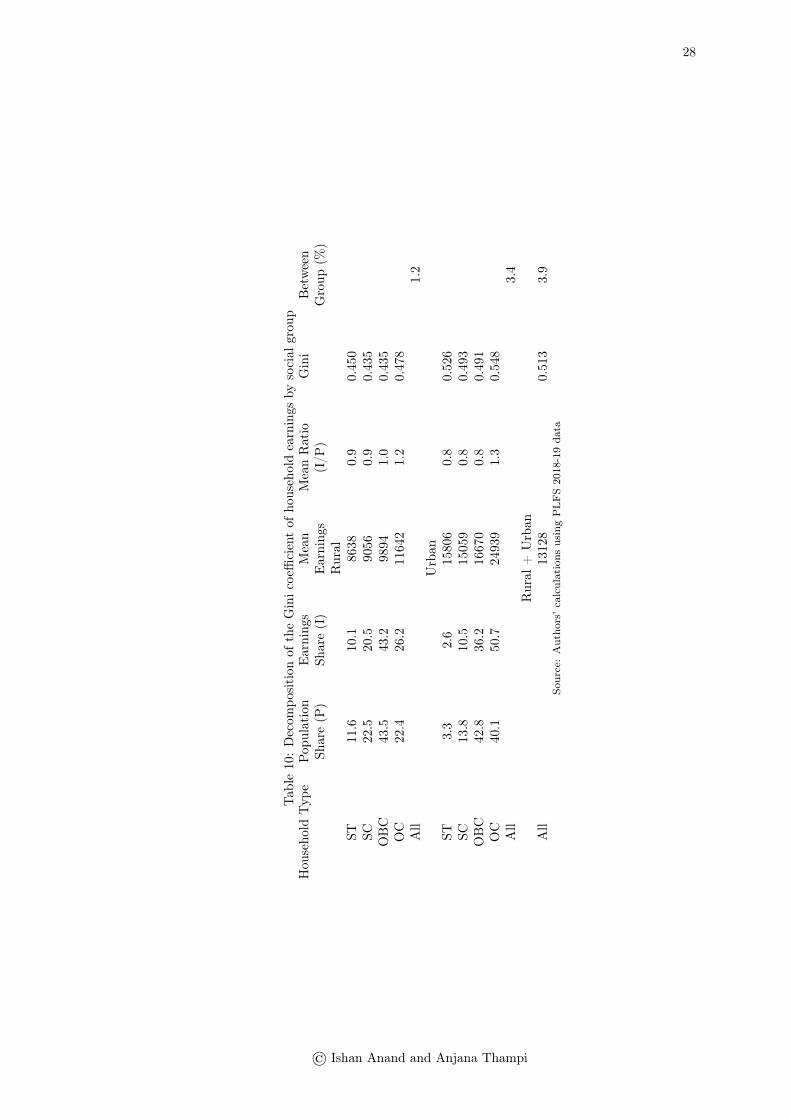
The Indian labour market is highly segmented along caste lines. The deprived groups are under-represented in occupations such as legislators, senior officials, managers, and professionals, andover-represented in elementary occupations. These groups, in particular the Scheduled Castes(SCs), earn less than the non-ST-SC-OBC group (hereafter Other Castes or OCs) on average,even in regular wage/salaried jobs. The earning gap is the lowest among casual workers whohave very low average wages. On average, a SC worker earns only 55 percent of what an OCworker earns, with a higher wage gap in urban areas as compared to rural (Figure 3). Thehighest earnings gap was among the urban self-employed, with SC workers earning less than halfof OC workers. Decomposing the Gini coefficient of household earnings shows that SCs and STsin both rural and urban areas earn the least relative to their population shares and OCs arebest-placed in both rural and urban areas with a mean ratio higher than one (Table 10).
10We consider only the paid workforce here. Around 4 percent of women workers are categorised as unpaidfamily labour.
© Ishan Anand and Anjana Thampi
8
4.6 Falling real wages
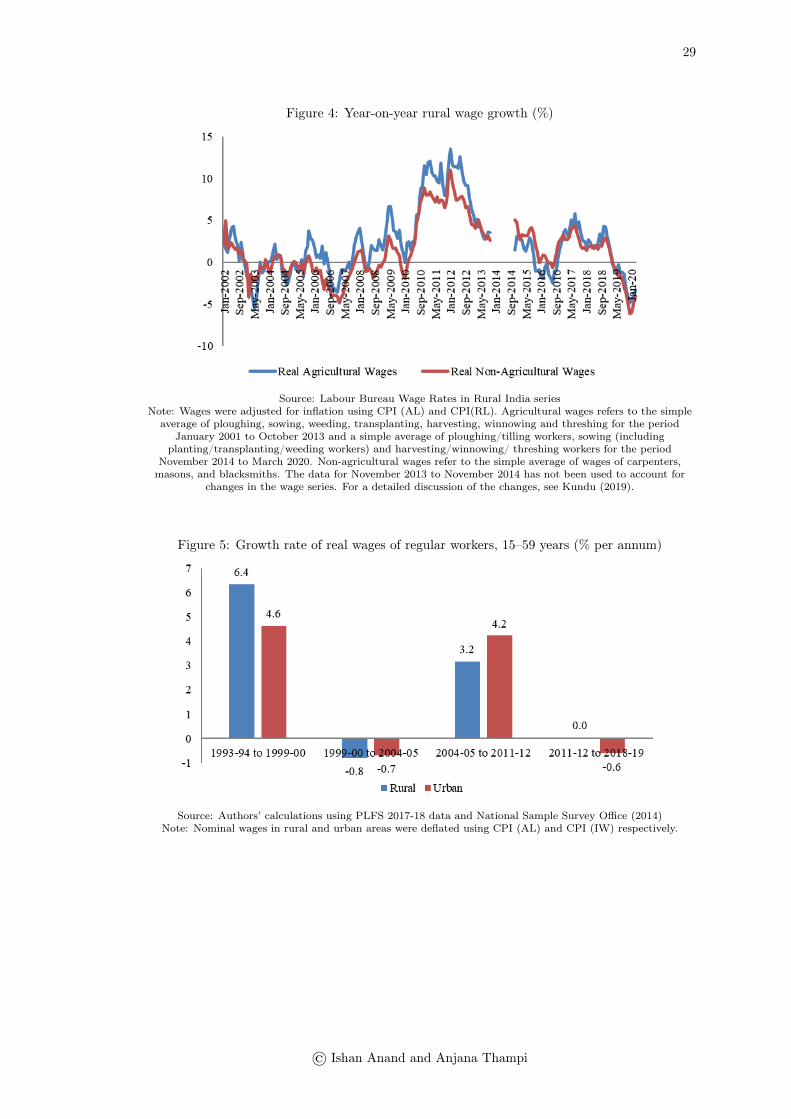
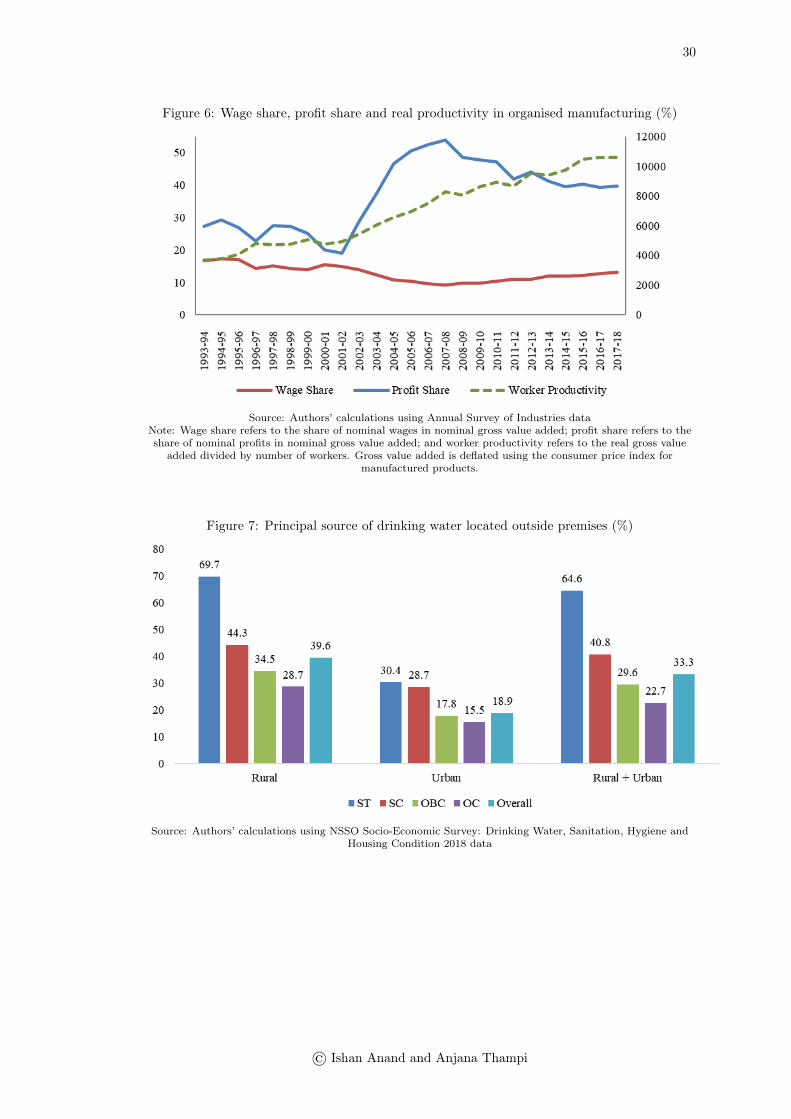
We next considered the recent trends in the real wages of regular workers and casual labour-ers. The year-on-year growth rate of rural wages for workers engaged in agricultural and non-agricultural activities increased significantly between 2007 and 2012, but declined sharply there-after. Real rural wage growth was negative for the year leading up to the lockdown (Figure4). The reverse migration during the lockdown is likely to have depressed rural wages further,particularly in the poorer regions that saw an influx of workers from cities and other states.The real wages of regular workers remained stagnant in rural areas and declined by 0.6 percentper annum in urban areas between 2011-12 and 2018-19, reversing the gains between 2004-05and 2011-2 (Figure 5). In the organised manufacturing sector, the share of wages in gross valueadded declined from around 17 percent in 1993-94 to 13 percent in 2017-18, and the manifoldincrease in worker productivity was absorbed entirely by the rising profit share (Figure 6). Arecent analysis of Nifty 50 companies by Reetika Khera and Meghna Yadav revealed that thetop-paid executive earned more than 100 times the median salary of the permanent employeesin a majority of the companies (The Wire, 2020).
5 Access to basic amenities
5.1 Water
About 67 percent of the total population, or 905 million people, did not have access to pipedwater in 2018.11 Only about 22 percent of the rural population and 59 percent of the urbanpopulation used piped water as the principal source of drinking water. More than half of therural population and 14 percent of the urban population were dependent on hand pumps, wells,ponds, tankers and springs for their drinking water needs. Even these sources may not beavailable throughout the year, particularly in summer when the groundwater table goes down.For around 12 percent of the rural and 10 percent of the urban population, drinking waterfrom the principal source was not sufficient throughout the year. Overall, this accounted forabout 159 million people in India. The water crisis is more severe in certain states, such asHimachal Pradesh, Rajasthan, Madhya Pradesh and Maharashtra, where one-fifth or more ofthe population did not have access to sufficient drinking water from the main source throughoutthe year (Table 19). The crisis also affects STs and SCs more severely than other groups.
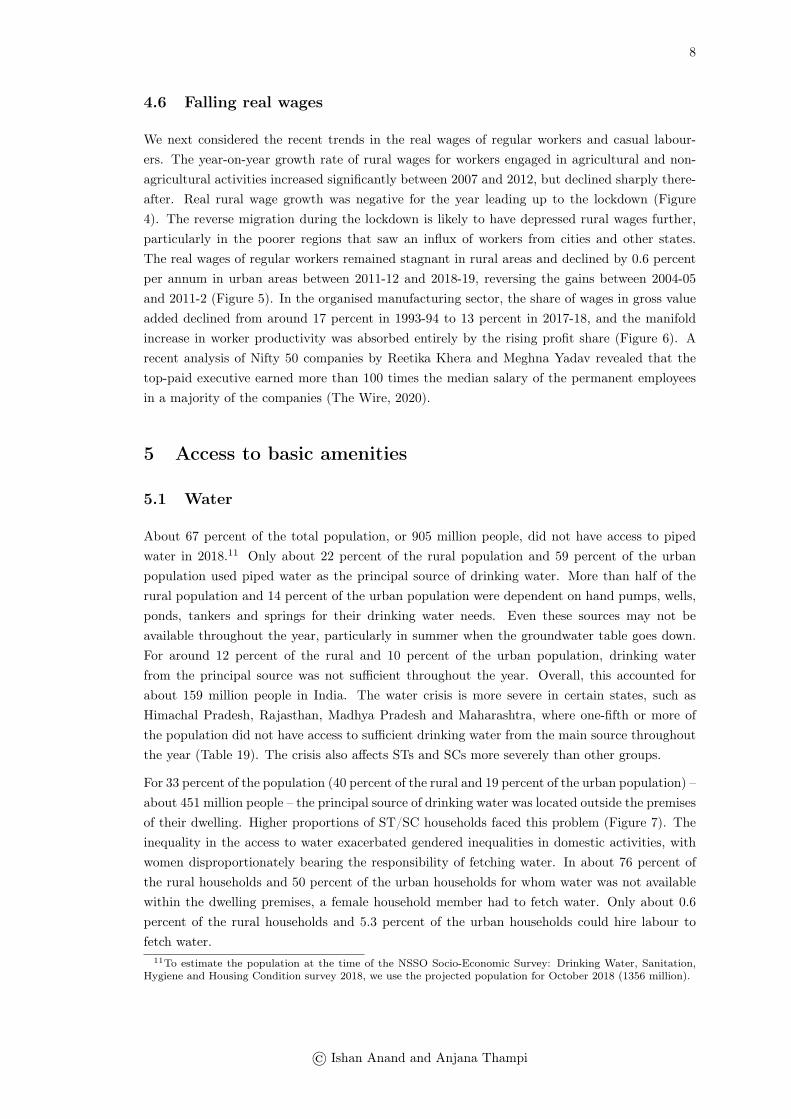
For 33 percent of the population (40 percent of the rural and 19 percent of the urban population) –about 451 million people – the principal source of drinking water was located outside the premisesof their dwelling. Higher proportions of ST/SC households faced this problem (Figure 7). Theinequality in the access to water exacerbated gendered inequalities in domestic activities, withwomen disproportionately bearing the responsibility of fetching water. In about 76 percent ofthe rural households and 50 percent of the urban households for whom water was not availablewithin the dwelling premises, a female household member had to fetch water. Only about 0.6percent of the rural households and 5.3 percent of the urban households could hire labour tofetch water.
11To estimate the population at the time of the NSSO Socio-Economic Survey: Drinking Water, Sanitation,Hygiene and Housing Condition survey 2018, we use the projected population for October 2018 (1356 million).
© Ishan Anand and Anjana Thampi
9
5.2 Sanitation
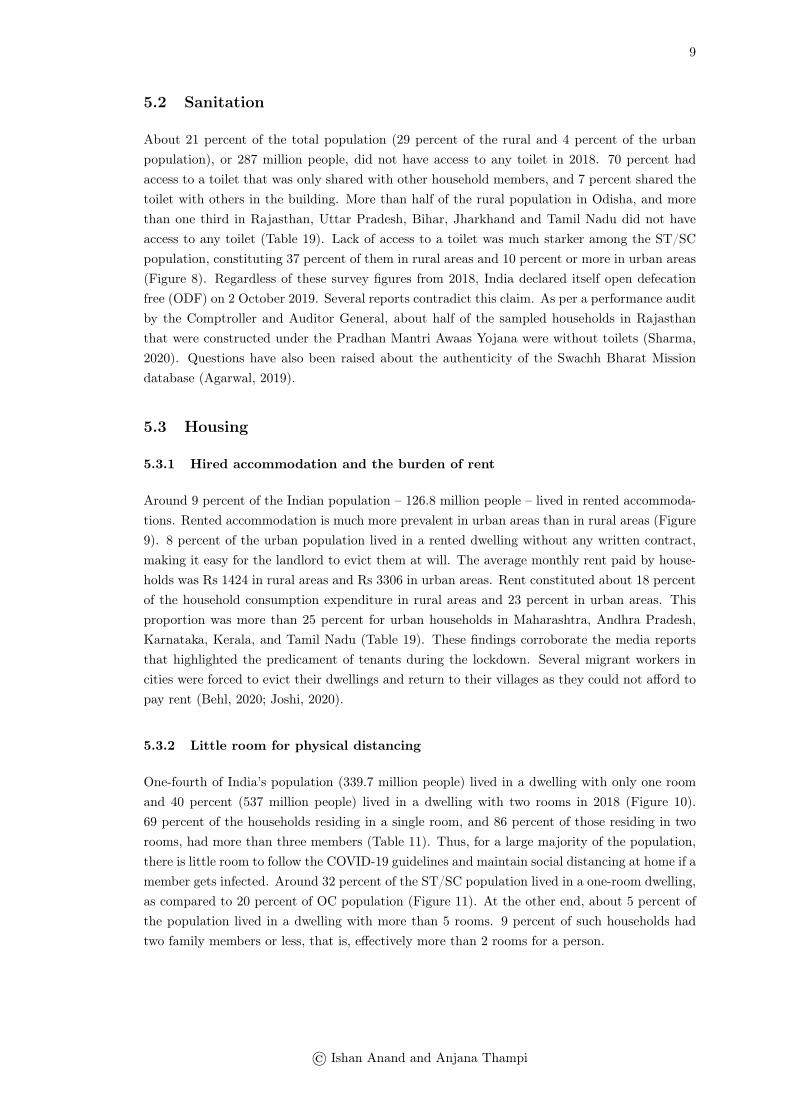
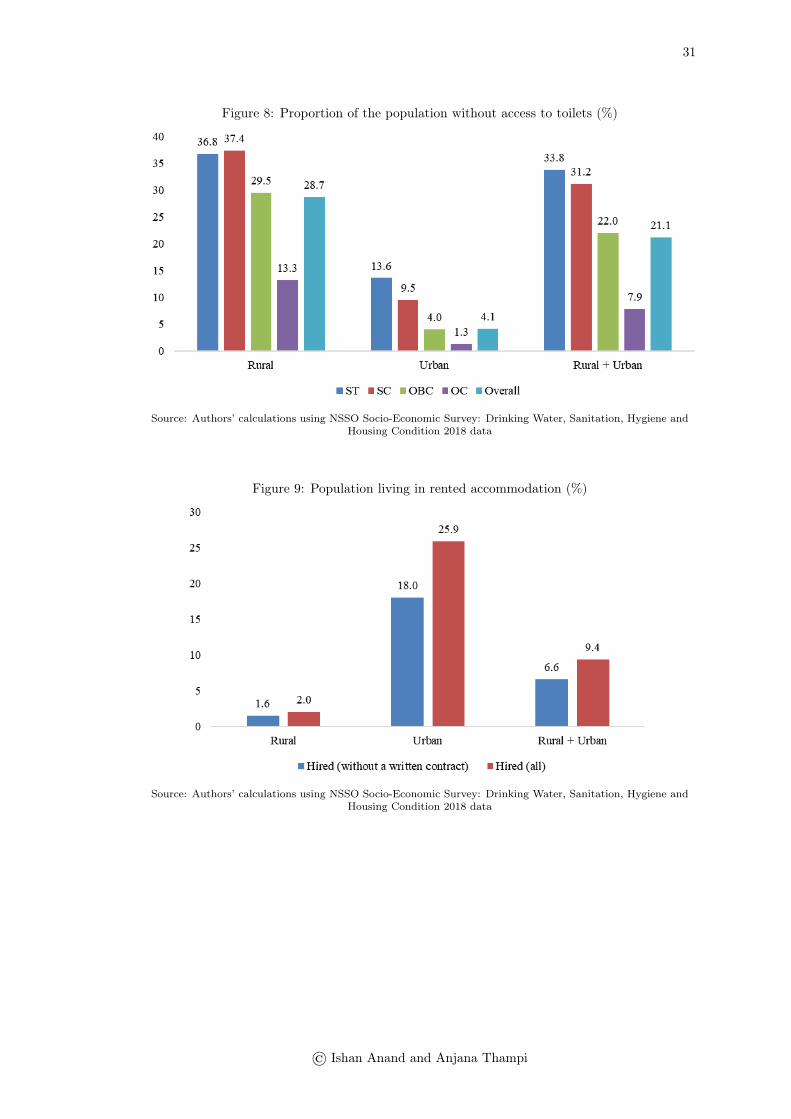
About 21 percent of the total population (29 percent of the rural and 4 percent of the urbanpopulation), or 287 million people, did not have access to any toilet in 2018. 70 percent hadaccess to a toilet that was only shared with other household members, and 7 percent shared thetoilet with others in the building. More than half of the rural population in Odisha, and morethan one third in Rajasthan, Uttar Pradesh, Bihar, Jharkhand and Tamil Nadu did not haveaccess to any toilet (Table 19). Lack of access to a toilet was much starker among the ST/SCpopulation, constituting 37 percent of them in rural areas and 10 percent or more in urban areas(Figure 8). Regardless of these survey figures from 2018, India declared itself open defecationfree (ODF) on 2 October 2019. Several reports contradict this claim. As per a performance auditby the Comptroller and Auditor General, about half of the sampled households in Rajasthanthat were constructed under the Pradhan Mantri Awaas Yojana were without toilets (Sharma,2020). Questions have also been raised about the authenticity of the Swachh Bharat Missiondatabase (Agarwal, 2019).
5.3 Housing
5.3.1 Hired accommodation and the burden of rent
Around 9 percent of the Indian population – 126.8 million people – lived in rented accommoda-tions. Rented accommodation is much more prevalent in urban areas than in rural areas (Figure9). 8 percent of the urban population lived in a rented dwelling without any written contract,making it easy for the landlord to evict them at will. The average monthly rent paid by house-holds was Rs 1424 in rural areas and Rs 3306 in urban areas. Rent constituted about 18 percentof the household consumption expenditure in rural areas and 23 percent in urban areas. Thisproportion was more than 25 percent for urban households in Maharashtra, Andhra Pradesh,Karnataka, Kerala, and Tamil Nadu (Table 19). These findings corroborate the media reportsthat highlighted the predicament of tenants during the lockdown. Several migrant workers incities were forced to evict their dwellings and return to their villages as they could not afford topay rent (Behl, 2020; Joshi, 2020).
5.3.2 Little room for physical distancing
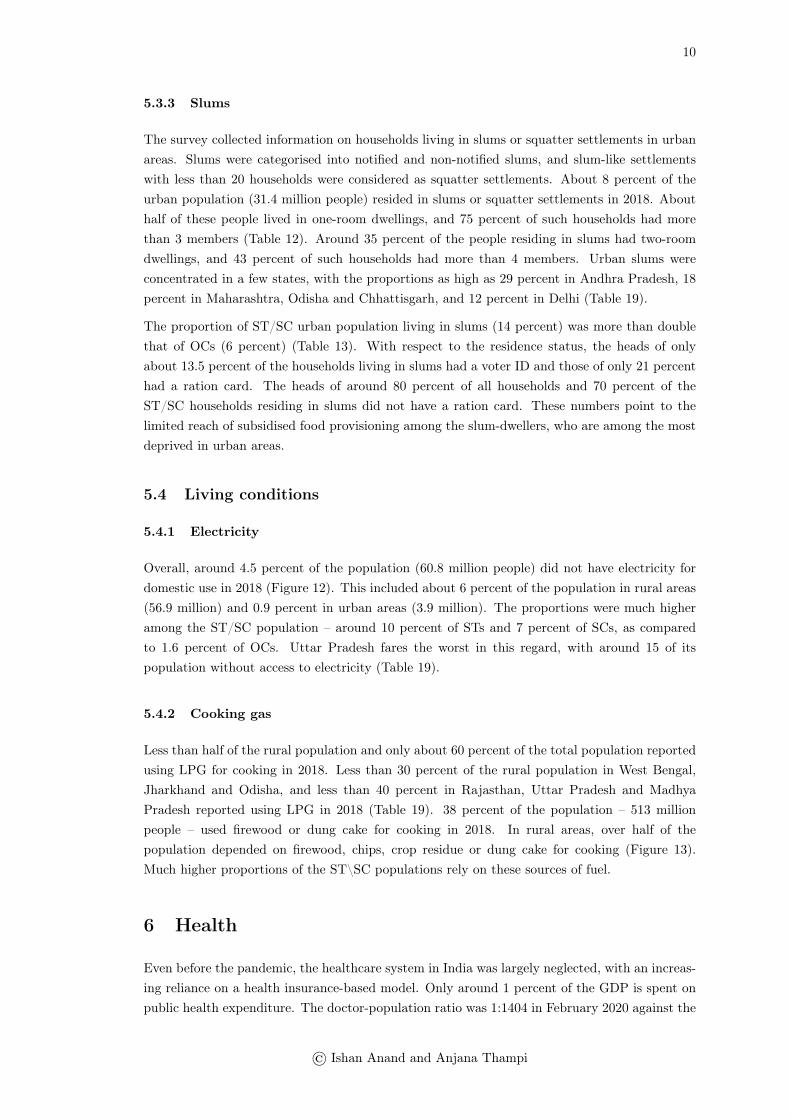
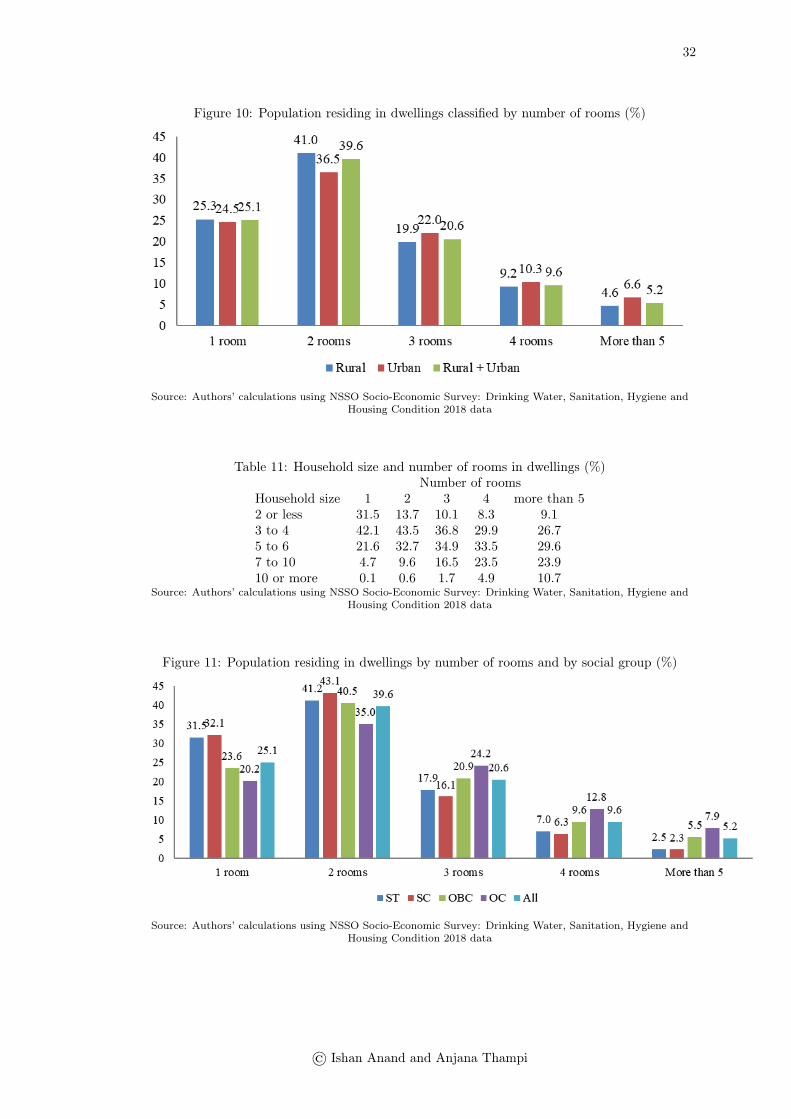
One-fourth of India’s population (339.7 million people) lived in a dwelling with only one roomand 40 percent (537 million people) lived in a dwelling with two rooms in 2018 (Figure 10).69 percent of the households residing in a single room, and 86 percent of those residing in tworooms, had more than three members (Table 11). Thus, for a large majority of the population,there is little room to follow the COVID-19 guidelines and maintain social distancing at home if amember gets infected. Around 32 percent of the ST/SC population lived in a one-room dwelling,as compared to 20 percent of OC population (Figure 11). At the other end, about 5 percent ofthe population lived in a dwelling with more than 5 rooms. 9 percent of such households hadtwo family members or less, that is, effectively more than 2 rooms for a person.
© Ishan Anand and Anjana Thampi
10
5.3.3 Slums
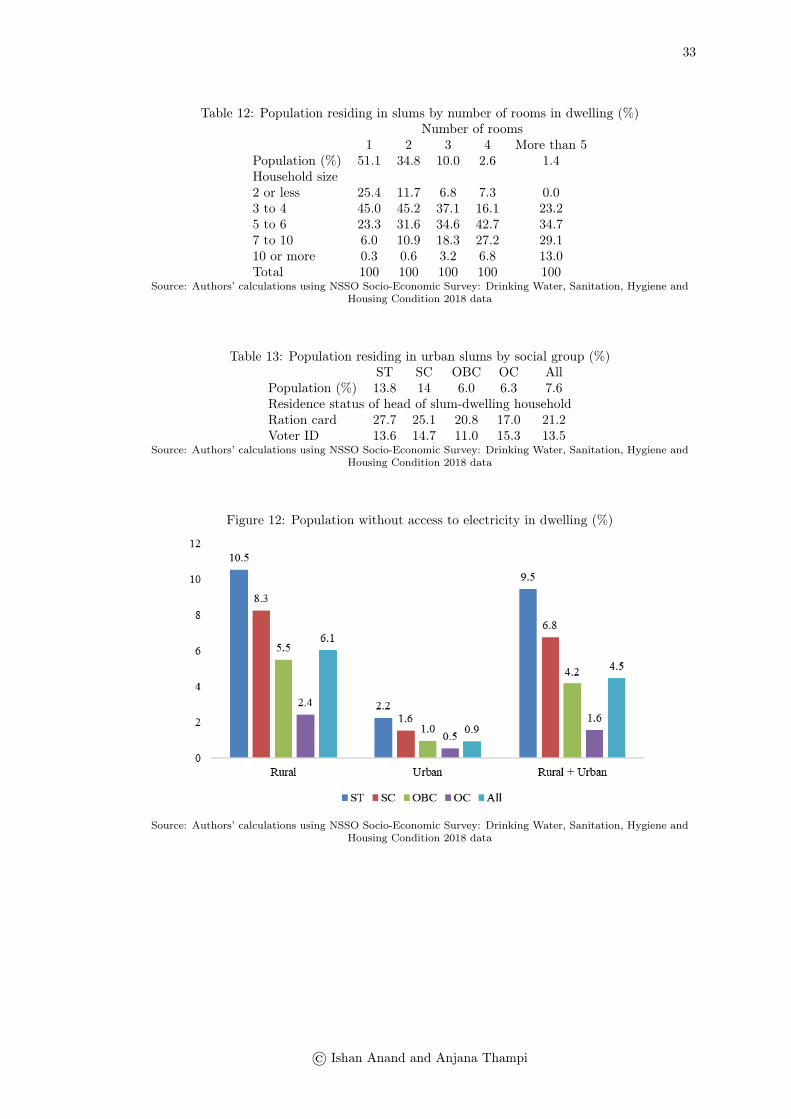
The survey collected information on households living in slums or squatter settlements in urbanareas. Slums were categorised into notified and non-notified slums, and slum-like settlementswith less than 20 households were considered as squatter settlements. About 8 percent of theurban population (31.4 million people) resided in slums or squatter settlements in 2018. Abouthalf of these people lived in one-room dwellings, and 75 percent of such households had morethan 3 members (Table 12). Around 35 percent of the people residing in slums had two-roomdwellings, and 43 percent of such households had more than 4 members. Urban slums wereconcentrated in a few states, with the proportions as high as 29 percent in Andhra Pradesh, 18percent in Maharashtra, Odisha and Chhattisgarh, and 12 percent in Delhi (Table 19).
The proportion of ST/SC urban population living in slums (14 percent) was more than doublethat of OCs (6 percent) (Table 13). With respect to the residence status, the heads of onlyabout 13.5 percent of the households living in slums had a voter ID and those of only 21 percenthad a ration card. The heads of around 80 percent of all households and 70 percent of theST/SC households residing in slums did not have a ration card. These numbers point to thelimited reach of subsidised food provisioning among the slum-dwellers, who are among the mostdeprived in urban areas.
5.4 Living conditions
5.4.1 Electricity
Overall, around 4.5 percent of the population (60.8 million people) did not have electricity fordomestic use in 2018 (Figure 12). This included about 6 percent of the population in rural areas(56.9 million) and 0.9 percent in urban areas (3.9 million). The proportions were much higheramong the ST/SC population – around 10 percent of STs and 7 percent of SCs, as comparedto 1.6 percent of OCs. Uttar Pradesh fares the worst in this regard, with around 15 of itspopulation without access to electricity (Table 19).
5.4.2 Cooking gas
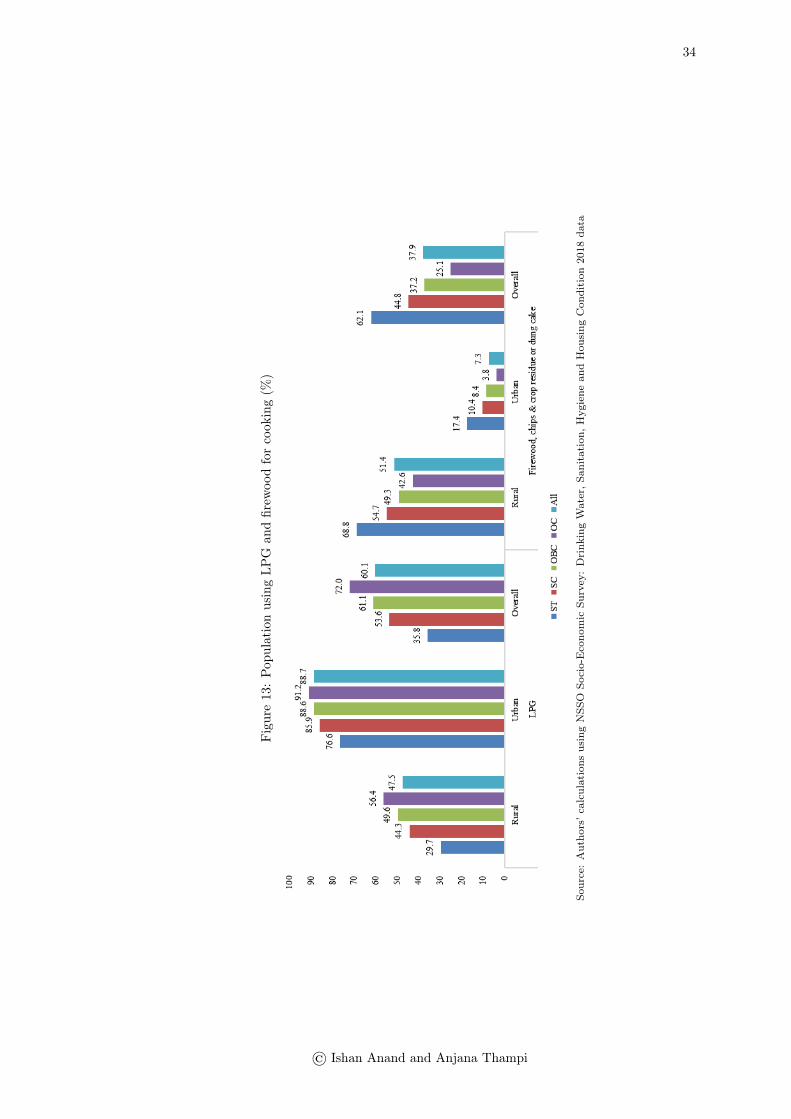
Less than half of the rural population and only about 60 percent of the total population reportedusing LPG for cooking in 2018. Less than 30 percent of the rural population in West Bengal,Jharkhand and Odisha, and less than 40 percent in Rajasthan, Uttar Pradesh and MadhyaPradesh reported using LPG in 2018 (Table 19). 38 percent of the population – 513 millionpeople – used firewood or dung cake for cooking in 2018. In rural areas, over half of thepopulation depended on firewood, chips, crop residue or dung cake for cooking (Figure 13).Much higher proportions of the ST\SC populations rely on these sources of fuel.
6 Health
Even before the pandemic, the healthcare system in India was largely neglected, with an increas-ing reliance on a health insurance-based model. Only around 1 percent of the GDP is spent onpublic health expenditure. The doctor-population ratio was 1:1404 in February 2020 against the
© Ishan Anand and Anjana Thampi
11
WHO prescribed norm of 1:1000 (Ministry of Health and Family Welfare, 2020a) and the nurse-population ratio was 1.7:1000 in March 2020 against the WHO norm of 2.5:1000 in March 2020(Ministry of Health and Family Welfare, 2020b). The downgrading of public health services andthe problems with the current approach towards an insurance-based model have been discussed(Bhattacharya & Rathore, 2018; Das, Aiyar, & Hammer, 2018; Jan Swasthya Abhiyan, 2019).
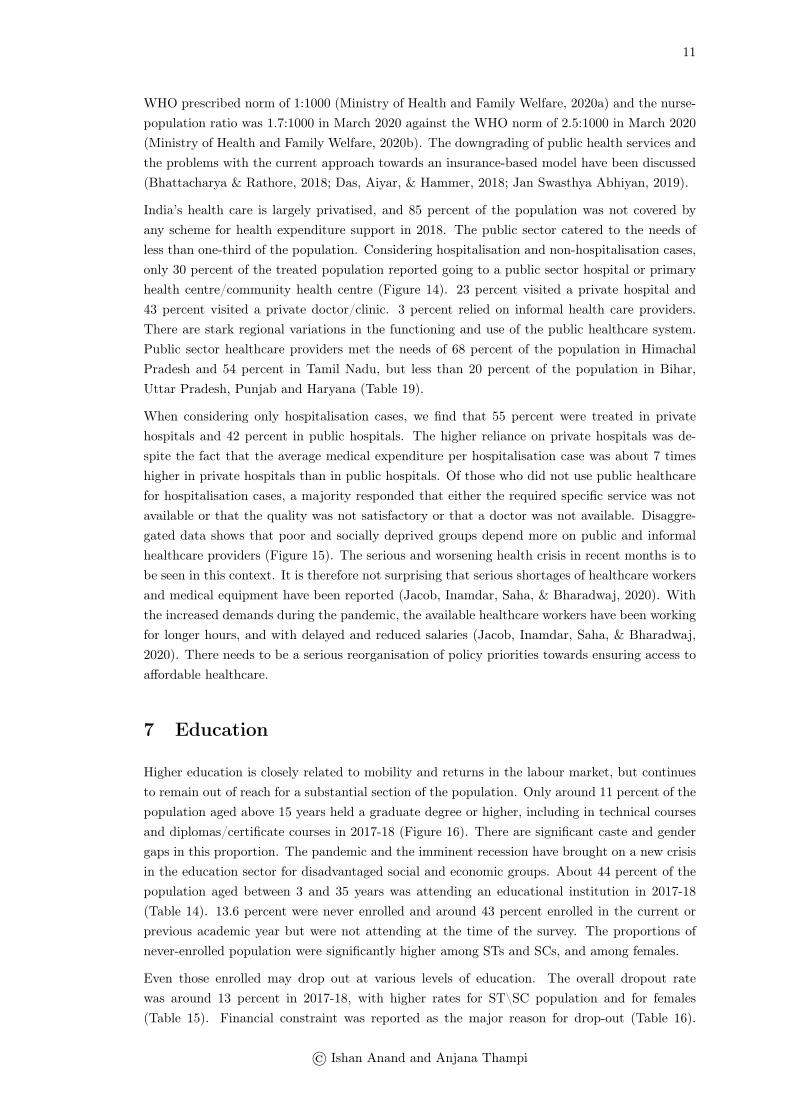
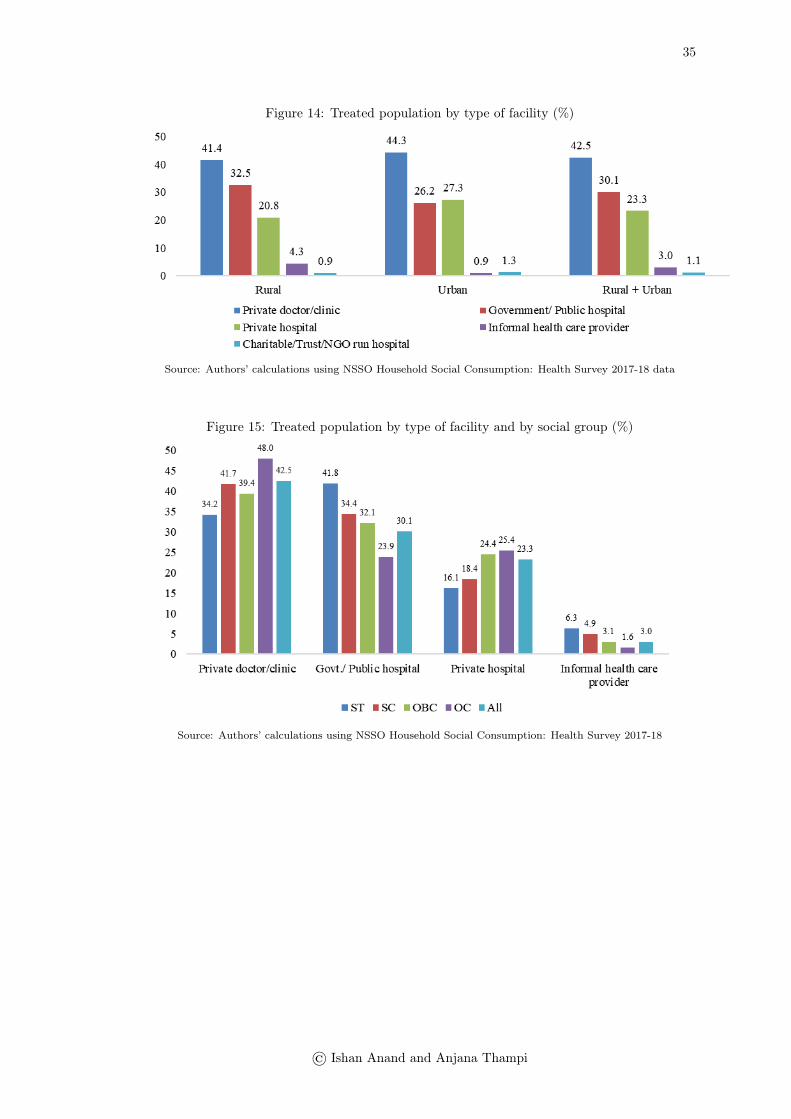
India’s health care is largely privatised, and 85 percent of the population was not covered byany scheme for health expenditure support in 2018. The public sector catered to the needs ofless than one-third of the population. Considering hospitalisation and non-hospitalisation cases,only 30 percent of the treated population reported going to a public sector hospital or primaryhealth centre/community health centre (Figure 14). 23 percent visited a private hospital and43 percent visited a private doctor/clinic. 3 percent relied on informal health care providers.There are stark regional variations in the functioning and use of the public healthcare system.Public sector healthcare providers met the needs of 68 percent of the population in HimachalPradesh and 54 percent in Tamil Nadu, but less than 20 percent of the population in Bihar,Uttar Pradesh, Punjab and Haryana (Table 19).
When considering only hospitalisation cases, we find that 55 percent were treated in privatehospitals and 42 percent in public hospitals. The higher reliance on private hospitals was de-spite the fact that the average medical expenditure per hospitalisation case was about 7 timeshigher in private hospitals than in public hospitals. Of those who did not use public healthcarefor hospitalisation cases, a majority responded that either the required specific service was notavailable or that the quality was not satisfactory or that a doctor was not available. Disaggre-gated data shows that poor and socially deprived groups depend more on public and informalhealthcare providers (Figure 15). The serious and worsening health crisis in recent months is tobe seen in this context. It is therefore not surprising that serious shortages of healthcare workersand medical equipment have been reported (Jacob, Inamdar, Saha, & Bharadwaj, 2020). Withthe increased demands during the pandemic, the available healthcare workers have been workingfor longer hours, and with delayed and reduced salaries (Jacob, Inamdar, Saha, & Bharadwaj,2020). There needs to be a serious reorganisation of policy priorities towards ensuring access toaffordable healthcare.
7 Education
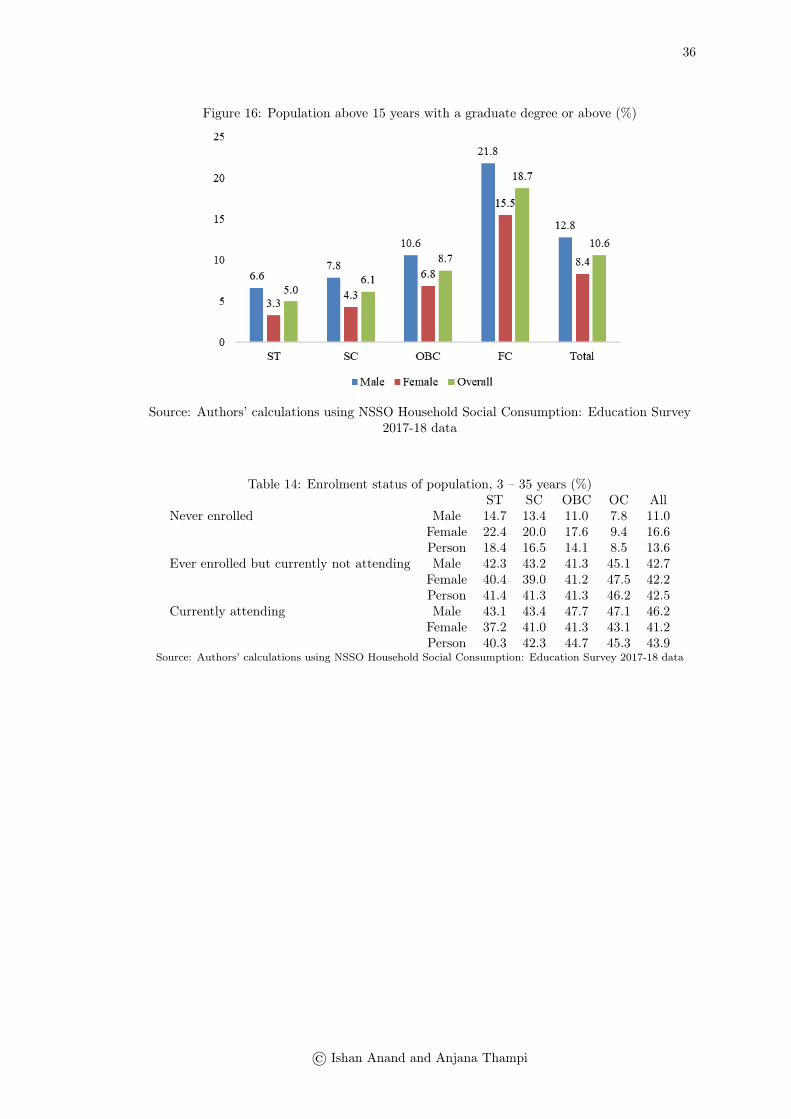
Higher education is closely related to mobility and returns in the labour market, but continuesto remain out of reach for a substantial section of the population. Only around 11 percent of thepopulation aged above 15 years held a graduate degree or higher, including in technical coursesand diplomas/certificate courses in 2017-18 (Figure 16). There are significant caste and gendergaps in this proportion. The pandemic and the imminent recession have brought on a new crisisin the education sector for disadvantaged social and economic groups. About 44 percent of thepopulation aged between 3 and 35 years was attending an educational institution in 2017-18(Table 14). 13.6 percent were never enrolled and around 43 percent enrolled in the current orprevious academic year but were not attending at the time of the survey. The proportions ofnever-enrolled population were significantly higher among STs and SCs, and among females.
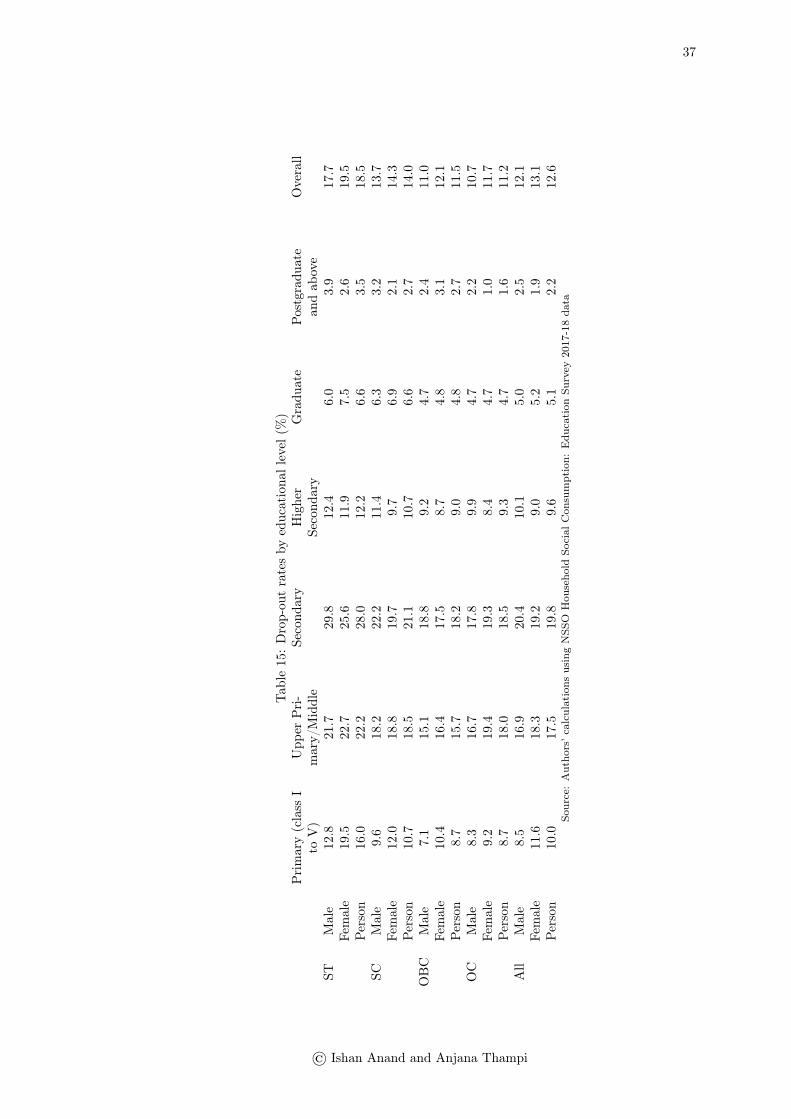
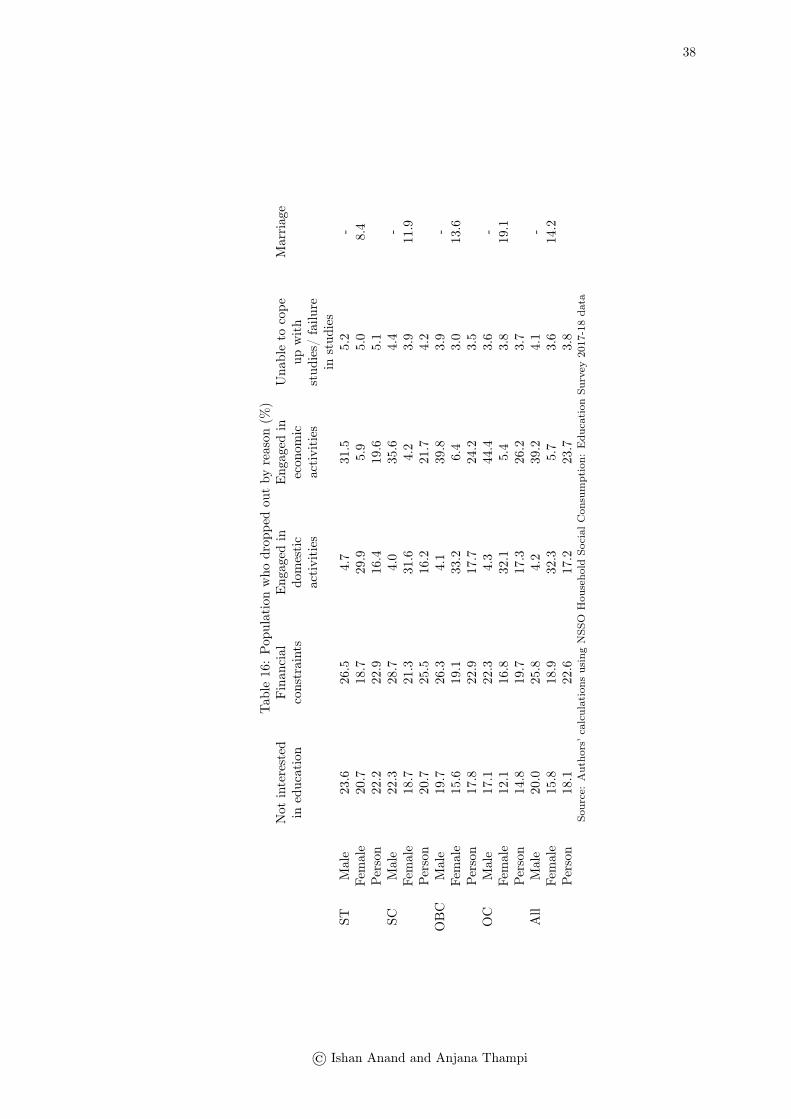
Even those enrolled may drop out at various levels of education. The overall dropout ratewas around 13 percent in 2017-18, with higher rates for ST\SC population and for females(Table 15). Financial constraint was reported as the major reason for drop-out (Table 16).
© Ishan Anand and Anjana Thampi
12
Sizeable proportions of the population dropped out of continuing their education as they wereengaged in economic activities, which can be linked to the economic situation of the household.Around one-third of females dropped out as they were engaged in domestic activities, and about14 percent did so for marriage. As education moves online, enrolled members of householdswithout access to a computer or a similar device and an internet connection would not be ableto attend classes. Only about 12 percent of households (with at least one member enrolled in aneducational institution) had access to a computer and only 27 percent could access the internetin 2017-18. ST/SC households were significantly disadvantaged in these respects.
The additional economic distress is likely to increase drop-outs, particularly of the economicallyand socially deprived groups and female students. This could happen due to several reasons.First, a large section of the population faced with loss of employment or incomes may find itdifficult to continue the education of their children. Second, lack of access to computer andinternet facilities would exacerbate exclusion at a time of shift to online mode of education.12
Third, given the recessionary situation, students who are about to complete their degrees andenter the labour market may find it more difficult to get employment as per their expectationsor qualifications.
8 Multidimensional index of inequality
We have charted a picture of serious inequality across several dimensions that affect the capa-bilities and standard of living of individuals. Combining these different dimensions to one indexwould provide a comprehensive picture of the extent and nature of disparities. We do so usingthe MDI, as described in the methodology section.
The normalised scores that indicate well-being of households in housing, water and sanitationwere constructed and used to develop the MDI. As noted in earlier studies (Araar, 2009; Nizalova,2014), the MDI is very sensitive to the value of λ. The table gives the results of the sensitivitytest by setting λ to different values. λ = 0 indicates that the dimensions are considered to beperfect substitutes to each other, and λ = 1 indicates that they are perfect complements. Thelevel of inequality as given by the MDI increases as λ increases (Table 17). At λ = 0.5, theMDI equals 0.35, which is close to the recorded Gini coefficient of monthly per capita consumerexpenditures (Table 1).13 The three dimensions considered here cannot reasonably be consideredsubstitutes; it rather stands to reason that they would be complements. By this reasoning, if weconsider λ to be 0.9 or 1, the MDI is 0.44 and 0.46 respectively, which is significantly higher thanthe inequality recorded in consumer expenditure. The extent of multi-dimensional inequality ishigher in urban areas, with values of the index at 0.41, 0.48 and 0.50 for λ at 0.5, 0.9 and 1.0respectively.
The index can be decomposed into the respective contributions of each dimension (Table 18).This exercise reveals that housing has the highest contribution to the extent of inequality interms of access to basic services, accounting for 47 percent of the total variation in the multi-dimensional inequality index. Access to water is also a crucial indicator, accounting for 34percent of the variation in the relative and absolute MDI. With the onslaught of the pandemic,
12A recent Oxfam survey shows the extent of digital exclusion in the lockdown (https://www.business-standard.com/article/current-affairs/80-parents-in-5-states-say-digital-schooling-failed-during-lockdown-study-120091500580_1.html).
13The Gini coefficient of monthly per capita consumer expenditure as per the NSSO survey on Drinking Water,Sanitation, Hygiene and Housing Condition (2018) is 0.329.
© Ishan Anand and Anjana Thampi
13
a regular health advice has been to wash hands thoroughly. In a country with deep inequalitiesin access to water, the havoc wrought by the pandemic on certain sections can be understoodmore clearly.
9 A policy-induced crisis and the need for a paradigm change
The spread of COVID-19 and the economic distress with the lockdown in India has much todo with the lacklustre implementation of containment and relief measures, as well as long-termpolicy neglect that left millions vulnerable to a shock. Despite the stringent lockdown, Indiacurrently ranks second in the world in the number of COVID-19 cases and third in the numberof deaths. A sero-survey in Mumbai revealed that 57 percent of the people tested in slums hadbeen exposed to and developed antibodies against SARS-CoV2, as compared to 16 percent ofthose tested in residential societies (Rukmini, 2020). This could be because of higher populationdensity and shared facilities such as toilets and source of water (Rukmini, 2020). Our paperreveals stark evidence of the extent of cramped housing, lack of access to piped water, toilets,and cooking gas, forcing people to rely on shared facilities and common sources. The evidenceof low earnings (and probable low savings as a result) also reveals that millions face a choicebetween going to work at the risk of contracting the virus and risking starvation otherwise.
The policy interventions to safeguard the lives and livelihoods of the vulnerable have been farfrom adequate, to say the least. At least 216 deaths have been recorded due to hunger andfinancial stress since the lockdown – 96 deaths in Shramik trains intended to safely transportmigrant workers back to their homes, and hundreds of deaths due to exhaustion or accidentsof migrant workers while walking back to their villages or lack of medical care.14 The labourmarket, already reeling under the slowdown, collapsed completely during the lockdown. Theunemployment rate climbed to 24 percent in April and May 2020, and about 21 million regularworkers lost their jobs between April and August (Vyas, 2020). After the lockdown was lifted,the unemployment rate fell, but the recovery in employment was driven entirely by informal andnon-salaried work. Women and socially deprived groups have disproportionately lost their jobsduring this period, and even when employed, continue to be engaged in activities that makethem more susceptible to the virus or are stigmatising (Deshpande, 2020). Meanwhile, certainbillionaires in India are reported to have massively increased their wealth during the lockdownperiod (Mudgill, 2020).
The current crisis has to be seen in the larger context of liberalisation and pro-market reformsthat were intended to “impart a new element of dynamism to growth processes in our economy”.15
The growth performance has varied during the three decades after liberalisation, with the periodbetween 2003 and 2012 being a purple patch. Not all sectors have been part of the growthstory and the agrarian crisis has deepened in different parts of the country. The decline inagricultural employment has not been compensated by formal sector jobs and the ranks of theinformal economy have swelled, creating a crisis of livelihoods. Certain redistributive policieswere implemented in this phase, of which the most notable is the Mahatma Gandhi NationalRural Employment Guarantee Act (MGNREGA). Other such measures include the NationalFood Security Act (2013), Farm Loan Waiver (2008) and PM-KISAN (2019). However, theoverarching theme in the neoliberal phase has been an unabashed transfer of public resources to
14https://thejeshgn.com/projects/covid19-india/non-virus-deaths/15Budget 1991-92 speech of Manmohan Singh, the then Finance Minister
(https://www.indiabudget.gov.in/doc/bspeech/bs199192.pdf)
© Ishan Anand and Anjana Thampi
14
big corporations through various measures, including corporate tax and loan waivers, large-scaleprivatisation and cronyism. At the same time, the Fiscal Responsibility and Budget Management(FRBM) Act16 emphasised curbing fiscal deficits and public expenditure, and the social sectorexpenditure in India remains significantly below comparable countries.17 Overall, the neoliberalregime has proved to be inequality-inducing – with a rise in dollar billionaires from just two inthe mid-1990s to over a hundred in 2020, while millions continue to have insecure livelihoods,low incomes and limited access to healthcare, education, social security or other basic amenities.
The compulsions of electoral politics make it difficult to abruptly dismantle the existing welfareschemes. Rather, schemes such as the MGNREGA and the Public Distribution System (PDS)have been systematically undermined by underfunding, under-coverage and targeting errors.Jean Drèze, Reetika Khera, and Meghana Mungikar calculated that more than 100 million peoplehave been excluded from the PDS, due to the reliance of the central government on outdatedpopulation data to determine grain allocations (Scroll.in, 2020). Another example is the old agepension scheme (for persons aged 60-79 years), to which the Centre continues to contribute apaltry Rs 200 per month since 2006. The calls for winding up all existing welfare and socialsecurity schemes in favour of a universal basic income or some form of direct cash transfer havegrown louder in recent years. While the current crisis has exposed the gaping holes in India’ssocial safety nets, several reports suggest that it is the PDS and MGNREGA that have playeda crucial role in providing life support to millions.
The pandemic and recession have been used to aggressively push for further neoliberal reforms.Such reforms, announced as part of the ‘Atmanirbhar Bharat’ package, include policies such asderegulation of agricultural markets; increase in the FDI limit in the defence sector; privatisationof power departments/utilities in union territories, other public sector enterprises and airports;and commercialisation of coal mining. Several state governments, in a race to the bottom,attempted to abolish labour laws and deny workers hard-won rights – such as an eight-hourworking day – in hopes of attracting private investment. These measures are not only farremoved from the immediate context of rising hunger, joblessness, migrant crisis and supplybottlenecks, but also do not address the structural causes of India’s pre-pandemic slowdown.
Various policy suggestions regarding immediate relief have been offered, including immediateand adequate cash transfers, universalisation of the PDS, strengthening of the MGNREGA andintroduction of an urban employment guarantee programme (Drèze, 2020; Mander, Ghosh, &Patnaik, 2020). At the same time, medium and long-term responses need to be based on a moreequitable distribution of growth that includes introduction of wealth and inheritance taxes, anduniversal public provisioning of basic amenities and services such as health, education, housing,sanitation, water and public transport. The current crisis is a pandemic of extreme inequalityand the path to recovery lies in a new paradigm of development, one that puts redistribution atthe heart of its agenda.
16https://www.livemint.com/money/personal-finance/term-of-the-day-what-is-frbm-act-11579620857316.html17https://rbidocs.rbi.org.in/rdocs/Bulletin/PDFs/04AR120919_01344207730A874E1D9CD527AFFBF7CBA9.PDF
© Ishan Anand and Anjana Thampi
15
References
[1] Agarwal, K. (2019, October 2). Government Data Proves We Shouldn’t Believe India Is‘Open Defecation Free’. The Wire. Retrieved from https://thewire.in/government/swachh-bharat-open-defecation-free-data
[2] Ahluwalia, M. S. (2011). Prospects and Policy Challenges in the Twelfth Plan. Economic &Political Weekly, 46(21), 88-105.
[3] Ambedkar, B. R. (1936). Annihilation of Caste. Undeliv-ered speech at the Jat-Pat-Todak Mandal Annual Conference.https://ccnmtl.columbia.edu/projects/mmt/ambedkar/web/readings/aoc_print_2004.pdf.
[4] Anand, I. (2016). Dalit Emancipation and the Land Question. Economic & Political Weekly,51(47), 12-14.
[5] Anand, I., & Thampi, A. (2016). Recent Trends in Wealth Inequality in India. Economic &Political Weekly, 51(50), 59-67.
[6] Anand, I., & Thampi, A. (2019). A 5 Trillion Dollar Question : Is the Indian EconomyLeaving its Workers Behind? Paper presented at the 61st Annual Conference of the IndianSociety of Labour Economics, 7-9 December 2019, Patiala.
[7] Araar, A. (2009). The Hybrid Multidimensional Index of Inequality. Working Paper 09-45.CIRPEE. Retrieved from https://ideas.repec.org/p/lvl/lacicr/0945.html
[8] Behl, A. (2020, May 16). Inability to Pay Rent, No Assurance ofWork Forces Migrants to Leave. Hindustan Times. Retrieved fromhttps://www.hindustantimes.com/gurugram/inability-to-pay-rent-no-assurance-of-work-forces-migrants-to-leave/story-PAPrPPDYoQHZhoFNy8819J.html
[9] Bhagwati, J., & Panagariya, A. (2013). Why Growth Matters: How Economic Growthin India Reduced Poverty and the Lessons for Other Developing Countries. New York:PublicAffairs.
[10] Bhalla, S. S. (2017). The New Wealth of Nations. New Delhi: Simon & Schuster.
[11] Bhattacharya, P., & Devulapalli, S. (2019, December 3). India’s Rural Poverty HasShot Up. Livemint. Retrieved from https://www.livemint.com/news/india/rural-poverty-has-shot-up-nso-data-shows-11575352445478.html
[12] Bhattacharya, P., & Rathore, U. (2018, September 24). What AilsGovernment Health Insurance Schemes. Livemint. Retrieved fromhttps://www.livemint.com/Politics/ookiMaD2XU1pRETiZNW6TN/What-ails-government-health-insurance-schemes.html
[13] Chancel, L., & Piketty, T. (2019). Indian Income Inequality, 1922-2015: From British Rajto Billionaire Raj? Review of Income and Wealth, 65(S1), S33-S62.
[14] Das, J., Aiyar, Y., & Hammer, J. (2018, September 21). Will Ayushman Bharat Work?Centre for Policy Research. Retrieved from https://cprindia.org/news/7239
© Ishan Anand and Anjana Thampi
16
[15] Dasgupta, Z. (2020). Income Distribution and Effective Demand in theIndian Economy. CSE Working Paper No. 30. Bengaluru: Azim Pre-mji University. Retrieved from https://cse.azimpremjiuniversity.edu.in/wp-content/uploads/2020/08/Dasgupta_Distribution_Demand_August_2020.pdf
[16] Deaton, A. (2013). The Great Escape: Health, Wealth, and the Origins of Inequality. Prince-ton: Princeton University Press.
[17] Deshpande, A. (2020). The COVID-19 Lockdown in India: Gender and Caste Dimen-sions of the First Job Losses. Discussion Paper No. 30. Ashoka University. Retrieved fromhttps://ideas.repec.org/p/ess/wpaper/id13085.html
[18] Deshpande, A., Goel, D., & Khanna, S. (2018). Bad Karma or Discrimination? Male-FemaleWage Gaps among Salaried Workers in India. World Development, 102, 331-344.
[19] Drèze, J. (2020, September 9). DUET: A Proposal for an Urban Work Programme. Ideasfor India. Retrieved from https://www.ideasforindia.in/topics/poverty-inequality/duet-a-proposal-for-an-urban-work-programme.html
[20] Drèze, J., & Sen, A. (2013). An Uncertain Glory: India and Its Contradictions. Princeton:Princeton University Press.
[21] Duraisamy, M., & Duraisamy, P. (2006). Gender Wage Gap across the Wage Distributionin Different Segments of the Indian Labour Market,1983–2012: Exploring the Glass Ceilingor Sticky Floor Phenomenon. Applied Economics, 48(43), 4098–4111.
[22] Ghosh, J. (2019). Gendered Labor Markets and Capitalist Accumulation. Japanese PoliticalEconomy, 44(1-4), 25-41.
[23] Government of India. (2015). Report of the Seventh Central Pay Commission. Retrievedfrom https://doe.gov.in/sites/default/files/7cpc_report_eng.pdf
[24] Haque, T., & Reddy (eds.), D. N. (2019). India Social Development Report 2018: RisingInequalities in India. New Delhi: Oxford University Press.
[25] Himanshu. (2018). India Inequality Report 2018: Widening Gaps. New Delhi: Oxfam India.
[26] Jacob, N., Inamdar, V., Saha, A., & Bharadwaj, S. (2020, July 31). LowSalaries, Poor Facilities Deter Health Workers from COVID-19 Care. IndiaSpend. Re-trieved from https://www.indiaspend.com/low-salaries-poor-facilities-deter-health-workers-from-covid-19-care/
[27] Jan Swasthya Abhiyan. (2019). People’s Health Manifesto, 2019.
[28] Joshi, A. (2020, May 19). No Relief: Pay Rent or Leave, Landlords Tell Migrant Workers.The Tribune.
[29] Kesar, S., Abraham, R., Lahoti, R., Nath, P., & Basole, A. (2020). Pandemic, Informality,and Vulnerability: Impact of COVID-19 on Livelihoods in India. CSE Working Paper 2020-01. Bengaluru: Azim Premji University.
[30] Kosuru, A. (2020, August 22). Vizag Potters: Idols of Clay, Immersion in Debt. People’sArchive of Rural India. Retrieved from https://ruralindiaonline.org/articles/vizag-potters-idols-of-clay-immersion-in-debt/
© Ishan Anand and Anjana Thampi
17
[31] Kumar, S., & Preet, P. (2020, June 27). Manual Scavenging: Women Face Double Discrimi-nation as Caste and Gender Inequalities Converge. Economic & Political Weekly, 55(26-27).
[32] Kundu, S. (2019). Rural Wage Dynamics in India: What Role does InflationPlay? Reserve Bank of India Occasional Paper, 40(1), 51-84. Retrieved fromhttps://www.rbi.org.in/Scripts/PublicationsView.aspx?id=18117
[33] Lerche, J., & Shah, A. (2018). Conjugated Oppression within Contemporary Capitalism:Class, Caste, Tribe and Agrarian Change in India. Journal of Peasant Studies, 45(5-6),927-949.
[34] Madheswaran, S., & Attewell, P. (2010). Wage and Job Discrimination in the Indian Ur-ban Labour Market. In S. Thorat, & K. S. Newman (eds.), Blocked by Caste: EconomicDiscrimination in Modern India (pp. 123-147). New Delhi: Oxford University Press.
[35] Mander, H., Ghosh, J., & Patnaik, P. (2020, May 14). A Plan to Revive a BrokenEconomy. The Hindu. Retrieved from https://www.thehindu.com/opinion/lead/a-plan-to-revive-a-broken-economy/article31577261.ece
[36] Milanovic, B., & Yitzhaki, S. (2002). Decomposing World Income Distribution: Does theWorld Have a Middle Class? Review of Income and Wealth, 48(2), 155-178.
[37] Ministry of Health and Family Welfare. (2020a, February 7). Shortageof MBBS Doctors, Lok Sabha Starred Question No. 90. Retrieved fromhttp://164.100.24.220/loksabhaquestions/annex/173/AS90.pdf
[38] Ministry of Health and Family Welfare. (2020b, March 3). Shortage of Nurses in India,Rajya Sabha Unstarred Question No. 1362. Retrieved from https://bit.ly/3bvLfOu
[39] Mudgill, A. (2020, September 29). Mukesh Ambani Earned Rs 90Crore Every Hour since Lockdown. Economic Times. Retrieved fromhttps://economictimes.indiatimes.com/markets/stocks/news/mukesh-ambani-earned-rs-90-crore-every-hour-since-lockdown/articleshow/78381288.cms
[40] Mukherjee, R. (2020, July 9). Sitting Idol in Locked-down Kumartuli. People’s Archiveof Rural India. Retrieved from https://ruralindiaonline.org/articles/sitting-idol-in-locked-down-kumartuli/
[41] Nizalova, O. (2014). Inequality in Total Returns to Work in Ukraine: Taking a Closer Lookat Workplace (Dis)Amenities. Discussion Paper 52. Kyiv School of Economics and KyivEconomics Institute. Retrieved from https://ideas.repec.org/p/kse/dpaper/52.html
[42] Piketty, T. (2020). Capital and Ideology. (A. Goldhammer, Trans.) Cambridge, Mas-sachusetts: The Belknap Press of Harvard University Press.
[43] Rukmini, S. (2020, September 19). Why India Has Emerged as Pandemic Epicentre, despiteEarly Lockdown. Livemint. Retrieved from https://www.livemint.com/news/india/why-india-has-emerged-as-pandemic-epicentre-despite-early-lockdown-11600480328561.html
[44] Scroll.in. (2020, April 15). 100 Million Indians Fall through Gaps in FoodSafety Net, Economists Urge Rethink on COVID-19 Relief. Retrieved fromhttps://scroll.in/article/959235/100-million-indians-fall-through-gaps-in-food-safety-net-economists-urge-rethink-on-covid-19-relief
© Ishan Anand and Anjana Thampi
18
[45] Sharma, H. (2020, August 31). CAG Report on Rajasthan: In ODF State, Toi-lets Missing in Half of PMAY Houses Surveyed. The Indian Express. Retrievedfrom https://indianexpress.com/article/india/cag-report-on-rajasthan-in-odf-state-toilets-missing-in-half-of-pmay-houses-surveyed-6576714/
[46] Sharma, M., Gupta, S., & Estupinan, X. (2020, September). An Alternate to Survey Meth-ods to Measure Work from Home. IGIDR Working Paper WP-2020-028. Mumbai: IndiraGandhi Institute of Development Research.
[47] Stiglitz, J. E. (2012). The Price of Inequality: How Today’s Divided Society Endangers OurFuture. New York and London: W. W. Norton & Company.
[48] Subramanian, S. (2019). Inequality and Poverty: A Short Critical Introduction (Vol.Springer Briefs in Economics). Singapore: Springer.
[49] SWAN. (2020). To Leave or Not to Leave? Lockdown, Migrant Workers, and Their JourneysHome. Stranded Workers Action Network (SWAN).
[50] Tagade, N., Naik, A. K., & Thorat, S. (2018). Wealth Ownership and Inequality in India:A Socio-religious Analysis. Jornal of Social Inclusion Studies, 4(2), 196-213.
[51] Thakur, P. (2020, June 15). Feet of Clay: Chhattisgarh’s Potters, Locked Down. People’sArchive of Rural India. Retrieved from https://ruralindiaonline.org/articles/feet-of-clay-chhattisgarhs-potters-locked-down/
[52] Thampi, A. (2019). Has the Economy Left the Children Behind? Nutritional Immiserizationin India. In R. Kanbur, R. Sandbrook, & P. Shaffer (eds.), Immiserizing Growth: WhenGrowth Fails the Poor (pp. 176-202). Oxford: Oxford University Press.
[53] The Wire. (2020, September 27). How Bad Is the Employee-Boss Wage Gap in Nifty 50 Com-panies? Retrieved from https://thewire.in/business/nifty-50-employee-ceo-salary-wage-gap
[54] Thorat, A., & Joshi, O. (2020). The Continuing Practice of Untouchability in India: Pat-terns and Mitigating Influences. Economic & Political Weekly, 55(2), 36-45.
[55] Thorat, S., & Attewell, P. (2010). The Legacy of Social Exclusion: A CorrespondenceStudy of Job Discrimination in India’s Urban Private Sector. In S. Thorat, & K. S. Newman(eds.), Blocked by Caste: Economic Discrimination in Modern India (pp. 35-51). New Delhi:Oxford University Press.
[56] Thorat, S., & Newman (eds.), K. S. (2010). Blocked by Caste: Economic Discrimination inModern India. New Delhi: Oxford University Press.
[57] Vakulabharanam, V. (2010). Does Class Matter? Class Structure and Worsening Inequalityin India. Economic & Political Weekly, 45(29), 67-76.
[58] Vakulabharanam, V., & Motiram, S. (2019). Role of Urban Inequality in the Phenomenonof Rising Wealth Inequality in India, 2002-12. In T. Haque, & D. N. Reddy (eds.), IndiaSocial Development Report 2018: Rising Inequalities in India. New Delhi: Oxford UniversityPress.
[59] Vyas, M. (2020, September 8). Covid-19 Impact: 21 mn Salaried Jobs Lost inLockdown-Hit Slowing Economy. Business Standard. Retrieved from https://www.business-standard.com/article/opinion/21-million-salaried-jobs-lost-120090701477_1.html
© Ishan Anand and Anjana Thampi
19
[60] Weisskopf, T. E. (2011). Why Worry about Inequality in the Booming Indian Economy?Economic & Political Weekly, 46(47), 41-51.
[61] Yitzhaki, S. (1994). Economic Distance and Overlapping of Distributions. Journal of Econo-metrics, 61(1), 147-159.
© Ishan Anand and Anjana Thampi
20
10 Figures and Tables
Table 1: Gini coefficients of per capita consumer expenditure, wealth and incomeYear Consumption Year Income Year Wealth
1993-94 0.326 1992 0.6542004-05 0.363 2004-05 0.536 2002 0.6622011-12 0.375 2011-12 0.543 2012 0.74
2013 0.583a
Source: Authors’ calculations using the All-India Debt and Investment Surveys, NSS Consumer ExpenditureSurveys, India Human Development Surveys, and Situation Assessment Survey of Agricultural Households
a The Gini coefficient for this year includes the incomes of only agricultural households.
Table 2: Indicators used to construct normalised scores of each dimensionDimension IndicatorHousing Floor type
Wall typeRoof typeSeparate kitchenElectricityCooking fuel
Drinking water Principal sourceSufficient throughout the yearExclusive use of household
Sanitation Access to latrineLatrine typeDrainage system
© Ishan Anand and Anjana Thampi
21
Tab
le3:
Distributionof
theworkforce
(%)
Rural
Urban
Rural
+Urban
Typ
eof
worker
Male
Female
Overall
Male
Female
Overall
Male
Female
Overall
Regular
wage/
salaried
14.3
11.0
13.4
47.2
54.8
48.7
24.4
21.9
23.8
Self-em
ployed
57.4
59.7
58.0
38.7
34.5
37.8
51.6
53.4
52.1
Casua
l28.3
29.4
28.6
14.2
10.8
13.5
24.0
24.7
24.2
Source:Autho
rs’calculations
usingPLFS2018-19un
it-level
data
© Ishan Anand and Anjana Thampi
22
Table 4: Mean monthly earnings (Rs) by type of employmentWorker type Male Female Person
RuralRegular 13549 8726 12534Self-employed 9386 4121 8688Casual 6271 3785 5672All 9137 4882 8367
UrbanRegular 19400 15630 18529Self-employed 18272 7033 16598Casual 7653 4675 7202All 17389 12213 16393
Rural + UrbanRegular 17040 13041 16149Self-employed 11566 4911 10657Casual 6519 3882 5922All 11813 7382 10994
Source: Authors’ calculations using PLFS 2018-19 data
© Ishan Anand and Anjana Thampi
23
Tab
le5:
Distributionof
workers
byearnings
slab
s(%
)Regular
Workers
Self-Employed
Casua
lWorkers
AllWorkers
Earning
slab
Male
Female
Person
Male
Female
Person
Male
Female
Person
Male
Female
Person
Less
than
5,000
5.2
28.5
10.4
14.0
64.8
21.0
33.1
77.2
43.1
16.3
56.3
23.7
5,000to
10,000
31.3
34.5
32.0
39.9
25.4
37.9
56.9
21.7
48.9
41.7
27.4
39.1
10,000
to15,000
23.0
10.6
20.2
21.7
5.2
19.4
9.1
1.0
7.3
19.0
5.7
16.5
15,000
to20,000
12.8
5.6
11.2
12.3
2.0
10.9
0.7
0.1
0.6
9.6
2.6
8.3
20,000
to50,000
23.6
17.8
22.3
11.1
2.2
9.9
0.2
0.0
0.1
11.8
6.9
10.9
50,000
to1,00,000
3.8
2.9
3.6
1.0
0.3
0.9
0.0
0.0
0.0
1.5
1.1
1.4
Morethan
1,00,000
0.3
0.2
0.3
0.1
0.1
0.1
0.0
0.0
0.0
0.1
0.1
0.1
Source:Autho
rs’calculations
usingPLFS2018-19da
ta
© Ishan Anand and Anjana Thampi
24
Tab
le6:
Hou
seho
ldearnings
slab
sby
householdtype
(%)
Hou
seho
ldTyp
eLe
ssthan
5,000
5,000to
10,000
10,000
to15,000
15,000
to20,000
20,000
to50,000
50,000
to1,00,000
More
than
1,00,000
Rural
Self-em
ployed
inagriculture
19.4
40.3
20.4
11.1
8.4
0.4
0.0
Self-em
ployed
inno
n-agriculture
9.4
34.0
26.4
15.6
13.9
0.7
0.0
Regular
wage/salaried
7.2
25.0
21.9
15.0
27.1
3.4
0.4
Casua
llab
ourin
agriculture
35.0
43.0
13.5
5.5
3.0
0.0
0.0
Casua
llab
ourin
non-agriculture
25.7
46.7
17.6
5.8
4.2
0.1
0.0
Others
94.2
2.7
1.5
0.7
0.8
0.0
0.0
All-Rural
26.5
34.7
18.4
9.9
9.7
0.7
0.1
Urban
Self-em
ployed
5.7
17.2
20.1
17.6
32.6
6.0
0.9
Regular
wage/salaried
3.4
15.0
19.3
14.9
34.7
10.8
2.0
Casua
llab
our
19.1
40.0
24.0
9.9
6.6
0.2
0.0
Others
93.2
2.0
1.2
0.9
2.1
0.5
0.0
All-Urban
18.8
16.6
17.5
13.2
26.2
6.6
1.1
Rural
+Urban
Allho
useholds
24.0
28.8
18.1
10.9
15.1
2.6
0.4
Source:Autho
rs’c
alculation
susingPLF
S2018-19da
ta
© Ishan Anand and Anjana Thampi
25
Tab
le7:
Decom
position
oftheGinic
oefficientof
earnings
byho
useholdtype
Hou
seho
ldTyp
ePop
ulation
share(P
)Earning
sshare(I)
Mean
earnings
Meanratio
(I/P
)Gini
Between
grou
p(%
)Rural
Self-em
ployed
inagriculture
36.6
36.8
9988
1.0
0.372
Self-em
ployed
inno
n-agriculture
15.1
18.9
12500
1.3
0.336
Regular
wage/salaried
13.1
23.6
17921
1.8
0.402
Casua
llab
ourin
agriculture
11.7
8.7
7357
0.7
0.378
Casua
llab
ourin
non-agriculture
13.4
11.2
8338
0.8
0.342
Others
10.1
0.8
821
0.1
0.952
Allruralh
ouseho
lds
9951
0.451
29.5
Urban
Self-em
ployed
31.7
36.4
22606
1.7
0.453
Regular
wage/salaried
42.8
56.9
26263
2.0
0.434
Casua
llab
our
11.0
5.6
10054
0.8
0.349
Others
14.5
1.1
1523
0.1
0.959
Allurba
nho
useolds
19737
0.529
30.1
Rural
+Urban
Allho
useholds
13128
0.513
39.9
Source:Autho
rs’calculations
usingPLFS2018-19da
taNote:
‘Others’
inbo
thruralan
durba
nareasrefers
toho
useholds
that
dono
tha
vean
yincomefrom
econ
omic
activities.Activitieslik
eprostitution
andbe
ggingmay
lead
toearnings
but
areno
tconsidered
asecon
omic
activities
inthePLFS.
© Ishan Anand and Anjana Thampi
26
Figure 1: Ratio of average rural earnings to average urban earnings
Source: Authors’ calculations using PLFS 2018-19 data
Table 8: Decomposition of the Gini coefficient of earnings by area of residencePopulationshare (P)
Incomeshare (I)
Meanearnings
Mean ratio(I/P)
Gini Betweengroup (%)
Rural 67.5 51.2 9951 0.8 0.451Urban 32.5 48.8 19737 1.5 0.529Rural + Urban 100 100 13128 1.0 0.513 9.8
Source: Authors’ calculations using PLFS 2018-19 data
Table 9: Decomposition of inequality in earnings between male and female workersPopulationshare (P)
Incomeshare (I)
Meanearnings
Mean ratio(I/P)
Gini Betweengroup (%)
RuralMale 82.0 89.4 9149 1.1 0.340Female 18.0 10.6 4917 0.6 0.413Person 8387 0.369 11.7
UrbanMale 80.8 85.7 17416 1.1 0.422Female 19.2 14.3 12265 0.7 0.552Person 16428 0.450 4.2
Rural + UrbanPerson 11019 0.436 6.8
Source: Authors’ calculations using PLFS 2018-19 data
© Ishan Anand and Anjana Thampi
27
Figure 2: Female to male average earnings (%)
Source: Authors’ calculations using PLFS 2018-19 data
Figure 3: SC to OC average earnings (%)
Source: Authors’ calculations using PLFS 2018-19 data
© Ishan Anand and Anjana Thampi
28
Tab
le10:Decom
position
oftheGinic
oefficientof
householdearnings
bysocial
grou
pHou
seho
ldTyp
ePop
ulation
Share(P
)Earning
sSh
are(I)
Mean
Earning
sMeanRatio
(I/P
)Gini
Between
Group
(%)
Rural
ST11.6
10.1
8638
0.9
0.450
SC22.5
20.5
9056
0.9
0.435
OBC
43.5
43.2
9894
1.0
0.435
OC
22.4
26.2
11642
1.2
0.478
All
1.2
Urban
ST3.3
2.6
15806
0.8
0.526
SC13.8
10.5
15059
0.8
0.493
OBC
42.8
36.2
16670
0.8
0.491
OC
40.1
50.7
24939
1.3
0.548
All
3.4
Rural
+Urban
All
13128
0.513
3.9
Source:Autho
rs’calculations
usingPLFS2018-19da
ta
© Ishan Anand and Anjana Thampi
29
Figure 4: Year-on-year rural wage growth (%)
Source: Labour Bureau Wage Rates in Rural India seriesNote: Wages were adjusted for inflation using CPI (AL) and CPI(RL). Agricultural wages refers to the simple
average of ploughing, sowing, weeding, transplanting, harvesting, winnowing and threshing for the periodJanuary 2001 to October 2013 and a simple average of ploughing/tilling workers, sowing (including
planting/transplanting/weeding workers) and harvesting/winnowing/ threshing workers for the periodNovember 2014 to March 2020. Non-agricultural wages refer to the simple average of wages of carpenters,masons, and blacksmiths. The data for November 2013 to November 2014 has not been used to account for
changes in the wage series. For a detailed discussion of the changes, see Kundu (2019).
Figure 5: Growth rate of real wages of regular workers, 15–59 years (% per annum)
Source: Authors’ calculations using PLFS 2017-18 data and National Sample Survey Office (2014)Note: Nominal wages in rural and urban areas were deflated using CPI (AL) and CPI (IW) respectively.
© Ishan Anand and Anjana Thampi
30
Figure 6: Wage share, profit share and real productivity in organised manufacturing (%)
Source: Authors’ calculations using Annual Survey of Industries dataNote: Wage share refers to the share of nominal wages in nominal gross value added; profit share refers to theshare of nominal profits in nominal gross value added; and worker productivity refers to the real gross value
added divided by number of workers. Gross value added is deflated using the consumer price index formanufactured products.
Figure 7: Principal source of drinking water located outside premises (%)
Source: Authors’ calculations using NSSO Socio-Economic Survey: Drinking Water, Sanitation, Hygiene andHousing Condition 2018 data
© Ishan Anand and Anjana Thampi
31
Figure 8: Proportion of the population without access to toilets (%)
Source: Authors’ calculations using NSSO Socio-Economic Survey: Drinking Water, Sanitation, Hygiene andHousing Condition 2018 data
Figure 9: Population living in rented accommodation (%)
Source: Authors’ calculations using NSSO Socio-Economic Survey: Drinking Water, Sanitation, Hygiene andHousing Condition 2018 data
© Ishan Anand and Anjana Thampi
32
Figure 10: Population residing in dwellings classified by number of rooms (%)
Source: Authors’ calculations using NSSO Socio-Economic Survey: Drinking Water, Sanitation, Hygiene andHousing Condition 2018 data
Table 11: Household size and number of rooms in dwellings (%)Number of rooms
Household size 1 2 3 4 more than 52 or less 31.5 13.7 10.1 8.3 9.13 to 4 42.1 43.5 36.8 29.9 26.75 to 6 21.6 32.7 34.9 33.5 29.67 to 10 4.7 9.6 16.5 23.5 23.910 or more 0.1 0.6 1.7 4.9 10.7
Source: Authors’ calculations using NSSO Socio-Economic Survey: Drinking Water, Sanitation, Hygiene andHousing Condition 2018 data
Figure 11: Population residing in dwellings by number of rooms and by social group (%)
Source: Authors’ calculations using NSSO Socio-Economic Survey: Drinking Water, Sanitation, Hygiene andHousing Condition 2018 data
© Ishan Anand and Anjana Thampi
33
Table 12: Population residing in slums by number of rooms in dwelling (%)Number of rooms
1 2 3 4 More than 5Population (%) 51.1 34.8 10.0 2.6 1.4Household size2 or less 25.4 11.7 6.8 7.3 0.03 to 4 45.0 45.2 37.1 16.1 23.25 to 6 23.3 31.6 34.6 42.7 34.77 to 10 6.0 10.9 18.3 27.2 29.110 or more 0.3 0.6 3.2 6.8 13.0Total 100 100 100 100 100
Source: Authors’ calculations using NSSO Socio-Economic Survey: Drinking Water, Sanitation, Hygiene andHousing Condition 2018 data
Table 13: Population residing in urban slums by social group (%)ST SC OBC OC All
Population (%) 13.8 14 6.0 6.3 7.6Residence status of head of slum-dwelling householdRation card 27.7 25.1 20.8 17.0 21.2Voter ID 13.6 14.7 11.0 15.3 13.5
Source: Authors’ calculations using NSSO Socio-Economic Survey: Drinking Water, Sanitation, Hygiene andHousing Condition 2018 data
Figure 12: Population without access to electricity in dwelling (%)
Source: Authors’ calculations using NSSO Socio-Economic Survey: Drinking Water, Sanitation, Hygiene andHousing Condition 2018 data
© Ishan Anand and Anjana Thampi
34
Figure13:Pop
ulationusingLP
Gan
dfirew
oodforcook
ing(%
)
Source:Autho
rs’calculations
usingNSS
OSo
cio-Econo
mic
Survey:Drink
ingWater,Sa
nitation
,Hyg
iene
andHou
sing
Con
dition
2018
data
© Ishan Anand and Anjana Thampi
35
Figure 14: Treated population by type of facility (%)
Source: Authors’ calculations using NSSO Household Social Consumption: Health Survey 2017-18 data
Figure 15: Treated population by type of facility and by social group (%)
Source: Authors’ calculations using NSSO Household Social Consumption: Health Survey 2017-18
© Ishan Anand and Anjana Thampi
36
Figure 16: Population above 15 years with a graduate degree or above (%)
Source: Authors’ calculations using NSSO Household Social Consumption: Education Survey2017-18 data
Table 14: Enrolment status of population, 3 – 35 years (%)ST SC OBC OC All
Never enrolled Male 14.7 13.4 11.0 7.8 11.0Female 22.4 20.0 17.6 9.4 16.6Person 18.4 16.5 14.1 8.5 13.6
Ever enrolled but currently not attending Male 42.3 43.2 41.3 45.1 42.7Female 40.4 39.0 41.2 47.5 42.2Person 41.4 41.3 41.3 46.2 42.5
Currently attending Male 43.1 43.4 47.7 47.1 46.2Female 37.2 41.0 41.3 43.1 41.2Person 40.3 42.3 44.7 45.3 43.9
Source: Authors’ calculations using NSSO Household Social Consumption: Education Survey 2017-18 data
© Ishan Anand and Anjana Thampi
37
Tab
le15:Drop-ou
tratesby
educationa
llevel
(%)
Primary(class
Ito
V)
Upp
erPri-
mary/
Middle
Second
ary
Higher
Second
ary
Gradu
ate
Postgradu
ate
andab
ove
Overall
STMale
12.8
21.7
29.8
12.4
6.0
3.9
17.7
Female
19.5
22.7
25.6
11.9
7.5
2.6
19.5
Person
16.0
22.2
28.0
12.2
6.6
3.5
18.5
SCMale
9.6
18.2
22.2
11.4
6.3
3.2
13.7
Female
12.0
18.8
19.7
9.7
6.9
2.1
14.3
Person
10.7
18.5
21.1
10.7
6.6
2.7
14.0
OBC
Male
7.1
15.1
18.8
9.2
4.7
2.4
11.0
Female
10.4
16.4
17.5
8.7
4.8
3.1
12.1
Person
8.7
15.7
18.2
9.0
4.8
2.7
11.5
OC
Male
8.3
16.7
17.8
9.9
4.7
2.2
10.7
Female
9.2
19.4
19.3
8.4
4.7
1.0
11.7
Person
8.7
18.0
18.5
9.3
4.7
1.6
11.2
All
Male
8.5
16.9
20.4
10.1
5.0
2.5
12.1
Female
11.6
18.3
19.2
9.0
5.2
1.9
13.1
Person
10.0
17.5
19.8
9.6
5.1
2.2
12.6
Source:Autho
rs’calculations
usingNSS
OHou
seho
ldSo
cial
Con
sumption:
Edu
cation
Survey
2017
-18da
ta
© Ishan Anand and Anjana Thampi
38
Tab
le16:Pop
ulationwho
drop
pedou
tby
reason
(%)
Not
interested
ineducation
Finan
cial
constraints
Eng
aged
indo
mestic
activities
Eng
aged
inecon
omic
activities
Una
bleto
cope
upwith
stud
ies/
failu
rein
stud
ies
Marriage
STMale
23.6
26.5
4.7
31.5
5.2
-Fe
male
20.7
18.7
29.9
5.9
5.0
8.4
Person
22.2
22.9
16.4
19.6
5.1
SCMale
22.3
28.7
4.0
35.6
4.4
-Fe
male
18.7
21.3
31.6
4.2
3.9
11.9
Person
20.7
25.5
16.2
21.7
4.2
OBC
Male
19.7
26.3
4.1
39.8
3.9
-Fe
male
15.6
19.1
33.2
6.4
3.0
13.6
Person
17.8
22.9
17.7
24.2
3.5
OC
Male
17.1
22.3
4.3
44.4
3.6
-Fe
male
12.1
16.8
32.1
5.4
3.8
19.1
Person
14.8
19.7
17.3
26.2
3.7
All
Male
20.0
25.8
4.2
39.2
4.1
-Fe
male
15.8
18.9
32.3
5.7
3.6
14.2
Person
18.1
22.6
17.2
23.7
3.8
Source:Autho
rs’calculations
usingNSS
OHou
seho
ldSo
cial
Con
sumption:
Edu
cation
Survey
2017-18da
ta
© Ishan Anand and Anjana Thampi
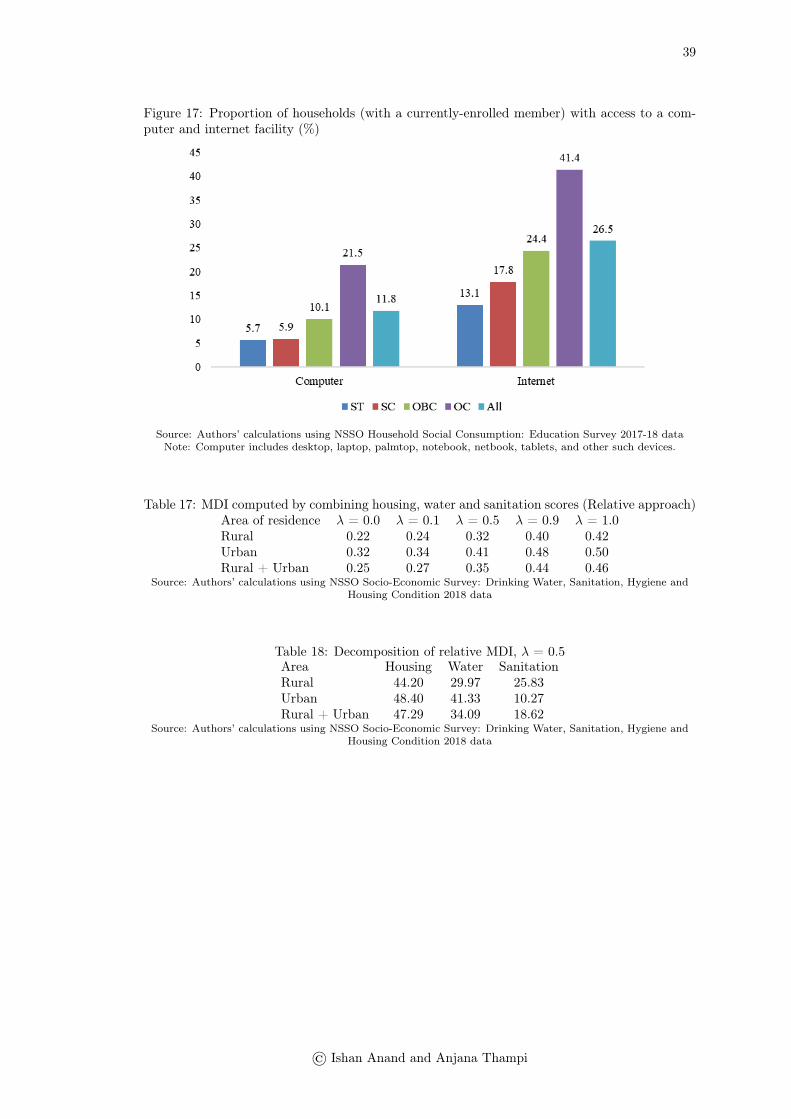
39
Figure 17: Proportion of households (with a currently-enrolled member) with access to a com-puter and internet facility (%)
Source: Authors’ calculations using NSSO Household Social Consumption: Education Survey 2017-18 dataNote: Computer includes desktop, laptop, palmtop, notebook, netbook, tablets, and other such devices.
Table 17: MDI computed by combining housing, water and sanitation scores (Relative approach)Area of residence λ = 0.0 λ = 0.1 λ = 0.5 λ = 0.9 λ = 1.0Rural 0.22 0.24 0.32 0.40 0.42Urban 0.32 0.34 0.41 0.48 0.50Rural + Urban 0.25 0.27 0.35 0.44 0.46
Source: Authors’ calculations using NSSO Socio-Economic Survey: Drinking Water, Sanitation, Hygiene andHousing Condition 2018 data
Table 18: Decomposition of relative MDI, λ = 0.5Area Housing Water SanitationRural 44.20 29.97 25.83Urban 48.40 41.33 10.27Rural + Urban 47.29 34.09 18.62
Source: Authors’ calculations using NSSO Socio-Economic Survey: Drinking Water, Sanitation, Hygiene andHousing Condition 2018 data
© Ishan Anand and Anjana Thampi

40
Tab
le19:State-wiseindicators
(%)
Pop
ulation(%
)Insuficient
drinking
water
Noaccess
totoilets
Rented
dwellin
gRentSh
are
No
electricity
LPG
use
Shareof
public
hospitals
Pop
ulationin
slum
s
Rural
Urban
Rural
Urban
Rural
Urban
Urban
Rural
Urban
Rural
Urban
Rural
Urban
Urban
Him
acha
lPradesh
39.4
29.9
2.9
3.1
5.1
59.3
18.1
0.4
1.3
4485.2
66.7
73.4
1.2
Pun
jab
76
6.6
0.3
1.2
19.9
120.4
075.8
94.6
13.2
16.9
3.3
Uttarak
hand
17.6
3.2
2.9
0.1
1.6
10.8
26.5
1.9
0.6
57.6
97.9
52.2
21.7
0.3
Haryana
512.7
3.5
0.1
1.8
23.8
16.1
0.5
0.1
50.6
94.7
25.3
9.6
2.9
Rajasthan
25.2
16.2
33.8
4.5
0.8
1822
6.8
0.3
32.4
90.4
42.8
32.1
3.3
Uttar
Pradesh
3.3
4.5
46.2
7.5
0.3
17.9
18.7
17.9
3.7
38.3
86.9
14.2
140.9
Bihar
4.1
0.9
35.5
5.2
0.1
1723.1
2.3
0.4
44.2
91.2
17.7
22.6
2.1
Assam
3.8
2.2
2.2
0.5
4.8
21.7
20.7
6.3
1.1
53.1
9250.6
22.6
0.3
WestBengal
8.3
6.9
16.4
3.5
1.9
18.8
16.7
2.7
0.9
24.7
79.8
33.1
21.3
10Jh
arkh
and
10.2
11.2
40.1
8.1
1.2
25.5
15.6
14.7
1.3
21.4
70.1
30.7
14.7
2.5
Odisha
15.6
8.6
52.5
20.9
2.7
31.9
21.1
9.7
3.3
24.2
75.6
55.2
62.3
18.7
Chh
attisgarh
14.1
22.9
82.8
0.4
14.2
18.7
1.6
0.4
29.5
83.8
48.3
24.8
18.4
Mad
hyaPradesh
36.3
28.6
27.1
5.5
0.6
19.5
21.3
3.2
0.3
3489.8
33.7
26.2
5.9
Gujarat
9.6
7.3
24.4
4.3
1.6
2118.1
21.3
49.8
85.1
32.6
17.1
5.8
Mah
arashtra
27.7
9.9
211.6
2.9
24.6
27.1
2.8
0.5
67.1
90.9
29.1
22.1
18.6
And
hraPradesh
7.1
5.9
22.4
3.1
9.8
47.8
25.9
0.5
081.5
94.5
19.1
26.8
28.6
Karna
taka
7.7
7.9
31.8
5.6
3.7
40.8
321.2
0.5
70.5
94.8
2914.1
6.2
Goa
13.3
2.4
19.2
016.1
25.9
23.6
1.6
089.9
9956.3
610
Kerala
15.9
14.5
0.2
04
9.9
26.9
0.3
0.1
50.8
6851.8
41.7
0Tam
ilNad
u17.6
7.9
35.8
6.2
538.3
25.7
1.2
0.6
87.5
95.6
63.3
40.6
3.4
Telan
gana
6.4
7.9
20.4
1.4
2.6
44.5
24.7
0.5
092.7
96.9
2416.4
2.8
All-India
12.4
10.2
28.7
4.1
225.9
23.3
6.1
0.9
47.5
88.7
32.5
26.2
7.6
Source:Autho
rs’calculations
usingNSS
Osurveyson
Healthan
dDrink
ingWater,Sa
nitation
,Hyg
iene
andHou
sing
Con
dition
2017-18da
ta.
Note:
Rentshareis
theshareof
mon
thly
rent
inho
useholdconsum
erexpe
nditurean
ditsshow
non
lyforurba
nareas.
Noelectricityrepresents
theprop
oriton
ofpo
pulation
that
does
not
have
electricityfordo
mesticuse.
Shareof
public
hospitalsrepresents
theprop
ortion
ofcasestreatedin
public
hospitals.
Slum
popu
lation
istheprop
ortion
ofurba
npo
pulation
livingin
slum
s.
© Ishan Anand and Anjana Thampi
41
11 Biographies
Ishan Anand is Assistant Professor at Jindal Global Law School, O. P. Jindal Global University,Sonepat. He holds a PhD in Economics from Jawaharlal Nehru University, New Delhi. His doc-toral thesis studied the costs of cultivation, farm incomes and agrarian distress in the neoliberalperiod. His research interests include agrarian studies, inequality, exclusion, labour and politicaleconomy.
Anjana Thampi is Assistant Professor at Jindal Global Law School, O. P. Jindal Global Univer-sity, Sonepat. She works on the areas of food security, employment, inequality and gender. Shecompleted her PhD in Economics at Jawaharlal Nehru University, New Delhi. Her doctoral thesisassessed whether food provisioning programmes have mitigated the mismatch between economicgrowth and nutritional indicators in India and explored the impact of two such programmes onchild nutrition and inequality.
© Ishan Anand and Anjana Thampi