Embed Size (px)
Citation preview
Concentration of Economic and
Political Power
by Gerardo Esquivel Hernandez
Extreme Inequality
in Mexico
Ave
nid
a d
e l
os P
oe
ta
s o
n t
he
co
rne
r w
ith
Av.
Ta
ma
uli
pa
s,
Sa
nta
Fe
Extreme Inequality in Mexico Concentration of Economic and Political Power
by Gerardo Esquivel Hernandez
About the authorGerardo Esquivel has a bachelor’s degree in Economics from Universidad Nacional Autónoma de México, a master’s degree in Economics from El Colegio de México, and a Ph.D. in Economics from Harvard University. He is currently a professor and researcher at the Centre for Economic Studies in El Colegio de México, where he has collaborated since 1998. Gerardo Esquivel is a member of the National System of Researchers Level III.
Acknowledgements Thanks to Consuelo López-Zuriaga for her guidance and perseverance, for inspiring us; to Ricardo Fuentes-Nieva, Head of Oxfam’s Research Department, for the support given to Oxfam Mexico and his valuable contributions in the review of this document; to colleagues in the Oxfam Confederation who shared their knowledge and comments when reviewing this document; to all the people who contributed in different ways: to Sara Eugenia García Peláez for the editing work, to Dzilam Méndez for the photographic work, to Gabriela Sánchez for the graphic design and to Tlatolli Ollin for the translation from the Spanish version.
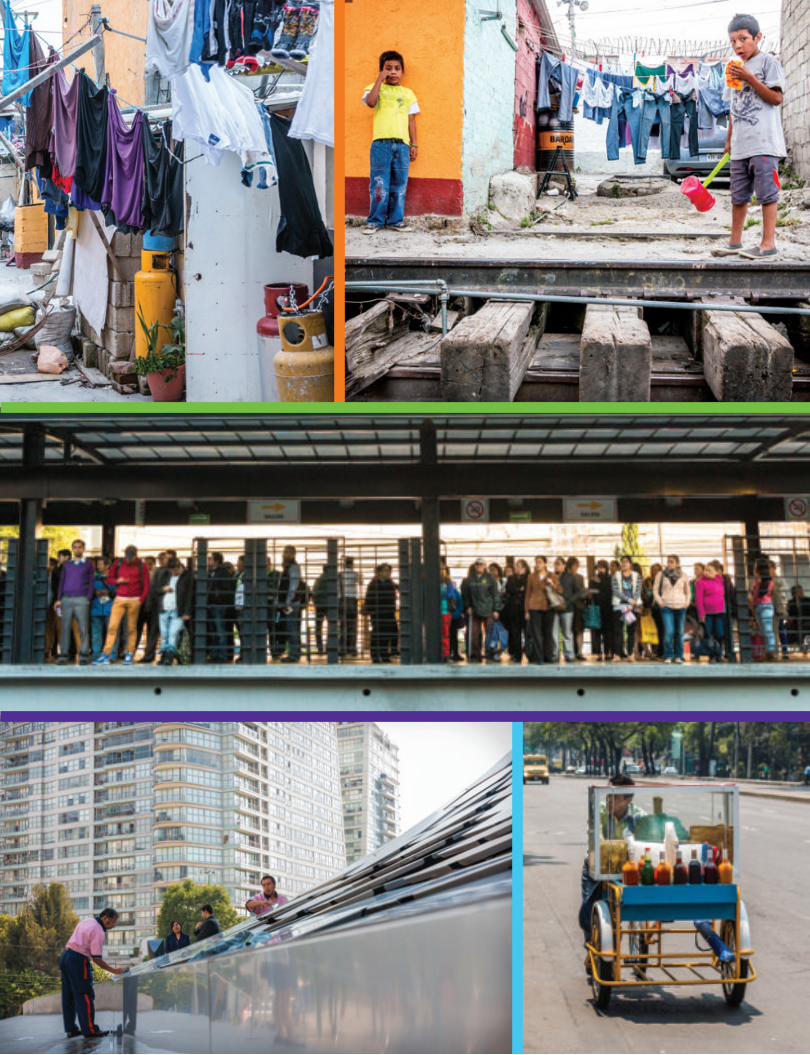
Photo credits PAGE 4 • Photo 1: An alley of San Antonio, Mexico City; Photo 2: Children curiously facing the
camera, neighbourhood of San Antonio, Mexico City; Photo 3: Metrobus station; Photo 4: Soumaya museum
cleaning personnel ; Photo 5: “raspados” street vendor on Eje 10, Mexico City.
8LI�STMRMSRW�I\TVIWWIH�MR�XLMW�TYFPMGEXMSR�EVI�XLSWI�SJ�XLI�EYXLSVW��8LI]�HS�RSX�TYVTSVX�XS�VI�IGX�XLI�
opinions or views of Oxfam.
CONTENT
;Ōŝ�3ŜŊŅő�1ʼnŜōŇœ�ȊŋŌŘŗ�ōŒʼnŕřŅŐōŘŝForeword
Executive Summary
-��8Ōʼn�őŅŋŒōŘřňʼn�œŊ�ōŒʼnŕřŅŐōŘŝ�ōŒ�1ʼnŜōŇœ
Inequality in Mexico from a comparative perspectiveEvolution of inequality in MexicoThe true size and evolution of the highest income decile in MexicoTop 1% of the highest incomeDistribution of wealth in Mexico
--��8Ōʼn�ŚōŇōœřŗ�ŇŝŇŐʼn�œŊ�ōŒʼnŕřŅŐōŘŝ�ŅŒň�ʼnŇœŒœőōŇ�ŅŒň�ŔœŐōŘōŇŅŐ�ŇŅŔŘřŖʼn
The rise of Mexican multimillionairesPrivileged sectorsFiscal policy that favours individuals with larger incomesCapital-labour distribution
---��)ŇœŒœőōŇ�ŅŒň�ŗœŇōŅŐ�ŇœŒŗʼnŕřʼnŒŇʼnŗ�œŊ�ōŒʼnŕřŅŐōŘŝ�ŅŒň�ŔœŐōŘōŇŅŐ�ŇŅŔŘřŖʼn
Inequality and growthExclusive economic growthMinimum wageInequality, marginalization and exclusion of the indigenous populationPrivate education vs. public education: Unequal treatmentInequality, marginalization and violence
-:��%�ŔŖœŋŖŅő�Řœ�ŇœőņŅŘ�ōŒʼnŕřŅŐōŘŝ�ŅŒň�ŅŒ�ŅŋʼnŒňŅ�ŊœŖ�ŘŌʼn�ŊřŘřŖʼn
1. Creation of a genuine Social State���%�QSVI�TVSKVIWWMZI��WGEP�TSPMG]3. Improved focalization of expenditures4. Wage and labour policy 5. Transparency and accountability mechanisms
References
5
7
11
1112131516
17
17212224
26
262728323335
36
3737383939
40
EXTREME INEQUALITY IN MEXICO
CONCENTRATION OF ECONOMIC AND POLITICAL POWER
5
;Ōŝ�3ŜŊŅő�1ʼnŜōŇœ�ȊŋŌŘŗ�ōŒʼnŕřŅŐōŘŝ
ForewordOxfam revealed in 2014 that 85 people around the world hold the same wealth as half of the world
population. By January 2015, that number went down to 80. Since then, we have begun a global
movement through the even it up campaign (IGUALES, in Spanish speaking countries) in order
to alert political leaders, businesspeople and the general population that extreme inequality is
LMRHIVMRK�TVSKVIWW�MR�XLI��KLX�EKEMRWX�TSZIVX]��2S[��3\JEQ�1I\MGS�MW�NSMRMRK�XLMW�GEPP�F]�EWOMRK�E�
prominent Mexican economist to shed light on the real extent of inequality that exists in Mexico.
What we found in this publication by Gerardo Esquivel is that in the last decades, Mexico has
experienced an increase in extreme inequality while the economy has stagnated. Economic growth
is low, average wages do not go up, poverty persists, but the wealth of a few is still growing.
Our country is immersed in a vicious cycle of inequality, lack of economic growth, and poverty. It is
the world’s fourteenth economy and yet 53.3 million people live in poverty. Inequality has slowed
the potential of Mexico’s physical, social and human capital, making a rich country continue to
have millions of poor people. Where is that Mexican wealth? In terms of income and capital, it is
GSRGIRXVEXIH�MR�E�WIPIGX�KVSYT�SJ�TISTPI�[LS�LEZI�FIRI�XIH�JVSQ�XLI�PMXXPI�IGSRSQMG�KVS[XL�
Mexico has seen in the last 20 years. Thus, while the GDP per capita increases by less than 1%
ERRYEPP]��XLI�JSVXYRI�SJ�XLI����[IEPXLMIWX�1I\MGERW�MW�QYPXMTPMIH�F]��ZI�
;I�EVI�GSRGIVRIH�EFSYX�XLI�I\GIWWMZI�ERH�[VSRKJYP�MR�YIRGI�IGSRSQMG�ERH�TVMZEXI�TS[IVW�LEZI�
on public policy and the impact this has on the rights of citizens. People living in poverty are the
QSWX�EJJIGXIH�F]�XLMW��8LI��KLX�[I�QYWX�XEOI�SR�MW�JSV�XLSWI�TISTPI�[LS�EVI�I\GPYHIH��LEZI�RS�
voice or ability to participate in decisions that affect their lives and that of their children. Inequality
hinders the development of physical, social and human capital needed to improve people’s lives.
,IRGI���KLXMRK�MRIUYEPMX]�XS�VIHYGI�TSZIVX]�MW�E�XEWO�XLEX�MRZSPZIW�EPP�SJ�YW�ERH�FIRI�XW�EPP�SJ�YW���
8LMW�MW�XLI��VWX�VITSVX�MWWYIH�YRHIV�3\JEQ�1I\MGSvW�even it up campaign. However, we know
that other dimensions of inequality such as race, gender and geography are interconnected and
EVI�HMJ�GYPX�XS�HMWWSGMEXI�GSQTPIXIP]�JVSQ�XLI�IGSRSQMG�EWTIGX��8LMW�VITSVX�LMKLPMKLXW�WSQI�SJ�
EXTREME INEQUALITY IN MEXICO
CONCENTRATION OF ECONOMIC AND POLITICAL POWER
6
these dimensions, but Oxfam Mexico will set up a long-term roadmap with other Mexican and Latin-
American experts to contribute to the public debate on inequality and understand the exit routes
and opportunities for change.
It’s time to change the rules�SJ�XLI�KEQI��FSXL�IGSRSQMGEPP]�ERH�TSPMXMGEPP]��XLEX�FIRI�X�SRP]�E�JI[��
Inequality can be reverted through the collaboration between political players, civil society and the
private sector. Mexico needs a national pact for EQUALITY where people’s actions are key to building
a more effective State. Mexico needs a State that works for the many, not for the few; where money
is spent sensibly on education, health and essential services; that promote policies to stop letting
people work hard just to remain poor; so that those who earn more pay more; and to make a more
transparent State.
Reducing inequality in Mexico makes sense to guarantee the future of us all.
EXTREME INEQUALITY IN MEXICO
CONCENTRATION OF ECONOMIC AND POLITICAL POWER
7
Executive Summary
In January 2014, Oxfam revealed that 85 of the richest people around the world controlled the same
wealth as the world population’s poorest half. By January 2015, that number had fallen to 80. The
worsening of economic inequality is the most concerning trend for 2015, according to the World
Economic Forum. It is thus imperative to talk about this in Mexico, where over 23 million people
cannot afford a basket of basic goods, but is home to one of the wealthiest men in the world. Now,
this inequality that characterises Mexico not only has social consequences, political implications
play a major role.
One of the most serious aspects of this inequality is the distribution of income. Given the scarce
gathering of indicators, knowing how unequal Mexico is, compared to other countries, seems to
be a complex task. Nevertheless, the Standardized World Income Inequality Database informs that
Mexico is within the 25% of countries with the highest levels of inequality in the world.
The problem has worsened over time. Two databases have produced data for the last three
decades, namely the Socio-Economic Database of Latin America and the Caribbean (SEDLAC) and
the Income Distribution Database (OECD), and the two results were that between the mid-1990s
and 2010, income inequality decreased, but inequality was greater then, than in the 1980s. We
are therefore faced with two contradicting events: income per capita has increased, but poverty
rates in the country have stagnated. The latter is due to growth being concentrated in the highest
spheres of distribution.
3FXEMRMRK�SJ�GMEP�HEXE�SR�[LEX�LETTIRW�MR�XLI�LMKLIV�GPEWWIW�MW�EPQSWX�MQTSWWMFPI��LIRGI�XLI�
need to resort to tax returns. So, indirectly and through statistical methods, authors such as
Campos, Esquivel and Chávez (2014, 2015) have estimated what occurs in that ‘unknown’ Mexico:
the wealthiest 1% of the populations gets 21% of the nation’s total income. Meanwhile, the 2014
Global Wealth Report states that 10% of Mexico’s richest concentrates 64.4% the country’s wealth.
Another report from WealthInsight assures that the wealth of Mexico’s millionaires by far exceeds
that of others around the world. The number of millionaires in Mexico grew 32% between 2007 and
2012. In the rest of the world and during that same period, it decreased by 0.3%.
EXTREME INEQUALITY IN MEXICO
CONCENTRATION OF ECONOMIC AND POLITICAL POWER
8
The number of multimillionaires in Mexico has not increased much in recent years. To date, there
are only 16. What has increased is the importance and extent of their wealth. In 1996, it was an
IUYMZEPIRX�SJ�97(�������FMPPMSR��XSHE]��XLEX��KYVI�VMWIW�XS�97(��������FMPPMSR��8LMW�MW�E�VIEPMX]��MR�
2002, the wealth of four Mexicans represented 2% of GDP; between 2003 and 2014, that percentage
increased to 9%. This is a third of the total income of almost 20 million Mexicans.
In order to give us an idea of the extent of the gap in Mexico, let us see this example. By 2014, the
four main Mexicans multimillionaires could have hired up to 3 million Mexican workers paying the
equivalent of minimum wages without losing a single penny of their fortune.
There are more than social consequences resulting from the aforementioned. Carlos Slim in the
telecommunications industry, Germán Larrea and Alberto Bailleres in the mining industry, and
6MGEVHS�7EPMREW�4PMIKS�MR�XLI�XIPIGSQQYRMGEXMSRW��QIHME��RERGMEP�ERH�VIXEMP�MRHYWXVMIW��8:�%^XIGE��
Iusacell and Banco Azteca, to name a few). All four of them have made their fortunes in the private
sector, licensed and/or regulated by the public sector. These elites have captured the Mexican
state, either through lack of regulation or excessive tax privileges.
One of the big problems resides in that our tax policy favours those who have more. It is in no way
progressive and the redistributive effect is almost non-existent. By taxing consumption—over
and above income—poor families end up paying more taxes than the rich, since they spend a
higher percentage of their income. The marginal income tax rate—one of the lowest among OECD
countries—the fact capital gain in stock markets is not taxed and neither is inheritance, among
SXLIV�XLMRKW��EVI�I\EQTPIW�SJ�LS[�E�XE\�W]WXIQ�FIRI�XW�QSVI�TVMZMPIKIH�WIGXSVW��
The constant inequality and political capture by elites have serious economic and social
consequences that are also excluding. The internal market is frankly weak. When facing the
scarcity of resources, human capital is curtailed and the productivity of small businesses is
jeopardised.
Similarly, social policy has experienced resounding failure. To the day, the logic that growth
�PXIVW�JVSQ�XLI�XST�PE]IVW�HS[R�XS�XLI�PS[IV�SRIW�WMQTP]�LEW�RSX�SGGYVVIH�MR�1I\MGS�JSV�HIGEHIW��
One of the painful examples is minimum wage: if a Mexican earns this amount and provides for
another person, both are considered to be in extreme poverty. Wage policy, which at some point
[EW�GSRGIMZIH�EW�E�QIGLERMWQ�XS�GSRXEMR�MR�EXMSR��LEW�RS�VIEWSR�SJ�FIMRK��8SHE]��XLI�1I\MGER�
minimum wage is below the accepted poverty threshold.
Other aspects that have detonated or are themselves the result of extreme inequality in Mexico and
are pending in the public agenda include:
EXTREME INEQUALITY IN MEXICO
CONCENTRATION OF ECONOMIC AND POLITICAL POWER
9
• The indigenous population, whose poverty rate is four times higher than the general rate.
• Private versus state education.
e� :MSPIRGI�GEYWIH�F]�QEVKMREPMWEXMSR�
The agenda for the future
8LI�KET�FIX[IIR�VMGL�ERH�TSSV�MW�LYVXMRK�YW��-J�[I�HS�RSX�TYX�E�WXST�XS�MX��MX�[MPP�LMRHIV�XLI��KLX�
against poverty—and pose a threat to Mexico’s sustainable growth. But it doesn’t have to be that
way. We hold the solutions to make Mexico a fairer country.
1. The creation of a genuine Social State and a change in focus from an assistentialist State to a
State that guarantees access to basic services while focusing on rights.
��� -J�E�TVSKVIWWMZI��WGEP�TSPMG]�ERH�E�JEMVIV�HMWXVMFYXMSR�EVI�GVIEXIH��[I�[MPP�FI�EFPI�XS�WTIEO�EFSYX�E�
policy more aligned to the medium and long term objectives.
3. Expenditure should focus on education, health and access to basic services, on infrastructure,
on schools with services to reduce—not widen—the inequality gap.
4. Employment and salary policies must also change. The purchasing level of the minimum wage
must be strengthened, urgently.
5. Transparency and accountability: if corruption is to really be eradicated, tax returns of all civil
servants must be made public. Only then can a State under the rule of law be strengthened.
EXTREME INEQUALITY IN MEXICO
CONCENTRATION OF ECONOMIC AND POLITICAL POWER
10
The problem of inequality is increasingly important worldwide.1 According
to the World Economic Forum, deepening economic inequality is the main
global tendency for 2015. Latin America is the second region in the world
with the worst effects from this tendency over the next 12 to 18 months
(World Economic Forum, 2014). Hence, we must discuss inequality in
Mexico. Although the topic has been avoided, the time has come to address
inequality for ethical, political and economic reasons. In this country,
one of the richest men in the world coexists with more than 23 million
TISTPI�[LSWI�MRGSQI�MW�MRWYJ�GMIRX�XS�IZIR�TYVGLEWI�E�FEWMG�JSSH�FEWOIX��
Furthermore, this situation cannot be delimited to just a social dimension:
extreme inequality has strong political implications.2 Economic power of
GIVXEMR�WIGXSVW�SJ�XLI�TSTYPEXMSR�MW�MRGVIEWMRKP]�VI�IGXIH�MR�TYFPMG�TSPMGMIW�
XLEX��F]�SRP]�FIRI�XXMRK�E�JI[��EGGIRXYEXI�I\MWXMRK�MRIUYEPMX]�MR�SYV�GSYRXV]��
Nevertheless, the panorama can be shifted if we recognize the magnitude of
inequality that characterizes Mexico; for some time now, this is a burden that
has limited the country’s economic growth and has immersed our society in a
vicious cycle of poverty.
1 For example, see the OXFAM report (2014a) and all references cited therein.2 For this topic, see OXFAM (2014b).
EXTREME INEQUALITY IN MEXICO
CONCENTRATION OF ECONOMIC AND POLITICAL POWER
11
An a
rmch
air i
n th
e m
iddl
e of
Via
duct
o M
igue
l Ale
mán
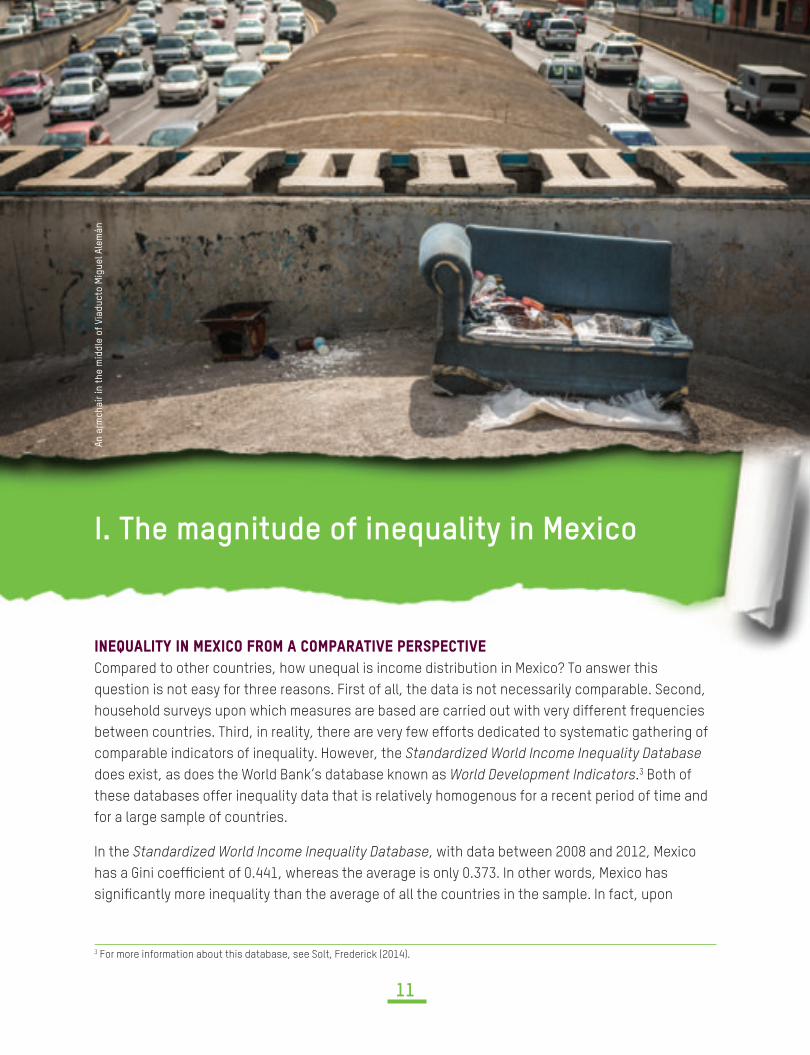
I. The magnitude of inequality in Mexico
-ŒʼnŕřŅŐōŘŝ�ōŒ�1ʼnŜōŇœ�ŊŖœő�Ņ�ŇœőŔŅŖŅŘōŚʼn�ŔʼnŖŗŔʼnŇŘōŚʼnCompared to other countries, how unequal is income distribution in Mexico? To answer this question is not easy for three reasons. First of all, the data is not necessarily comparable. Second, household surveys upon which measures are based are carried out with very different frequencies between countries. Third, in reality, there are very few efforts dedicated to systematic gathering of comparable indicators of inequality. However, the Standardized World Income Inequality Database does exist, as does the World Bank’s database known as World Development Indicators.3 Both of these databases offer inequality data that is relatively homogenous for a recent period of time and for a large sample of countries.
In the Standardized World Income Inequality Database, with data between 2008 and 2012, Mexico LEW�E�+MRM�GSIJ�GMIRX�SJ��������[LIVIEW�XLI�EZIVEKI�MW�SRP]��������-R�SXLIV�[SVHW��1I\MGS�LEW�WMKRM�GERXP]�QSVI�MRIUYEPMX]�XLER�XLI�EZIVEKI�SJ�EPP�XLI�GSYRXVMIW�MR�XLI�WEQTPI��-R�JEGX��YTSR�
3 For more information about this database, see Solt, Frederick (2014).
EXTREME INEQUALITY IN MEXICO
CONCENTRATION OF ECONOMIC AND POLITICAL POWER
12
Evolution of Inequality in Mexico�+MRM�GSIJ�GMIRX
')(0%7�;SVPH�&ERO
OECD
19820.42
0.44
0.46
0.48
0.50
0.52
0.54
0.56
0.58
1984 1986 1988 1990 1922 1994 1996 1998 2000 2002 2004 2006 2008 2010 2012 2014
organizing countries from lower to higher levels of inequality, Mexico is ranked 87 among 113 countries; 76% of the countries in this sample demonstrate lower income inequality.
8LI�WIGSRH�HEXE�FEWIr[MXL�����GSYRXVMIWrGSR�VQW�XLIWI�VIWYPXW��)ZIR�XLSYKL�XLI�HEXE�MW�WTVIEH�out over time, the most recent data is from the year 2000 to date. Here, using a slightly different QIXLSHSPSK]��1I\MGS�LEW�E�+MRM�GSIJ�GMIRX�SJ��������[LIVIEW�XLI�EZIVEKI�JSV�SXLIV�GSYRXVMIW�MW�QIVIP]��������-R�XIVQW�SJ�TIVGIRXEKIW��XLI�HMJJIVIRGI�MW�WMQMPEV�XS�XLI��VWX�HEXEFEWI��&]�SVKERM^MRK�countries according to increasing inequality, Mexico is ranked 107 of 132; that is to say, 80% of the rest of the countries in the world have less inequality. In both cases, Mexico falls within the 25% of countries with the highest levels of inequality in the world.
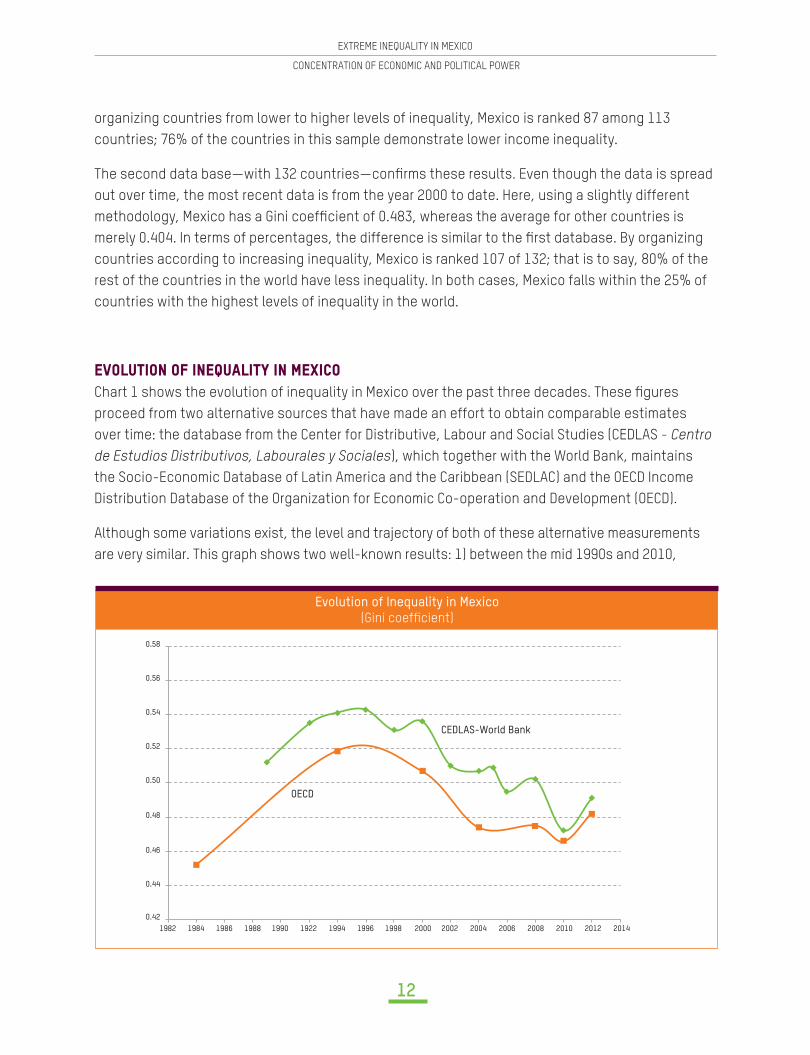
)ŚœŐřŘōœŒ�œŊ�ōŒʼnŕřŅŐōŘŝ�ōŒ�1ʼnŜōŇœ'LEVX���WLS[W�XLI�IZSPYXMSR�SJ�MRIUYEPMX]�MR�1I\MGS�SZIV�XLI�TEWX�XLVII�HIGEHIW��8LIWI��KYVIW�proceed from two alternative sources that have made an effort to obtain comparable estimates over time: the database from the Center for Distributive, Labour and Social Studies (CEDLAS - Centro de Estudios Distributivos, Labourales y Sociales), which together with the World Bank, maintains the Socio-Economic Database of Latin America and the Caribbean (SEDLAC) and the OECD Income Distribution Database of the Organization for Economic Co-operation and Development (OECD).
Although some variations exist, the level and trajectory of both of these alternative measurements are very similar. This graph shows two well-known results: 1) between the mid 1990s and 2010,
EXTREME INEQUALITY IN MEXICO
CONCENTRATION OF ECONOMIC AND POLITICAL POWER
13
MRGSQI�MRIUYEPMX]�HMQMRMWLIH�WMKRM�GERXP]�MR�1I\MGS�ERH�� �EX�PIEWX��FEWIH�SR�3)'(�HEXE��MR�������XLI�magnitude of inequality in Mexico was slightly greater than it was at the beginning of the 1980s.4
The recent reduction in inequality in Mexico has been attributed to three main factors: remittances received by low-income Mexican homes (mainly in rural areas); greater focalization of some governmental social programs (particularly Prospera, formerly called Progresa or Oportunidades); and lower wage income inequality.5�
While improved income distribution among households that participate in the National Survey on Household Income and Expenditure (ENIGHs - Encuesta Nacional de Ingresos y Gastos de los Hogares, in Spanish) is undeniable, to the extent that the surveys upon which these estimates are based fail to correctly register personal income at the highest end of income distribution, these �KYVIW�[MPP�RSX�EGGYVEXIP]�VI�IGX�XLI�XVYI�WXEXI�SJ�XSXEP�MRGSQI�HMWXVMFYXMSR�MR�1I\MGS�6�
%RSXLIV�TVSFPIQ�[MXL�XLIWI��KYVIW�PMIW�MR�XLI�JEGX�XLEX�XLI�HIGVIEWMRK�XIRHIRG]�SJ�MRIUYEPMX]�HSIW�not appear to be compatible with other well-known facets of the Mexican economy. In particular, two dichotomous events have coincided in the past two decades: an increase in per capita income and stagnation of the country’s poverty rates. This can only be explained if income growth is concentrated at the higher end of income distribution, a situation that is incompatible with a reduction in the economic dimension of inequality.
Thus, these discrepancies have given way to numerous demands for access to alternative sources of information to have greater clarity about what really happens at the highest levels SJ�MRGSQI�HMWXVMFYXMSR�MR�SYV�GSYRXV]��+MZIR�XLI�PEGO�SJ�SJ�GMEP�MRJSVQEXMSR�SR�XLMW�QEXXIV��SXLIV�paths have been sought: in other words, tax returns. In this way, in an indirect manner, using statistical methods, estimates are obtained regarding what could happen within this swath of the population—that is otherwise unobserved—in Mexico.7 This information is particularly important for the purpose of this study: without a doubt, it is most relevant as a measure of the degree of economic and political capture of the elites in this country. Campos, Esquivel and Chávez have projected such estimates (2014, 2015) and below, we present two of their results.
The true size and evolution of the highest income decile in MexicoCampos, Esquivel and Chávez (2015) have reestimated income corresponding to the highest income decile in Mexico for the period 1992-2002. The estimation method includes measures to correct the increasingly high discrepancies between the data from household surveys and from the National Accounts. This difference should be reassigned throughout income distribution. For this purpose,
4 See Esquivel (2011) and OECD (2014), respectively. Campos, Esquivel and Lustig (2014) analyse the rise and fall of inequality in Mexico.5 See Esquivel (2011) and Esquivel, Lustig and Scott (2012).6 See Alvaredo (2010), Székely and Hilbert (1999) and, in general terms, Piketty (2014). 7�%RSXLIV�TSWWMFMPMX]�MW�XS�SFXEMR��WGEP�HEXE��,S[IZIV��XLMW�STXMSR�MW�RSX�]IX�TSWWMFPI�MR�1I\MGS�WMRGI�XE\�EYXLSVMXMIW�LEZI�VIJYWIH�XS�QEOI�this information public.
EXTREME INEQUALITY IN MEXICO
CONCENTRATION OF ECONOMIC AND POLITICAL POWER
14
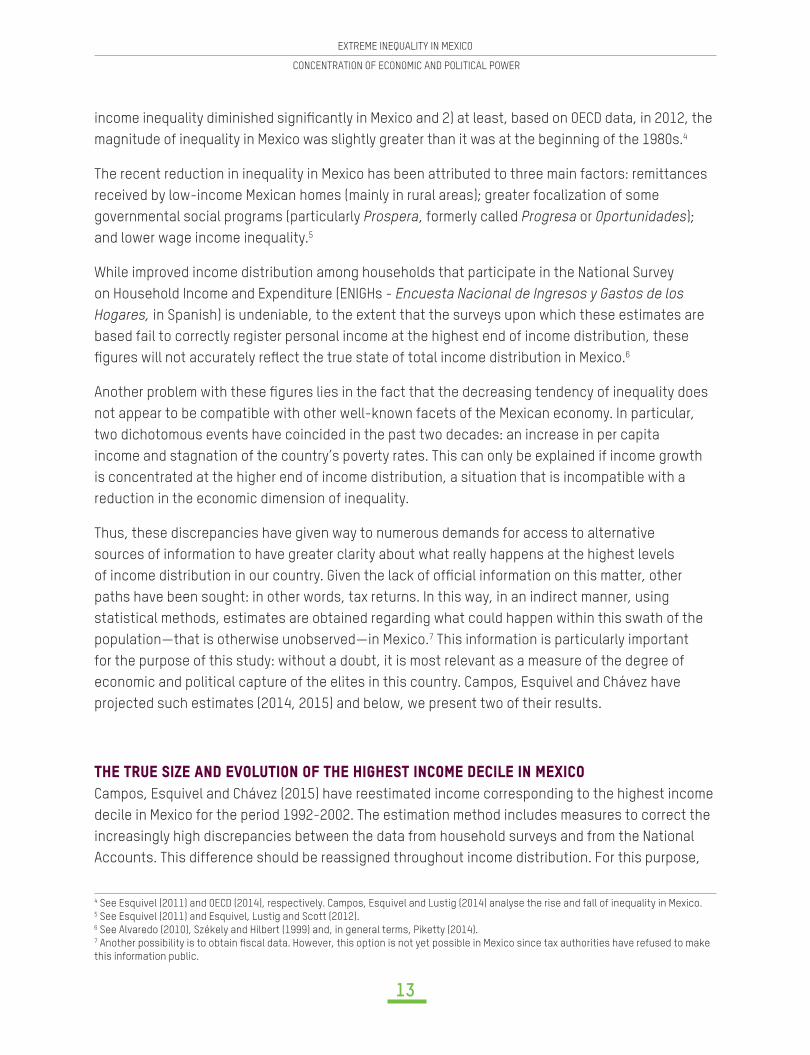
some reasonable suspects are needed. In particular, the authors use countries where income and HMWXVMFYXMSR�EVI�VIPEXMZIP]�WMQMPEV�ERH�JSV�[LMGL�MRJSVQEXMSR�JVSQ�FSXL�LSYWILSPH�WYVZI]W�ERH��WGEP�data is available such as Chile, Colombia and Uruguay.8 An essential objective of this procedure was to obtain a more realistic estimate of income distribution, rather than the one provided by household income surveys. Chart 2 shows the data obtained.
The results are as interesting as they are revealing. Not only is the percentage of income that corresponds to the highest decile much higher—around 60% versus an unadjusted participation close to 45%—but the tendency is exactly the contrary to the results obtained from the original data.9 The percentage increases rather than diminishing. In fact, the size of the adjustment to this tendency is of the same magnitude, although in the opposite direction: while income participation of the highest decile fell 7.3 percentage points between 1992 and 2012 using the original data, with the middle adjustment in the same period, the increase in this percentage is 7.7 percentage points (5.9 in the case of the inferior adjustment and 9.5 with the superior one).
8 This data is used to estimate what part of the discrepancy should be assigned to the highest decile in order to reproduce the distribu-XMSR�SFXEMRIH�JVSQ��WGEP�HEXE��8LI�EZIVEKI�SJ�XLIWI�XLVII�GSYRXVMIW�MW�����[LMGL�MW�E�VIJIVIRGI�TSMRX�XLEX�[I�GEPP�E�sQMHHPI�EHNYWXQIRX�t�Two other adjustments are calculated around this percentage: one in which only 78% of the discrepancy is assigned to the highest decile (inferior adjustment) and another that assigns up to 88% (superior adjustment).9 This result is similar to the one that Medeiros et al. (2014) found in the case of Brazil. The difference is that in that case, the comparison [EW�QEHI�FIX[IIR�LSYWILSPH�WYVZI]W�ERH��WGEP�HEXE��[LIVIEW�LIVI�XLMW�MW�WYVZI]�HEXE�ZIVWYW�HEXE�EHNYWXIH�YWMRK�E�WXEXMWXMGEP�QIXLSH�XLEX�VIGSRGMPIW�XLSWI��KYVIW�[MXL�2EXMSREP�%GGSYRXW�
Income Corresponding to the Highest Decile: ENIGH vs. Adjusted Data, 1992-2012
(Percentage of national income)
20.0
25.0
30.0
35.0
40.0
45.0
50.0
55.0
60.0
65.0
1992 1994 1996 1998 2000 2002 2004 2006 2008 2010 2012
ENIGH Superior adjustment Middle adjustment Inferior adjustment
EXTREME INEQUALITY IN MEXICO
CONCENTRATION OF ECONOMIC AND POLITICAL POWER
15
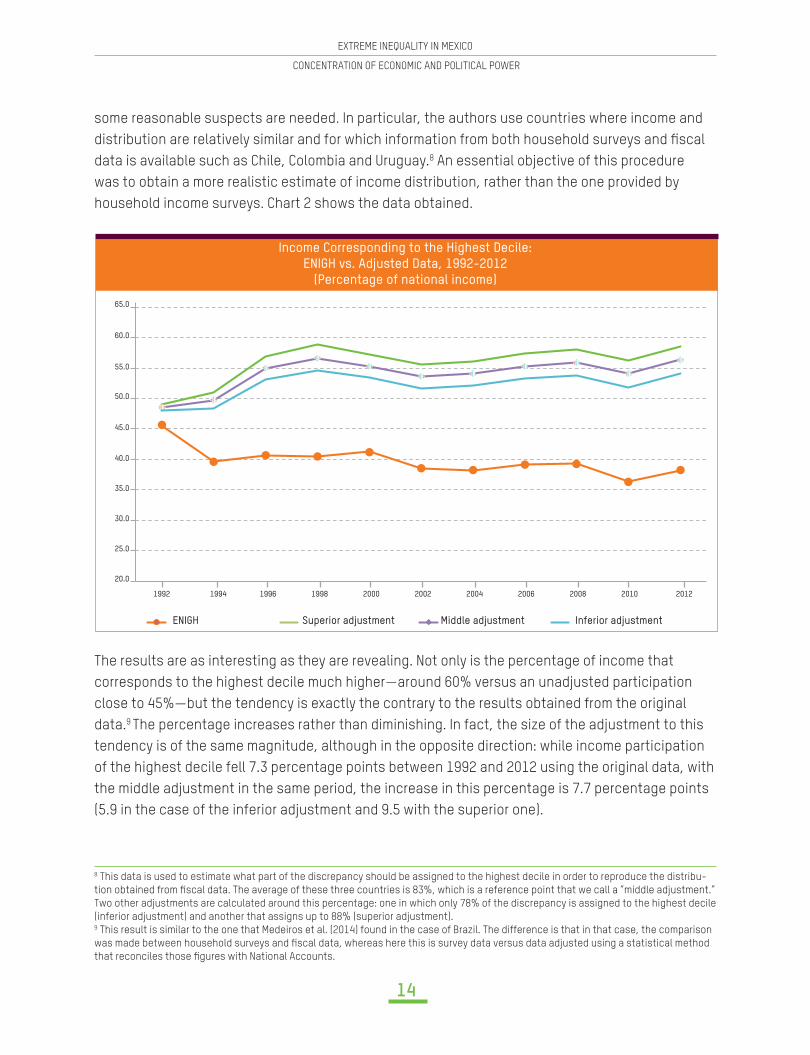
8œŔ���œŊ�ŘŌʼn�ŌōŋŌʼnŗŘ�ōŒŇœőʼn The other relevant result obtained using similar methodology is reported by Campos, Esquivel and Chávez (2014). Their work, for the year 2012, shows an initial estimate of the percentage of total income corresponding to the 1% of the population with the highest income in Mexico. This result is shown in Chart 3 together with data from other countries. The information from other countries comes from reported tax returns. Once again, the data reveals within this sample, that Mexico is the country where 1% of the wealthiest individuals have a greater percentage of total income (21%). -R�SXLIV�GSYRXVMIW��XLMW�TIVGIRXEKI��YGXYEXIW�EX�ER�EZIVEKI�GPSWI�XS�����3RGI�QSVI��XLI�I\IVGMWI�reveals—or at least suggests—the serious degree of income concentration in the country.
Distribution of wealth in Mexico)ZIV]XLMRK�[I�LEZI�EREP]WIH�XLYW�JEV�SRP]�GSVVIWTSRHW�XS�MRGSQI�HMWXVMFYXMSR��FIGEYWI�RS�SJ�GMEP�HEXE�I\MWXW�EFSYX�[IEPXL�MR�1I\MGS��EPXLSYKL�[I�HS�LEZI�WSQI�YRSJ�GMEP�IWXMQEXIW��8LI�Global Wealth Report 2014 from Credit Suisse (2014), for example, points out that wealthiest 10% of people in Mexico concentrate 64.4% of the country’s total wealth.10 This percentage is close to the average �KYVI�JSV�XLI�KVSYT�SJ�GSYRXVMIW�MRGPYHIH�MR�XLMW�VITSVX��EPXLSYKL�MX�MW�WPMKLXP]�LMKLIV�XLER�XLI�
10�;IEPXL�MW�QIEWYVIH�EW�XLI�ZEPYI�SJ�XLI�WYQ�SJ��RERGMEP�ERH�RSR��RERGMEP�EWWIXW�QMRYW�XLI�ZEPYI�SJ�HIFX��8LMW�HI�RMXMSR�HSIW�RSX�include human capital.
Participation of the top 1% as a share of total income(Different years, for Mexico estimates for 2012)
ChinaDenmarkSweden
MauritiusNew Zealand
NorwayFrance
SpainIndia
AutraliaItaly
JapanPortugal
SwiterlandIreland
GermanySingapore
CanadaUnited Kingdom
ArgentinaSouth Africa
United StatesColombia
Mexico
0% 5% 10% 15% 20% 25%
EXTREME INEQUALITY IN MEXICO
CONCENTRATION OF ECONOMIC AND POLITICAL POWER
16
TIVGIRXEKI�SJ�MRGSQI�XLEX�GSVVIWTSRHW�XS�XLI�WEQI�TSTYPEXMSR��FSXL�MR�XIVQW�SJ�XLI�SVMKMREP��KYVIW�from the household survey, as well as from the adjusted data.
On the other hand, a report by WealthInsight (2013) reveals that there were 145,000 individuals in Mexico with net worth higher than one million dollars (without including the value of their habitual residence). Their combined wealth reaches a total of $736 billion dollars. These millionaires—who represent at least 1% of the total population—concentrated approximately 43% of the country’s total wealth this year. This WealthInsight report indicates that the wealth of these millionaires greatly exceeds the average wealth corresponding to millionaires in other countries, who barely concentrate 29% of resources in their respective countries. The report also indicates that the number of millionaires in Mexico grew by 32% between 2007 and 2012; this tendency shows a clear contrast, in black and white, to the reduction of 0.3% at a global level in this same period.
EXTREME INEQUALITY IN MEXICO
CONCENTRATION OF ECONOMIC AND POLITICAL POWER
17
Gene
ral v
iew
of S
anta
Fe.
To
the
left
is t
he e
ntra
nce
to t
he S
anta
Fe
Mal
l
II. The vicious cycle of inequality and economic and political capture
The rise of Mexican multimillionairesContrary to popular belief, the overall number of Mexican multimillionaires has not grown WMKRM�GERXP]�MR�VIGIRX�]IEVW�11�-R�������EGGSVHMRK�XS�XLI��VWX�PMWX�TYFPMWLIH�F]�*SVFIW��EX�XLEX�XMQI�XLIVI�[IVI����1I\MGERW�[MXL�JSVXYRIW�SZIV�SRI�FMPPMSR�HSPPEVW��*VSQ������XS�����rXLI��VWX�HIGEHI�of this well-known publication—the average number of Mexican multimillionaires was 11 each year. Based on 2014 data, there are currently 16 Mexicans in this category, just one more than two HIGEHIW�EKS��;LEX�LEW�GLERKIH��MR�JEGX�UYMXI�WMKRM�GERXP]��MW�XLI�MQTSVXERGI�ERH�QEKRMXYHI�SJ�the wealth of our multimillionaires. While in 1996, the fortunes of these 15 individuals were equal to $25.6 billion dollars, the wealth of the 16 wealthiest Mexicans in 2014 was equivalent to $142.9 billion dollars. What does this mean? Between 1996 and 2014, the average fortune of every member of this select group of Mexicans grew from $1.7 billion to $8.9 billion dollars. Even if you deduct
11 Here we refer to individuals with wealth of more than one billion dollars. This should not be confused with millionaires (individuals with wealth greater than one million dollars) as previously mentioned.
EXTREME INEQUALITY IN MEXICO
CONCENTRATION OF ECONOMIC AND POLITICAL POWER
18
Wealth of the Four Main Mexican Multimillionaires as a Percentage of GDP
9
8
7
6
5
4
3
2
1
0
1996 1997 1998 1999 2000 2001 2002 2003 2004 2005 2006 2007 2008 2009 2010 2011 2012 2013 2014 2015
The four main Mexican multimillionaires
Carlos Slim
Larrea + Bailleres + Salinas Pliego
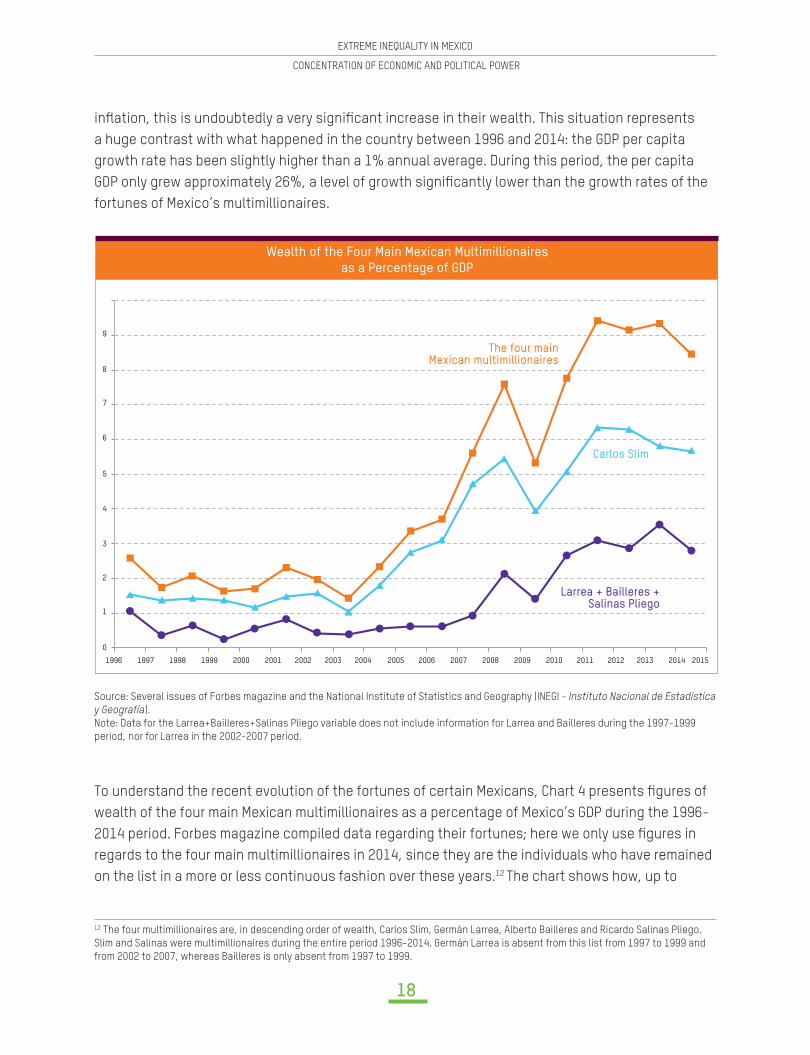
MR�EXMSR��XLMW�MW�YRHSYFXIHP]�E�ZIV]�WMKRM�GERX�MRGVIEWI�MR�XLIMV�[IEPXL��8LMW�WMXYEXMSR�VITVIWIRXW�a huge contrast with what happened in the country between 1996 and 2014: the GDP per capita growth rate has been slightly higher than a 1% annual average. During this period, the per capita +(4�SRP]�KVI[�ETTVS\MQEXIP]�����E�PIZIP�SJ�KVS[XL�WMKRM�GERXP]�PS[IV�XLER�XLI�KVS[XL�VEXIW�SJ�XLI�fortunes of Mexico’s multimillionaires.
8S�YRHIVWXERH�XLI�VIGIRX�IZSPYXMSR�SJ�XLI�JSVXYRIW�SJ�GIVXEMR�1I\MGERW��'LEVX���TVIWIRXW��KYVIW�SJ�wealth of the four main Mexican multimillionaires as a percentage of Mexico’s GDP during the 1996-�����TIVMSH��*SVFIW�QEKE^MRI�GSQTMPIH�HEXE�VIKEVHMRK�XLIMV�JSVXYRIW��LIVI�[I�SRP]�YWI��KYVIW�MR�regards to the four main multimillionaires in 2014, since they are the individuals who have remained on the list in a more or less continuous fashion over these years.12 The chart shows how, up to
12 The four multimillionaires are, in descending order of wealth, Carlos Slim, Germán Larrea, Alberto Bailleres and Ricardo Salinas Pliego. Slim and Salinas were multimillionaires during the entire period 1996-2014. Germán Larrea is absent from this list from 1997 to 1999 and from 2002 to 2007, whereas Bailleres is only absent from 1997 to 1999.
Source: Several issues of Forbes magazine and the National Institute of Statistics and Geography (INEGI - Instituto Nacional de Estadística y Geografía). Note: Data for the Larrea+Bailleres+Salinas Pliego variable does not include information for Larrea and Bailleres during the 1997-1999 period, nor for Larrea in the 2002-2007 period.
EXTREME INEQUALITY IN MEXICO
CONCENTRATION OF ECONOMIC AND POLITICAL POWER
19
2002, this group’s wealth alone represented approximately 2% of Mexico’s GDP. However, starting in 2003, this sum began to rise and in the 2011-2014 period, it reached an average of 9% of GDP, in other words 4.5 times what it represented during the initial years in this same period. Such a WMKRM�GERX�MRGVIEWI�MR�XLI�[IEPXL�SJ�XLIWI�1I\MGERW�MW�RSX�SRP]�HYI�XS�[LEX�LETTIRIH�[MXL�'EVPSW�Slim’s fortune (who, by the way, during this period, moved from number 18 on the global ranking SJ�QYPXMQMPPMSREMVIW�XS�XLI��VWX�X[S�WPSXW�EW�SJ����� ��8LI�WM^I�SJ�LMW�JSVXYRI�KVI[�JVSQ�E�PMXXPI�QSVI�than 1% of GDP to almost 6%. However, the same thing happened with the fortunes of the other three. Their fortunes grew from half of a percentage point of GDP in 2003 to almost 3% in the 2011-2014 period.
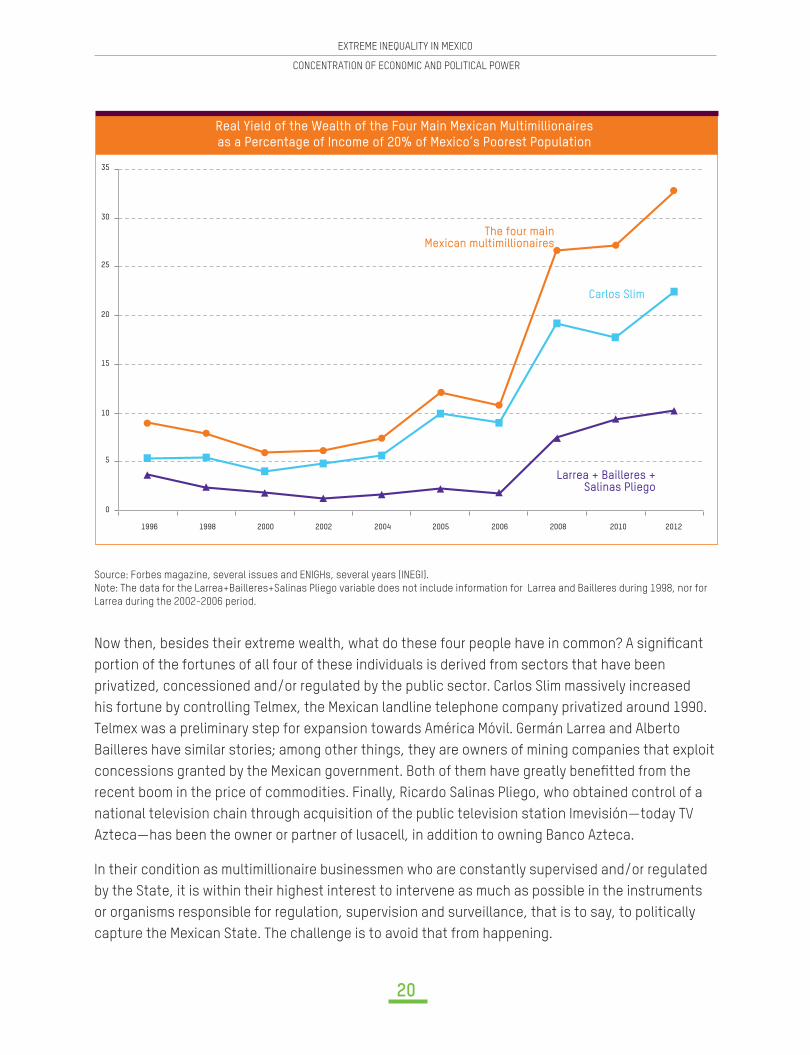
Despite how intriguing this information is, it does not tell us very much about the impact of the rapid increase of the fortunes of some Mexicans in relation to inequality in our country because it does not clearly show the evolution of the income of these multimillionaires compared to the MRGSQI�SJ�WTIGM�G�TSTYPEXMSR�KVSYTW��8LIVIJSVI��XLI�JSPPS[MRK�GLEVX�WLS[W�ER�EPXIVREXMZI�MRHMGEXSV��the real yield of the wealth of the four main Mexican multimillionaires as a percentage of the annual MRGSQI�SJ����SJ�1I\MGSvW�TSSVIWX�LSYWILSPHW��8LMW��KYVI�MW�RSX�SFXEMRIH�SR�ER�ERRYEP�FEWMW��rather every two years, when the National Survey on Household Income and Expenditure (ENIGH) is carried out. However, there is a noteworthy exception between 2004 and 2006, a period during which the survey was applied each year. The real yield of the wealth of these multimillionaires was surmised to be equal to 5%.13
'LEVX���WLS[W�XLMW�MRHMGEXSV�JSV�XLI����]IEVW�JSV�[LMGL�[I�LEZI��KYVIW�XS�QEOI�XLMW�GEPGYPEXMSR��Income from 20% of the poorest households comes directly from the ENIGH data and no adjustment was made for possible underreporting of income, primarily because 1) probably the majority of underreporting occurs within the highest spheres of distribution14 and 2) more than the exact relation between the yield of wealth and the income of the poorest households, what we are most interested in is the tendency.
-R�XLMW�GLEVX��[I�WII�VIPEXMZIP]�WXEFPI�FILEZMSYV�HYVMRK�XLI��VWX�]IEVW�SJ�XLI�TIVMSH�ERH�ER�YTWYVKI�in more recent years. In this case, we can clearly observe how Carlos Slim’s wealth escalated WMKRM�GERXP]�FIKMRRMRK�MR�������-R�XLI�GEWI�SJ�XLI�SXLIV�XLVII�QYPXMQMPPMSREMVIW��XLMW�HSIW�RSX�SGGYV�until after 2006. In any case, the magnitude of the increase in this variable is surprising: while in 2004 it was 8% by 2012 it reached 33%. In other words, currently the real yield of the wealth of 4 Mexicans is approximately one third of the cumulative income of almost 20 million Mexicans. Once again, we see the same story: the income of an extremely small group of the population has no relation whatsoever with that of the largest part of the Mexican population. Moreover, this is also true upon comparing the evolution of the yield of the wealth of these multimillionaires with the income of the smallest part of income distribution in Mexico.
13 This rate is not exaggerated and is even less than the observed rate of real growth of the wealth of four Mexican multimillionaires. It is also below the yields observed in other similar fortunes. See chapter XII of Piketty (2014).14 See Campos, Chávez and Esquivel (2014) for a discussion on this topic.
EXTREME INEQUALITY IN MEXICO
CONCENTRATION OF ECONOMIC AND POLITICAL POWER
20
Real Yield of the Wealth of the Four Main Mexican Multimillionairesas a Percentage of Income of 20% of Mexico’s Poorest Population
The four main Mexican multimillionaires
Carlos Slim
Larrea + Bailleres + Salinas Pliego
1996 1998 2000 2002 2004 2005 2006 2008 2010 2012
0
5
10
15
20
25
30
35
2S[�XLIR��FIWMHIW�XLIMV�I\XVIQI�[IEPXL��[LEX�HS�XLIWI�JSYV�TISTPI�LEZI�MR�GSQQSR#�%�WMKRM�GERX�portion of the fortunes of all four of these individuals is derived from sectors that have been privatized, concessioned and/or regulated by the public sector. Carlos Slim massively increased his fortune by controlling Telmex, the Mexican landline telephone company privatized around 1990. Telmex was a preliminary step for expansion towards América Móvil. Germán Larrea and Alberto Bailleres have similar stories; among other things, they are owners of mining companies that exploit GSRGIWWMSRW�KVERXIH�F]�XLI�1I\MGER�KSZIVRQIRX��&SXL�SJ�XLIQ�LEZI�KVIEXP]�FIRI�XXIH�JVSQ�XLI�recent boom in the price of commodities. Finally, Ricardo Salinas Pliego, who obtained control of a REXMSREP�XIPIZMWMSR�GLEMR�XLVSYKL�EGUYMWMXMSR�SJ�XLI�TYFPMG�XIPIZMWMSR�WXEXMSR�-QIZMWMƍRrXSHE]�8:�Azteca—has been the owner or partner of lusacell, in addition to owning Banco Azteca.
In their condition as multimillionaire businessmen who are constantly supervised and/or regulated by the State, it is within their highest interest to intervene as much as possible in the instruments or organisms responsible for regulation, supervision and surveillance, that is to say, to politically capture the Mexican State. The challenge is to avoid that from happening.
Source: Forbes magazine, several issues and ENIGHs, several years (INEGI). Note: The data for the Larrea+Bailleres+Salinas Pliego variable does not include information for Larrea and Bailleres during 1998, nor for Larrea during the 2002-2006 period.
EXTREME INEQUALITY IN MEXICO
CONCENTRATION OF ECONOMIC AND POLITICAL POWER
21
Privileged sectors The lack of economic competition and a weak regulatory market constitute the ideal scenario for company abuse through certain monopoly or oligopoly power. The case of Carlos Slim is emblematic, a magnate par excellence of Mexican telecommunications. Slim, who gained control of Telmex in 1990, has openly and systematically exploited monopoly power of the national telephone system, as established by this previously state-owned company. For years, the control of the national telephone network allowed him to set very high interconnection rates, compared to his competitors. Not only did he obtain extraordinary income from this process for his company, in addition, he made his competition even less competitive in comparison. This process allowed him to consolidate his position as a telecommunications giant both nationally and internationally, and later, to almost naturally become one of the richest men in the world. But his rise was at the expense of Mexican consumers who, for years, paid higher telephone rates than those that would have been paid in a competitive or appropriately regulated context.
Recently, an OECD study (OECD, 2012) concluded that between 2005 and 2009, monopoly behaviour by Carlos Slim’s telecommunications companies resulted in a loss of wellbeing of more than 129 billion dollars for Mexicans, approximately 1.8% of the annual GDP. According to this study, weak development of telecommunications infrastructure in Mexico was the result of two phenomena: a) the lack of competition and b) high market concentration in the context of an openly dysfunctional legal system. It is evident that the weakness of Mexican institutions worsened already prevailing inequality in the country. The entire Mexican population paid exacerbated rates thanks to the monopoly power of Mr. Slim’s companies.
2S[��PIXvW�PSSO�EX�XLI��IPH�SJ�QMRMRK��8LMW�WIGXSV�LEW�FIIR�WTIGMEPP]�ERH�KVIEXP]�TVMZMPIKIH�MR�Mexico. Mining production is based on the exploitation of mines granted through concessions from the Mexican government. This sector has expanded dramatically in recent years. As a prime example, gold extraction in Mexico during the 2000-2010 period equalled more than double all of the extraction carried out over 300 years of the viceregal age in Mexico (González, 2011). So, taking advantage of the boom of mineral prices at the beginning of this century, accelerated mining exploitation in Mexico permitted rapid accumulation of wealth by dedicated businessmen in this �IPH��MRGPYHMRK�X[S�SJ�XLI�EJSVIQIRXMSRIH�1I\MGER�QYPXMQMPPMSREMVIW��,EZMRK�WEMH�XLEX��TVMZMPIKIW�JSV�XLMW�WIGXSV�EVI�RSX�PMQMXIH�SRP]�XS�MXW�VETMH�I\TERWMSR��-R�SYV�GSYRXV]��QMRMRK�LEW�VIZIPPIH�MR��WGEP�privileges. Until 2013, for example, Mexico was one of the few mining countries where no taxes or royalties were paid for on run-of-mine production. This encouraged accelerated extraction and also disproportionately favoured Mexican mining concessionaires at the expense of depleting the GSYRXV]vW�QMRIVEP�[IEPXL��-R�GPIEV�XIVQW��XLI�IRXMVI�REXMSRvW�REXYVEP�VIWSYVGIW�LEZI�FIRI�XIH�E�handful of individuals.
EXTREME INEQUALITY IN MEXICO
CONCENTRATION OF ECONOMIC AND POLITICAL POWER
22
*ōŗŇŅŐ�ŔœŐōŇŝ�ŘŌŅŘ�ŊŅŚœřŖŗ�ōŒňōŚōňřŅŐŗ�śōŘŌ�ŐŅŖŋʼnŖ�ōŒŇœőʼnŗ��The design and structure of the tax system is one of the aspects of public policy in which XLI�1I\MGER�IGSRSQMG�IPMXI�LEZI�I\IVGMWIH�TVIHSQMRERX�MR�YIRGI��3YV��WGEP�TSPMG]�HSIW�RSX�GSVVIWTSRH�XS�ER�YRIUYEP�IGSRSQ]��MR�[LMGL�XE\�MRWXVYQIRXW�EVI�HIWMKRIH�XS�WMKRM�GERXP]�VIHYGI�MRGSQI�KETW�FIX[IIR�XLI�VMGL�ERH�XLI�TSSV��MR�SXLIV�[SVHW��[I�PEGO�E�TVSKVIWWMZI��WGEP�TSPMG]��8S�the contrary, it seems to be designed in such a way that the redistributive effect turns out to be minimal, if not to say non-existent.
3RI�[E]�XS�ETTVIGMEXI�XLMW�MW��JSV�I\EQTPI��XS�PSSO�EX�XLI�WXVYGXYVI�SJ��WGEP�MRGSQI��;LMPI�XLI�average OECD country obtains 32.5% of all of its income from taxes on goods and services (which includes taxes on consumption and special taxes), Mexico obtains 54% of its income this way.15
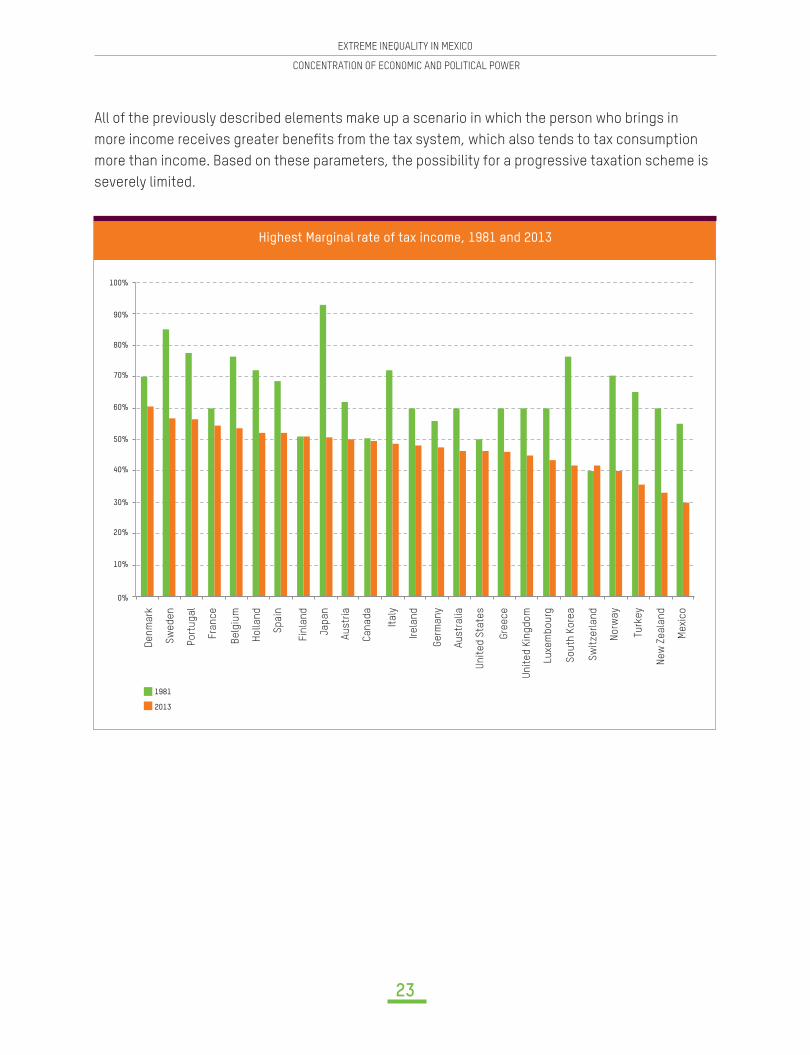
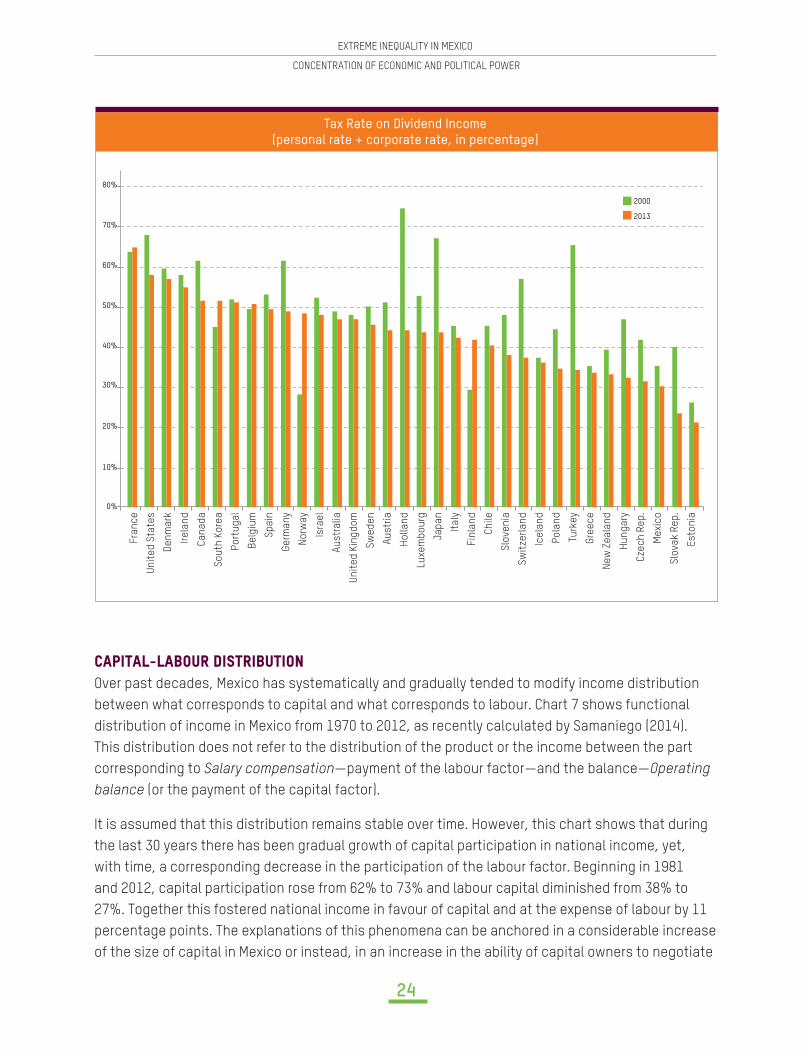
8LMW�MQTPMIW�XLEX��WGEP�WXVYGXYVI�MR�1I\MGS�MW�EMQIH�XS�XE\�GSRWYQTXMSR�QSVI�XLER�TIVWSREP�SV�corporate income. It is well-known that taxes on consumption are regressive in nature because relatively poor households tend to spend a higher percentage of their income than relatively wealthy households. In such an unequal economy like the Mexican economy, the result is that, despite exemptions on some products, poor households can end up paying more taxes than the wealthy ones. Other aspects of the Mexican tax system seem to favour individuals with greater income. An example is the marginal rate of Mexico’s income tax (ISR – Impuesto Sobre la Renta), which is one of the lowest rates among all OECD countries (see Chart 6).16 Even after the increase of 2014—which raised it to 32%—it continues to be lower than the average (50%). Although this rate has tended to fall in almost all OECD member countries (to date the reduction totals approximately 25%), the reduction in Mexico was over 40% between 1981 and 2013.17 Another example is the way in which income is taxed for dividends. The sum of corporate and personal taxes is a total combined rate of 30%. The personal rate is 0%. The combined rate, once again, is far below the OECD’s average (42%). Only rates in Estonia and the Slovak Republic are lower than in Mexico (see Chart 6b).
*MREPP]�ERH�YRXMP�NYWX�VIGIRXP]��XLIVI�[IVI�RS�XE\IW�SR�GETMXEP�TVS�X�JVSQ�XLI�WXSGO�QEVOIX�MR�1I\MGS�and those existing today are subject to numerous exemptions. There are also no inheritance taxes. In several states, (the exception is Mexico City and some tourist zones) there are no vehicle taxes, (tenencia) and the annual property taxes (predial)18 EVI�MRWYJ�GMIRX�
15 OECD (2014), Revenue Statistics, Table 6.16 This chart does not include some Eastern European countries for which 1981 data was unavailable. 17 The other countries where the rate was reduced by more than 40% are Japan, Korea, Norway, Turkey and New Zealand.18 “Tenencia” refers to an annual vehicle property tax. “Predial” is an annual property tax on real estate.
EXTREME INEQUALITY IN MEXICO
CONCENTRATION OF ECONOMIC AND POLITICAL POWER
23
Highest Marginal rate of tax income, 1981 and 2013
0%
10%
20%
2013
1981
30%
40%
50%
60%
70%
80%
90%
100%
Denm
ark
Swed
en
Port
ugal
Fran
ce
Belg
ium
Holla
nd
Spai
n
Finl
and
Japa
n
Aust
ria
Cana
da
Italy
Irela
nd
Germ
any
Aust
ralia
Unit
ed S
tate
s
Gree
ce
Unit
ed K
ingd
om
Luxe
mbo
urg
Sout
h Ko
rea
Swit
zerla
nd
Norw
ay
Turk
ey
New
Zea
land
Mex
ico
All of the previously described elements make up a scenario in which the person who brings in QSVI�MRGSQI�VIGIMZIW�KVIEXIV�FIRI�XW�JVSQ�XLI�XE\�W]WXIQ��[LMGL�EPWS�XIRHW�XS�XE\�GSRWYQTXMSR�more than income. Based on these parameters, the possibility for a progressive taxation scheme is severely limited.
EXTREME INEQUALITY IN MEXICO
CONCENTRATION OF ECONOMIC AND POLITICAL POWER
24
Tax Rate on Dividend Income(personal rate + corporate rate, in percentage)
80%
70%
60%
50%
40%
30%
20%
10%
0%
Fran
ce
Unit
ed S
tate
s
Denm
ark
Irela
nd
Cana
da
Sout
h Ko
rea
Port
ugal
Belg
ium
Spai
n
Germ
any
Norw
ay
Isra
el
Aust
ralia
Unit
ed K
ingd
om
Swed
en
Aust
ria
Holla
nd
Luxe
mbo
urg
Japa
n
Italy
Finl
and
Chile
Slov
enia
Swit
zerla
nd
Icel
and
Pola
nd
Turk
ey
Gree
ce
New
Zea
land
Hung
ary
Czec
h Re
p.
Mex
ico
Slov
ak R
ep.
Esto
nia
2013
2000
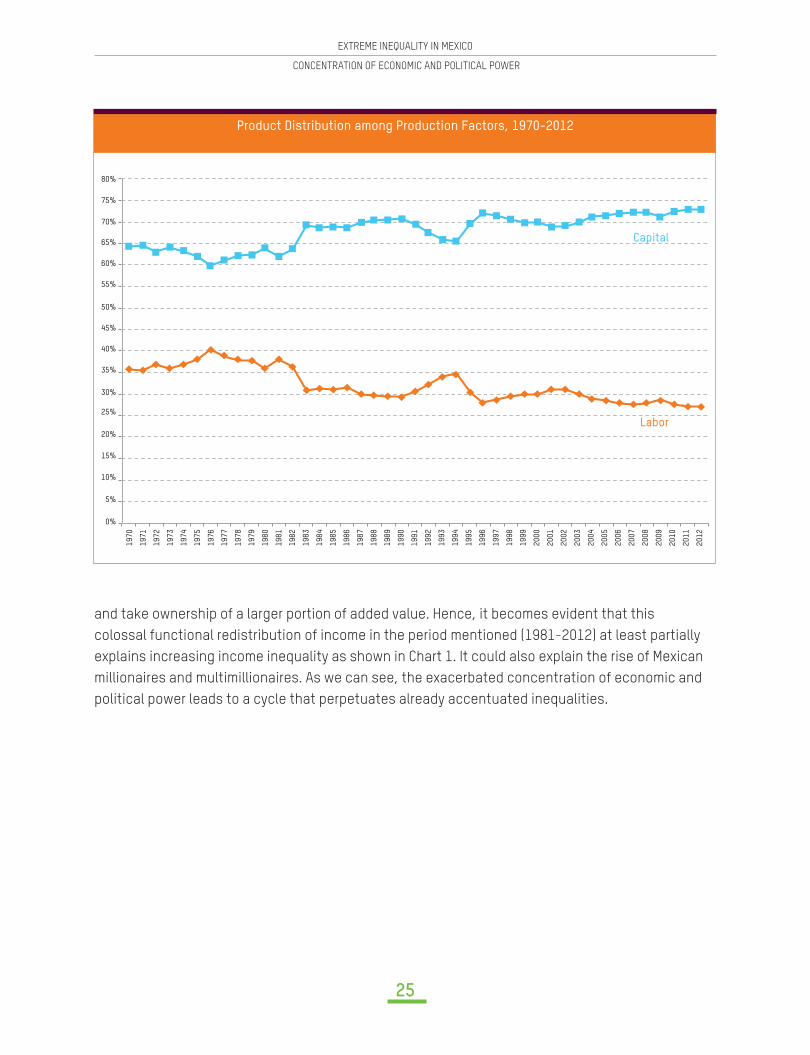
'ŅŔōŘŅŐ�ŐŅņœřŖ�ňōŗŘŖōņřŘōœŒOver past decades, Mexico has systematically and gradually tended to modify income distribution between what corresponds to capital and what corresponds to labour. Chart 7 shows functional distribution of income in Mexico from 1970 to 2012, as recently calculated by Samaniego (2014). This distribution does not refer to the distribution of the product or the income between the part corresponding to Salary compensation—payment of the labour factor—and the balance—Operating balance (or the payment of the capital factor).
It is assumed that this distribution remains stable over time. However, this chart shows that during the last 30 years there has been gradual growth of capital participation in national income, yet, with time, a corresponding decrease in the participation of the labour factor. Beginning in 1981 and 2012, capital participation rose from 62% to 73% and labour capital diminished from 38% to 27%. Together this fostered national income in favour of capital and at the expense of labour by 11 percentage points. The explanations of this phenomena can be anchored in a considerable increase of the size of capital in Mexico or instead, in an increase in the ability of capital owners to negotiate
EXTREME INEQUALITY IN MEXICO
CONCENTRATION OF ECONOMIC AND POLITICAL POWER
25
Product Distribution among Production Factors, 1970-2012
0%
5%
10%
15%
20%
25%
30%
35%
40%
45%
50%
55%
60%
65%
70%
75%
80%
1970
1986
1978
1994
2006
1974
1990
2002
1982
1998
2010
1972
1988
1980
1996
2008
1976
1992
2004
1984
2000
2012
1971
1987
1979
1995
2007
1975
1991
2003
1983
1999
2011
1973
1989
1981
1997
2009
1977
1993
2005
1985
2001
Capital
Labor
and take ownership of a larger portion of added value. Hence, it becomes evident that this colossal functional redistribution of income in the period mentioned (1981-2012) at least partially explains increasing income inequality as shown in Chart 1. It could also explain the rise of Mexican millionaires and multimillionaires. As we can see, the exacerbated concentration of economic and political power leads to a cycle that perpetuates already accentuated inequalities.
EXTREME INEQUALITY IN MEXICO
CONCENTRATION OF ECONOMIC AND POLITICAL POWER
26
%�LS
QIPIWW�TI
VWSR
�[EPOW�SR�)NI���
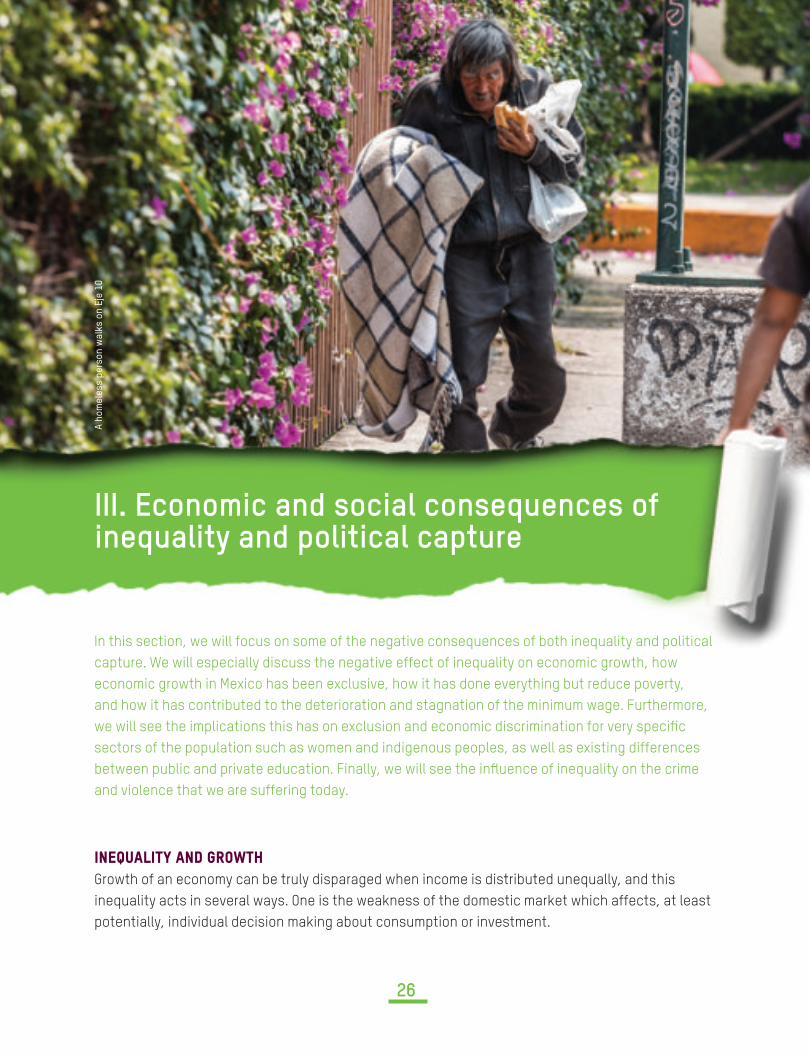
III. Economic and social consequences of inequality and political capture
In this section, we will focus on some of the negative consequences of both inequality and political capture. We will especially discuss the negative effect of inequality on economic growth, how economic growth in Mexico has been exclusive, how it has done everything but reduce poverty, and how it has contributed to the deterioration and stagnation of the minimum wage. Furthermore, [I�[MPP�WII�XLI�MQTPMGEXMSRW�XLMW�LEW�SR�I\GPYWMSR�ERH�IGSRSQMG�HMWGVMQMREXMSR�JSV�ZIV]�WTIGM�G�sectors of the population such as women and indigenous peoples, as well as existing differences FIX[IIR�TYFPMG�ERH�TVMZEXI�IHYGEXMSR��*MREPP]��[I�[MPP�WII�XLI�MR�YIRGI�SJ�MRIUYEPMX]�SR�XLI�GVMQI�and violence that we are suffering today.
-ŒʼnŕřŅŐōŘŝ�ŅŒň�ŋŖœśŘŌGrowth of an economy can be truly disparaged when income is distributed unequally, and this inequality acts in several ways. One is the weakness of the domestic market which affects, at least potentially, individual decision making about consumption or investment.
EXTREME INEQUALITY IN MEXICO
CONCENTRATION OF ECONOMIC AND POLITICAL POWER
27
'ETEGMX]�JSV�MRZIWXQIRX�MR�WQEPP�FYWMRIWWIWrIZIR�LMKLP]�TVS�XEFPI�SRIWrMW�WIVMSYWP]�HMWVYTXIH�F]�ER�IGSRSQ]�XLEX�SJJIVW�ER�MQTIVJIGX��RERGMEP�QEVOIX��MR�[LMGL�XLI�TVMZMPIKI�SJ�WEZMRKW�MW�SRP]�for a minority. Then, decisions to accumulate human capital are disrupted by inequality: to the extent that an important segment of the population cannot allocate resources to this capital, not only is low income perpetuated, but there will also be a serious tendency for this model to be repeated. The lack of investment in physical or human capital not only reduces a key factor of production, it also corrupts allocation: investment in physical or human capital will not necessarily occur for those who have greater business talent or better aptitude for learning, investment will be targeted to those who have resources to make investments. Thus, we are facing a second effect, one derived from poor allocation of resources when they are scarce. Of course, what is at stake is productivity itself.
In theoretical terms, inequality affects growth through other channels. But these channels are based on the supposition that there is such a demand for redistribution that it will open the door to policies that harm investment decisions or, instead, that will create certain political and social MRWXEFMPMX]�XLEX�[MPP�IZIRXYEPP]�MR�YIRGI�MRZIWXQIRX�HIGMWMSRW�
)QTMVMGEP�IZMHIRGI�SR�XLMW�XSTMG�LEW�MRGVIEWIH�WMKRM�GERXP]�EPXLSYKL�VIWYPXW�WXMPP�HS�RSX�SJJIV�necessary clarity. Nevertheless, a recent study by Cingano (2014) is particularly interesting for this work since he carried out an econometric exercise to study the effect of inequality on growth in 3)'(�GSYRXVMIW��'MRKERS�JSYRH�XLVII�TEVXMGYPEVP]�VIPIZERX�VIWYPXW���VWX��XLEX�XLI�MRIUYEPMX]�XLEX�QSWX�affects economic growth is the one occurring on the lower end of the distribution; that is to say inequality that occurs in the income gap between poor people and individuals above that threshold. Second, he found that the most important channel is the low accumulation of human capital by TISTPI�EX�XLI�PS[IWX�TEVX�SJ�XLI�HMWXVMFYXMSR��*MREPP]��LI�WLS[IH�XLEX�JSV�XLI�WTIGM�G�GEWI�SJ�1I\MGS��between 1985 and 2005, the increase in inequality reduced GDP growth by a cumulative amount of 10%. We must mention, of course, that Mexico, together with New Zealand, was the most harmed country by this factor. Beyond theory, the high level of inequality that prevails in Mexico is already FIKMRRMRK��MR�VIEPMX]��XS�WMKRM�GERXP]�PMQMX�TSWWMFMPMXMIW�JSV�MXW�IGSRSQMG�KVS[XL��
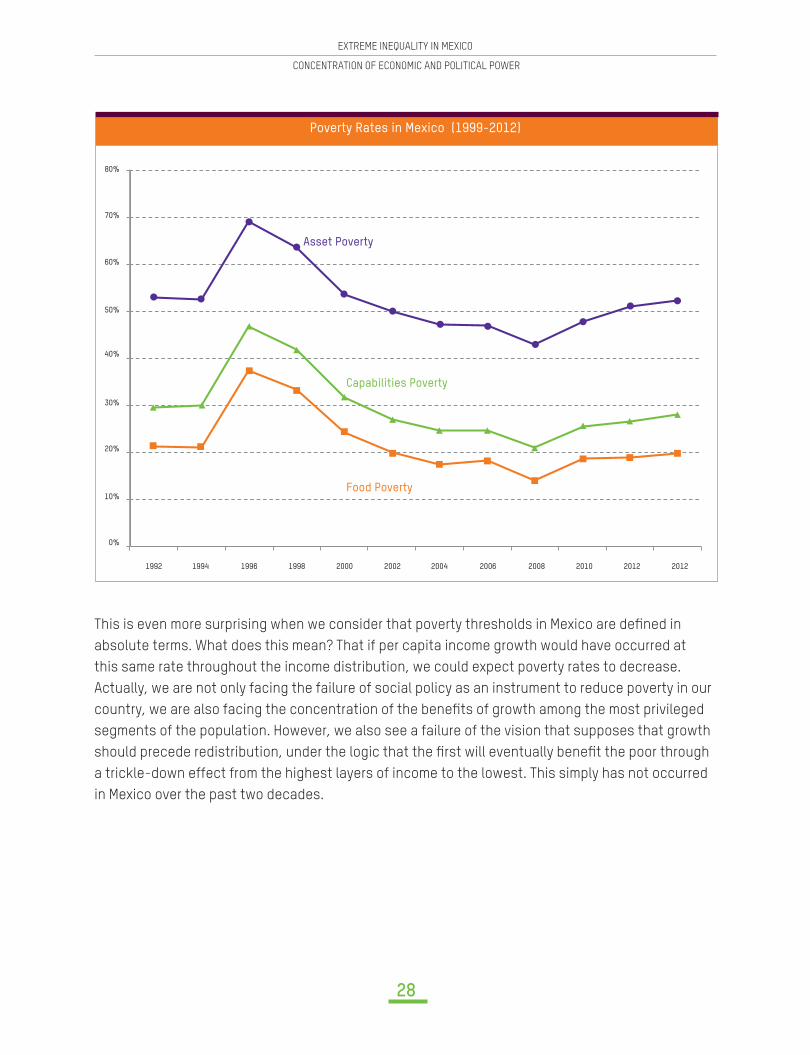
Exclusive economic growthOne of the most unfortunate consequences of the pattern of high inequality and political capture by elites in Mexico is not only that our country has incredibly low rates of economic growth, but that this low growth is also exclusive. This is seen by analysing the marginal relation that exists between per capita income growth and the evolution of poverty rates in our country. We can look EX�E�WTIGM�G�GEWI��FIX[IIR������ERH�������TIV�GETMXE�MRGSQI�KVS[XL�MR�1I\MGS�[EW�����MR�SXLIV�words, the annual growth rate was 1.17%. Meanwhile, the rates of asset poverty, capabilities poverty and food poverty practically remained constant over these two decades (see Chart 8).
EXTREME INEQUALITY IN MEXICO
CONCENTRATION OF ECONOMIC AND POLITICAL POWER
28
Poverty Rates in Mexico (1999-2012)
1992 1994 1996 1998 2000 2002 2004 2006 2008 201220122010
0%
10%
20%
30%
40%
50%
60%
70%
80%
Asset Poverty
Capabilities Poverty
Food Poverty
8LMW�MW�IZIR�QSVI�WYVTVMWMRK�[LIR�[I�GSRWMHIV�XLEX�TSZIVX]�XLVIWLSPHW�MR�1I\MGS�EVI�HI�RIH�MR�absolute terms. What does this mean? That if per capita income growth would have occurred at this same rate throughout the income distribution, we could expect poverty rates to decrease. Actually, we are not only facing the failure of social policy as an instrument to reduce poverty in our GSYRXV]��[I�EVI�EPWS�JEGMRK�XLI�GSRGIRXVEXMSR�SJ�XLI�FIRI�XW�SJ�KVS[XL�EQSRK�XLI�QSWX�TVMZMPIKIH�segments of the population. However, we also see a failure of the vision that supposes that growth WLSYPH�TVIGIHI�VIHMWXVMFYXMSR��YRHIV�XLI�PSKMG�XLEX�XLI��VWX�[MPP�IZIRXYEPP]�FIRI�X�XLI�TSSV�XLVSYKL�a trickle-down effect from the highest layers of income to the lowest. This simply has not occurred in Mexico over the past two decades.
EXTREME INEQUALITY IN MEXICO
CONCENTRATION OF ECONOMIC AND POLITICAL POWER
29
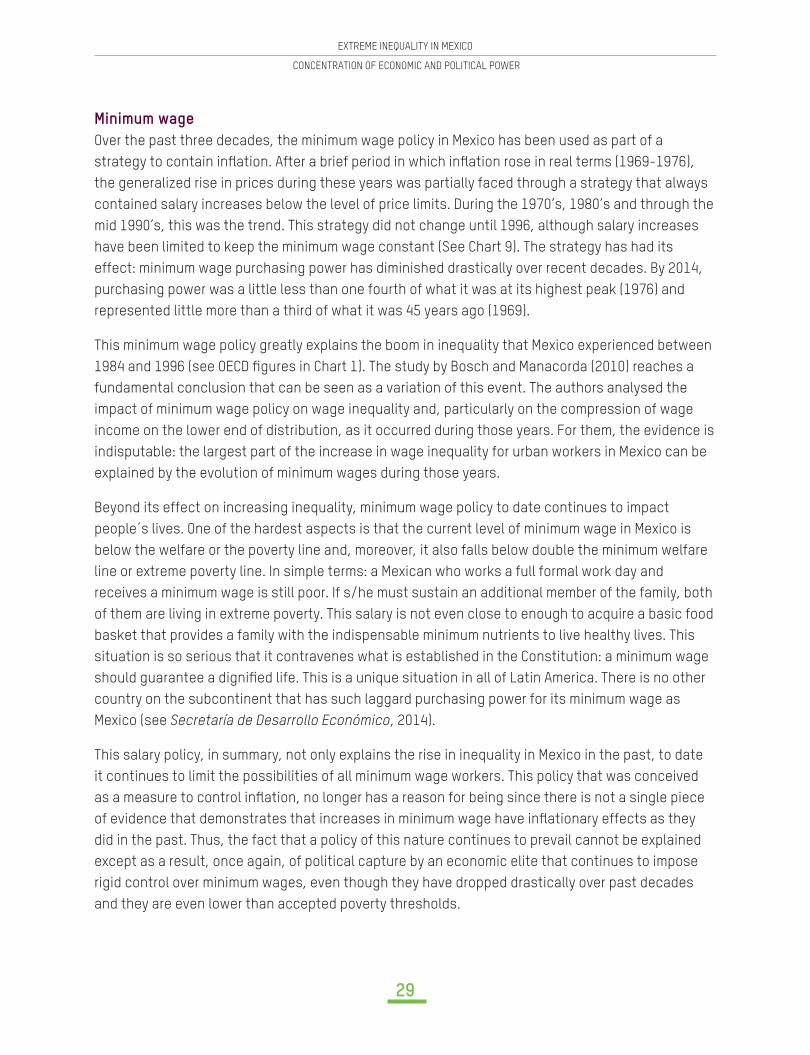
Minimum wageOver the past three decades, the minimum wage policy in Mexico has been used as part of a WXVEXIK]�XS�GSRXEMR�MR�EXMSR��%JXIV�E�FVMIJ�TIVMSH�MR�[LMGL�MR�EXMSR�VSWI�MR�VIEP�XIVQW����������� ��the generalized rise in prices during these years was partially faced through a strategy that always contained salary increases below the level of price limits. During the 1970’s, 1980’s and through the mid 1990’s, this was the trend. This strategy did not change until 1996, although salary increases have been limited to keep the minimum wage constant (See Chart 9). The strategy has had its effect: minimum wage purchasing power has diminished drastically over recent decades. By 2014, purchasing power was a little less than one fourth of what it was at its highest peak (1976) and represented little more than a third of what it was 45 years ago (1969).
This minimum wage policy greatly explains the boom in inequality that Mexico experienced between �����ERH�������WII�3)'(��KYVIW�MR�'LEVX�� ��8LI�WXYH]�F]�&SWGL�ERH�1EREGSVHE������ �VIEGLIW�E�fundamental conclusion that can be seen as a variation of this event. The authors analysed the impact of minimum wage policy on wage inequality and, particularly on the compression of wage income on the lower end of distribution, as it occurred during those years. For them, the evidence is indisputable: the largest part of the increase in wage inequality for urban workers in Mexico can be explained by the evolution of minimum wages during those years.
Beyond its effect on increasing inequality, minimum wage policy to date continues to impact people´s lives. One of the hardest aspects is that the current level of minimum wage in Mexico is below the welfare or the poverty line and, moreover, it also falls below double the minimum welfare line or extreme poverty line. In simple terms: a Mexican who works a full formal work day and receives a minimum wage is still poor. If s/he must sustain an additional member of the family, both of them are living in extreme poverty. This salary is not even close to enough to acquire a basic food basket that provides a family with the indispensable minimum nutrients to live healthy lives. This situation is so serious that it contravenes what is established in the Constitution: a minimum wage WLSYPH�KYEVERXII�E�HMKRM�IH�PMJI��8LMW�MW�E�YRMUYI�WMXYEXMSR�MR�EPP�SJ�0EXMR�%QIVMGE��8LIVI�MW�RS�SXLIV�country on the subcontinent that has such laggard purchasing power for its minimum wage as Mexico (see Secretaría de Desarrollo Económico, 2014).
This salary policy, in summary, not only explains the rise in inequality in Mexico in the past, to date it continues to limit the possibilities of all minimum wage workers. This policy that was conceived EW�E�QIEWYVI�XS�GSRXVSP�MR�EXMSR��RS�PSRKIV�LEW�E�VIEWSR�JSV�FIMRK�WMRGI�XLIVI�MW�RSX�E�WMRKPI�TMIGI�SJ�IZMHIRGI�XLEX�HIQSRWXVEXIW�XLEX�MRGVIEWIW�MR�QMRMQYQ�[EKI�LEZI�MR�EXMSREV]�IJJIGXW�EW�XLI]�did in the past. Thus, the fact that a policy of this nature continues to prevail cannot be explained except as a result, once again, of political capture by an economic elite that continues to impose rigid control over minimum wages, even though they have dropped drastically over past decades and they are even lower than accepted poverty thresholds.
EXTREME INEQUALITY IN MEXICO
CONCENTRATION OF ECONOMIC AND POLITICAL POWER
30
Real Minimum Wage in Mexico, 1969-2014�4IWSW�MR������TIV�[SVO�HE]
1970
1969
1986
1978
1994
2006
1974
1990
2002
1982
1998
2010
1972
1988
1980
1996
2008
1976
1992
2004
1984
2000
2012
2013
2014
1971
1987
1979
1995
2007
1975
1991
2003
1983
1999
2011
1973
1989
1981
1997
2009
1977
1993
2005
1985
2001
0%
50%
100%
150%
200%
250%
EXTREME INEQUALITY IN MEXICO
CONCENTRATION OF ECONOMIC AND POLITICAL POWER
31
1MRMQYQ�;EKI�;SVOIVW�XLEX�GSYPH�FI�,MVIH�F]�XLI�*SYV�1EMR�1I\MGER�1MPPMSREMVMIWwith the Real Yield of their Wealth (5%)
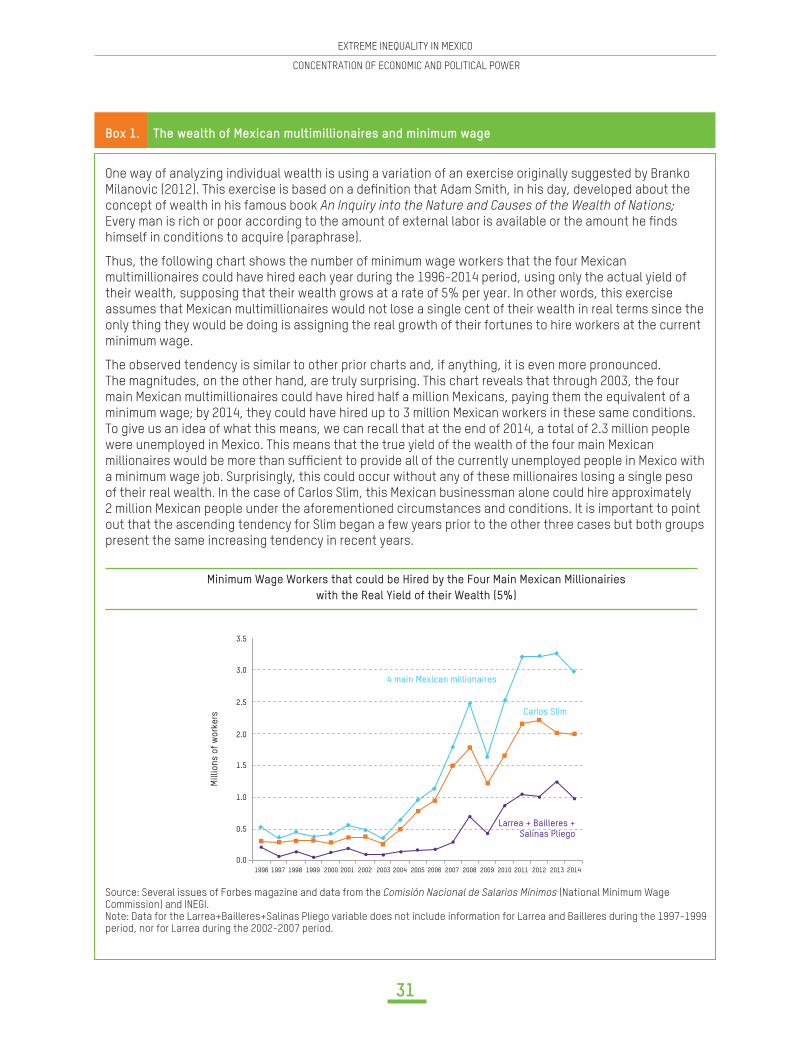
Box 1. The wealth of Mexican multimillionaires and minimum wage
One way of analyzing individual wealth is using a variation of an exercise originally suggested by Branko 1MPERSZMG������ ��8LMW�I\IVGMWI�MW�FEWIH�SR�E�HI�RMXMSR�XLEX�%HEQ�7QMXL��MR�LMW�HE]��HIZIPSTIH�EFSYX�XLI�concept of wealth in his famous book An Inquiry into the Nature and Causes of the Wealth of Nations; )ZIV]�QER�MW�VMGL�SV�TSSV�EGGSVHMRK�XS�XLI�EQSYRX�SJ�I\XIVREP�PEFSV�MW�EZEMPEFPI�SV�XLI�EQSYRX�LI��RHW�himself in conditions to acquire (paraphrase).
Thus, the following chart shows the number of minimum wage workers that the four Mexican multimillionaires could have hired each year during the 1996-2014 period, using only the actual yield of their wealth, supposing that their wealth grows at a rate of 5% per year. In other words, this exercise assumes that Mexican multimillionaires would not lose a single cent of their wealth in real terms since the only thing they would be doing is assigning the real growth of their fortunes to hire workers at the current minimum wage.
The observed tendency is similar to other prior charts and, if anything, it is even more pronounced. The magnitudes, on the other hand, are truly surprising. This chart reveals that through 2003, the four main Mexican multimillionaires could have hired half a million Mexicans, paying them the equivalent of a minimum wage; by 2014, they could have hired up to 3 million Mexican workers in these same conditions. To give us an idea of what this means, we can recall that at the end of 2014, a total of 2.3 million people were unemployed in Mexico. This means that the true yield of the wealth of the four main Mexican QMPPMSREMVIW�[SYPH�FI�QSVI�XLER�WYJ�GMIRX�XS�TVSZMHI�EPP�SJ�XLI�GYVVIRXP]�YRIQTPS]IH�TISTPI�MR�1I\MGS�[MXL�a minimum wage job. Surprisingly, this could occur without any of these millionaires losing a single peso of their real wealth. In the case of Carlos Slim, this Mexican businessman alone could hire approximately 2 million Mexican people under the aforementioned circumstances and conditions. It is important to point out that the ascending tendency for Slim began a few years prior to the other three cases but both groups present the same increasing tendency in recent years.
Source: Several issues of Forbes magazine and data from the Comisión Nacional de Salarios Mínimos (National Minimum Wage Commission) and INEGI.Note: Data for the Larrea+Bailleres+Salinas Pliego variable does not include information for Larrea and Bailleres during the 1997-1999 period, nor for Larrea during the 2002-2007 period.
0.0
0.5
1.0
1.5
2.0
2.5
3.0
3.5
2014201320122011201020092008200720062005200420032002200120001999199819971996
4 main Mexican millionaires
Carlos Slim
1MPPMSRW�SJ�[
SVOIVW
Larrea + Bailleres + Salinas Pliego
EXTREME INEQUALITY IN MEXICO
CONCENTRATION OF ECONOMIC AND POLITICAL POWER
32
Distribution of the Population According to their Situation of Multidimensional Poverty in 2012
Indigenous PERKYEKI�WTIEOIVW
Non-poor and non-vulnerable
Need Vulnerable
Income Vulnerable
Moderately Poor
Extremely Poor
Total Population
100%
90%
80%
70%
60%
50%
40%
30%
20%
10%
0%
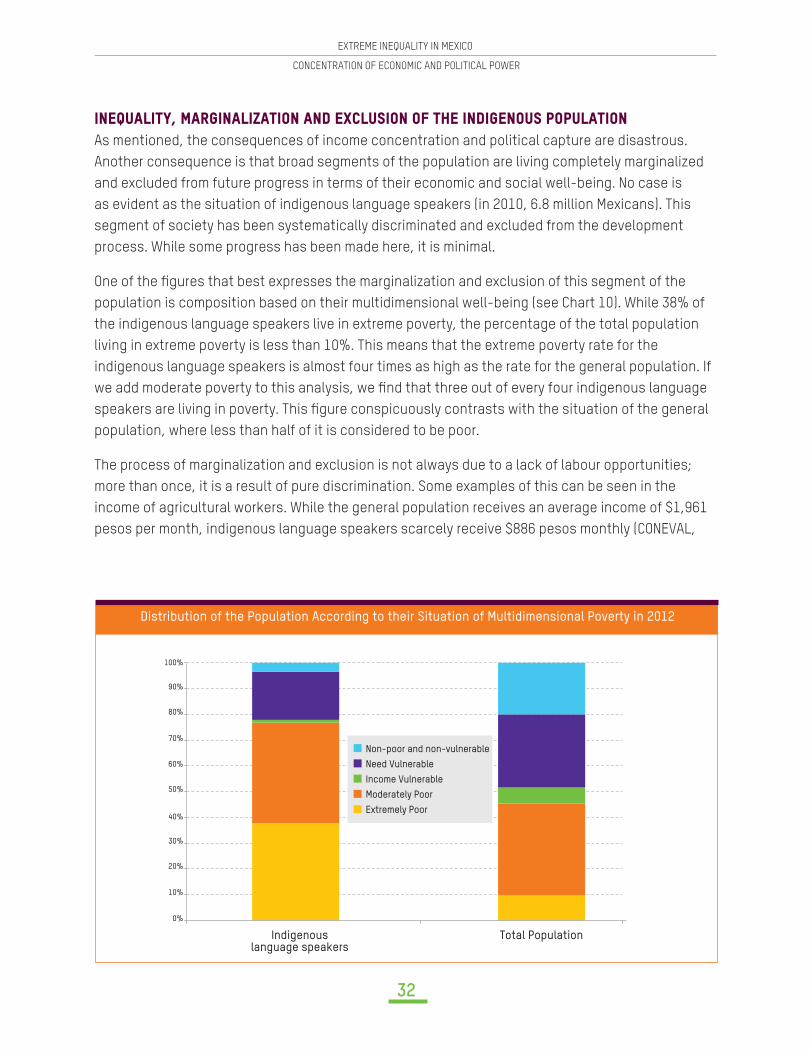
-ŒʼnŕřŅŐōŘŝ��1ŅŖŋōŒŅŐōŞŅŘōœŒ�ŅŒň�)ŜŇŐřŗōœŒ�œŊ�ŘŌʼn�-ŒňōŋʼnŒœřŗ�4œŔřŐŅŘōœŒAs mentioned, the consequences of income concentration and political capture are disastrous. Another consequence is that broad segments of the population are living completely marginalized and excluded from future progress in terms of their economic and social well-being. No case is as evident as the situation of indigenous language speakers (in 2010, 6.8 million Mexicans). This segment of society has been systematically discriminated and excluded from the development process. While some progress has been made here, it is minimal.
3RI�SJ�XLI��KYVIW�XLEX�FIWX�I\TVIWWIW�XLI�QEVKMREPM^EXMSR�ERH�I\GPYWMSR�SJ�XLMW�WIKQIRX�SJ�XLI�population is composition based on their multidimensional well-being (see Chart 10). While 38% of the indigenous language speakers live in extreme poverty, the percentage of the total population living in extreme poverty is less than 10%. This means that the extreme poverty rate for the indigenous language speakers is almost four times as high as the rate for the general population. If [I�EHH�QSHIVEXI�TSZIVX]�XS�XLMW�EREP]WMW��[I��RH�XLEX�XLVII�SYX�SJ�IZIV]�JSYV�MRHMKIRSYW�PERKYEKI�WTIEOIVW�EVI�PMZMRK�MR�TSZIVX]��8LMW��KYVI�GSRWTMGYSYWP]�GSRXVEWXW�[MXL�XLI�WMXYEXMSR�SJ�XLI�KIRIVEP�population, where less than half of it is considered to be poor.
The process of marginalization and exclusion is not always due to a lack of labour opportunities; more than once, it is a result of pure discrimination. Some examples of this can be seen in the income of agricultural workers. While the general population receives an average income of $1,961 TIWSW�TIV�QSRXL��MRHMKIRSYW�PERKYEKI�WTIEOIVW�WGEVGIP]�VIGIMZI������TIWSW�QSRXLP]��'32):%0��
EXTREME INEQUALITY IN MEXICO
CONCENTRATION OF ECONOMIC AND POLITICAL POWER
33
Box 2. Gender Inequality
Gender inequality in Mexico has yet to be mentioned in this document. Of course, this omission is not because the topic lacks relevance. In fact, this is one of the country’s most noteworthy inequalities that continue to burden and delay progress in the country. This problem is so serious that it requires an ad hoc WXYH]�ERH�VIGSQQIRHEXMSRW��&IPS[��[I�TVSZMHI�WSQI��KYVIW�XLEX�LMKLPMKLX�XLI�MQTSVXERGI�SJ�XLMW�XSTMG�
According to the Global Gender Gap 2014, Mexico is 80th among 142 countries in regards to gender dispar-ities. The category in which Mexico demonstrates one of its worst behaviours is precisely in reference to women’s participation and economic opportunities, for which it was barely ranked 120. Within this catego-ry, Mexico received its worst results in regards to labour force participation (118th place), wage equality for similar work (survey results, 116th place) and estimated earned income (114th).
In terms of labour force participation, 48% of women are actively engaged in the work force, compared to 83% of men. In regards to wage equality, this category is based on perception of people interviewed in response to the following question, “In your country, for similar work, to what extent are wages for women equal to those of men?” To estimate income, the report draws from methodology developed by the United Nations used for the Human Development Index. This estimate combines information regarding non-agri-cultural wages for men and women, as well as the respective rate of participation. In the case of Mexico, women’s income was scarcely 46% of men’s income. Note that this gap has two components: one that is strictly related to wages and the other attributable to the differential rate of participation.
-R�KIRIVEP�� XLIWI�VIWYPXW�EVI�GSR�VQIH�F]�WXYHMIW��*SV�I\EQTPI��E�')4%0�VITSVX� ����� �SR�s(IGIRX�;SVO�and Gender Equality” indicates that average monthly work income for women in Mexico in relation to men’s MRGSQI��YGXYEXIW�JVSQ������JSV�TISTPI�SZIV�XLI�EKI�SJ�����XS������JSV�TISTPI�FIX[IIR����ERH����]IEVW�of age. Although this would suggest lower wage inequality for younger people, the differences are still very noteworthy.
Likewise, a study by the National Institute of Statistics and Geography (INEGI, 2014) reveals that the level SJ�[EKI�HMWGVMQMREXMSR�JSV�[SQIR�MR�1I\MGS��YGXYEXIW�WMKRM�GERXP]�HITIRHMRK�SR�XLI�OMRH�SJ�IQTPS]QIRX��For example, wages for women employed in industrial activities or transport operators are 30% and 24% lower than men’s wages, respectively. Whereas for economic activities such as merchants, professionals, GMZMP�WIVZERXW�SV�SJ�GI�[SVOIVW��XLI�KET�SWGMPPEXIW�FIX[IIR����ERH�����0EWXP]��JSV�EKVMGYPXYVEP�EGXMZMXMIW��protection/security or education workers, there does not appear to be any wage gap between men and women. In the case of personal care services, the gap favours women by approximately 9%.
Finally, a recent study by Arceo and Campos (2014) estimated the gender pay gap based on economic cen-sus information from 1990 and 2010. According to their results, the wage gap in Mexico in 2010 between men and women was 26%.
2014). Many of these workers are daily farm workers, who do not own their own land and who must travel or walk long distances. These workers tend to live and work in very disadvantageous situations.
EXTREME INEQUALITY IN MEXICO
CONCENTRATION OF ECONOMIC AND POLITICAL POWER
34
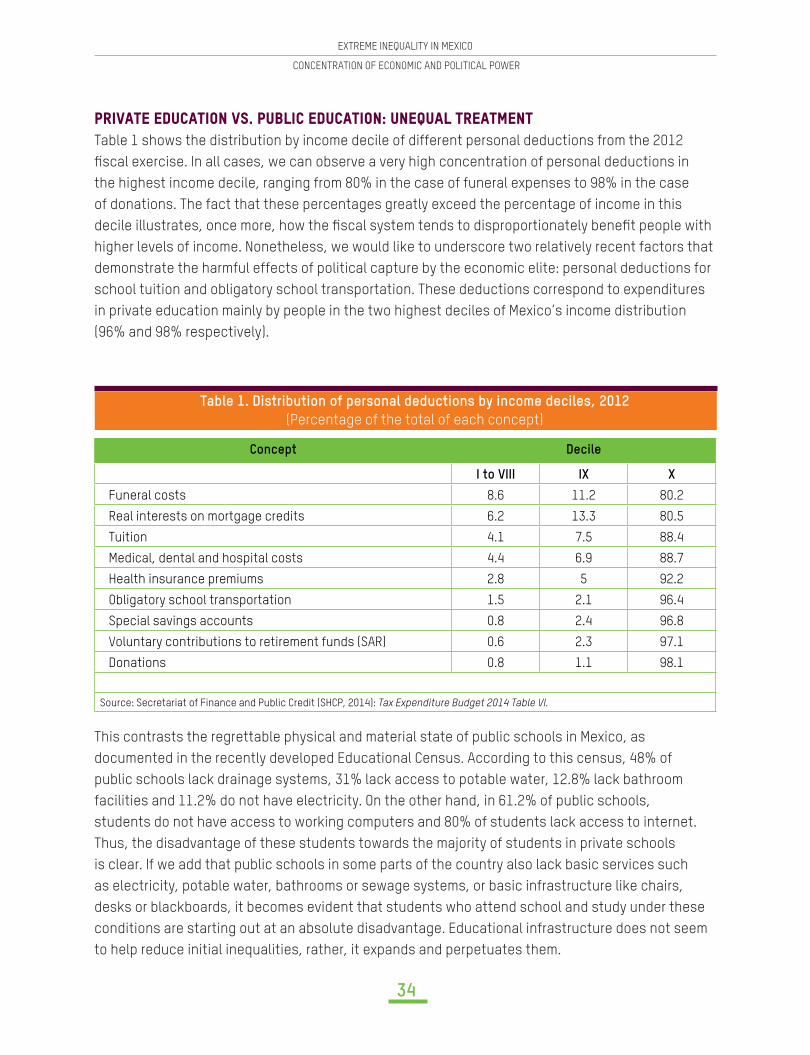
4ŖōŚŅŘʼn�ʼnňřŇŅŘōœŒ�Śŗ��ŔřņŐōŇ�ʼnňřŇŅŘōœŒ��9ŒʼnŕřŅŐ�ŘŖʼnŅŘőʼnŒŘTable 1 shows the distribution by income decile of different personal deductions from the 2012 �WGEP�I\IVGMWI��-R�EPP�GEWIW��[I�GER�SFWIVZI�E�ZIV]�LMKL�GSRGIRXVEXMSR�SJ�TIVWSREP�HIHYGXMSRW�MR�the highest income decile, ranging from 80% in the case of funeral expenses to 98% in the case of donations. The fact that these percentages greatly exceed the percentage of income in this HIGMPI�MPPYWXVEXIW��SRGI�QSVI��LS[�XLI��WGEP�W]WXIQ�XIRHW�XS�HMWTVSTSVXMSREXIP]�FIRI�X�TISTPI�[MXL�higher levels of income. Nonetheless, we would like to underscore two relatively recent factors that demonstrate the harmful effects of political capture by the economic elite: personal deductions for school tuition and obligatory school transportation. These deductions correspond to expenditures in private education mainly by people in the two highest deciles of Mexico’s income distribution (96% and 98% respectively).
Table 1. Distribution of personal deductions by income deciles, 2012 (Percentage of the total of each concept)
Concept Decile
I to VIII IX X
Funeral costs 8.6 11.2 80.2
Real interests on mortgage credits 6.2 13.3 80.5
Tuition 4.1 7.5 88.4
Medical, dental and hospital costs 4.4 6.9 88.7
Health insurance premiums 2.8 5 92.2
Obligatory school transportation 1.5 2.1 96.4
Special savings accounts 0.8 2.4 96.8
���:SPYRXEV]�GSRXVMFYXMSRW�XS�VIXMVIQIRX�JYRHW��7%6 0.6 2.3 97.1
Donations 0.8 1.1 98.1
Source: Secretariat of Finance and Public Credit (SHCP, 2014): Tax Expenditure Budget 2014 Table VI.
This contrasts the regrettable physical and material state of public schools in Mexico, as documented in the recently developed Educational Census. According to this census, 48% of public schools lack drainage systems, 31% lack access to potable water, 12.8% lack bathroom facilities and 11.2% do not have electricity. On the other hand, in 61.2% of public schools, students do not have access to working computers and 80% of students lack access to internet. Thus, the disadvantage of these students towards the majority of students in private schools is clear. If we add that public schools in some parts of the country also lack basic services such as electricity, potable water, bathrooms or sewage systems, or basic infrastructure like chairs, desks or blackboards, it becomes evident that students who attend school and study under these conditions are starting out at an absolute disadvantage. Educational infrastructure does not seem to help reduce initial inequalities, rather, it expands and perpetuates them.
EXTREME INEQUALITY IN MEXICO
CONCENTRATION OF ECONOMIC AND POLITICAL POWER
35
The fact that people with higher levels of income receive tax deductions for sending their children to private schools at the same time that public schools lack the most elementary capacities is E�GPIEV�VI�IGXMSR�SJ�XLI�GETXYVI�SJ�TYFPMG�TSPMG]�JSVQYPEXMSR�F]�E�QMRSVMX]�XS�XLI�HIXVMQIRX�SJ�XLI�QENSVMX]�SJ�XLI�TSTYPEXMSR��-R�EHHMXMSR�XS�XLI�SVMKMREP�MRIUYEPMX]�SJ�TYVGLEWMRK�TS[IV��XLMW��WGEP�inequality accentuates and perpetuates original inequalities to the detriment of cognitive and non-cognitive knowledge and abilities for students with lower purchasing power.
-ŒʼnŕřŅŐōŘŝ��1ŅŖŋōŒŅŐōŞŅŘōœŒ�ŅŒň�:ōœŐʼnŒŇʼn�We are all familiar with today’s reality: in recent years, violence in Mexico has grown quickly and dramatically. The number of homicides for every 100,000 inhabitants has risen from 9.3 in 2007 to 19.8 in 2011, although it later dropped to around 15 in 2014. While the generalized increase in violence can be explained, at least partially, by the so-called War on Drugs in Mexico, begun during the administration of President Felipe Calderón, a recurring hypothesis is that inequality, marginalization and/or poverty could be playing roles in the increasing violence. This hypothesis has been underscored in light of the very regrettable incidence of September 2014, when 43 students disappeared (and were presumably murdered) in the state of Guerrero, one of Mexico’s poorest states. Existing empirical evidence seems to support this hypothesis.
A recent study by Enamorado et al. (2014) in fact demonstrates that inequality has played an important role in increasing violence in Mexico in recent years. In particular, the authors show XLEX�E�SRI�TIVGIRXEKI�TSMRX�MRGVIEWI�MR�XLI�+MRM�GSIJ�GMIRX�EX�E�QYRMGMTEP�PIZIP�MW�EWWSGMEXIH�[MXL�an increase of 5 deaths for every 100,000 inhabitants. Moreover, when the effect of inequality on different types of crimes is disaggregated, the authors found that the effect is even higher for GVMQIW�VIPEXIH�XS�HVYK�XVEJ�GOMRK��ER�MRGVIEWI�SJ����LSQMGMHIW�VIPEXIH�XS�HVYK�XVEJ�GOMRK�JSV�IZIV]�100,000 inhabitants).
On the other hand, Corona-Juárez (2014) shows that at a state level, levels of criminal activity and LSQMGMHIW�MR�1I\MGS�EVI�WMKRM�GERXP]�EWWSGMEXIH�[MXL�PS[�PIZIPW�SJ�IHYGEXMSR�EQSRK�]SYXL�ERH�high levels of youth unemployment. This reality is even more evident in urban areas where there is a concentration of young people with limited opportunities for continuing their schooling or for working, which tends to result in greater levels of violence and criminality.
EXTREME INEQUALITY IN MEXICO
CONCENTRATION OF ECONOMIC AND POLITICAL POWER
36
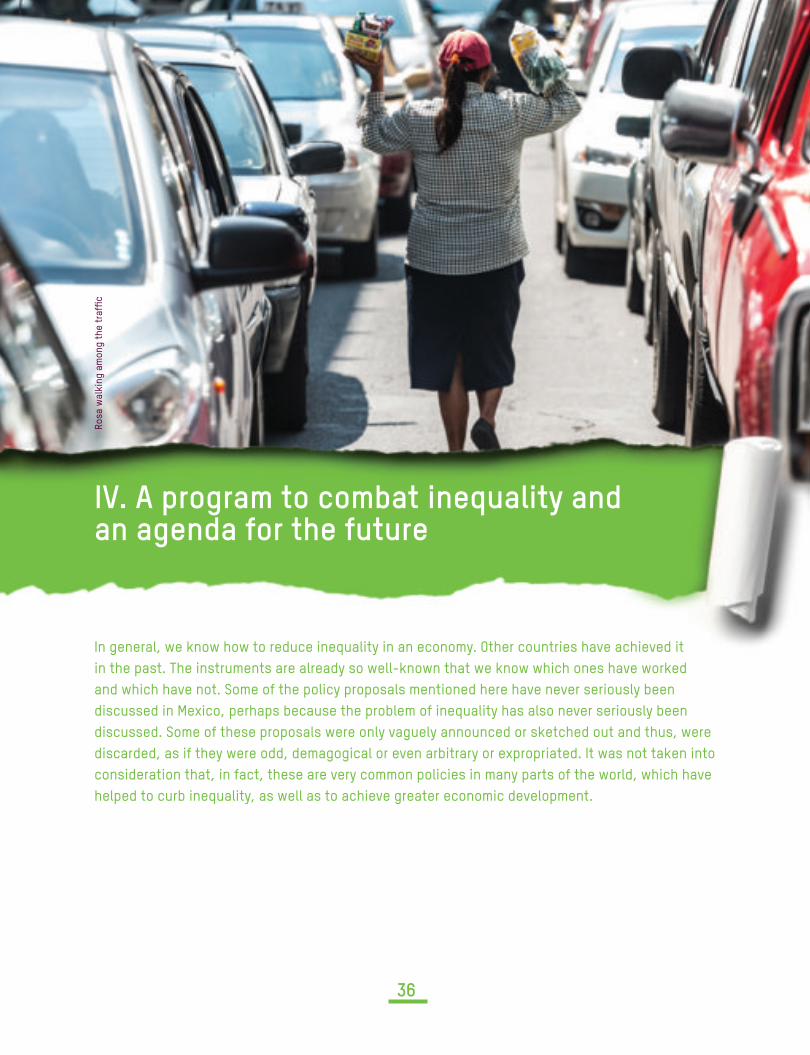
6SWE�[EPOMRK
�EQSR
K�XLI�XVEJ�G
IV. A program to combat inequality and an agenda for the future
-R�KIRIVEP��[I�ORS[�LS[�XS�VIHYGI�MRIUYEPMX]�MR�ER�IGSRSQ]��3XLIV�GSYRXVMIW�LEZI�EGLMIZIH�MX�MR�XLI�TEWX��8LI�MRWXVYQIRXW�EVI�EPVIEH]�WS�[IPP�ORS[R�XLEX�[I�ORS[�[LMGL�SRIW�LEZI�[SVOIH�and which have not. Some of the policy proposals mentioned here have never seriously been discussed in Mexico, perhaps because the problem of inequality has also never seriously been HMWGYWWIH��7SQI�SJ�XLIWI�TVSTSWEPW�[IVI�SRP]�ZEKYIP]�ERRSYRGIH�SV�WOIXGLIH�SYX�ERH�XLYW��[IVI�HMWGEVHIH��EW�MJ�XLI]�[IVI�SHH��HIQEKSKMGEP�SV�IZIR�EVFMXVEV]�SV�I\TVSTVMEXIH��-X�[EW�RSX�XEOIR�MRXS�consideration that, in fact, these are very common policies in many parts of the world, which have helped to curb inequality, as well as to achieve greater economic development.
EXTREME INEQUALITY IN MEXICO
CONCENTRATION OF ECONOMIC AND POLITICAL POWER
37
1. Creation of a genuine Social State
The conception of social policy in our country must change. It is more than evident that current social policy has failed. Over two decades of innovations in social policy, together with continuous change to social programs and strategies, have transpired, and yet poverty rates are the same as they were two decades ago. Based on the increase in population size during this interval—over 30%—, the number of people living in poverty has grown in similar proportions. Hence, we should change our conception of what we are doing in this arena now. Instead of continuing with multiple social welfare programs that merely seek to mitigate the breadth and depth of poverty, we should shift to a rights-based approach to social policy: the right to food, education, health, etc. A change in approach should change our thinking about the State: from a State that gives to one that guarantees.
This implies the construction of a genuine Social State, which is a broader concept than the outdated Welfare State. The State must ensure that its citizens, for the simple reason of being citizens, have real access to a minimum of social rights, which should be guaranteed from the beginning to the end of their natural lives. What does that mean? Access to quality education in installations with appropriate infrastructure; access to health from infancy to old age, with the provision of healthcare in adequate installations and with a guaranteed, appropriate supply of QIHMGEXMSR�ERH�EGGIWW�XS�QMRMQYQ�LSWTMXEP�WIVZMGIW��XLI�VMKLX�XS�WYJ�GMIRX��RYXVMXMSREP�JSSH��IXG���
2.�%�QSVI�TVSKVIWWMZI��WGEP�TSPMG]�
*MWGEP�TSPMG]�MR�1I\MGS�MW�MRWYJ�GMIRXP]�TVSKVIWWMZI��-R�XLI�GEWI�SJ�MRGSQI�XE\��QSVI�TVSKVIWWMZI�tax rates are required for the highest range of income distribution. However, in addition, new taxes are needed to tax the most common sources of income of people who receive the highest levels of income. For example, this implies taxing income from capital gains, dividends and interest. In all these cases, tax rates should be equivalent, at least, to those applied to labour income. Currently, some of these taxes are nonexistent and when they do exist, they have lower tax rates than those imposed on labour income. Here, horizontal inequality is accentuated among individuals who obtain their income from different sources. Moreover, income inequality is also enhanced since tax structure design tends to favour people who earn more and whose sources of income are taxed at lower rates than low-income or middle-income individuals who earn most of their income from their employment.
Property taxes should also be more progressive. In a great number of municipalities, property taxes are practically non-existent or inoperative. In order to guarantee effectiveness, the way in which
EXTREME INEQUALITY IN MEXICO
CONCENTRATION OF ECONOMIC AND POLITICAL POWER
38
this tax works needs to be changed. Perhaps the possibility of a centralized administration for state governments should be considered, that could then return or funnel collected taxes back to municipalities.
On the other hand, vehicle property taxes disappeared in several states or high subsidies are in place. Undoubtedly, a change is needed since this is one of the most progressive and easiest taxes to enact, thus making its restitution desirable.
In addition to the aforementioned, the possibility to establish two other types of taxes on assets or wealth: one for inheritances and the other for total wealth. In both cases, this tax could be applied FEWIH�SR�E�LMKL�IRSYKL�XLVIWLSPH�XS�I\GPYHI�XLI�QENSVMX]�SJ�XLI�TSTYPEXMSR�]IX�E�WYJ�GMIRXP]�PS[�IRSYKL�XLVIWLSPH�XS�MR�YIRGI�E�WMKRM�GERX�TSVXMSR�SJ�XLI�TSTYPEXMSR��[I�EVI�VIJIVVMRK�XS�FIX[IIR�1% and 5% of the population). These taxes could contribute additional taxes to the Mexican Treasury but—and even more importantly—they could help provide greater and better information about income distribution and wealth at the highest peak of income distribution. Hence, eventually, QSVI�ETTVSTVMEXI��WGEP�TSPMG]�GSYPH�FI�HIWMKRIH�EGGSVHMRK�XS�QMH�ERH�PSRK�XIVQ�KSEPW�
The relevance of some personal deductions should also be reconsidered. A large part of these HIHYGXMSRW�HMWTVSTSVXMSREXIP]�FIRI�X�XLI�LMKLIWX�HIGMPI�SJ�XLI�TSTYPEXMSR��(SREXMSRW��XYMXMSR�ERH�additional voluntary contributions to retirement funds (SAR) are clear examples of these kinds of deductions.
3. Improved focalization of expenditures Public spending should be better focused both in sectorial and regional terms. Spending should be EPPSGEXIH�XS�TVMSVMXMIW�MR�XLI��IPHW�SJ�IHYGEXMSR��LIEPXL�ERH�EGGIWW�XS�FEWMG�WIVZMGIW�MR�EGGSVHERGI�to the population’s needs. Spending should also guarantee that these services have minimum levels of quality. At all times, public spending should consider not only the magnitude of potential WSGMEP�FIRI�X��FYX�EPWS�ER�IPIQIRX�SJ�VIHMWXVMFYXMSR��
Therefore, public spending could be aimed, initially, to qualitatively improve the living conditions procured by education and health services, as well as seek to guarantee a minimum, desirable threshold for the provision of those services. This simple occurrence could have noteworthy effects SR�GIVXEMR�VIKMSRW�ERH�GSQQYRMXMIW�XLEX�[SYPH�FI�FIRI�XXIH��QE\MQM^MRK�WSGMEP�ERH�IGSRSQMG�impact. The fact that Mexico’s public schools lack the most elemental pieces of infrastructure in XLI�QMHHPI�SJ�XLI���WX�GIRXYV]�MW�EFSQMREFPI�ERH�MREHQMWWMFPI��8LMW�VIEPMX]�WMKRM�GERXP]�LIPTW�XS�perpetuate and widen pre-existing, initial socioeconomic gaps.
Another important component of public spending should be focused on creating basic infrastructure that can eventually trigger other complementary private investment projects. In
EXTREME INEQUALITY IN MEXICO
CONCENTRATION OF ECONOMIC AND POLITICAL POWER
39
particular, spending should be concentrated on the promotion of supra-state projects, particularly in zones with lower levels of socio-economic development (in the south and south-eastern part of the country, for example). This type of spending tends to have high economic and social impacts and, thus, can noticeably contribute to triggering or strengthening growth in the country.
4. Wage and labour policy Changing the minimum wage policy is essential in nature. Continuing with the current wage policy JSGYWIH�SR�GSRXEMRMRK�MR�EXMSR�[LIR�MR�EXMSR�MW�RS�PSRKIV�E�VIPIZERX�TVSFPIQ�MW�EPQSWX�WLEQIJYP��In this sense, beginning a comprehensive process to recuperate the purchasing power of minimum wage must not be deterred. This policy change will have an initial positive effect: to increase and strengthen purchasing power and the quality of life of minimum wage workers. Strengthening the HSQIWXMG�QEVOIX�MW�NYWX�SRI�SJ�XLI�FIRI�XW�XLEX�[MPP�JSPPS[�XLMW�MRMXMEP�IJJIGX�
In addition to this change in wage policy, in the same way, labour reform should be carried out to rebalance negotiating power between workers and employers. This could imply improvements in mechanisms for union representation but also the elimination of political and administrative SFWXEGPIW�XLEX�GYVVIRXP]�GSRXVMFYXI�XS�XLI�I\MWXIRGI�SJ��GXMXMSYW�YRMSR�VITVIWIRXEXMSR��8LMW�TSPMG]�change could indirectly contribute to improving workers’ negotiating capacity and, in addition, it could eventually help revert observed tendencies in functional wage distribution.
5. Transparency and accountability mechanisms In order to diminish problems associated with political capture, transparency and accountability QIGLERMWQW�QYWX�FI�WXVIRKXLIRIH��;LEX�[SYPH�FI�E�WMQTPI�QIEWYVI�ERH��VWX�WXIT#�8S�QEOI�XLI�statements of wealth of all members of the three branches of government—Executive, Legislative ERH�.YHMGMEPrTYFPMG��8LMW�ZIV]�WMQTPI�QIEWYVI�[SYPH�VIZIEP�TSXIRXMEP�ERH�SV�VIEP�GSR�MGXW�SJ�MRXIVIWX�XLEX�TYFPMG�WIVZERXW�QE]�MRGYV�[LMPI�MR�SJ�GI�ERH�[SYPH�LIPT�XS�GSQFEX�GSVVYTXMSR�ERH�strengthen the Rule of Law.
EXTREME INEQUALITY IN MEXICO
CONCENTRATION OF ECONOMIC AND POLITICAL POWER
40
References
Alvaredo, Facundo (2010); “The Rich in Argentina over the Twentieth Century,” in A. Atkinson and T. Piketty
(editors) Top Incomes: A Global Perspective, Oxford University Press, chapter 6.
%VGIS��)ZE�3��ERH�6E]QYRHS�'EQTSW�:Ž^UYI^������ ��s)ZSPYGMƍR�HI�PE�FVIGLE�WEPEVMEP�HI�KƄRIVS�IR�1Ƅ\MGS�t�)P�
Trimestre Económico, vol. LXXI (3), no. 323, July-September, pp 619-653.
Bosch, Mariano and Mariano Manacorda (2010); “Minimum Wages and Earnings Inequality in Urban Mexico,”
American Economic Journal: Applied Economics, 2(4): 128-49.
Campos, Raymundo, Gerardo Esquivel and Nora Lustig (2014); “The Rise and Fall of Income Inequality in Mexico:
1989-2010,” in Andrea Cornia (ed.) Falling Inequality in Latin America: Policy Changes and Lessons,
Oxford University Press, 2014.
Campos, Raymundo, Emmanuel Chávez and Gerardo Esquivel (2014); “Los Ingresos Altos, la Tributación Óptima
y la Recaudación Posible,” Premio Nacional de Finanzas Públicas 2014, Centro de Estudios de las
Finanzas Públicas, Cámara de Diputados, Mexico.
Campos, Raymundo, Emmanuel Chávez and Gerardo Esquivel (2015); “A New Approach for Top Income Shares:
Mexico Since the 1990’s,” work in progress.
CEPAL et al. (2013); “Trabajo decente e igualdad de género. Políticas para mejorar el acceso y la calidad del
empleo de las mujeres en América Latina y el Caribe,” CEPAL/FAO/ONU Mujeres/PNUD/OIT, Santiago,
Chile; 234 p.
Cingano, Federico (2014); “Trends in Income Inequality and Its Impact on Economic Growth,” OECD Social,
Employment and Migration Working Papers, no. 163, December.
'32):%0������ ��s0E�TSFVI^E�IR�PE�TSFPEGMƍR�MRHƈKIRE�HI�1Ƅ\MGS������t�'SRWINS�2EGMSREP�HI�)ZEPYEGMƍR�HI�PE�
Política Social, July.
Corona, Nicolás (2014); Essays on the Economics of Violent Crime in Mexico, Ph.D. Dissertation, Heildelberg
University.
Credit Suisse (2014); “Global Wealth Report 2014”, October, 64p.
Esquivel, Gerardo (2011); “The Dynamics of Income Inequality in Mexico since NAFTA,” Economía, Journal of the
0EXMR�%QIVMGER�ERH�'EVMFFIER�)GSRSQMG�%WWSGMEXMSR��:SP������RS�����*EPP�������TT����������
+SR^ŽPI^�6SHVƈKYI^��.SWƄ�HI�.IWƒW������ ��s0E�QMRIVƈE�IR�1Ƅ\MGS��VIJIVIRGMEW�KIRIVEPIW��VƄKMQIR��WGEP��
concesiones y propuestas legislativas,” H. Cámara de Diputados, Centro de Estudios Sobre la Opinión
Pública, Documento de Trabajo, no. 121.
INEGI (2014); “Mujeres y Hombres en México 2013,” Instituto Nacional de Geografía y Estadística, Mexico, 117 p.
Medeiros, Marcelo; Pedro H. G. Ferreira de Souza and Fabio A. Castro (2014); “Top Income Shares in Brazil, 2006-
2012: A Summary,” note.
Milanovic, Branko (2012); Los que tienen y los que no tienen, Alianza Editorial.
2EQSVEHS��8IH��0��*��0ƍTI^�'EPZE��'��6SHVƈKYI^�'EWXIPŽR�ERH�,��;MROPIV������ ��s-RGSQI�-RIUYEPMX]�ERH�:MSPIRX�
Crime. Evidence from Mexico’s Drug War,” Policy Research Working Paper no. 6395, The World Bank,
June.
OECD (2012); “OECD Review of Telecommunication Policy and Regulation in Mexico,” 140 p.
OECD (2014), Focus on Inequality and Growth, December, 2014.
OXFAM (2014a); Even It Up. Time to End Extreme Inequality. Oxfam International, October.
EXTREME INEQUALITY IN MEXICO
CONCENTRATION OF ECONOMIC AND POLITICAL POWER
41
OXFAM (2014b); Working for the Few. Political Capture and Economic Inequality.
Piketty, Thomas (2014); El Capital en el Siglo XXI, Fondo de Cultura Económica.
Samaniego, Norma (2014); “La participación del trabajo en el ingreso nacional: el regreso a un tema olvidado,”
Economía UNAM, vol. 11, no. 33, pp 52-77.
Secretaría de Desarrollo Económico (2014); “Política de recuperación del salario mínimo en México y en el
Distrito Federal,” Gobierno del Distrito Federal, August.
Solt, Frederick (2014); The Standardized World Income Inequality Database��;SVOMRK�TETIV��7;--(�:IVWMSR������
October.
Székely, Miguel and M. Hilgert (1999); What is Behind the Inequality We Measure: An Investigation using Latin
American Data; Research Department Working Paper, Inter-American Development Bank.
WealthInsight (2013); Mexico Wealth Book: Trends in Millionaire Wealth, August.
World Economic Forum (2014a); Outlook on the Global Agenda 2015, October, 93 p.
World Economic Forum (2014b); The Global Gender Gap Report 2014, 385 p.
This publication is subject to copyright but the text can be used freely for political and campaign purposes,
as well as in education and research, provided the source is cited in full. The copyright holder requests that
any such use be reported to him in order to assess its impact. The reproduction of the text under any other
circumstances, its use in other publications, including translations or adaptations need explicit permission
and a fee payment may apply. Please contact [email protected]
Mexico City. June 2015.
Mexico City. June 2015.
www.oxfammexico.org