Embed Size (px)
Citation preview
1
Teplizumab (anti-CD3 mAb) treatment preserves C-peptide responses in patients with
new-onset type 1 diabetes in a randomized controlled trial: Metabolic and immunologic
features at baseline identify a subgroup of responders
Kevan C Herold, Stephen E Gitelman, Mario R Ehlers, Peter A Gottlieb, Carla J Greenbaum,
William Hagopian, Karen D Boyle, Lynette Keyes-Elstein, Sudeepta Aggarwal, Deborah
Phippard, Peter H Sayre, James McNamara, Jeffrey A Bluestone, and the AbATE Study Team
Department of Immunobiology and Internal Medicine, Yale University, New Haven, CT (Prof K
C Herold MD); Immune Tolerance Network, San Francisco, CA (M R Ehlers MBChB, PhD,
Peter H Sayre MD PhD); National Institutes of Allergy and Infectious Diseases, Bethesda, MD (J
McNamara MD); Immune Tolerance Network, Bethesda, MD (S Aggarwal PhD, D Phippard
PhD); Rho Federal Systems Division, Chapel Hill, NC (K D Boyle MS, L Keyes-Elstein DrPH);
University of California San Francisco, San Francisco, CA (Prof S E Gitelman MD, Prof J A
Bluestone PhD); Barbara Davis Center, University of Colorado, Aurora, CO (Prof P A Gottlieb
MD); Benaroya Research Institute, Seattle, WA (C J Greenbaum MD); and Pacific Northwest
Diabetes Research Institute, Seattle, WA (W Hagopian MD PhD)
Running title: Identification of responders to anti-CD3 mAb
Word counts: Text 4000, Abstract 200
Direct correspondence to:
Kevan C. Herold, MD
Yale University
300 Cedar St, #353E
New Haven, CT 06853
Ph: 203-785-6507
Fax: 203-785-7903
Email: [email protected]
Page 1 of 40 Diabetes
Diabetes Publish Ahead of Print, published online July 8, 2013
2
Abstract: Trials of immune therapies in new-onset type 1 diabetes (T1D) have shown success
but not all subjects respond and the response duration is limited. Our aim was to determine
whether two courses of FcR-nonbinding anti-CD3 mAb, teplizumab, reduces the decline in C-
peptide in patients with new-onset T1D two years after disease onset, and we also set out to
identify characteristics of responders. We treated 52 subjects with new-onset T1D with
teplizumab for 2 weeks at diagnosis and after 1 year in a randomized, open-labeled, controlled
trial. In the intention to treat analysis of the primary endpoint, teplizumab-treated patients had a
reduced decline in C-peptide at 2 years ((mean, 95% CI) -0.28(-0.36, -0.20) nmol/L) vs. control
(-0.46(-0.57, -0.35) nmol/L; p=0.002), a 75% improvement. The most common adverse events
were rash, transient upper respiratory infections, headache, and nausea. In a post-hoc analysis,
we characterized clinical responders and found that metabolic (HbA1c and insulin use) and
immunologic features distinguished this group from non-responders to teplizumab. We conclude
that teplizumab treatment preserves insulin production and reduces the use of exogenous insulin
in some patients with new-onset T1D. Metabolic and immunologic features at entry can identify
a subgroup with robust responses to immune therapy.
ClinicalTrials.gov: NCT00129259
Keywords: Type 1 diabetes, immune therapy, monoclonal antibody, responder, teplizumab
Page 2 of 40Diabetes
3
A number of trials have shown that progression of type 1 diabetes (T1D) can be
modulated by immune therapies. cyclosporin A, azathioprine plus prednisone and, more
recently, CTLA4Ig, rituximab and FcR-nonbinding anti-CD3 mAb treatments have reduced the
fall in C-peptide responses that occurs in the first 2 years after disease onset.(1-5) While the
effects of therapy are not permanent, there is evidence that in at least some individuals, responses
to immune therapy may persist for as long as 3 years after diagnosis, while in others there is no
response to drug treatment.(6; 7) The reasons why immune therapies have not induced lasting
remissions of the disease and why some individuals are more responsive to treatment than others
are not known. One factor may involve the pharmacokinetics of the immune therapy in
individual subjects.(8) However, even drugs that have been given continuously, such as
CTLA4Ig or cyclosporin A, have diminishing effects over time.(3; 9) Alternatively, there may be
individual factors that affect escape from the effects of immune therapy, such as immune
receptor signaling pathways or inflammatory mediators.(10; 11) Finally, there may be factors
that affect β cells, such as inflammatory cytokines. (12) Glucose toxicity itself has been thought
to affect these responses. In the Diabetes Control and Complications Trial (DCCT), individuals
in the intensive control group showed less decline in stimulated C-peptide levels than those in
the conventional control group.(13)
Identifying individuals who are likely to respond to drug therapy would be valuable for
the selection of individuals for treatment. In previous studies, we and others showed that a
single course of FcR-nonbinding anti-CD3 mAb given soon after the diagnosis of T1D improved
C-peptide responses for 1 year after diagnosis but the responses waned after that time.(1; 2; 5)
We therefore conducted a prospective, randomized, controlled trial of teplizumab in patients with
new-onset T1D to test the effects of 2 courses of the drug, 1 year apart, on C-peptide responses
Page 3 of 40 Diabetes
4
2 years after diagnosis. We also sought, in post-hoc analyses, to identify the clinical and
immunologic features of subjects who showed clinical responses to the drug. Our data show that
treatment with FcR non-binding anti-CD3 mAb can preserve insulin secretion in patients with
new-onset T1D. Metabolic control and insulin use at the time of study enrollment was the
strongest predictor of response as well as immunologic features. The lasting effect of metabolic
features on responses to immune therapy has not been previously appreciated and deserves
further study.
Page 4 of 40Diabetes
5
Methods
Study design and patients: This was a randomized, open-label study performed at 6 medical
centers conducted between 2005-2011. Eligible individuals were between 8-30 years of age,
diagnosed with T1D within 8 weeks, and anti-GAD65+, anti-ICA512+, or ICA+. Written
consent was obtained from participants. The study was approved by the Institutional Review
Boards at each institution. A Data and Safety Monitoring Board reviewed safety data at least
yearly. This study is registered with ClinicalTrials.gov: (NCT00129259). The complete protocol
is available at www.immunetolerance.org.
Randomization and masking: Subjects were randomized to drug treatment or a control group
in a 2:1 ratio within randomly ordered blocks of 6 or 3. The study was open label, but core
laboratory personnel were masked to the treatment assignments.
Treatment and assessments: The drug treatment group received a 14-day course of
teplizumab (Day 1: 51 µg/m2, Day 2: 103 µg/m
2, Day 3: 206 µg/m
2, Day 4: 413 µg/m
2, Days 5-
14: 826 µg/m2 , (median cumulative dose=11.6 mg, interquartile range 5.7 mg) intravenously,
diluted in normal saline solution.(14) The control group did not receive a placebo infusion.
Subjects received ibuprofen, diphenhydramine, and/or acetaminophen for infusion-related
reactions. Drug treatment was discontinued during a treatment cycle if thrombocytopenia (<
140, 000/mm3 on day 1 or < 100,000/mm
3 on other days), anemia, neutropenia, fever (> grade
3), liver function abnormalities (of 2-3x upper limit of reference interval), hyperbilirubinemia,
INR (> 1.3), or other adverse events of > grade 3 occurred. Participants were not permitted to
receive the second treatment cycle if they had an acute febrile illness within 4 weeks or
developed anti-idiotype antibodies of > 1:1000 titer or IgE isotype. Both groups were seen at
Page 5 of 40 Diabetes
6
regular intervals and received contact by a certified diabetes educator (CDE) every 2 weeks with
a treat to target goal of a HbA1c <7.5% (58 mmol/mol).
Subjects in both groups underwent a four-hour mixed meal tolerance test (MMTT) every
6 months for 2 years as described.(2) After 1 year, individuals in the drug treatment group who
had detectable C-peptide responses at all time-points of the MMTT and who had not met
stopping criteria for drug administration received a 2nd
course of teplizumab (n=40) (median
cumulative dose of 12.4 mg, interquartile range 5.08 mg). Because of a temporary hold in the
protocol due to drug manufacturing and safety review, 4 of the first 5 subjects received their 2nd
course of drug later than the prescribed 1 year time point. These subjects had MMTTs within
100 days of 24 months after study entry. The insulin use was determined from patient logs and
calculated as the average units/kg/d over the 3 days prior to study visit.
Laboratory tests: Autoantibodies were measured by radioimmunoassay at the Barbara Davis
Center (Aurora, CO) and immunofluorescence at the University of Florida. C-peptide and
HbA1c levels were measured by two-site immunoenzymometeric assay (Tosoh, San Francisco,
CA) and ion-exchange high performance liquid chromatography (Bio-Rad Diagnostics) at the
Northwest Lipid Research Laboratory (Seattle, WA)(3; 15). The lower limit of detection in the
C-peptide assay was 0.05 nmol/L. Serum teplizumab levels were measured on a subset (6) of
drug treated subjects using a previously defined flow cytometry-based assay.(2) The mean±SD
peak teplizumab levels, in serum collected prior to last infusion of 1st (day 13) and 2
nd cycles
were 1095±329 ng/ml (n=4) and 1097±851 ng/ml (n=2) respectively. The trough levels,
calculated as median of 1-hour post and 6 hour-post last infusion (where available), were
412±215 and 514±399 ng/ml, respectively.
Page 6 of 40Diabetes
7
Flow cytometry: Peripheral blood mononuclear cells were isolated from whole blood at study
entry and frozen at a core facility. Thawed cells were stained with 10-color panels which
included mAbs to CD2, CD4, CD8, CCR4, CCR5, CCR6, CCR7, CXCR3, CXCR5, CD25,
CD28, CD38, CD39, CD45RA, CD45RO, CD127, Helios, Foxp3, TNFR2, PD-1, NKG2A (BD
Pharmingen, San Jose, CA) and analyzed by flow cytometry on a LSRII cytometer. For
intracellular cytokine staining, cells were stimulated for 6 hours with or without phorbol myristic
acid (500 ng/ml) and ionomycin (500 pg/ml) and stained with mAbs to IFN-γ, TNF, IL-13, IL-
17, IL-10 (BD Pharmingen, San Jose, CA) and analyzed by Flow Cytometry.
Statistical analyses: The 4-hour C-peptide area under the curve (AUC) was calculated using the
trapezoidal rule over the 4-hour period (0-240 minutes). For this computation, the “time 0” C-
peptide value was taken as the average of C-peptide values measured at time points -10 and 0
minutes. The AUC calculation was based on the time points available from the MMTT. Results
reported as less than the lower limit of detection were imputed as 0 for that time point of the
MMTT. The primary endpoint was predefined as a comparison of the change in the mean 4-hour
C-peptide AUC from baseline, adjusted for the baseline C-peptide response, in the drug vs.
control groups at 24 months. Treated subjects who completed the MMTT at baseline and
received at least 1 dose of study drug (n=52), and subjects randomized to the control group with
a baseline MMTT (n= 25) were used in the intention to treat (ITT) analysis. Seven subjects in
the ITT population did not have an MMTT at month 24 (4 control, 3 teplizumab). For the ITT
analysis of the primary endpoint missing month 24 values were imputed using an algorithm
designed to under-estimate the true difference between arms. If the last available AUC value was
0, the missing month 24 AUC was imputed as zero. If the last observed AUC value was >0, the
month 24 AUC values among subjects in the same arm were regressed on AUC values from the
Page 7 of 40 Diabetes
8
prior time point to yield a regression line and 95% confidence intervals. Missing month 24 AUC
values were imputed as predicted values from the upper 95% confidence band for control
subjects and from the lower 95% confidence band for subjects in the teplizumab arm. A
sensitivity analysis was conducted using the t-statistic derived from the model with imputed data
but reducing the degrees of freedom to account for the 7 imputed values. The p-values from the
primary analysis and the sensitivity analysis agreed to the 4th
decimal place for the test of the
treatment effect.
For group comparisons, C-peptide AUC values were transformed to ln(AUC+1) values.
An F-test derived from an analysis of covariance with baseline ln(AUC+1) value as a covariate
was used to compare treatment groups. Means and 95% CI are presented on the untransformed
scale. Percent improvement was calculated as:
100%* (Least Squares(LS) mean for treated – LS mean for controls)/LS mean for
controls.
Similar methods, using a repeated measures analysis, with baseline response as a
covariate were used for secondary clinical and mechanistic endpoints and for exploratory
analyses using groups defined by responder status. Longitudinal analyses were also applied to
test trends over time. For secondary and exploratory analyses corrections were not made for
multiple comparisons.
Baseline differences between treatment groups were evaluated using p-values as
descriptive measures of the strength of association; Mann-Whitney U-tests, and chi-square tests
were used for continuous assessments and categorical characteristics, respectively. SAS version
9.2 was used.
Page 8 of 40Diabetes
9
The sample size was based on a group comparison of ln(AUC+1) after adjusting for
baseline differences. Based on data from a prior study,(1) we assumed the ln(AUC+1) after
adjusting for baseline would be 0.309 in the teplizumab group. The current study was powered to
detect a 50% worsening in adjusted 24-month C-peptide AUC in the control group compared to
the treated group (i.e. assume mean(AUC)= [exp(0.31)-1] = 0.36 for the teplizumab group
compared to 0.181 for the control). With 2:1 randomization and a two-sided test of significance
at α=0.05, 72 subjects were needed for 92% power. The study accrued 77 subjects in the ITT
population.
Page 9 of 40 Diabetes
10
Results
Recruitment and treatment of patients with new-onset T1D: We screened 125 subjects with
T1D of < 8 wks from diagnosis and enrolled 83 (figure 1). Six subjects left the study prior to the
first MMTT and are not included in the ITT analysis (n=77). Fifty-two of the subjects
randomized to drug treatment received all or part of the first drug course and are included in the
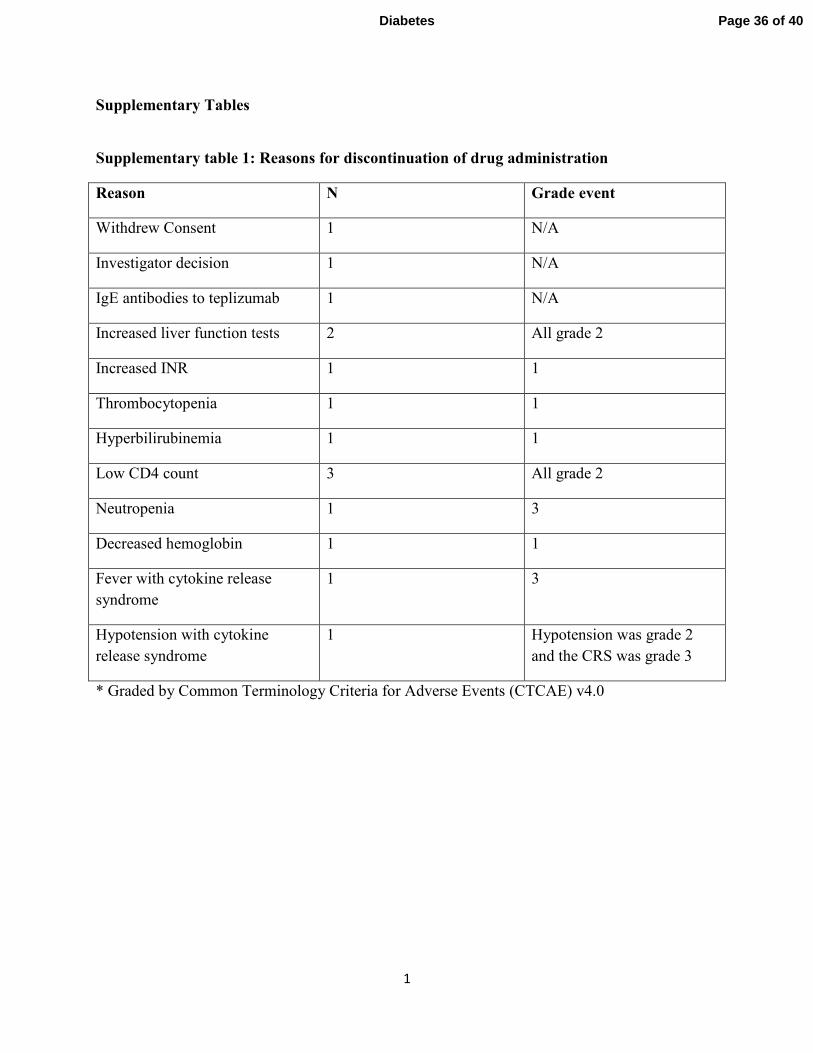
ITT analysis; 15 discontinued teplizumab treatment after receiving some of cycle 1 or 2
(supplementary table 1). Twelve subjects of the 15 developed laboratory abnormalities or
experienced adverse events leading to drug discontinuation. There were no significant
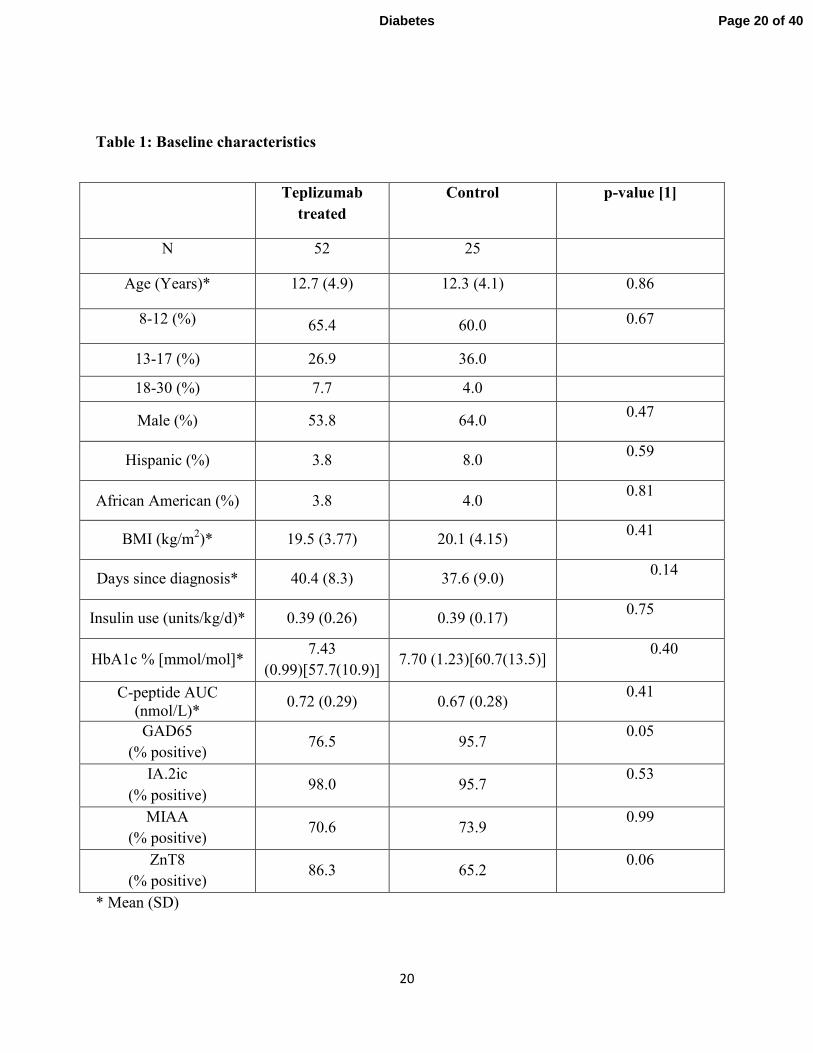
differences between the study groups at entry (table 1). The majority of subjects (94%) were <
18 years of age; 64% were ≤ 12 years.
Effects of teplizumab treatment on C-peptide and clinical responses: Teplizumab treatment
significantly reduced the loss of C-peptide 2 years after study entry (p=0.002, table 2, figure 2A).
After adjustment for the baseline imbalance, the mean C-peptide AUC level at year 2 was 75%
higher in the teplizumab arm compared to controls. Likewise, the drop in C-peptide AUC from
baseline to year 2 adjusting for baseline C-peptide AUC was on average smaller in teplizumab-
treated patients compared to the untreated controls as an absolute (p=0.002) or percent change
(p<0.001) from baseline (table 2). Treated subjects were estimated to reach control-group 6-
month values 15.9 months later than the control group (i.e. month 21.9) (figure 2B). At the
month 24 visit, more drug-treated subjects had detectable levels of C-peptide compared to
control subjects (p=0.002, figure 2C).
Intensive diabetes care with CDE contact was provided to all subjects to “treat to target”
of <7.5% (58 mmol/mol). There was not a significant difference in the HbA1c levels in the drug
Page 10 of 40Diabetes
11
and control groups (p=0.093) over the 24-month study, although at 9 and 15 months the change
from baseline of HbA1c levels were significantly higher in the control group (p= 0.035, 0.011,
respectively, figure 3B). The drug-treated group used significantly less insulin to achieve this
level of glycemic control (p=0.036, figure 3A).
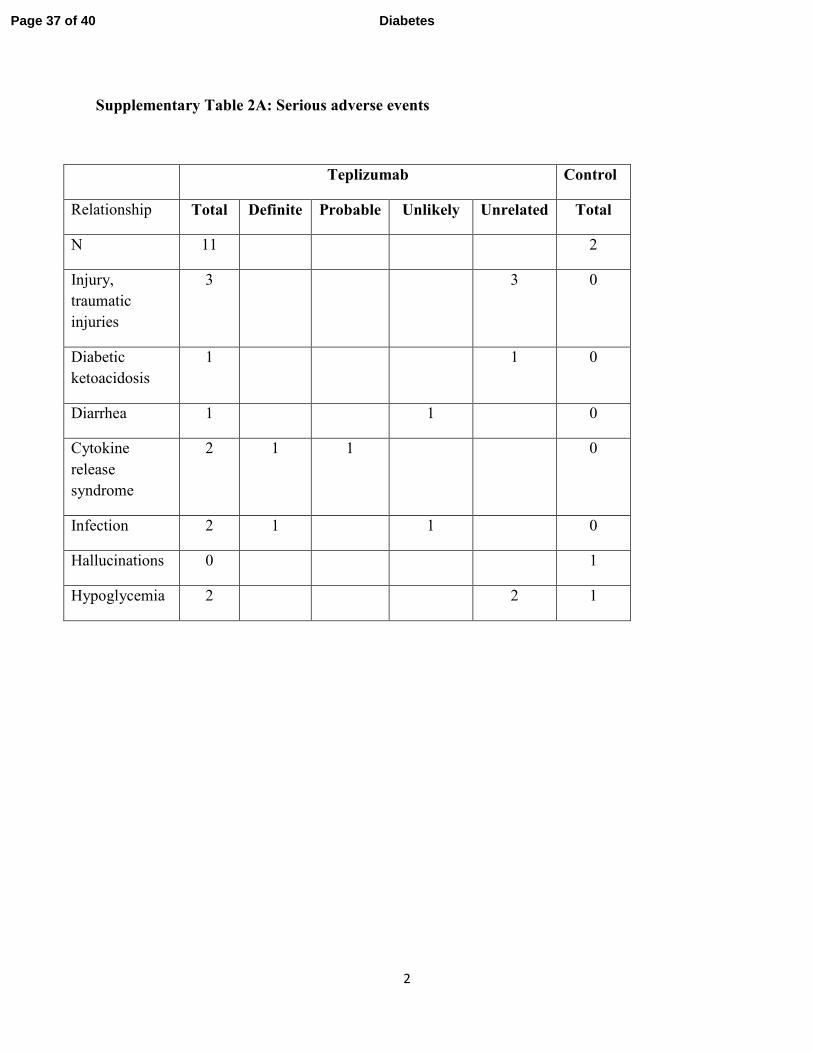
Adverse events: Drug-related events were transient and resolved (supplementary tables 2A, B,
C, and D). There were a total of 11 serious adverse events (SAEs) in 10 drug-treated subjects and
2 SAEs in 1 control subject (supplementary table 2A). The adverse events and those occurring
in > 15% of all subjects are shown in supplementary tables 2B, C, and D. Cytokine release
syndrome was identified in 5 treated subjects. The rates of severe hypoglycemia were similar in
the drug and control groups.
Of the 21 EBV and 16 CMV seropositive individuals in the drug-treated group, 9 and 2,
respectively, had a transient increase in the viral load detected by PCR 1 month after the first
course of drug treatment, and 3 and 1 had an increase after the second course of drug (range
100-5,500 copies/ml, median = 200). Five subjects with an increase in EBV viral load had
possible symptoms of transient EBV infection. In all subjects the viral loads were undetectable at
2 months after treatment.
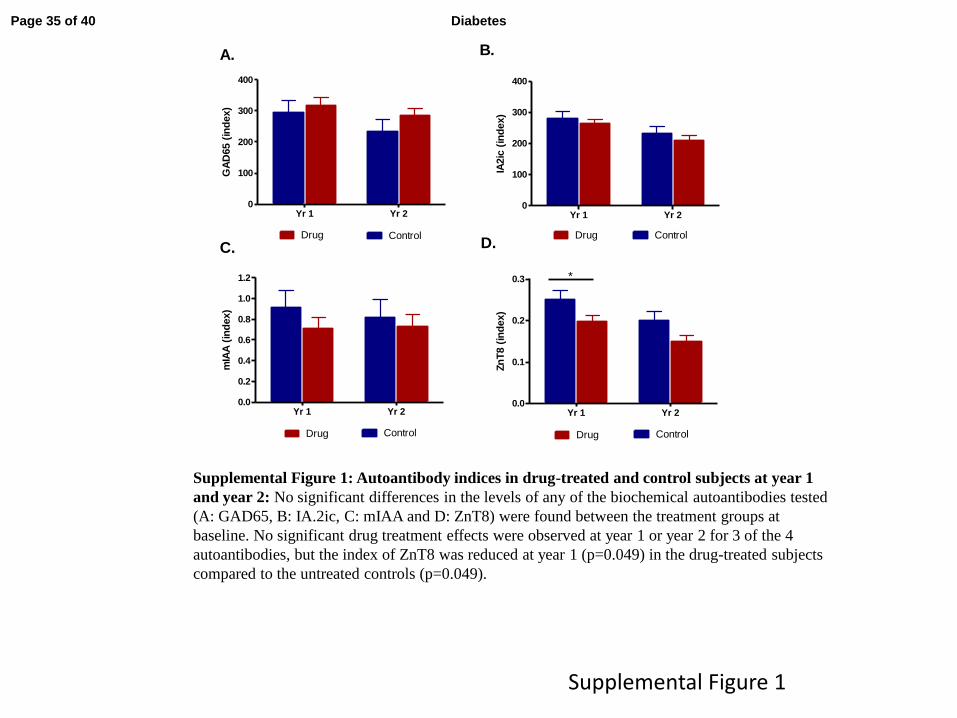
Effects of teplizumab treatment on autoantibodies: The titers of biochemical autoantibodies
were similar in the treatment groups at baseline. There was a significant reduction in the titer of
anti-ZnT8 antibodies but not the other biochemical autoantibodies in the drug-treated group at
the end of year 1 (p<0.05) and the differences at 2 years were not statistically significant
(supplementary figure 1).
Page 11 of 40 Diabetes
12
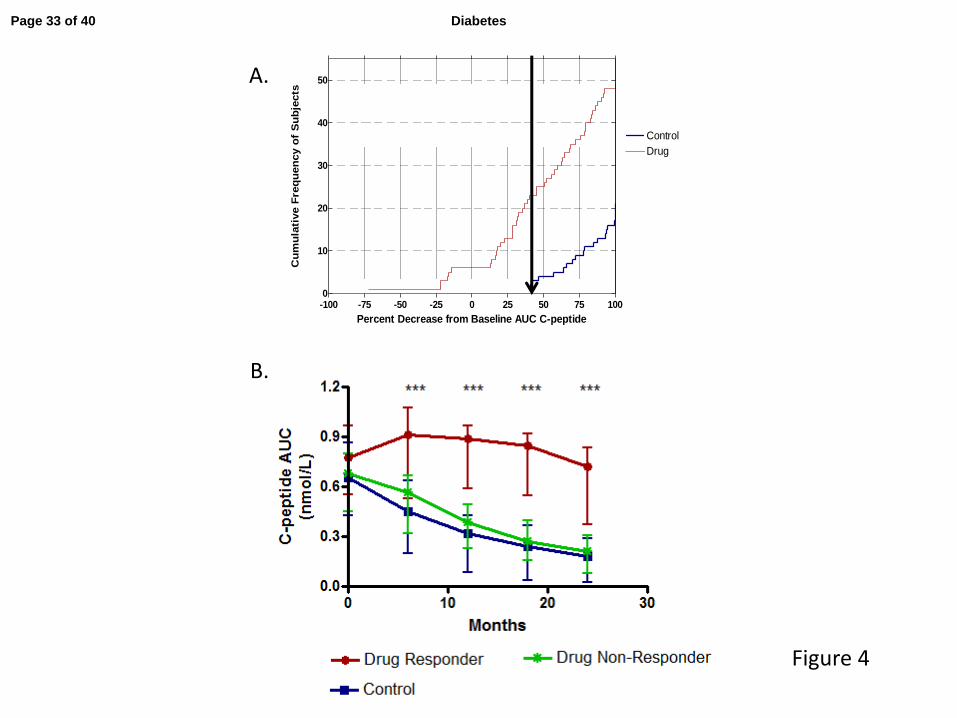
Identification of responders: The C-peptide responses varied widely among drug-treated
subjects suggesting there was a spectrum of responses. In a post-hoc analysis, we sought to
identify clinical and immunologic features that differentiated those individuals who did and did
not show a response to teplizumab treatment. For purpose of hypothesis generating, we
differentiated the responses of the drug-treated subjects based on changes in C-peptide secretion
in the untreated control group at 24 months (figure 4A). All of the 25 control subjects lost > 40%
of the baseline C-peptide response by 24 months, and 27/49 drug-treated subjects showed a
similar loss of > 40%. Conversely, 22/49 (45%) of the drug-treated subjects lost < 40% of
baseline C-peptide, and we refer to them as “responders.” The 3 subjects with missing month-24
C-peptide results were not evaluated for responder status.
Our analysis of the percent loss of C-peptide shown in figure 4A did not indicate whether
the pattern of the response to drug treatment reflected a true qualitative difference, in which the
curves describing the change in the C-peptide responses were different from the untreated
controls, or a quantitative difference in which the curve describing the change in C-peptide
responses was similar to the untreated control group but shifted in time as suggested by our ITT
analysis with all of the drug treated subjects (figure 2A). We therefore compared the C-peptide
AUC over time in the responders, non-responders, and control subjects (figure 4B). This
analysis suggested that the responders showed both quantitative and qualitative differences in
their response to teplizumab. Even after 18 months, the average C-peptide level for responders
was 113% of the baseline response, and only decreased from baseline by an average of 6% at
month 24. After adjusting for baseline differences, the C-peptide levels were nearly 3-fold (on
average 199%) higher among responders vs. control subjects at month 24 but were not different
in the non-responders vs. controls.
Page 12 of 40Diabetes
13
Metabolic and immunologic features of responders at baseline: The patients’ age, sex, BMI,
duration of disease, and baseline autoantibody titers were not predictors of the response to
teplizumab treatment (figure 5A). The responders and non-responders did not receive
significantly different amounts of drug. However, clinical responders had lower HbA1c levels
((mean; 95%CI) 7.05(6.689, 7.411)% vs. 7.78(7.360, 8.203)% [53.54(49.59, 57.49) mmol/mol
vs. 61.54(56.93, 66.14) mmol/mol], p=0.011) and used less insulin (0.28(0.204, 0.357) vs.
0.49(0.376, 0.606) U/kg/d, p=0.004) at baseline (figure 5B) even after correcting for baseline C-
peptide AUC (p=0.018, 0.008, respectively). The baseline C-peptide AUC responses in the
responders (0.78(0.65, 0.91) nmol/L) and non-responders (0.68(0.56, 0.79) pmolm/L) were not
significantly different (p=0.245).
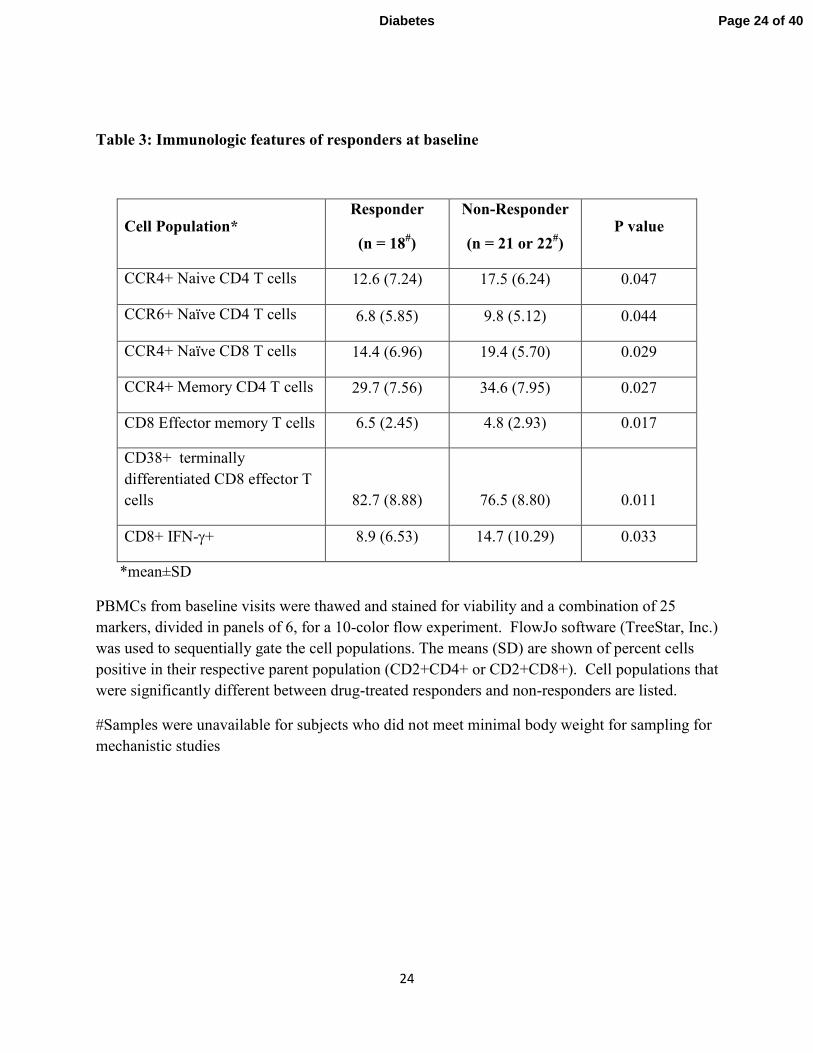
There was a lower frequency of CD4+ CCR4+ memory and naïve T cells (p=0.027,
0.047), CD4+CCR6+ naïve CD4+ T cells (p=0.044), naïve CCR4+ CD8+ T cells (p=0.029), and
IFNγ-producing CD8+ T cells (p=0.03) at baseline, and a higher number of activated CD8+
terminally differentiated effector and CD8+ effector-memory T cells (p=0.011, 0.017) in
responders vs. non-responders (table 3).
Page 13 of 40 Diabetes
14
Discussion
In this randomized controlled trial we show that 2 courses of treatment with FcR-
nonbinding anti-CD3 mAb (teplizumab) reduced the loss of C-peptide 2 years after the first
treatment in patients with new-onset T1D. Fewer drug-treated subjects lost detectable insulin
production. Less exogenous insulin was needed to maintain equivalent or lower HbA1c levels.(3;
4) However, the responses to the drug varied and, therefore, in a post-hoc analysis, we sought to
identify individuals who were clinical responders and distinct from the non-responders, and to
compare the immunologic and metabolic features of these subgroups. The strongest differences
were in metabolic features: responders had lower levels of HbA1c and insulin use at baseline. In
addition, responders had reduced numbers of Th1-like cells and other differences in T cell
subsets. These findings suggest lasting effects of pretreatment metabolic control on responses to
immune therapy since the endpoint of the study was 2 years after enrollment and the glucose
control during the study period was not significantly different.
The results from this trial suggest a more robust effect on the course of T1D (75% higher
C-peptide responses vs. control) than was seen in a recently reported Phase III trial (Protégé)
(approximately 33% higher C-peptide responses vs. placebo) which also used teplizumab.(14) A
number of design differences in these two trials may account for this. Although the control arm
did not receive placebo, subjects were randomized to treatment arms and balanced at baseline
and there were few dropouts. Our study was restricted to North American sites where the
diagnosis of disease was made relatively early, insulin requirements and HbA1c levels were less,
and the frequency of diabetic ketoacidosis was low. Although we did not find a significant effect
of age on treatment efficacy, unlike the Protégé trial, our subjects were younger and the rate of
decline in C-peptide responses is greater in younger subjects.(16)
Page 14 of 40Diabetes
15
The differences in the rates of adverse events and serious adverse events were greater in
the drug-treated vs. control group in this trial. In addition to teplizumab-associated events, the
drug-treated group was seen more frequently, which may have contributed to further imbalance
in AE reporting. The SAEs most closely related to study drug, cytokine release syndrome, were
transient. Of the 52 subjects randomized to drug treatment, 12 were unable to receive the 2nd
course of drug because of protocol-defined stopping rules. The rules were based on prior
experience to prevent more significant adverse events with continued drug administration,(6) but
were generally of low grade at the time of discontinuation.
We used a definition of responders based on the characteristics of the randomized control
group in this study. Previous studies used definitions of responders based on absence of a
decline in C-peptide or features of the C-peptide assay(1; 17) which, when applied to our dataset,
identified a smaller subgroup. It is important to note that our designation of drug-treated subjects
as “responders” and “non-responders” did not reflect a clear bimodal division but rather was
based on overall changes in the C-peptide responses in the drug-treated group that were different
from the untreated controls, all of whom lost at least 40% of the baseline responses.
Nevertheless, when analyzed in this way, the responders and non-responders had quantitatively
and qualitatively different responses, which did not simply reflect a delay in the decline in the C-
peptide as suggested by our ITT analysis or as reported with other successful immune therapies
such as abatacept or rituximab (3; 4). Instead, in the responder group the effects of teplizumab
were robust and durable, with C-peptide values above the baseline level for at least 18 months on
average and a C-peptide response of almost 3 times that of the untreated group after 2 years,
whereas in the non-responders even the initial effect was modest. Within the responder group
identified in this way, we did not find a clear bimodal distribution - there were subjects in whom
Page 15 of 40 Diabetes
16
the C-peptide response did not change at all or even increased after 2 years and others in whom
the decline in C-peptide responses were slightly less than 40% of the baseline response. Our
original objective in this trial was to test whether a 2nd
course of drug treatment at 1 year would
improve the clinical responses that appeared to wane in the 2nd
year after a single course of
teplizumab. The second course of teplizumab did not appear to have an effect on the drug-
treated group as a whole, but the robust pattern of response in the responders raises the
possibility that the 2nd
course was effective in maintaining C-peptide levels in this subset.
However, we cannot directly assess this since we did not have a group receiving a single
treatment course for comparison.
A surprising finding was the differences in metabolic and immunologic features of the
drug-treated responder group compared to the drug-treated non-responders. HbA1c and insulin
use at the time of study enrollment were significantly lower for responders compared to non-
responders. These parameters are thought to reflect endogenous β cell function, yet baseline C-
peptide AUC measurements were not significantly different between the groups. An effect of
tight glucose control on preservation of C-peptide responses was shown in the DCCT, and for
that reason all subjects were given close contact with a CDE with the intent to maintain HbA1c ≤
7.5% (58mmol/mol)(13). The mechanisms whereby glucose control and insulin sensitivity
might lead to improved responses are unknown. Metabolic pathways can affect effector and
memory T cell differentiation and function.(18)-(19) Glucose can stimulate IL-1β production by
β cells, which may impair the effects of the FcR non-binding anti-CD3 mAb.(20; 21) Chronic
exposure to elevated glucose causes a deterioration of β cell function as a consequence of
oxidative stress.(22) The damage inflicted on β cells prior to the immune therapy may render the
cells incapable of recovery and repair. However, even more striking was the difference in insulin
Page 16 of 40Diabetes
17
use between responders and non-responders. Since we did not find a significant difference in C-
peptide responses between the responders and non-responders, this finding suggests differences
in insulin sensitivity: Chronic insulin resistance may cause metabolic stress of residual β cells
rendering them susceptible to immune mediated damage. The contribution of metabolic factors
to immune therapeutic responses has not been reported within the drug-treatment group in earlier
immune therapy trials, but interestingly, we observed a similar trend in an analysis of 2 previous
trials of teplizumab that we conducted (data not reported)(1; 15). Although a trend for lower
HbA1c (< 6.0%), but not lower insulin usage, favoring response to abatacept was suggested
previously, (3) that analysis compared drug- and placebo-treated subjects, whereas our analysis
involved subjects within the drug-treated group.
In addition, we found differences in immune parameters in the responder vs non-
responder group. The decreased IFNγ-producing CD8+ and CCR4+CD4+ T cells at baseline in
responders suggest a lower frequency of Th1-like T cells, which may be contributory since a Th1
phenotype has been associated with pathogenic T cells.(23-25). In this exploratory analysis we
did not correct for multiple comparisons, and in addition, longitudinal studies of these subsets
and others that have been implicated as mediators of the effects of teplizumab, will be necessary
to understand the role of cellular responses in the clinical response.(29-31)
In summary, we found a robust effect of FcR-nonbinding anti-CD3 mAb in a subset of
patients with new-onset T1D. Within this subgroup, we found differences in metabolic and
immunologic parameters suggesting that both contribute to the efficacy that we observed. Our
studies support the potential value of this immunotherapeutic approach. The results highlight the
interactions between host factors and drug action, which ultimately determine the clinical value
of treatment.
Page 17 of 40 Diabetes
18
Author contributions: KCH, MRE, KDB, LK-E, SA, DP, PHS, JM had access to the raw data.
JAB analyzed data. All of the authors wrote the manuscript. KCH, SEG, MRE, PAG, CJG, WH
carried out the clinical trial. The corresponding author had full access to all of the data and the
final responsibility to submit for publication. The sponsor (Immune Tolerance Network and the
National Institutes of Allergy and Infectious Diseases) participated in study design, analysis, and
writing of the manuscript.
Conflict of interest: JAB has a patent on the teplizumab molecule. KCH has received grant
support from MacroGenics, Inc. SEG, MRE, PAG, CJG, WH, KDB, LK-E, SA, DP, PHS, JMcN
have no conflicts to declare.
Funding: This research was performed as a project of the Immune Tolerance Network (NIH
Contract #N01 AI15416), an international clinical research consortium headquartered at the
Benaroya Research Institute and supported by the National Institute of Allergy and Infectious
Diseases and the Juvenile Diabetes Research Foundation. Also supported by grants UL1
RR024131 and UL1 RR024139
Acknowledgements: Special thanks to Margaret Lund Fitzgibbon RN (NIAID). Other members
of the AbATE Study Team include: ITN, Melissa Johnson, Preeti Chugha PhD, and Tracia
Debnam; Yale University, Jennifer Sherr MD, Frank Waldron-Lynch MD, PhD, Linda Rink RN,
Kimberly Kunze, and Anna Wurtz; Benaroya Research Institute, Jennifer Bollyky MD and
Srinath Sanda MD; University of California, San Francisco, Stephen Rosenthal MD, Saleh Adi
MD, Christine Torok RN and Rebecca Wesch; Barbara Davis Center, Jenna Lungaro, Allison
Proto RN, Amy Wallace, and Kimber Westbrook; Pacific Northwest Research Institute, Rachel
Hervey. MacroGenics provided teplizumab. Lifescan Division of Johnson and Johnson provided
blood glucose monitoring meters and strips to participants. Dr. Kevan Herold is the guarantor of
Page 18 of 40Diabetes

19
this work and, as such, had full access to all the data in the study and takes responsibility for the
integrity of the data and the accuracy of the data analysis
Page 19 of 40 Diabetes
20
Table 1: Baseline characteristics
Teplizumab
treated
Control p-value [1]
N 52 25
Age (Years)* 12.7 (4.9) 12.3 (4.1) 0.86
8-12 (%) 65.4 60.0 0.67
13-17 (%) 26.9 36.0
18-30 (%) 7.7 4.0
Male (%) 53.8 64.0 0.47
Hispanic (%) 3.8 8.0 0.59
African American (%) 3.8 4.0 0.81
BMI (kg/m2)* 19.5 (3.77) 20.1 (4.15)
0.41
Days since diagnosis* 40.4 (8.3) 37.6 (9.0) 0.14
Insulin use (units/kg/d)* 0.39 (0.26) 0.39 (0.17) 0.75
HbA1c % [mmol/mol]* 7.43
(0.99)[57.7(10.9)] 7.70 (1.23)[60.7(13.5)]
0.40
C-peptide AUC
(nmol/L)* 0.72 (0.29) 0.67 (0.28)
0.41
GAD65
(% positive) 76.5 95.7
0.05
IA.2ic
(% positive) 98.0 95.7
0.53
MIAA
(% positive) 70.6 73.9
0.99
ZnT8
(% positive) 86.3 65.2
0.06
* Mean (SD)
Page 20 of 40Diabetes
21
[1] P-values for continuous variables are from the t-test, and p-values for categorical variables
are from Chi-square or Fisher’s Exact Test.
Page 21 of 40 Diabetes
22
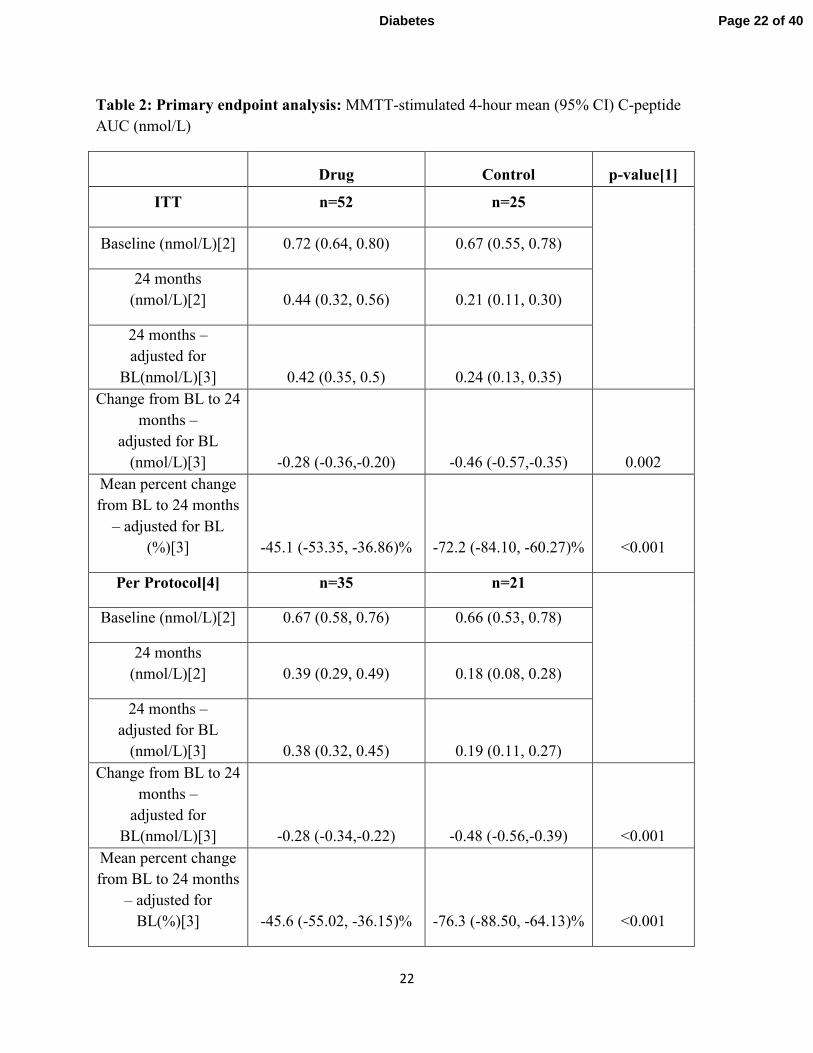
Table 2: Primary endpoint analysis: MMTT-stimulated 4-hour mean (95% CI) C-peptide
AUC (nmol/L)
Drug Control p-value[1]
ITT n=52 n=25
Baseline (nmol/L)[2] 0.72 (0.64, 0.80) 0.67 (0.55, 0.78)
24 months
(nmol/L)[2] 0.44 (0.32, 0.56) 0.21 (0.11, 0.30)
24 months –
adjusted for
BL(nmol/L)[3] 0.42 (0.35, 0.5) 0.24 (0.13, 0.35)
Change from BL to 24
months –
adjusted for BL
(nmol/L)[3] -0.28 (-0.36,-0.20) -0.46 (-0.57,-0.35) 0.002
Mean percent change
from BL to 24 months
– adjusted for BL
(%)[3] -45.1 (-53.35, -36.86)% -72.2 (-84.10, -60.27)% <0.001
Per Protocol[4] n=35 n=21
Baseline (nmol/L)[2] 0.67 (0.58, 0.76) 0.66 (0.53, 0.78)
24 months
(nmol/L)[2] 0.39 (0.29, 0.49) 0.18 (0.08, 0.28)
24 months –
adjusted for BL
(nmol/L)[3] 0.38 (0.32, 0.45) 0.19 (0.11, 0.27)
Change from BL to 24
months –
adjusted for
BL(nmol/L)[3] -0.28 (-0.34,-0.22) -0.48 (-0.56,-0.39) <0.001
Mean percent change
from BL to 24 months
– adjusted for
BL(%)[3] -45.6 (-55.02, -36.15)% -76.3 (-88.50, -64.13)% <0.001
Page 22 of 40Diabetes
23
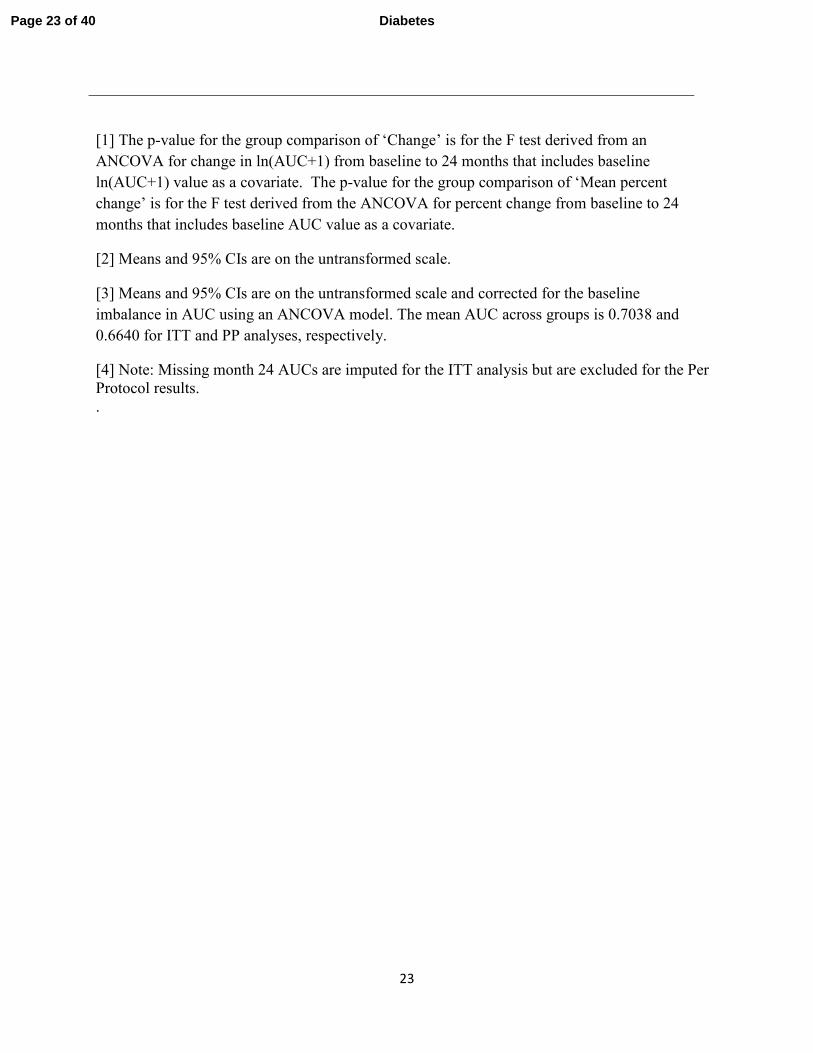
[1] The p-value for the group comparison of ‘Change’ is for the F test derived from an
ANCOVA for change in ln(AUC+1) from baseline to 24 months that includes baseline
ln(AUC+1) value as a covariate. The p-value for the group comparison of ‘Mean percent
change’ is for the F test derived from the ANCOVA for percent change from baseline to 24
months that includes baseline AUC value as a covariate.
[2] Means and 95% CIs are on the untransformed scale.
[3] Means and 95% CIs are on the untransformed scale and corrected for the baseline
imbalance in AUC using an ANCOVA model. The mean AUC across groups is 0.7038 and
0.6640 for ITT and PP analyses, respectively.
[4] Note: Missing month 24 AUCs are imputed for the ITT analysis but are excluded for the Per
Protocol results.
.
Page 23 of 40 Diabetes
24
Table 3: Immunologic features of responders at baseline
Cell Population* Responder
(n = 18#)
Non-Responder
(n = 21 or 22#)
P value
CCR4+ Naive CD4 T cells 12.6 (7.24) 17.5 (6.24) 0.047
CCR6+ Naïve CD4 T cells 6.8 (5.85) 9.8 (5.12) 0.044
CCR4+ Naïve CD8 T cells 14.4 (6.96) 19.4 (5.70) 0.029
CCR4+ Memory CD4 T cells 29.7 (7.56) 34.6 (7.95) 0.027
CD8 Effector memory T cells 6.5 (2.45) 4.8 (2.93) 0.017
CD38+ terminally
differentiated CD8 effector T
cells 82.7 (8.88) 76.5 (8.80) 0.011
CD8+ IFN-γ+ 8.9 (6.53) 14.7 (10.29) 0.033
*mean±SD
PBMCs from baseline visits were thawed and stained for viability and a combination of 25
markers, divided in panels of 6, for a 10-color flow experiment. FlowJo software (TreeStar, Inc.)
was used to sequentially gate the cell populations. The means (SD) are shown of percent cells
positive in their respective parent population (CD2+CD4+ or CD2+CD8+). Cell populations that
were significantly different between drug-treated responders and non-responders are listed.
#Samples were unavailable for subjects who did not meet minimal body weight for sampling for
mechanistic studies
Page 24 of 40Diabetes
25
Figure legends:
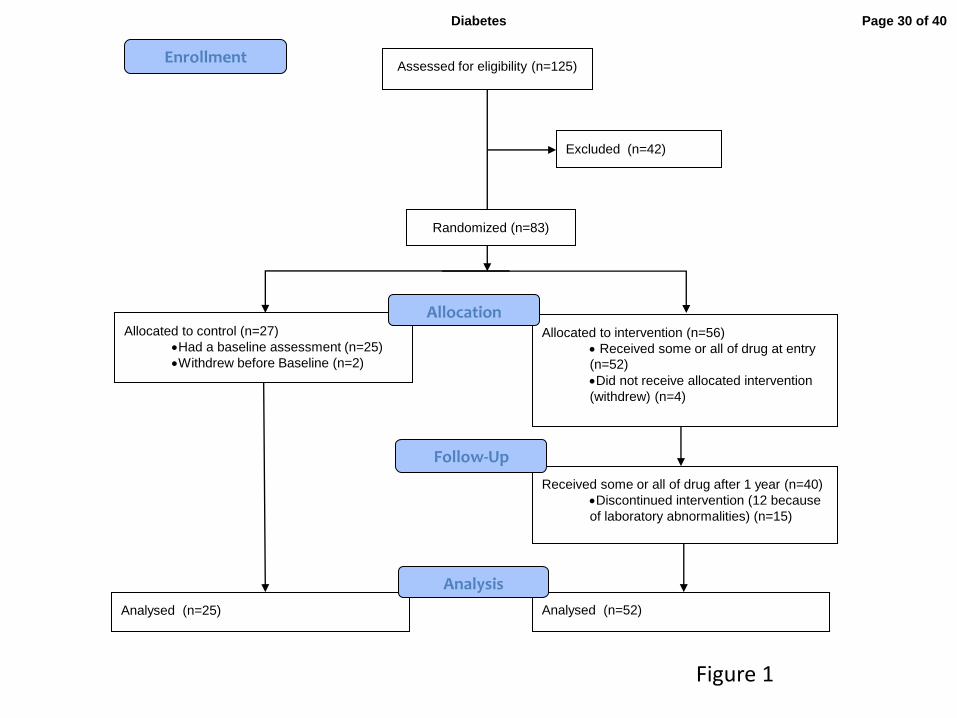
Figure 1: Enrollment, randomization and participation. One hundred twenty-five subjects
were screened and 83 were eligible for enrollment. The majority of subjects excluded failed to
meet entry criteria. Of 83 subjects randomized, 25 in the control group and 52 in the teplizumab
group underwent an MMTT at baseline, received the first dose of study drug (teplizumab group),
and are included in the ITT analysis. Of the subjects randomized to the teplizumab group, 12 did
not receive the second course of drug because of adverse events leading to discontinuation
during Cycle 1 (n=6), predefined laboratory abnormalities that precluded re-administration
(n=4), or were withdrawn (n=2). In addition, 3 of 40 subjects who started Cycle 2 discontinued
treatment due to adverse events. The reasons for drug discontinuation are listed in supplementary
table 1.
Figure 2: C-peptide responses in drug-treated and control subjects: (A) The mean ± 25th
and
75th
percentile of the C-peptide AUC (nmol/L) are shown for the drug and control groups
(***p=0.002; **p<0.02, ANCOVA for each time point). (B) Estimates and 95% CI from a
mixed effects model with fixed effects for treatment group and linear and quadratic trends over
time and random subject-level effects for intercepts and linear trends over time. Drug-treated
subjects are estimated to have a delay of decline in C-peptide by 15.9 months (i.e. would reach
control 6-month values 21.9 months after study entry). (C) Proportion of subjects with
detectable C-peptide (i.e. >0.05 nmol/L). The actual study dates that the MMTTs were
performed are shown. There was a significantly greater loss of detectable C-peptide secretion in
the control group at month 24 (p=0.002, χ2 test).
Page 25 of 40 Diabetes
26
Figure 3: Insulin use and hemoglobin A1c in drug and control groups (A) Average insulin
use in the 3 days prior to the visit was calculated (group means ± 25th
and 75th
percentiles,
*p<0.05, ***p<0.005; p<0.001 for overall trend at month 12, and p=0.022 at month 18 using
ANCOVA). (B) HbA1c levels in the drug and control groups (means ± 25th
and 75th
percentiles
are shown, *p<0.05).
Figure 4: Identification of clinical responders to teplizumab: (A) The cumulative frequency
of subjects and distribution of percent decrease from baseline C-peptide AUC at month 24. The
arrow shows the smallest percent loss of C-peptide AUC in the control group. (B) The C-peptide
AUC at each time point (means ± 25th
and 75th
percentile) is shown for the responders (red line)
and non-responders (green line) in the drug-treated group and for the control subjects (blue line).
***p<0.001 between responders and non-responders at each time point based on ANCOVAs.
Figure 5: Baseline clinical characteristics in responders versus non-responders. (A) Ladder
plot of covariates and clinical response: The effects of the indicated covariates on the ratio of log
odds of responder status and 95% CI are shown. The baseline HbA1c (p=0.011) and insulin use
(p= 0.004) were inversely associated with response. (B) Baseline insulin use and HbA1c in the
drug-treated subjects. The baseline insulin use and HbA1c are shown for the drug-treated
responders (red) and non-responders (green) (**p=0.004 and *p=0.011, respectively).
Page 26 of 40Diabetes
27
References
1. Herold KC, Gitelman SE, Masharani U, Hagopian W, Bisikirska B, Donaldson D, Rother K,
Diamond B, Harlan DM, Bluestone JA: A Single Course of Anti-CD3 Monoclonal Antibody
hOKT3{gamma}1(Ala-Ala) Results in Improvement in C-Peptide Responses and Clinical
Parameters for at Least 2 Years after Onset of Type 1 Diabetes. Diabetes 2005;54:1763-1769
2. Herold KC, Hagopian W, Auger JA, Poumian-Ruiz E, Taylor L, Donaldson D, Gitelman SE,
Harlan DM, Xu D, Zivin RA, Bluestone JA: Anti-CD3 monoclonal antibody in new-onset type 1
diabetes mellitus. N Engl J Med 2002;346:1692-1698.
3. Orban T, Bundy B, Becker DJ, Dimeglio LA, Gitelman SE, Goland R, Gottlieb PA,
Greenbaum CJ, Marks JB, Monzavi R, Moran A, Raskin P, Rodriguez H, Russell WE, Schatz D,
Wherrett D, Wilson DM, Krischer JP, Skyler JS: Co-stimulation modulation with abatacept in
patients with recent-onset type 1 diabetes: a randomised, double-blind, placebo-controlled trial.
Lancet 2011;412-9.
4. Pescovitz MD, Greenbaum CJ, Krause-Steinrauf H, Becker DJ, Gitelman SE, Goland R,
Gottlieb PA, Marks JB, McGee PF, Moran AM, Raskin P, Rodriguez H, Schatz DA, Wherrett D,
Wilson DM, Lachin JM, Skyler JS: Rituximab, B-lymphocyte depletion, and preservation of
beta-cell function. N Engl J Med 2009;361:2143-2152
5. Keymeulen B, Vandemeulebroucke E, Ziegler AG, Mathieu C, Kaufman L, Hale G, Gorus F,
Goldman M, Walter M, Candon S, Schandene L, Crenier L, De Block C, Seigneurin JM, De
Pauw P, Pierard D, Weets I, Rebello P, Bird P, Berrie E, Frewin M, Waldmann H, Bach JF,
Pipeleers D, Chatenoud L: Insulin needs after CD3-antibody therapy in new-onset type 1
diabetes. N Engl J Med 2005;352:2598-2608
6. Herold KC, Gitelman S, Greenbaum C, Puck J, Hagopian W, Gottlieb P, Sayre P, Bianchine
P, Wong E, Seyfert-Margolis V, Bourcier K, Bluestone JA: Treatment of patients with new onset
Type 1 diabetes with a single course of anti-CD3 mAb teplizumab preserves insulin production
for up to 5 years. Clin Immunol 2009;166-73.
7. Keymeulen B, Walter M, Mathieu C, Kaufman L, Gorus F, Hilbrands R, Vandemeulebroucke
E, Van de Velde U, Crenier L, De Block C, Candon S, Waldmann H, Ziegler AG, Chatenoud L,
Pipeleers D: Four-year metabolic outcome of a randomised controlled CD3-antibody trial in
recent-onset type 1 diabetic patients depends on their age and baseline residual beta cell mass.
Diabetologia 2010;53:614-623
8. Press RR, de Fijter JW, Guchelaar HJ: Individualizing calcineurin inhibitor therapy in renal
transplantation--current limitations and perspectives. Curr Pharm Des 2010;16:176-186
9. Bougneres PF, Landais P, Boisson C, Carel JC, Frament N, Boitard C, Chaussain JL, Bach JF:
Limited duration of remission of insulin dependency in children with recent overt type I diabetes
treated with low-dose cyclosporin. Diabetes 1990;39:1264-1272
10. Bertin-Maghit S, Pang D, O'Sullivan B, Best S, Duggan E, Paul S, Thomas H, Kay TW,
Harrison LC, Steptoe R, Thomas R: Interleukin-1beta produced in response to islet autoantigen
presentation differentiates T-helper 17 cells at the expense of regulatory T-cells: Implications for
the timing of tolerizing immunotherapy. Diabetes 2011;60:248-257
11. Yang XO, Nurieva R, Martinez GJ, Kang HS, Chung Y, Pappu BP, Shah B, Chang SH,
Schluns KS, Watowich SS, Feng XH, Jetten AM, Dong C: Molecular antagonism and plasticity
of regulatory and inflammatory T cell programs. Immunity 2008;29:44-56
Page 27 of 40 Diabetes
28
12. Larsen CM, Faulenbach M, Vaag A, Volund A, Seifert B, Mandrup-Poulsen T, Donath MY:
A Randomized, Placebo-controlled Trial of Interleukin-1 receptor Antagonist in type 2 Diabetes
Mellitus. New England Journal of Medicine 2007;356:1517-26.
13. Effect of intensive therapy on residual beta-cell function in patients with type 1 diabetes in
the diabetes control and complications trial. A randomized, controlled trial. The Diabetes Control
and Complications Trial Research Group. Ann Intern Med 1998;128:517-523
14. Sherry N, Hagopian W, Ludvigsson J, Jain SM, Wahlen J, Ferry RJ, Jr., Bode B, Aronoff S,
Holland C, Carlin D, King KL, Wilder RL, Pillemer S, Bonvini E, Johnson S, Stein KE, Koenig
S, Herold KC, Daifotis AG: Teplizumab for treatment of type 1 diabetes (Protege study): 1-year
results from a randomised, placebo-controlled trial. Lancet 2011; 378:487-97.
15. Herold KC, Gitelman SE, Willi SM, Gottlieb PA, Waldron-Lynch F, Devine L, Sherr J,
Rosenthal SM, Adi S, Jalaludin MY, Michels AW, Dziura J, Bluestone JA: Teplizumab
treatment may improve C-peptide responses in participants with type 1 diabetes after the new-
onset period: a randomised controlled trial. Diabetologia 2013; 56:391-400.
16. Greenbaum CJ, Beam CA, Boulware D, Gitelman SE, Gottlieb PA, Herold KC, Lachin JM,
McGee P, Palmer JP, Pescovitz MD, Krause-Steinrauf H, Skyler JS, Sosenko JM: Fall in C-
peptide During First 2 Years From Diagnosis: Evidence of at Least Two Distinct Phases From
Composite TrialNet Data. Diabetes 2012;61: 2066-73.
17. Herold KC, Pescovitz MD, McGee P, Krause-Steinrauf H, Spain LM, Bourcier K, Asare A,
Liu Z, Lachin JM, Dosch HM: Increased T Cell Proliferative Responses to Islet Antigens
Identify Clinical Responders to Anti-CD20 Monoclonal Antibody (Rituximab) Therapy in Type
1 Diabetes. J Immunol 2011;187:1998-2005
18. Gerriets VA, Rathmell JC: Metabolic pathways in T cell fate and function. Trends Immunol
2012;33:168-173
19. Cham CM, Gajewski TF: Glucose availability regulates IFN-gamma production and p70S6
kinase activation in CD8+ effector T cells. J Immunol 2005;174:4670-4677
20. Mandrup-Poulsen T, Spinas GA, Prowse SJ, Hansen BS, Jorgensen DW, Bendtzen K,
Nielsen JH, Nerup J: Islet cytotoxicity of interleukin 1. Influence of culture conditions and islet
donor characteristics. Diabetes 1987;36:641-647
21. Maedler K, Sergeev P, Ris F, Oberholzer J, Joller-Jemelka HI, Spinas GA, Kaiser N, Halban
PA, Donath MY: Glucose-induced beta cell production of IL-1beta contributes to glucotoxicity
in human pancreatic islets. J Clin Invest 2002;110:851-860
22. Robertson RP, Harmon J, Tran PO, Tanaka Y, Takahashi H: Glucose toxicity in beta-cells:
type 2 diabetes, good radicals gone bad, and the glutathione connection. Diabetes 2003;52:581-
587
23. Antonelli A, Fallahi P, Ferrari SM, Pupilli C, d'Annunzio G, Lorini R, Vanelli M, Ferrannini
E: Serum Th1 (CXCL10) and Th2 (CCL2) chemokine levels in children with newly diagnosed
Type 1 diabetes: a longitudinal study. Diabet Med 2008;25:1349-1353
24. Coppieters KT, Dotta F, Amirian N, Campbell PD, Kay TW, Atkinson MA, Roep BO, von
Herrath MG: Demonstration of islet-autoreactive CD8 T cells in insulitic lesions from recent
onset and long-term type 1 diabetes patients. J Exp Med 2012;209:51-60
25. Itoh N, Hanafusa T, Miyazaki A, Miyagawa J, Yamagata K, Yamamoto K, Waguri M,
Imagawa A, Tamura S, Inada M, et al.: Mononuclear cell infiltration and its relation to the
expression of major histocompatibility complex antigens and adhesion molecules in pancreas
biopsy specimens from newly diagnosed insulin-dependent diabetes mellitus patients. J Clin
Invest 1993;92:2313-2322
Page 28 of 40Diabetes
29
26. Ablamunits V, Bisikirska B, Herold KC: Acquisition of regulatory function by human
CD8(+) T cells treated with anti-CD3 antibody requires TNF. Eur J Immunol 2010;40:2891-
2901
27. Ablamunits V, Henegariu O, Preston-Hurlburt P, Herold KC: NKG2A is a marker for
acquisition of regulatory function by human CD8+ T cells activated with anti-CD3 antibody. Eur
J Immunol 2011;41:1832-1842
28. Bisikirska B, Colgan J, Luban J, Bluestone JA, Herold KC: TCR stimulation with modified
anti-CD3 mAb expands CD8 T cell population and induces CD8CD25 Tregs. J Clin Invest
2005;115:2904-2913
29. Belghith M, Bluestone JA, Barriot S, Megret J, Bach JF, Chatenoud L: TGF-beta-dependent
mechanisms mediate restoration of self-tolerance induced by antibodies to CD3 in overt
autoimmune diabetes. Nat Med 2003;9:1202-1208
30. You S, Leforban B, Garcia C, Bach JF, Bluestone JA, Chatenoud L: Adaptive TGF-beta-
dependent regulatory T cells control autoimmune diabetes and are a privileged target of anti-
CD3 antibody treatment. Proc Natl Acad Sci U S A 2007;104:6335-6340
31. Waldron-Lynch F, Henegariu O, Deng S, Preston-Hurlburt P, Tooley J, Flavell R, Herold
KC: Teplizumab induces human gut-tropic regulatory cells in humanized mice and patients. Sci
Transl Med 2012;4:118ra112
Page 29 of 40 Diabetes
Assessed for eligibility (n=125)
Excluded (n=42)
Analysed (n=25)
Allocated to control (n=27)
Had a baseline assessment (n=25)
Withdrew before Baseline (n=2)
Received some or all of drug after 1 year (n=40)
Discontinued intervention (12 because
of laboratory abnormalities) (n=15)
Allocated to intervention (n=56)
Received some or all of drug at entry
(n=52) Did not receive allocated intervention
(withdrew) (n=4)
Analysed (n=52)
Allocation
Analysis
Follow-Up
Randomized (n=83)
Enrollment
Figure 1
Page 30 of 40Diabetes
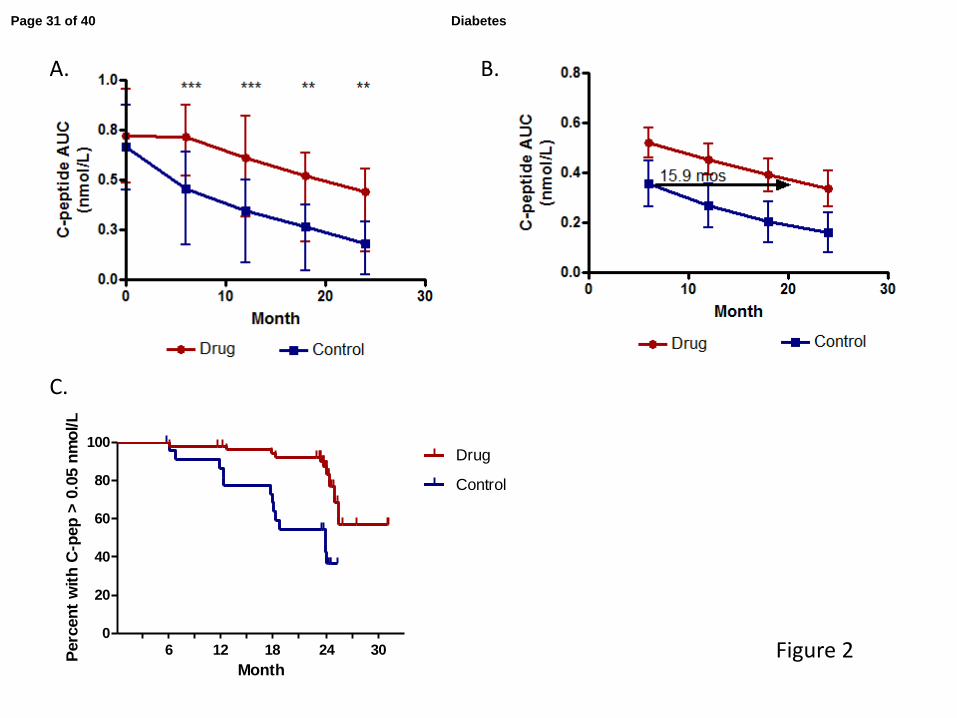
Figure 2
A. B.
Month
Perc
en
t w
ith
C-p
ep
> 0
.05 n
mo
l/L
0
20
40
60
80
100
Control
Drug
1812 24 306
C.
Page 31 of 40 Diabetes
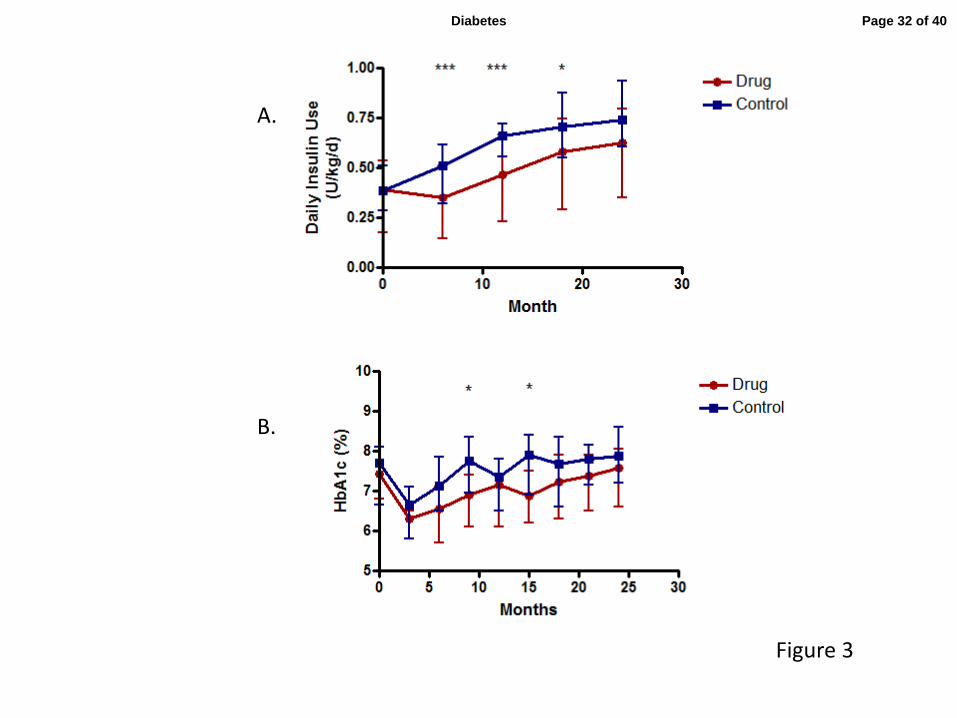
Figure 3
A.
B.
Page 32 of 40Diabetes
-100 -75 -50 -25 0 25 50 75 1000
10
20
30
40
50
Control
Drug
Percent Decrease from Baseline AUC C-peptide
Cu
mu
lati
ve F
req
uen
cy o
f S
ub
jects
Figure 4
A.
B.
Page 33 of 40 Diabetes
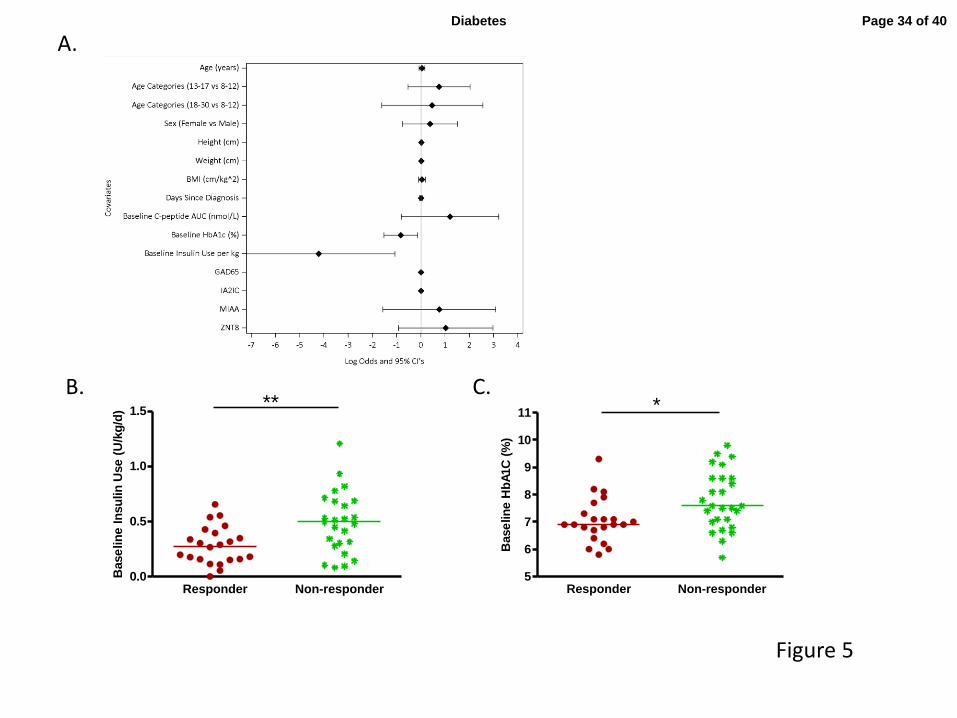
Figure 5
Responder Non-responder0.0
0.5
1.0
1.5
Base
lin
e In
su
lin
Use
(U
/kg
/d) **
Responder Non-responder5
6
7
8
9
10
11
Base
lin
e H
bA
1C
(%
)
*
A.
B. C.
Page 34 of 40Diabetes
Yr 1 Yr 20
100
200
300
400
ControlDrugG
AD
65 (
ind
ex)
Yr 1 Yr 20
100
200
300
400
ControlDrug
IA2ic
(in
dex)
Yr 1 Yr 20.0
0.2
0.4
0.6
0.8
1.0
1.2
ControlDrug
mIA
A (
ind
ex)
Yr 1 Yr 20.0
0.1
0.2
0.3
ControlDrug
*
Zn
T8 (
ind
ex)
A. B.
C. D.
Supplemental Figure 1
Supplemental Figure 1: Autoantibody indices in drug-treated and control subjects at year 1
and year 2: No significant differences in the levels of any of the biochemical autoantibodies tested
(A: GAD65, B: IA.2ic, C: mIAA and D: ZnT8) were found between the treatment groups at
baseline. No significant drug treatment effects were observed at year 1 or year 2 for 3 of the 4
autoantibodies, but the index of ZnT8 was reduced at year 1 (p=0.049) in the drug-treated subjects
compared to the untreated controls (p=0.049).
Page 35 of 40 Diabetes
1
Supplementary Tables
Supplementary table 1: Reasons for discontinuation of drug administration
Reason N Grade event
Withdrew Consent 1 N/A
Investigator decision 1 N/A
IgE antibodies to teplizumab 1 N/A
Increased liver function tests 2 All grade 2
Increased INR 1 1
Thrombocytopenia 1 1
Hyperbilirubinemia 1 1
Low CD4 count 3 All grade 2
Neutropenia 1 3
Decreased hemoglobin 1 1
Fever with cytokine release
syndrome
1 3
Hypotension with cytokine
release syndrome
1 Hypotension was grade 2
and the CRS was grade 3
* Graded by Common Terminology Criteria for Adverse Events (CTCAE) v4.0
Page 36 of 40Diabetes
2
Supplementary Table 2A: Serious adverse events
Teplizumab Control
Relationship Total Definite Probable Unlikely Unrelated Total
N 11 2
Injury,
traumatic
injuries
3 3 0
Diabetic
ketoacidosis
1 1 0
Diarrhea 1 1 0
Cytokine
release
syndrome
2 1 1 0
Infection 2 1 1 0
Hallucinations 0 1
Hypoglycemia 2 2 1
Page 37 of 40 Diabetes
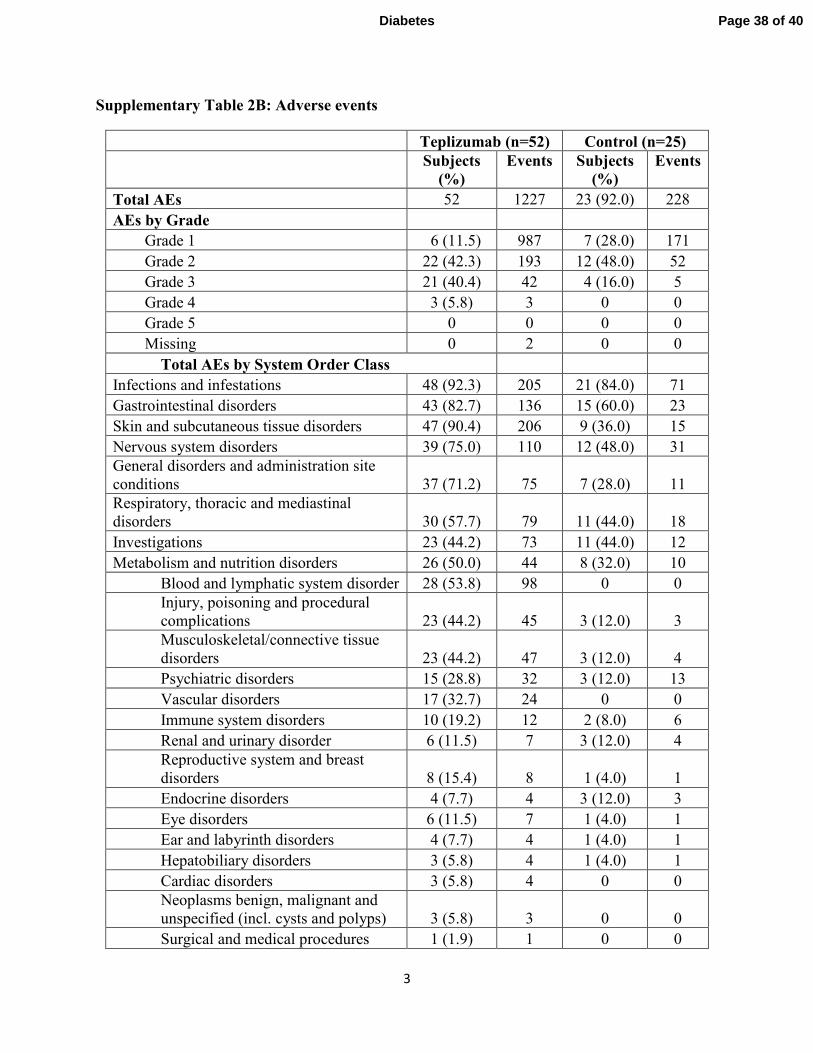
3
Supplementary Table 2B: Adverse events
Teplizumab (n=52) Control (n=25)
Subjects
(%)
Events Subjects
(%)
Events
Total AEs 52 1227 23 (92.0) 228
AEs by Grade
Grade 1 6 (11.5) 987 7 (28.0) 171
Grade 2 22 (42.3) 193 12 (48.0) 52
Grade 3 21 (40.4) 42 4 (16.0) 5
Grade 4 3 (5.8) 3 0 0
Grade 5 0 0 0 0
Missing 0 2 0 0
Total AEs by System Order Class
Infections and infestations 48 (92.3) 205 21 (84.0) 71
Gastrointestinal disorders 43 (82.7) 136 15 (60.0) 23
Skin and subcutaneous tissue disorders 47 (90.4) 206 9 (36.0) 15
Nervous system disorders 39 (75.0) 110 12 (48.0) 31
General disorders and administration site
conditions 37 (71.2) 75 7 (28.0) 11
Respiratory, thoracic and mediastinal
disorders 30 (57.7) 79 11 (44.0) 18
Investigations 23 (44.2) 73 11 (44.0) 12
Metabolism and nutrition disorders 26 (50.0) 44 8 (32.0) 10
Blood and lymphatic system disorder 28 (53.8) 98 0 0
Injury, poisoning and procedural
complications 23 (44.2) 45 3 (12.0) 3
Musculoskeletal/connective tissue
disorders 23 (44.2) 47 3 (12.0) 4
Psychiatric disorders 15 (28.8) 32 3 (12.0) 13
Vascular disorders 17 (32.7) 24 0 0
Immune system disorders 10 (19.2) 12 2 (8.0) 6
Renal and urinary disorder 6 (11.5) 7 3 (12.0) 4
Reproductive system and breast
disorders 8 (15.4) 8 1 (4.0) 1
Endocrine disorders 4 (7.7) 4 3 (12.0) 3
Eye disorders 6 (11.5) 7 1 (4.0) 1
Ear and labyrinth disorders 4 (7.7) 4 1 (4.0) 1
Hepatobiliary disorders 3 (5.8) 4 1 (4.0) 1
Cardiac disorders 3 (5.8) 4 0 0
Neoplasms benign, malignant and
unspecified (incl. cysts and polyps) 3 (5.8) 3 0 0
Surgical and medical procedures 1 (1.9) 1 0 0
Page 38 of 40Diabetes
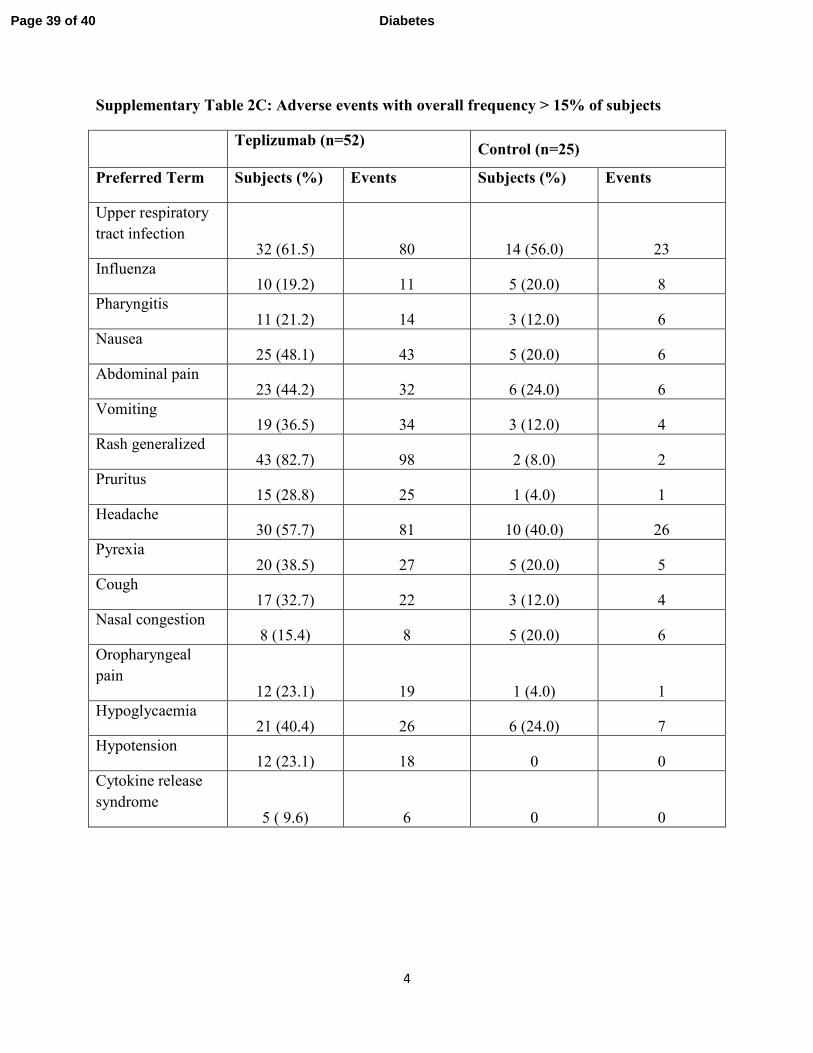
4
Supplementary Table 2C: Adverse events with overall frequency > 15% of subjects
Teplizumab (n=52)
Control (n=25)
Preferred Term Subjects (%) Events Subjects (%) Events
Upper respiratory
tract infection 32 (61.5) 80 14 (56.0) 23
Influenza 10 (19.2) 11 5 (20.0) 8
Pharyngitis 11 (21.2) 14 3 (12.0) 6
Nausea
25 (48.1) 43 5 (20.0) 6
Abdominal pain 23 (44.2) 32 6 (24.0) 6
Vomiting
19 (36.5) 34 3 (12.0) 4
Rash generalized
43 (82.7) 98 2 (8.0) 2
Pruritus 15 (28.8) 25 1 (4.0) 1
Headache
30 (57.7) 81 10 (40.0) 26
Pyrexia 20 (38.5) 27 5 (20.0) 5
Cough 17 (32.7) 22 3 (12.0) 4
Nasal congestion 8 (15.4) 8 5 (20.0) 6
Oropharyngeal
pain 12 (23.1) 19 1 (4.0) 1
Hypoglycaemia
21 (40.4) 26 6 (24.0) 7
Hypotension 12 (23.1) 18 0 0
Cytokine release
syndrome 5 ( 9.6) 6 0 0
Page 39 of 40 Diabetes
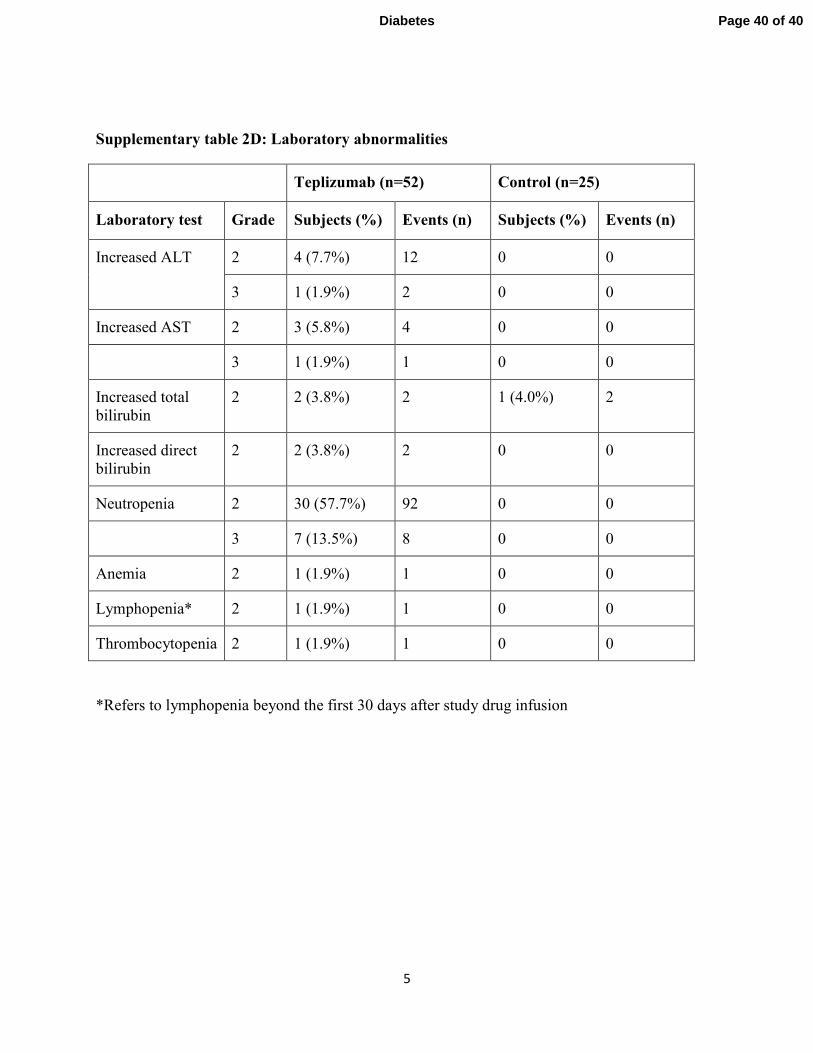
5
Supplementary table 2D: Laboratory abnormalities
Teplizumab (n=52) Control (n=25)
Laboratory test Grade Subjects (%) Events (n) Subjects (%) Events (n)
Increased ALT 2 4 (7.7%) 12 0 0
3 1 (1.9%) 2 0 0
Increased AST 2 3 (5.8%) 4 0 0
3 1 (1.9%) 1 0 0
Increased total
bilirubin
2 2 (3.8%) 2 1 (4.0%) 2
Increased direct
bilirubin
2 2 (3.8%) 2 0 0
Neutropenia 2 30 (57.7%) 92 0 0
3 7 (13.5%) 8 0 0
Anemia 2 1 (1.9%) 1 0 0
Lymphopenia* 2 1 (1.9%) 1 0 0
Thrombocytopenia 2 1 (1.9%) 1 0 0
*Refers to lymphopenia beyond the first 30 days after study drug infusion
Page 40 of 40Diabetes