Embed Size (px)
Citation preview
Page 1
First Order Modeling of CannonFire Out-of-Battery (FOOB) Recoil Dynamics
Presented at the
39th Annual Guns & Ammunition/Missiles & Rockets
Symposium & Exhibition
13-16 April 2004Baltimore, Maryland
David C. Rutledge, Ph.D.
Jeffrey V. IrelandUnited Defense
Page 2
Motivation for FOOB Analysis
• Transformation initiatives: Lightweight vehicles with high performance weapon systems
• Firing high performance cannon imparts a large acceleration on the vehicle and crew
• These accelerations must be managed for the vehicle and crew to fight effectively
• Fire Out-of-Battery (FOOB) analysis is an important tool in designing towards this goal
Page 3
• This presentation will describe the FOOB analysis for a conceptual 105-mm cannon
• Developed an equation-based parametric model to predict performance envelope for an ideal FOOB cannon
• Used chamber pressure data from an APG FOOB test firing to validate model
• Used data from Interior Ballistic High-Velocity Gun 2 (IBHVG2) interior ballistic model to generate pressure profile for highest energy round
• Inserted profile into parametric model to predict performance envelope for highest energy round
Overall Description of FOOB Analysis

Page 4
Cannon operation can be broken into 3 phases:
1. Time from unlatching to round firing – cannon accelerates forward
2. Time from firing to end of firing impulse – cannon decelerates to zero velocity while reaching full stroke, then accelerates backward
3. Time from end of impulse to relatching – cannon decelerates
Phases of FOOB Cannon Operation

Page 5
• This is a spreadsheet based parametric calculation
• Peak trunnion force is what determines the peak crew acceleration
• Forward force applied to the trunnion when the cannon is moving forward is less than or equal to the forward force applied to the trunnion when the canon is moving rearward
• Force ratio is the ratio of those two forces• Trunnion force-time history is optimized using
solver so cannon barely has enough energy to relatch
• Model runs made for different values of recoil stroke, force ratio, and elevation angle
• Assume that there are no frictional or other energy losses
Detailed Description of FOOB Calculation
Page 6
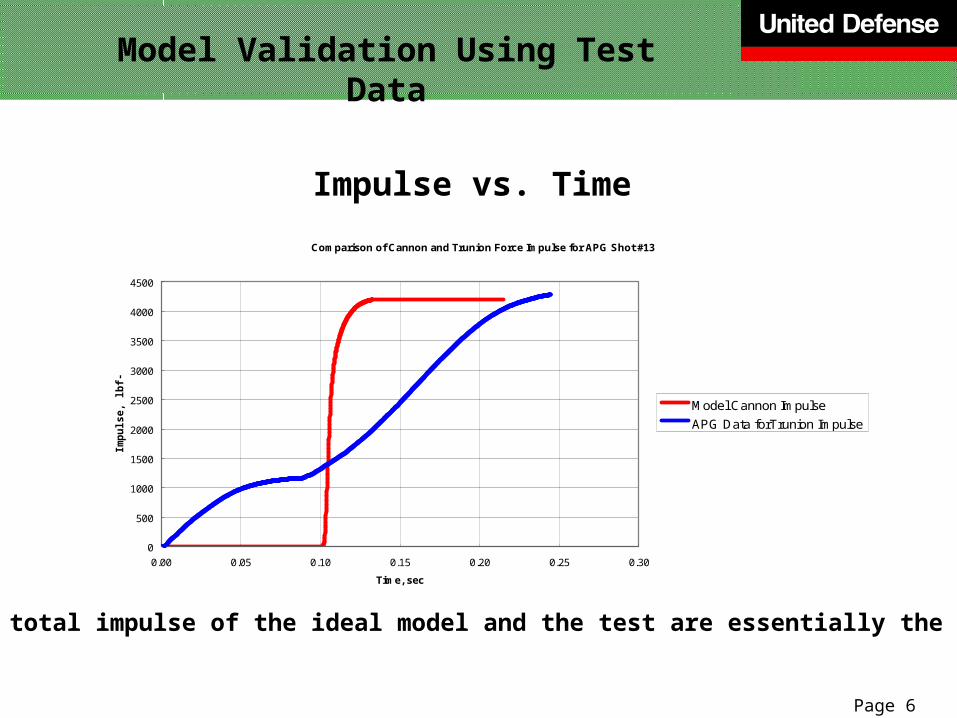
Impulse vs. Time
Model Validation Using Test Data
Comparison of Cannon and Trunion Force Impulse for APG Shot #13
0
500
1000
1500
2000
2500
3000
3500
4000
4500
0.00 0.05 0.10 0.15 0.20 0.25 0.30
Time, sec
Imp
uls
e,
lbf-
se
c
Model Cannon Impulse
APG Data forTrunion Impulse
The total impulse of the ideal model and the test are essentially the same

Page 7
Model Validation Using Test Data
Trunnion Force vs. Time
Comparison of Model and Data Recoil Force for APG Shot #13
-5000
0
5000
10000
15000
20000
25000
30000
35000
40000
0.00 0.05 0.10 0.15 0.20 0.25 0.30
Time, sec
Tru
nn
ion
Fo
rce
, lb
f
Model Trunion Force
APG Data for Trunion Force
The ideal model force–time curve is rectangular, (i.e., the force is not constant with respect to time)
Page 8
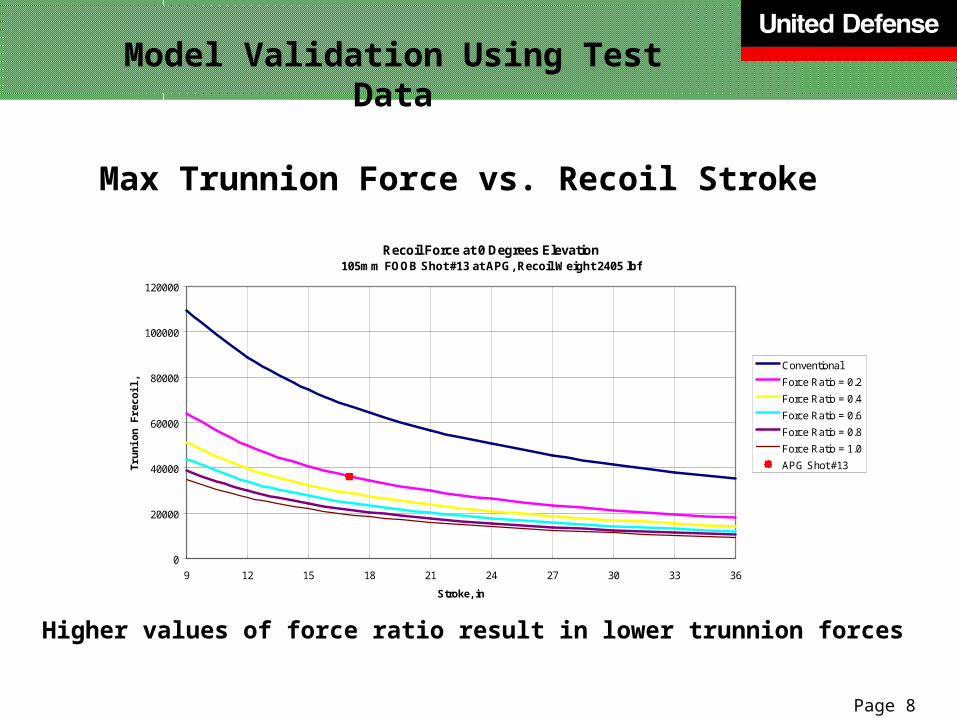
Max Trunnion Force vs. Recoil Stroke
Model Validation Using Test Data
Recoil Force at 0 Degrees Elevation105mm FOOB Shot #13 at APG, Recoil Weight 2405 lbf
0
20000
40000
60000
80000
100000
120000
9 12 15 18 21 24 27 30 33 36
Stroke, in
Tru
nio
n F
rec
oil
, lb
f
Conventional
Force Ratio = 0.2
Force Ratio = 0.4
Force Ratio = 0.6
Force Ratio = 0.8
Force Ratio = 1.0
APG Shot #13
Higher values of force ratio result in lower trunnion forces

Page 9
• Model envelope shows results of an ideal system, forming a lower bound on actual system results
• Test forces are higher than model predicted forces since test forces are not rectangular
• Even well engineered conventional recoil systems will have a significantly higher trunnion force than predicted
• Further model refinement would yield results closer to the test data. As a first approximation, the model times a multiplying factor predicts a real gun’s performance
Results of Model Validation

Page 10
• The model is next used to predict the trunnion loads for the highest impulse round planned for the conceptual 105-mm cannon
• IBHVG2 run generated a ballistic pressure profile, based on the known parameters for the highest impulse round (units not shown)
• FOOB model uses this as part of its input deck, along with other parameters such as recoiling mass, recoil stroke, and bore diameter
• Results are then plotted for different strokes and force ratios
Model for Highest Impulse Round

Page 11
Highest Impulse Pressure Curve
Impulse Pressure and ForceKE Round, Recoil Weight 2828 lbf
0.00 0.01 0.02 0.03 0.04 0.05 0.06 0.07 0.08 0.09
time, sec
Pressure, psiImpulse, lbf-sec
Proprietary data: Pressure and impulse values not shown

Page 12
Highest Impulse Round at -10 Degrees Elevation
Max Trunnion Force vs. Stroke
Recoil Force at -10 Degrees ElevationKE Round, Recoil Weight 2828 lbf
0
20000
40000
60000
80000
100000
120000
140000
15 18 21 24 27 30 33 36
Stroke, in
Fre
co
il,
lbf
Conventional
Force Ratio = 0.2
Force Ratio = 0.4
Force Ratio = 0.6
Force Ratio = 0.8
Force Ratio = 1.0

Page 13
Max Trunnion Force vs. Stroke
Highest Impulse Round at +20 Degrees Elevation
Recoil Force at 20 Degrees ElevationKE Round, Recoil Weight 2828 lbf
0
20000
40000
60000
80000
100000
120000
140000
15 18 21 24 27 30 33 36
Stroke, in
Tru
nio
n F
rec
oil
, lb
f Conventional
Force Ratio = 0.2
Force Ratio = 0.4
Force Ratio = 0.6
Force Ratio = 0.8
Force Ratio = 1.0
Cannon elevation has minimal effect on maximum trunnion force
Page 14
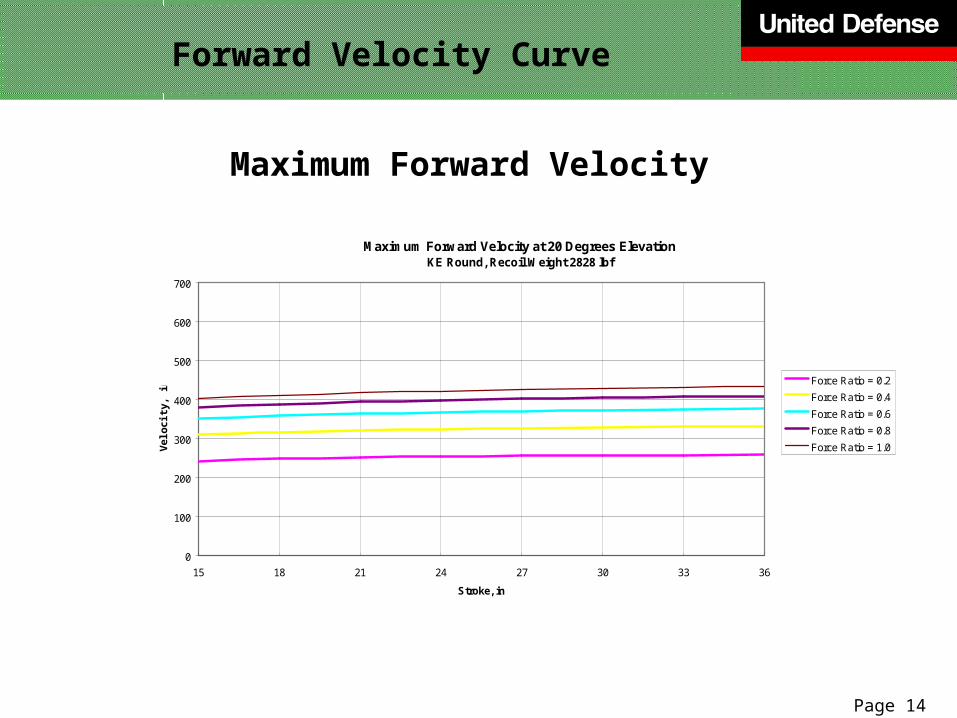
Forward Velocity Curve
Maximum Forward Velocity
Maximum Forward Velocity at 20 Degrees ElevationKE Round, Recoil Weight 2828 lbf
0
100
200
300
400
500
600
700
15 18 21 24 27 30 33 36
Stroke, in
Ve
loc
ity,
in
/s
Force Ratio = 0.2
Force Ratio = 0.4
Force Ratio = 0.6
Force Ratio = 0.8
Force Ratio = 1.0

Page 15
Return Velocity Curve
Maximum Return Velocity
Maximum Return Velocity at 20 Degrees ElevationKE Round, Recoil Weight 2828 lbf
0
100
200
300
400
500
600
700
15 18 21 24 27 30 33 36
Stroke, in
Ve
loc
ity,
in
/se
c
Conventional
Force Ratio = 0.2
Force Ratio = 0.4
Force Ratio = 0.6
Force Ratio = 0.8
Force Ratio = 1.0
Return velocity is significantly higher than forward velocity
Page 16
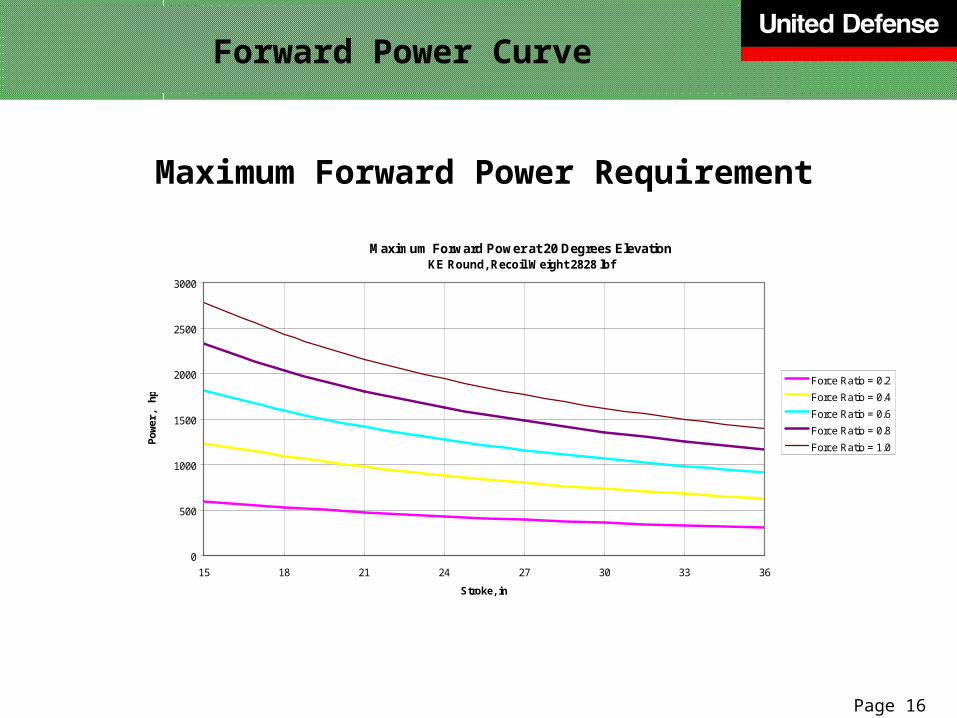
Forward Power Curve
Maximum Forward Power Requirement
Maximum Forward Power at 20 Degrees ElevationKE Round, Recoil Weight 2828 lbf
0
500
1000
1500
2000
2500
3000
15 18 21 24 27 30 33 36
Stroke, in
Po
we
r, h
p
Force Ratio = 0.2
Force Ratio = 0.4
Force Ratio = 0.6
Force Ratio = 0.8
Force Ratio = 1.0
Page 17
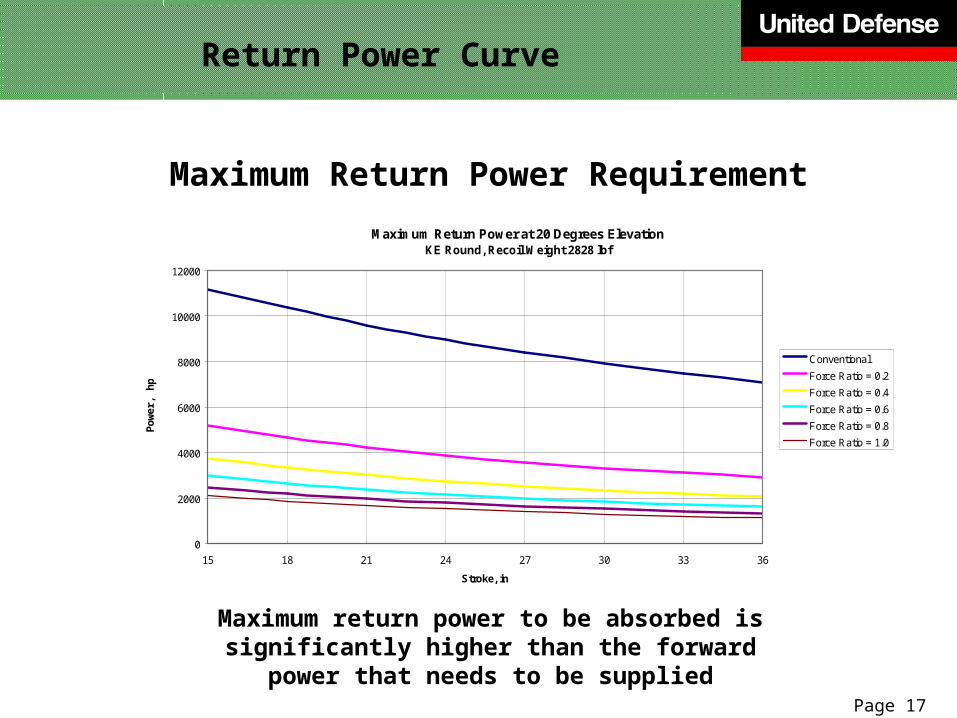
Maximum Return Power Requirement
Return Power Curve
Maximum Return Power at 20 Degrees ElevationKE Round, Recoil Weight 2828 lbf
0
2000
4000
6000
8000
10000
12000
15 18 21 24 27 30 33 36
Stroke, in
Po
we
r, h
p
Conventional
Force Ratio = 0.2
Force Ratio = 0.4
Force Ratio = 0.6
Force Ratio = 0.8
Force Ratio = 1.0
Maximum return power to be absorbed is significantly higher than the forward power that
needs to be supplied

Page 18
Displacement Position at Firing
(From In-Battery Position)
Displacement at Firing at 20 Degrees ElevationKE Round, Recoil Weight 2828 lbf
0.0
0.2
0.4
0.6
0.8
1.0
1.2
1.4
1.6
1.8
2.0
15 18 21 24 27 30 33 36
Stroke, in
Dis
pla
ce
me
nt,
in Force Ratio = 0.2
Force Ratio = 0.4
Force Ratio = 0.6
Force Ratio = 0.8
Force Ratio = 1.0
Displacement from in-battery position at firing is greater for higher values of force ratio

Page 19
• Increased recoil stroke and force ratio are critical towards reducing trunnion force
• Even a small force ratio can greatly reduce trunnion force
• Stroke influence is greatest for short recoil stroke designs
• Longer recoil strokes minimize the trunnion force by allowing higher forward velocities (as opposed to higher masses) to generate forward momentum
• The power to accelerate the cannon forward can be generated from the stored recoil energy of the previous shot.
• A percentage of both forward and return power will be converted into heat, which must also be managed
Analysis of Results: Highest Impulse

Page 20
• Calculations can be performed for conventional cannons as well as FOOB cannons by varying the initial conditions (no forward momentum at initiation)
• Analysis results will be more accurate as a cannon design matures
• Limited test results will allow increased model validation and refinement
• This model is also used to predict forces and firing times for the lower impulse rounds (see backup slides)
Analysis of Results: General

Page 21
Questions?
End of Presentation

Page 22
Back-up Slides
Back-upSlides

Page 23
Misfire Deceleration Distance
Decelerating Distance for FOOB Misfire
0
50000
100000
150000
200000
0 3 6 9 12 15
Distance, in
Ret
ard
ing
Fo
rce,
lbf
Force = Frecoil
Ratio = 0.2
Ratio = 0.4
Ratio = 0.6
Ratio = 0.8
Ratio = 1.0

Page 24
• The model is used to predict the trunnion loads for the cargo round using the same approach as before approach:– The cargo round has a lower impulse
– The cargo round is fired at higher elevation angles
Model for Cargo Round

Page 25
Cargo Round Pressure Curve
Impulse Pressure and ForceCargo Round, Recoil Weight 2828 lbf
0.00 0.01 0.02 0.03 0.04 0.05 0.06 0.07 0.08 0.09 0.10
time, sec
Pressure, psiImpulse, lbf-sec

Page 26
Cargo Round at 0 Degree Elevation
Trunnion Force vs. Stroke
Recoil Force at 0 Degrees ElevationCargo Round, Recoil Weight 2828 lbf
0
10000
20000
30000
40000
50000
60000
15 18 21 24 27 30 33 36
Stroke, in
Fre
co
il,
lbf
Conventional
Force Ratio = 0.2
Force Ratio = 0.4
Force Ratio = 0.6
Force Ratio = 0.8
Force Ratio = 1.0

Page 27
Trunnion Force vs. Stroke
Cargo Round at +55 Degrees Elevation
Recoil Force at 55 Degrees ElevationCargo Round, Recoil Weight 2828 lbf
0
10000
20000
30000
40000
50000
60000
15 18 21 24 27 30 33 36
Stroke, in
Tru
nio
n F
rec
oil
, lb
f Conventional
Force Ratio = 0.2
Force Ratio = 0.4
Force Ratio = 0.6
Force Ratio = 0.8
Force Ratio = 1.0

Page 28
Forward Velocity Curve
To minimize the trunnion force, higher velocities are required for longer stroke values
Maximum Forward Velocity
Maximum Forward Velocity at 55 Degrees ElevationCargo Round, Recoil Weight 2828 lbf
0
50
100
150
200
250
300
350
400
450
15 18 21 24 27 30 33 36
Stroke, in
Ve
loc
ity,
in
/s
Force Ratio = 0.2
Force Ratio = 0.4
Force Ratio = 0.6
Force Ratio = 0.8
Force Ratio = 1.0
Page 29
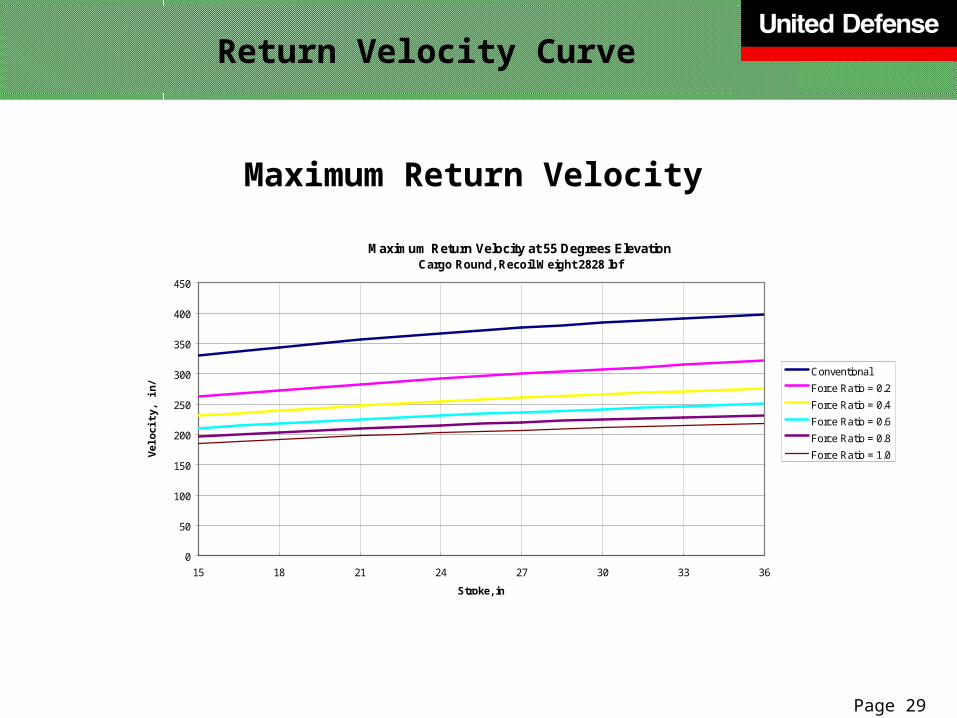
Return Velocity Curve
Maximum Return Velocity
Maximum Return Velocity at 55 Degrees ElevationCargo Round, Recoil Weight 2828 lbf
0
50
100
150
200
250
300
350
400
450
15 18 21 24 27 30 33 36
Stroke, in
Ve
loc
ity,
in
/se
c
Conventional
Force Ratio = 0.2
Force Ratio = 0.4
Force Ratio = 0.6
Force Ratio = 0.8
Force Ratio = 1.0

Page 30
Forward Power Curve
Maximum Forward Power Requirement
This forward power will probably be generated from the stored “recoil” energy of the previous shot.
Maximum Forward Power at 55 Degrees ElevationCargo Round, Recoil Weight 2828 lbf
0
100
200
300
400
500
600
700
800
15 18 21 24 27 30 33 36
Stroke, in
Po
we
r, h
p
Force Ratio = 0.2
Force Ratio = 0.4
Force Ratio = 0.6
Force Ratio = 0.8
Force Ratio = 1.0

Page 31
Maximum Return Power Requirement
Return Power Curve
A percentage of both forward and return power will be converted into heat, which must also be managed.
Maximum Return Power at 55 Degrees ElevationCargo Round, Recoil Weight 2828 lbf
0
500
1000
1500
2000
2500
3000
15 18 21 24 27 30 33 36
Stroke, in
Po
we
r, h
p
Conventional
Force Ratio = 0.2
Force Ratio = 0.4
Force Ratio = 0.6
Force Ratio = 0.8
Force Ratio = 1.0

Page 32
Displacement Position at Firing
(From In-Battery Position)
Displacement at Firing at 55 Degrees ElevationCargo Round, Recoil Weight 2828 lbf
0.0
0.2
0.4
0.6
0.8
1.0
1.2
1.4
1.6
1.8
2.0
15 18 21 24 27 30 33 36
Stroke, in
Dis
pla
ce
me
nt,
in Force Ratio = 0.2
Force Ratio = 0.4
Force Ratio = 0.6
Force Ratio = 0.8
Force Ratio = 1.0

Page 33
Misfire Deceleration Distance
Decelerating Distance for FOOB Cargo Round Misfire
0
25000
50000
75000
100000
0 3 6 9 12 15
Distance, in
Ret
ard
ing
Fo
rce,
lbf
Force = Frecoil
Ratio = 0.2
Ratio = 0.4
Ratio = 0.6
Ratio = 0.8
Ratio = 1.0