Embed Size (px)
Citation preview

Wilson, P.A., Lyle, M., and Firth, J.V. (Eds.)Proceedings of the Ocean Drilling Program, Scientific Results Volume 199
2. INTEGRATED STRATIGRAPHIC CORRELATION AND IMPROVED COMPOSITE
DEPTH SCALES FOR ODP SITES 1218 AND 12191
Heiko Pälike,2 Ted Moore,3 Jan Backman,4 Isabella Raffi,5 Luca Lanci,6, 7 Josep M. Parés,3 and Thomas Janecek8
ABSTRACT
During Ocean Drilling Program Leg 199 a high-resolution (~1–2 cm/k.y.) biogenic sediment record from the late Paleocene to the early Mio-cene was recovered, containing an uninterrupted set of geomagneticchrons as well as a detailed record of calcareous and siliceous biostrati-graphic datum events. Shipboard lithologic proxy measurements andshore-based determinations of CaCO3 revealed regular cycles that canbe attributed to climatic forcing. Discovering drill sites with well de-fined magneto- and biostratigraphic records that also show clear litho-logic cycles is rare and valuable and creates the opportunity to developa detailed stratigraphic intersite correlation, providing the basis tostudy paleoceanographic processes and mass accumulation rates at highresolution.
Here we present extensive postcruise work that extends the ship-board composite depth stratigraphy by providing a high-resolution re-vised meters composite depth (rmcd) scale to compensate for depth dis-tortion within individual cores. The depth-aligned data were then usedto generate stacked records of lithologic proxy measurements. Makinguse of the increased signal-to-noise ratio in the stacked records, we thenproceeded to generate a detailed site-to-site correlation between Sites1218 and 1219 in order to decrease the depth uncertainty for magneto-and biostratigraphic datums. Stacked lithologic proxy records in combi-nation with discrete measurements of CaCO3 were then exploited to
1Pälike, H., Moore, T., Backman, J., Raffi, I., Lanci, L., Parés, J.M., and Janecek, T., 2005. Integrated stratigraphic correlation and improved composite depth scales for ODP Sites 1218 and 1219. In Wilson, P.A., Lyle, M., and Firth, J.V. (Eds.), Proc. ODP, Sci. Results, 199, 1–41 [Online]. Available from World Wide Web: <http://www-odp.tamu.edu/publications/199_SR/VOLUME/CHAPTERS/213.PDF>. [Cited YYYY-MM-DD]2Southampton Oceanography Centre, School of Ocean and Earth Science, European Way, Southampton SO14 3ZH, UK. [email protected] Sciences, University of Michigan, 2534 C.C. Little Building, 425 East University Avenue, Ann Arbor MI, 48109-1063, USA.4Department of Geology and Geochemistry, Stockholm University, 10691 Stockholm, Sweden. 5Dipartimento di Scienze della Terra, Universitario “G. D’Annunzio,” Campus Universitario, Via dei Vestini 31, 66013 Chieti Scalo, Italy.6Istituto di Dinamica Ambientale, Universita’ di Urbino Localita Crocicchia, 61029 Urbino, Italy.7Department of Geological Sciences, Rutgers University, Piscataway NJ 08854, USA.8IODP Management International, Inc., 1899 L Street, Northwest, Suite 200, Washington DC 20036, USA.
Initial receipt: 19 April 2004Acceptance: 16 November 2004Web publication: 2 June 2005Ms 199SR-213

H. PÄLIKE ET AL.INTEGRATED STRATIGRAPHIC CORRELATION AND IMPROVED COMPOSITE DEPTH SCALES 2
calculate high-resolution carbonate concentration curves by regressionof the multisensor track data with discrete measurements. By matchingcorrelative features between the cores and wireline logging data, we alsorescaled our core rmcd back to in situ depths. Our study identifies li-thology-dependent core expansion due to unloading as the mechanismof varying stratigraphic thicknesses between cores.
INTRODUCTION
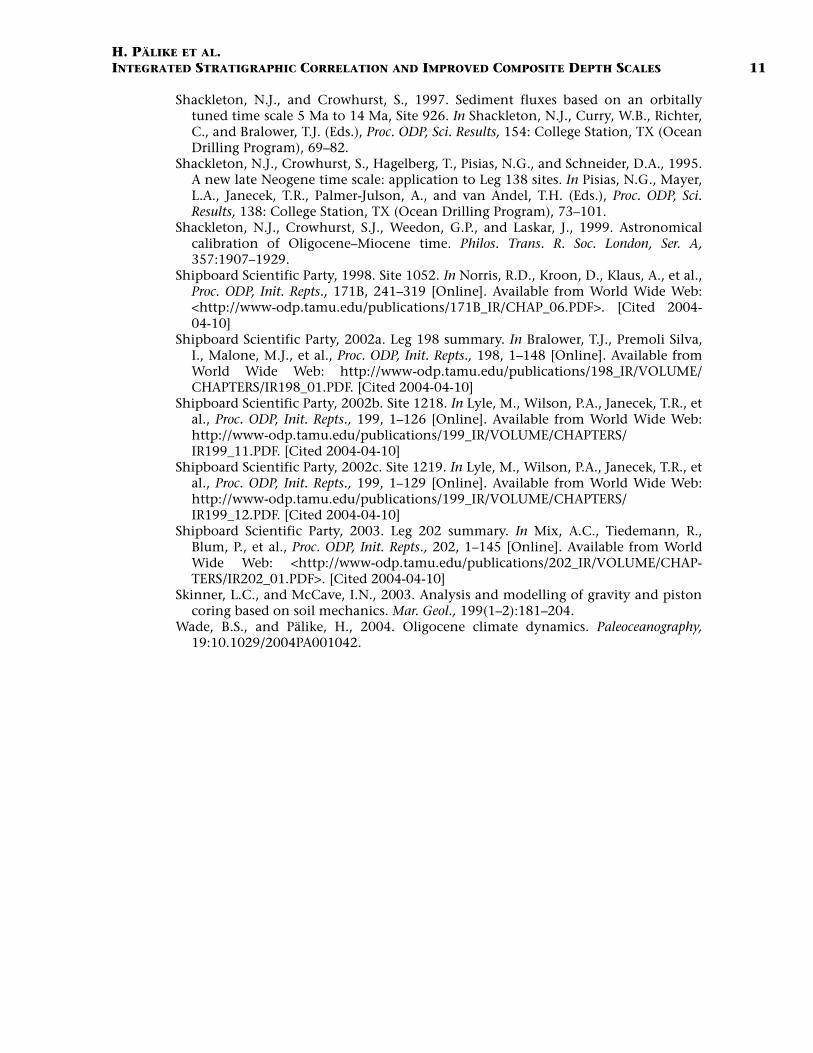
During Ocean Drilling Program (ODP) Leg 199 (Fig. F1), a series ofeight sites was drilled in the central to eastern equatorial Pacific. Thecruise was designed as a latitudinal transect, targeting sediments onAnomaly 25, just prior to the Paleocene/Eocene boundary. One of theprimary objectives of ODP Leg 199 was the recovery of continuous, un-disturbed, and high-resolution sediment records from the Paleogene.Throughout the entire Oligocene and parts of the Eocene and Miocene,high-resolution lithologic data from Site 1218 (8°53.378�N,135°22.00�W; 4828 m present-day water depth) and Site 1219(7°48.019�N, 142°00.940�W; 5063 m present-day water depth) show avery high correlation, at centimeter to decimeter length scales, eventhough the two sites are separated laterally by >740 km. For this contri-bution, we developed detailed and improved hole-to-hole, new site-to-site, and core-to-log correlations for Sites 1218 and 1219, thus provid-ing stratigraphic information that forms the basis for additional studies.
For paleoceanographic interpretations and analysis of depth andtime series, it is crucial that one is able to demonstrate the continuity ofa given record. Thus, one has to be able to recognize the presence of hi-atuses in the sedimentary record, and it is necessary to compensate forthe limitations that result from the technology used to recover deep-marine sediment cores. ODP sediment cores are typically recovered in~9.5-m-long sections. Depending on the consistency and hardness ofthe sediment encountered during drilling, different recovery methodsare used (e.g., advanced piston coring [APC], extended core barrel[XCB] coring, or rotary core barrel coring [not used during ODP Leg199]). Even with a nominal 100% recovery, recovery gaps are presentbetween successive cores. These are at least on the order of tens of centi-meters, typically 1–2 m, and rarely are the same strata recovered multi-ple times. Depending on the recovery method used, cores can also beaffected by core fragmentation, slumping, core expansion due to un-loading, core stretching and squeezing, and other core deformations,some of them related to the motion of the drill ship during coring(heaves, tides, etc.).
In order to obtain a complete geological record, multiple adjacentholes are cored at each site. By applying a depth offset of typically 2–5m between cores from different holes during coring, one can then en-sure that those intervals missing within a single hole can be recoveredfrom an adjacent hole, which allows an evaluation of the length of coregaps, as well as the construction of a “spliced” representative record.Initially, each ~9.5-m-long core is assigned a depth according to thedrill string length. This depth is denoted as meters below seafloor(mbsf). Subsequently, an attempt is made to correlate cores from differ-ent holes by using common features and diagnostic excursions in mea-surements of physical properties (bulk density, magnetic susceptibility,color reflectance, etc.) or magneto- and biostratigraphic records andevents. Routinely, the depths of cores from different holes are adjusted
0°
88
Site 1215
Site 1216
Site 1217
Site 1218
Site 1219
Site 1220
Site 1221
Site 1222
40 and 41
42
43
1223
1224
67
69
315
70
71
72
160161
162
163
77 and 573
842 and 843
574
575
Honolulu
Leg 199 SitesODP/DSDP Sites
Clarion F.Z.
742 km
160°W 150° 140° 130°
10°
20°
30°N
0 500 1000 km
-6 -5 -4 -3 -2 -1
Bathymetry (km)
Molokai F.Z.
Clipperton F.Z.
316
F1. Leg 199 drilling sites, p. 12.

H. PÄLIKE ET AL.INTEGRATED STRATIGRAPHIC CORRELATION AND IMPROVED COMPOSITE DEPTH SCALES 3
to a common depth scale by adding a constant offset over the length ofeach core. This new depth scale is denoted as meters composite depth(mcd) and is generated shipboard during the cruise. The methodologyfor this shipboard stratigraphic correlation was pioneered during Legs94 (Ruddiman et al., 1987) and 138 (Hagelberg et al., 1992). Similarmethods were employed and developed further during Legs 154 (Curry,Shackleton, Richter, et al., 1995), 162 (Jansen, Raymo, Blum, et al.,1996), 167 (Lyle, Koizumi, Richter, et al., 1997), 171B (Norris, Kroon,Klaus, et al., 1998), 189 (Exon, Kennett, Malone, et al., 2001), and 198(Shipboard Scientific Party, 2002a). A new innovation of relating depthoffsets between separate holes to precalculated tidal movements was in-troduced during Leg 202 (Shipboard Scientific Party, 2003).
Unfortunately, it has been frequently observed that cores are dis-torted in length within each ~9.5-m segment. This distortion is due tothe coring methods used or to variations in accumulation rates betweenholes. This problem was discussed in detail by Hagelberg et al. (1995).For example, sediment inside the core can expand as a result of reducedenvironmental pressure following core recovery, leading to an ex-panded sedimentary sequence relative to its original length (Moran,1997). The coring technology can also lead to sediment distortion(Skinner and McCave, 2003). The distortion in depth implies that geo-logical events that are obviously synchronous in time, such as volcanicash layers, are potentially not correctly aligned on the mcd scale.
This situation is not satisfactory, as far as a detailed stratigraphic cor-relation is concerned. Two strategies can be used to alleviate this prob-lem. The one that is used shipboard is to construct a “spliced” recordfrom available data by using the mcd scale and by switching the sam-pling between records from different holes. The splicing procedure re-quires a decision to be made with respect to what constitutes the “best”(or most representative) track and will depend on the purpose of theparticular investigation. For example, one might want to choose, whereavailable, the longest possible track down the core sequence, assumingthat this record results in the highest possible resolution in time. Alter-natively, one might want to select a “splice” that corresponds to the av-erage increase in depth if, for example, the aim is the reconstruction ofsediment flux variations. These arguments were put forward previouslyduring Leg 171B (Shipboard Scientific Party, 1998).
An alternative to the construction of a “spliced” record is the calcula-tion of a stacked record, treating data from different holes as the realiza-tion of the same geological section. The procedure for the generation ofa common depth scale that allows stretching and squeezing on a centi-meter scale was pioneered by Hagelberg et al. (1995) and results in a“revised meters composite depth” (rmcd) scale. In this case, it is neces-sary to align individual features between different holes at high resolu-tion, allowing differential stretching and squeezing of depths within in-dividual holes. This strategy was also employed by Pälike et al. (2001).As the rmcd scale implies that cores from individual holes are alignednot only at specific depths but ideally along the entire record, it is pos-sible to “stack” (average) data from different cores covering the samestratigraphic interval. This method can facilitate the generation of anenhanced “signal-to-noise” ratio (i.e., “noise” in the data that is inde-pendent of the location of the holes can be reduced by averaging sev-eral measurements from the same stratigraphic level). New, improvedsampling splices can be generated according to the rmcd scale, mini-mizing sampling waste and analytical time.

H. PÄLIKE ET AL.INTEGRATED STRATIGRAPHIC CORRELATION AND IMPROVED COMPOSITE DEPTH SCALES 4
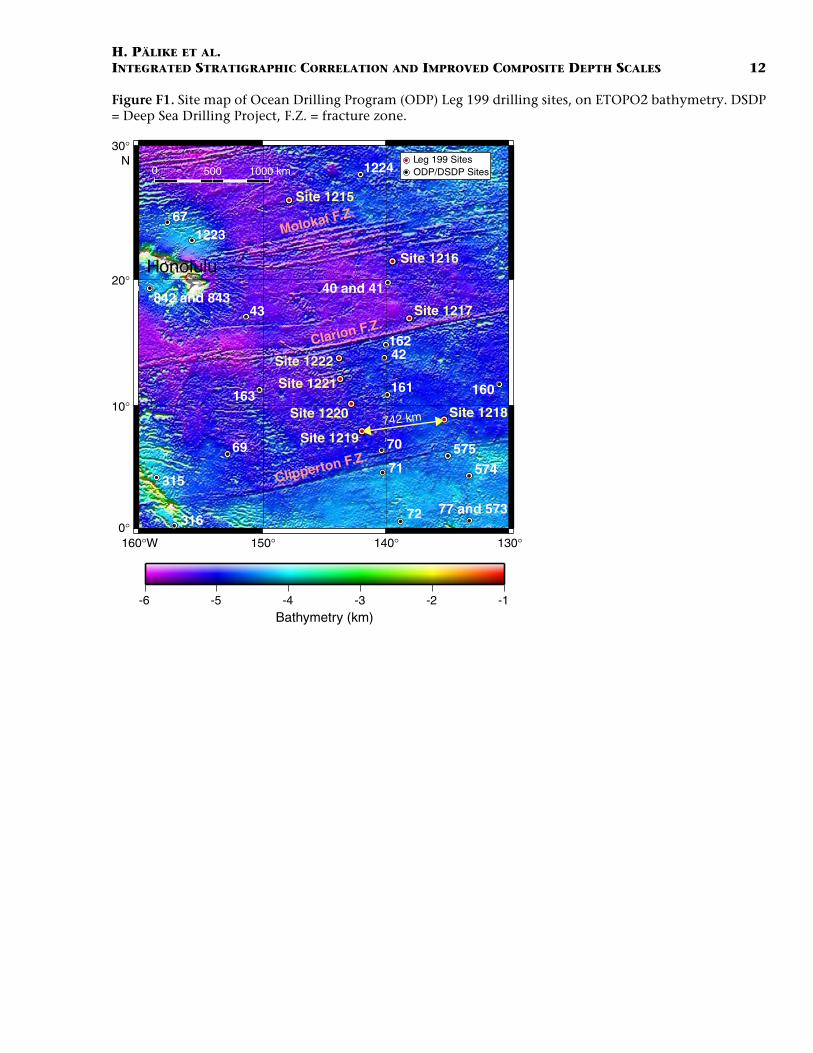
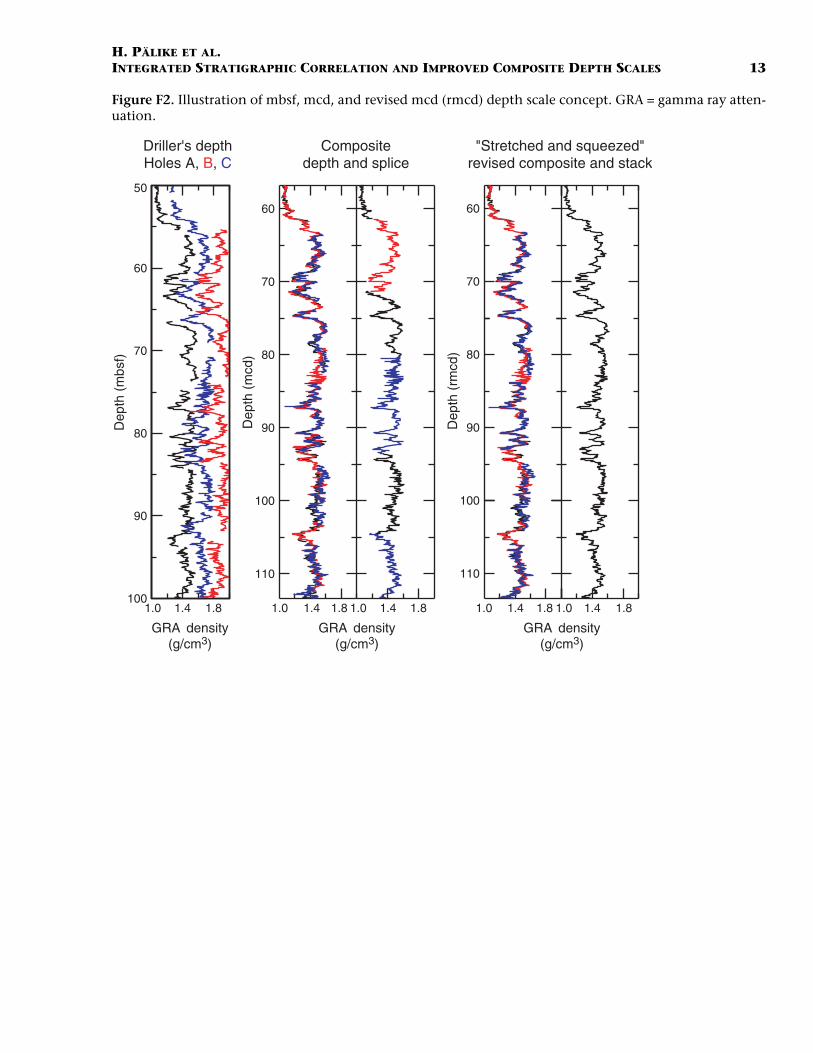
Figure F2 illustrates the relationship between the mbsf, mcd, andrmcd scales. In the left panel, gamma ray attenuation (GRA) bulk den-sity data from three holes are shown on the shipboard mbsf depth scale,as determined by the length of the drill string. Note that features thatclearly represent identical stratigraphic horizons are slightly offset fromeach other. The middle panel shows data on a common (mcd) scale asdetermined shipboard. This common depth scale is generated bymatching one single point in depth between individual cores, not al-lowing any stretching and/or squeezing of depths within a single core.The shipboard mcd scale is used to create a single representative sampletrack, switching between holes (“splice”). The right panel shows an ex-ample of the revised composite depth scale developed here. Note thatdata are aligned on shorter-length scales compared to the shipboardmcd scale. The aligned data can then be used to generate a stackedrecord, reducing the noise component in the data (right panel). If theavailable data only allow an ambiguous or imprecise correlation, or ifmultiple hole data were unavailable, no additional depth adjustmentswere made. In this case, the cumulative offset remains constant for allsubsequent cores.
MATERIALS
The data used for generating our new revised meters compositedepth scale were multisensor track (MST) data (magnetic susceptibility,GRA bulk density, and color reflectance parameters [L*, a*, and b* colorspace]), paleomagnetic properties measured shipboard, and additionalpostcruise discrete measurements of CaCO3 content from Sites 1218and 1219. Three holes were drilled at Site 1218 and two were drilled atSite 1219. Hole 1219B was abandoned prematurely, due to a stuck corebarrel. The MST data were lightly pruned to remove incorrect values,which were found to occur mostly at the ends of cores, as well as in dis-turbed intervals determined shipboard by visual inspection of the splitcores (Shipboard Scientific Party, 2002b, 2002c). Where multiple copiesof the same stratigraphic interval were available, comparisons betweendata from different holes allowed the identification of additional outli-ers.
RESULTS
Hole-to-Hole Correlation for Sites 1218 and 1219
Our strategy for developing rmcd hole-to-hole correlations for Sites1218 and 1219 was to keep the rmcd scale similar to the original ship-board splice mcd scale, where possible, in order to facilitate comparisonwith shipboard results and to ease the creation of alternative sedimentsampling plans. Thus, where multiple copies of the same stratigraphicinterval were recovered, our revised composite depths (rmcd) are identi-cal with the shipboard composite depths of the core that is part of theoriginal shipboard splice, whereas the other cores were finely adjustedto give the best match for all the holes on a centimeter to decimeterscale. We achieved this aim for Site 1218. For Site 1219, we had to cor-rect some shipboard composite depth scale mismatches but kept mostof the shipboard correlations intact. Following shipboard practice forintervals recovered in only one hole, we offset mcd and rmcd depths by
Driller's depthHoles A, B, C
Compositedepth and splice
"Stretched and squeezed"revised composite and stack
60
70
80
90
100
110
50
60
70
80
90
100
60
70
80
90
100
110
Dep
th (
mbs
f)
Dep
th (
mcd
)
Dep
th (
rmcd
)
1.0 1.4 1.81.0 1.4 1.81.0 1.4 1.81.0 1.4 1.81.0 1.4 1.8
GRA density(g/cm3)
GRA density(g/cm3)
GRA density(g/cm3)
F2. Illustration of depth scale con-cept, p. 13.

H. PÄLIKE ET AL.INTEGRATED STRATIGRAPHIC CORRELATION AND IMPROVED COMPOSITE DEPTH SCALES 5
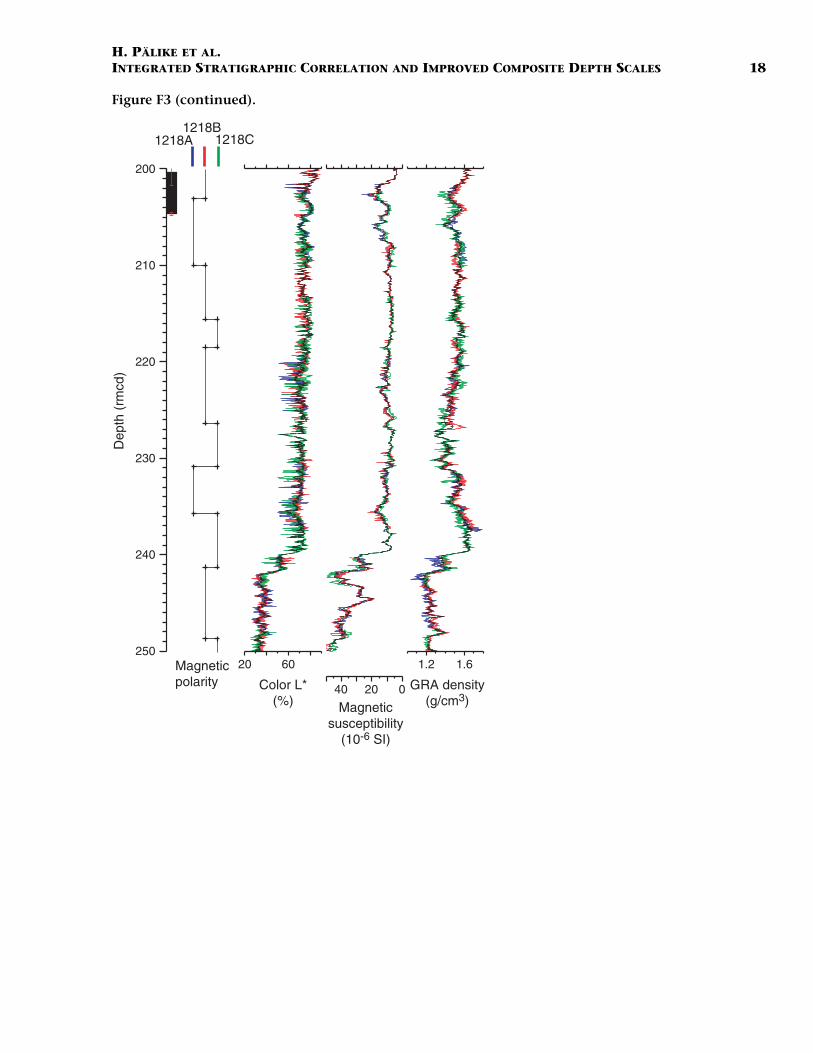
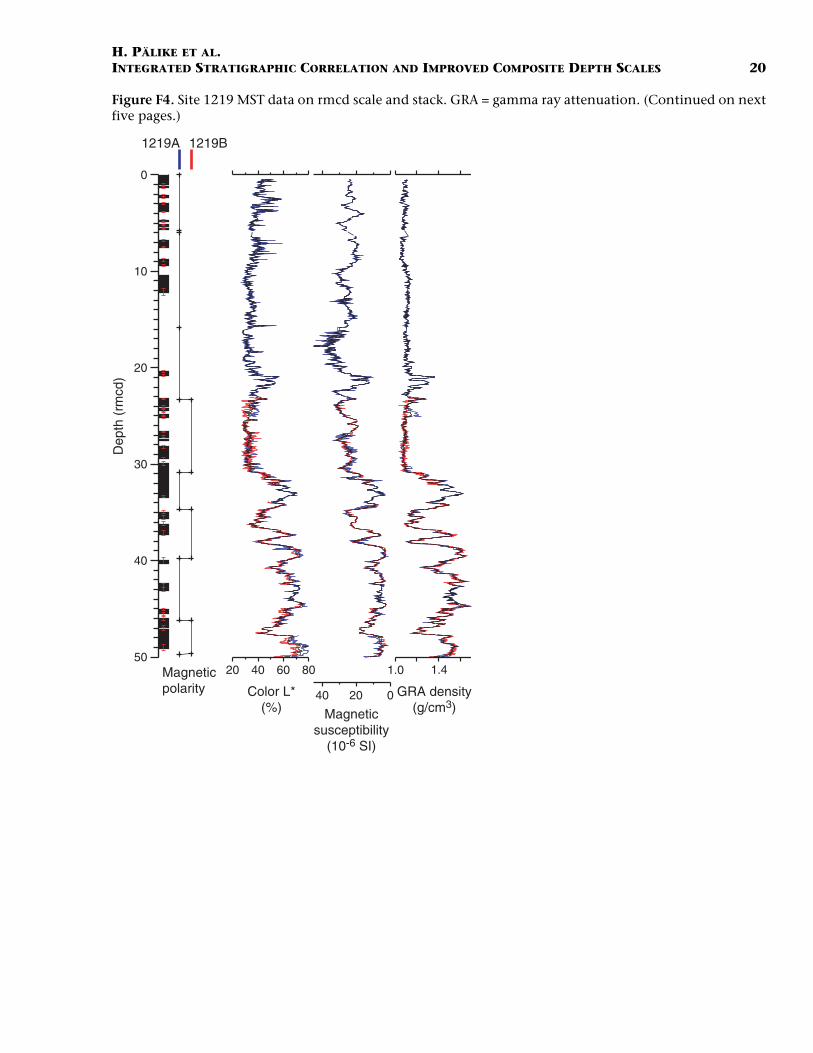
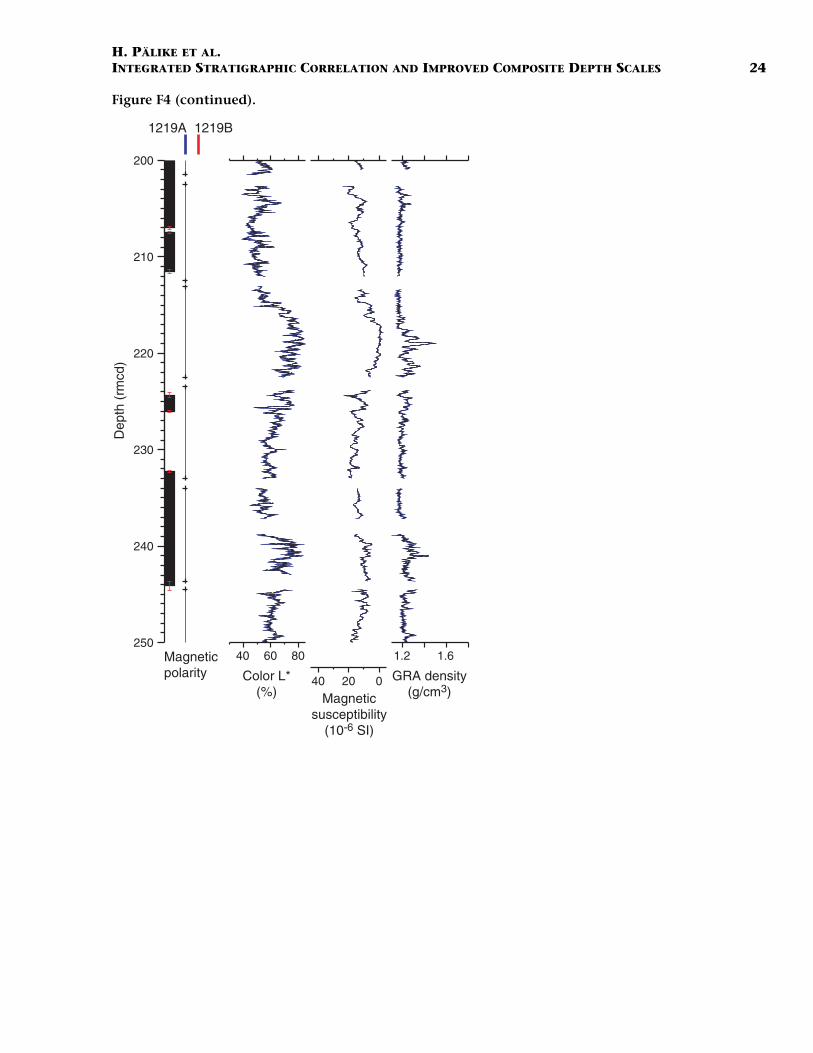
a nominal ~1.1 m, according to the average observed length increase ofthe mcd/rmcd depth scale. The complete data sets, plotted on the newrmcd scale, are shown in Figures F3 and F4. In addition to the MSTdata, aligned on the rmcd scale, we also show the stacked records as su-perimposed dashed lines; the generation of these is discussed in a sepa-rate section. We also show the points where the original splice trackswitches between different holes. For Site 1218, all but one originalsplice point (toward the very bottom) were kept. The depth adjust-ments within each core were made by considering all data sets. How-ever, depending on the lithology, different types of data were more use-ful for this purpose: the carbonate-poorer lithologic Units I, III, and IV(Shipboard Scientific Party, 2002a) were more easily matched using themagnetic susceptibility data, whereas for the carbonate-rich Unit II, alldata proved equally useful. The depth tables that relate mbsf, mcd, andour new rmcd scales are given as Table T1 for Site 1218 and Table T2 forSite 1219. Depths were linearly interpolated between individual tiepoints. We note that the improved stratigraphic hole-to-hole correla-tion was relatively straightforward for intervals of intermediate carbon-ate content. For carbonate-poor intervals, characterized by low light-ness and bulk density values and high magnetic susceptibility values,matches were based mostly on the magnetic susceptibility measure-ments.
Stacked MST Data Sets for Sites 1218 and 1219
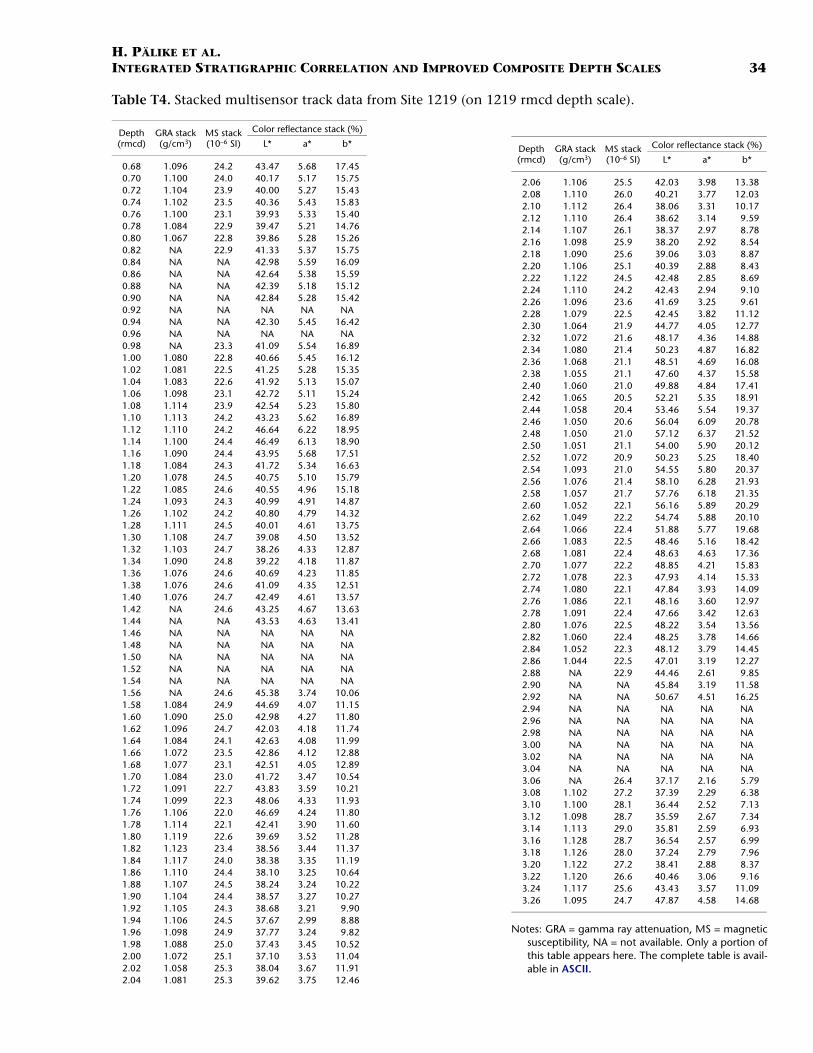
One of the main reasons for generating a detailed new rmcd depthscale is that after alignment to this scale it is possible to stack data fromdifferent holes, thus increasing the signal-to-noise ratio. For example,color reflectance data are acquired by spot measurements with a foot-print of ~4 mm2. Thus, processes such as bioturbation or uneven sur-faces of split cores will produce noise in the data. The stacking processallows us to reduce this noise for all data sets and provides a more repre-sentative record. We generated stacked data sets for magnetic suscepti-bility, color reflectance (L*, a*, and b* color space), and GRA bulk den-sity as follows. The pruned data, aligned on the rmcd scale, were firstvisually inspected for occurrences where data from one hole were sig-nificantly different from the other holes. If those data points wereclearly outliers, they were removed. We then resampled data from allholes with a common 2-cm sampling step where available, using aGaussian smoothing window with a half-width of 5 cm. The resamplingis necessary, as the process of “stretching and squeezing” within coresimplies that data measurements are no longer spaced equally in depth,and data from different holes are also not sampled at identical depths.The width of the smoothing window was chosen so as to preserve varia-tions of the lithologic measurements that were common between datafrom separate holes. As the average sedimentation rates were between~0.5 and 2 cm/k.y. throughout the Site 1218 and 1219 records, thissmoothing process preserves any information with timescales longerthan a few thousand years and is of the same order as that applied bythe magnetic susceptibility loop during data acquisition. The smootheddata were then averaged if data were available from more than one holeor taken from a single hole. The stacked data sets are available in elec-tronic form, as they are too large to be included as complete tables here.However, the format of the data tables is shown in Table T3 for Site1218 and Table T4 for Site 1219.
Magneticpolarity
1218A
Color L*(%)
1218B1218C
0
10
20
30
40
50
Dep
th (
rmcd
)
1.0 1.2
040
20 40 60
Magneticsusceptibility
(10-6 SI)
GRA density(g/cm3)
F3. Site 1218 MST data, p. 14.
1219A 1219B
1.0 1.4
02040
20 40 60 80
Dep
th (
rmcd
)
Magneticpolarity Color L*
(%) Magneticsusceptibility
(10-6 SI)
GRA density(g/cm3)
0
10
20
30
40
50
F4. Site 1219 MST data, p. 20.
T1. Site 1218 rmcd tie points, p. 29.
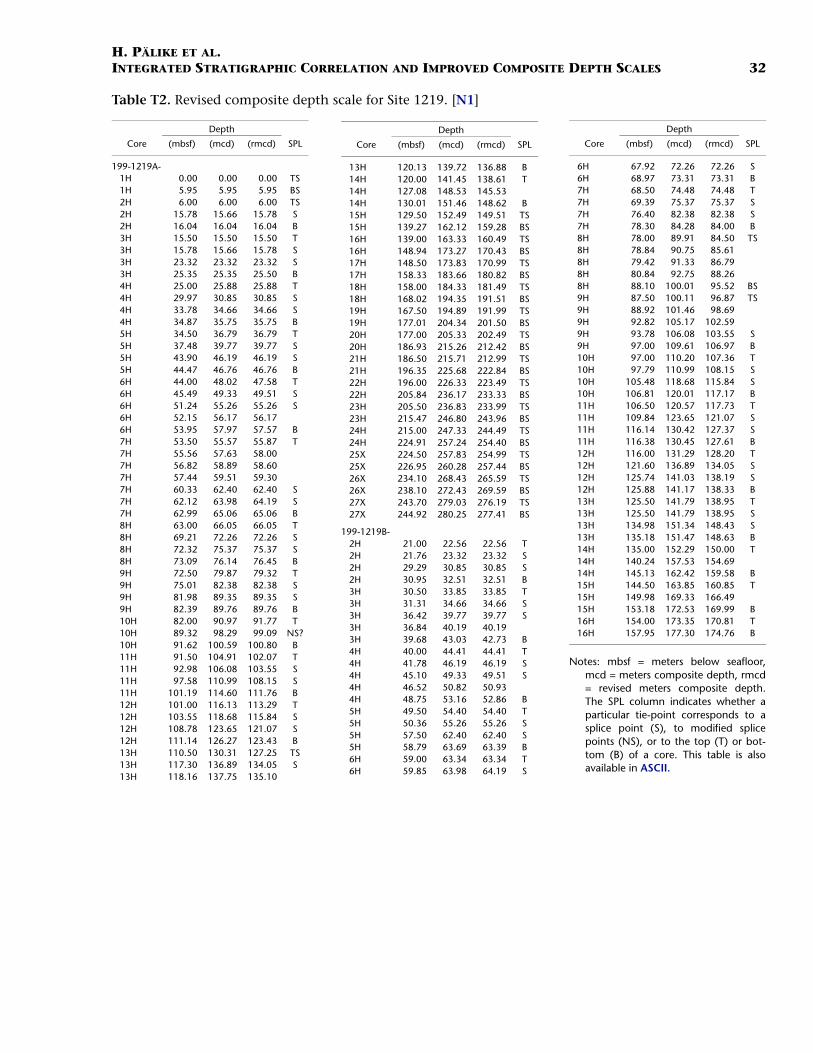
T2. Site 1219 rmcd tie points, p. 32.
T3. Site 1218 stacked data on rmcd scale, p. 33.
T4. Site 1219 stacked data on rmcd scale, p. 34.

H. PÄLIKE ET AL.INTEGRATED STRATIGRAPHIC CORRELATION AND IMPROVED COMPOSITE DEPTH SCALES 6
Site-to-Site Correlation
It is important to stress that data correlated from one site alonemight not be sufficient to identify hiatuses in the record, as a particularstratigraphic interval might only be recovered in a single hole. One ofthe strengths of stratigraphic correlations that were performed withdata from ODP Legs 138 and 154 (Shackleton et al., 1995; Shackletonand Crowhurst, 1997; Shackleton et al., 1999) was that these correla-tions were not only achieved with data from one particular location,but with data from different sites. This approach allowed the detectionof several hiatuses that otherwise would have remained unnoticed. Wefollow this pioneering work by performing additional site-to-site corre-lations for ODP Sites 1218 and 1219. Figure F5 illustrates how well thedata between Sites 1218 and 1219 can be matched for an interval in theupper Oligocene/lower Miocene. Table T5 provides the tie points thatmatch Site 1219 depths (in rmcd) to those of Site 1218. We applied alinear interpolation of depths between these tie points. The matchingof data from 1219 to 1218 shows that individual features of the MSTdata can be matched on a centimeter to decimeter scale, an observationthat is truly astonishing, given the large distance (~740 km) betweenSites 1218 and 1219. We note that the comparison of data from Sites1218 and 1219 suggests that both sedimentary sequences are completeand not interrupted by any hiatuses, at least on the scale of the lateralseparation of the two sites.
Magneto- and Biostratigraphic Integration
Because data from the two sites match so well, we can now proceedto use this match to extrapolate magneto- and biostratigraphic datumevents between sites. This approach yields two important benefits. First,we can evaluate, and reduce, the uncertainty in depth for datum eventsthat cooccur at both sites. We can also evaluate small potential latitudi-nal differences for biostratigraphic events, as Sites 1218 and 1219 wereat slightly different paleolatitudes at any given time (Lyle, Wilson, Jan-ecek, et al., 2002). Second, for datum events that were only determinedfor one of the two sites, we can use the newly developed match of rmcddepth scales from Sites 1218 and 1219 to predict the position of thesedatum events for the site where it was not determined, thus improvingthe database available for generating detailed age models.
The depth determinations for magnetostratigraphic events presentedhere are based on shipboard magnetic data that were available at thetime. We note that additional postcruise work has been carried out forsome intervals of Sites 1218 and 1219 (Lanci et al., 2004), which willfurther reduce the depth uncertainty for these events. Table T6 listsmagnetostratigraphic events interpreted for Sites 1218 and 1219 on ournew rmcd scale, together with depth uncertainty estimates. We notethat the correlation between Sites 1218 and 1219 is very good for thecabonate-rich interval (~55–240 rmcd for Site 1218). Above 55 rmcd,the identification and correlation of magnetic reversals is less certain.Table T6 also gives depths for Site 1219 as Site 1218 equivalents, usingour site-to-site correlation. There are two examples where our site-to-site correlation gives information that data from the two sites on theirown were unable to provide. Polarity Chron C11n, for example, wasnot identified with confidence in the shipboard magnetostratigraphicdata for Site 1219; our match allows the determination of the equiva-lent stratigraphic interval for Site 1219 from data from Site 1218. Sec-
Site 1218 depth (rmcd)
C7n C7An C8n C9n C10nC6Cn1218
1219
1218
1219
1218
12181219
1219
90 100 110 120 130 140 150 160 170
1.2
1.6
40
60
80
0
10
20Mag
netic
susc
eptib
ility
(10-
6 S
I)C
olor
L*
(%)
GR
Ade
nsity
(g/c
m3 )
Mag
netic
pola
rity
F5. Site-to-site correlation of MST data, p. 26.
T5. Mapping tie points from Site 1219 to Site 1218 rmcd, p. 35.
T6. Integrated magnetostratigra-phy from Sites 1218 and 1219, p. 36.

H. PÄLIKE ET AL.INTEGRATED STRATIGRAPHIC CORRELATION AND IMPROVED COMPOSITE DEPTH SCALES 7
ond, no magnetostratigraphic data are available from Site 1218 belowChron C12n, as the lithologic nature of sediments required a switchfrom the APC coring system to XCB. However, our site-to-site correla-tion results in depth estimates for Chrons C13n through C20n for Site1218 by extrapolation from Site 1219, thus improving our ability toconstrain age models. There are several additional examples where corebreaks or core disturbance increased the depth uncertainty of magneticreversals at one site that can now be further reduced by using our newlydeveloped site-to-site correlation.
As was the case for the magnetostratigraphic data, we can also im-prove our available database of biostratigraphic datums by hole-to-holeand site-to-site correlation. The detailed determination of radiolariandatum events is given elsewhere (Nigrini et al., this volume). Calcare-ous nannofossil datum events, some of them improved from the origi-nal shipboard information, are listed in Table T7 for Site 1218 and TableT8 for Site 1219. For Site 1219, we also give equivalent depths for Site1218, as determined by the tie points listed in Table T5. The integratedcorrelation of magneto- and biostratigraphic datum events to lithologiccycles from Sites 1218 and 1219 forms the basis for the development ofan improved age model for the two sites.
Estimates of CaCO3 Contents from Multisensor Track Data
The development of stacked MST data sets for Sites 1218 and 1219,together with shipboard and additional determinations of CaCO3 con-tent for the two sites, allowed us to generate new high-resolution“estimated” carbonate content, based on a regression between lower-resolution direct measurements of CaCO3 and the stacked MST data. Ahigh-resolution CaCO3 record is valuable, as it allows the investigationof depth- and latitude-dependent dissolution and productivity patternsas a function of the carbonate compensation depth (CCD). Using thestacked data sets of magnetic susceptibility, GRA bulk density, and thethree color reflectance parameters L*, a*, and b*, we first extracted thedominant variation of these five parameters by principal componentanalysis. We then used a polynomial regression between the three lead-ing principal components and measured CaCO3 values (e.g., Coxall etal., 2005), to develop high-resolution estimates of carbonate contentfrom ~60 to 241 m depth on the Site 1218 rmcd scale, covering the ear-liest Oligocene to early/middle Miocene. Our results for Sites 1218 and1219 are illustrated in Figure F6. Based on a comparison between themeasured and estimated values, we determined the uncertainty of ourestimated CaCO3 values to be on the order of 10%–15%. This uncer-tainty is lower for the interval from ~110 to 240 rmcd, but we note thatthe estimated values for Site 1218 are slightly (~10%) too low for the in-terval between 60 and 100 rmcd. Although it is possible to improve thematch of measured and estimated CaCO3 values by calculating regres-sions over shorter subintervals, this also results in undesirable jumps inthe estimated curves. A separate study (Vanden Berg and Jarrard, thisvolume) derived estimated calcite, opal, and terrigenous componentsby regression with light absorption spectroscopy data. We note thatthese two methods yielded similar results.
In combination with an astronomical age calibration of data fromSites 1218 and 1219 (Wade and Pälike, 2004; H.K. Coxall et al., 2005,unpubl. data), our estimated CaCO3 values combined with the stacked
T7. Site 1218 calcareous nannofos-sils on rmcd scale, p. 39.
T8. Site 1219 calcareous nannofos-sils on rmcd scale, p. 40.
60 80 100 120 140 160 180 200
CCD depthCCD depthSite 1219 subsidence
220 240
Site 1218 depth (rmcd)
20 22 24 26 28 30 32 34
Age CK1995 (Ma)
Age (Ma)
C6CnC6n C6AnC6Bn C13nC12nC11nC10nC9nC8nC7n
Miocene/OligoceneBoundary
1218
1219
1218
1219
0
40
80
0
40
80
4.0
4.4
CaC
O3
(wt%
)(M
ST
est
imat
e)
Miocene/OligoceneBoundary
20 22 24 26 28 30 32 34
Site 1218 subsidence
CaC
O3
(wt%
)(M
ST
est
imat
e)P
aleo
dept
h(k
m)
F6. Estimated CaCO3 content re-gressions, p. 27.

H. PÄLIKE ET AL.INTEGRATED STRATIGRAPHIC CORRELATION AND IMPROVED COMPOSITE DEPTH SCALES 8
GRA bulk density estimates allow us to calculate more detailed mass ac-cumulation rates of calcium carbonate for Sites 1218 and 1219. One in-teresting aspect of carbonate accumulation for the two sites arises bycomparison with the tectonic subsidence histories of the two sites. Fig-ure F6 illustrates that although CaCO3 is quite similar between Sites1218 and 1219 throughout most of the Oligocene, Site 1219 shows astronger decrease in CaCO3 values as this site approaches the depth ofthe CCD (also see Rea and Lyle, 2005, and Coxall et al., 2005, for moredetailed discussion of the CCD development).
Matching Stacked Core Data to Wireline Logging Data
One final aspect of our integrated correlation effort is the calibrationof our new rmcd scale to logging data. Similar procedures have beenemployed during previous ODP legs (Harris et al., 1995). The observa-tion that mcd and rmcd scales are expanded compared to the mbsf scalearising from the length of the drill string has important consequenceson properties that rely on absolute sediment thicknesses, such as sedi-mentation and mass accumulation rate estimates and synthetic seismo-gram studies. The hole-to-hole and site-to-site correlations have alreadydemonstrated that the expansion in length of the rmcd scale comparedto the mbsf scale is largely due to lithology-dependent core expansioncaused by unloading. This view is confirmed by Rea and Gaillot (thisvolume), who computed core rebound coefficients by comparison ofwireline in situ depths with core depths. Figure F7 illlustrates howstacked core data can be matched well to downhole logging data. Thecomparison of logging data with core data rests largely on measure-ments that represent the sediment porosity and/or density. Table T9provides the tie points that match Site 1218 depths (in rmcd) to in situlogging depths (lmbsf). We observe that, on average, the in situ loggingdepth is ~89% of the rmcd scale, indicating that core expansion is onthe order of 11%. One important result of our core-logging data com-parison is the observation that both Formation MicroScanner and litho-density logging data show an intermediate step in the transition visibleat ~213 lmbsf, at the base of Chron C13n. Sediment data also show thistwo-step transition but were only recovered in a core from a single hole(1218C). Thus, our match of logging data and core data can confirmthat this step is an in situ feature at Site 1218 and not a coring artifact.We note that no correlation of logging data to core data was possibleabove ~70 mbsf, as the drill string was not removed completely duringlogging. We also observe that the logging data from Site 1218 are lessnoisy than those from Site 1219, and a match of Site 1219 to true depthis more easily accomplished by employing our site-to-site correlation incombination with the Site 1218 logging data than by using the Site1219 logging data.
SUMMARY
We performed a comprehensive hole-to-hole and site-to-site correla-tion for Sites 1218 and 1219, using physical property measurements.We compensated for depth distortions within cores by developing de-tailed “stretched and squeezed” revised composite depth scales for ODPSites 1218 and 1219, two sites that are separated laterally by more than~740 km. Our new, improved rmcd scale allowed the generation of
120 140
ODP1218
ODP1219
ODP1218A
C13n C16nC12nC11nC10nC9n C17n
ODP1218A
ODP1218
ODP1219
160 180 200 220
Depth (mbsf)
GR
A d
ensi
ty(g
/cm
3 )Li
thod
ens.
(g/c
m3 )
FM
S u
ncal
.co
nduc
tivity
Lim
esto
nepo
rosi
tylo
g
1.2
1.6
2.0
1.2
1.6
2.0
low
high
low
high
F7. Stacked gamma ray attenua-tion bulk density data, p. 28.
T9. Mapping tie points from Site 1218 rmcd to wireline log mbsf, p. 41.

H. PÄLIKE ET AL.INTEGRATED STRATIGRAPHIC CORRELATION AND IMPROVED COMPOSITE DEPTH SCALES 9
stacked lithologic parameter records, with a reduced noise component.A detailed site-to-site correlation of Sites 1218 and 1219 is possibledown to the decimeter scale (across ~740 km), allowing improvementand verification of biostratigraphic and paleomagnetic events. These in-tegrated stratigraphic datum events form the basis for additional (astro-nomical) age scale developments and intercalibrations of magneto- andbiostratigraphic datum points. Stacked MST data from the two sites,combined with additional chemical determinations of CaCO3 content,allowed the generation of high-resolution “estimated” CaCO3 curves.By matching stacks of core physical property measurements to down-hole logging data, we were able to estimate in situ depths and to correctfor core expansion that we find to be due to sediment unloading duringcoring.
ACKNOWLEDGMENTS
This research used samples and data provided by the Ocean DrillingProgram (ODP). ODP is sponsored by the U.S. National Science Founda-tion (NSF) and participating countries under the management of JointOceanographic Institutions (JOI), Inc. Funding for this research wasprovided to H.P. by the Swedish Research Council (VR) and the UK Nat-ural Environment Research Council (NERC).

H. PÄLIKE ET AL.INTEGRATED STRATIGRAPHIC CORRELATION AND IMPROVED COMPOSITE DEPTH SCALES 10
REFERENCES
Cande, S.C., and Kent, D.V., 1995. Revised calibration of the geomagnetic polaritytimescale for the Late Cretaceous and Cenozoic. J. Geophys. Res., 100:10.1029/94JB03098.
Coxall, H.K., Wilson, P.A., Pälike, H., Lear, C.H., and Backman, J., 2005. Rapid step-wise onset of Antarctic glaciation and deeper calcite compensation in the PacificOcean. Nature (London, U. K.), 433:10.1038/nature03135.
Curry, W.B., Shackleton, N.J., Richter, C., et al., 1995. Proc. ODP, Init. Repts., 154: Col-lege Station, TX (Ocean Drilling Program).
Exon, N.F., Kennett, J.P., Malone, M.J., et al., 2001. Proc. ODP, Init. Repts., 189[Online]. Available from World Wide Web: <http://www-odp.tamu.edu/publica-tions/189_IR/189ir.htm>. [Cited 2004-04-10]
Hagelberg, T.K., Pisias, N.G., Shackleton, N.J., Mix, A.C., and Harris, S., 1995. Refine-ment of a high-resolution, continuous sedimentary section for studying equatorialPacific Ocean paleoceanography, Leg 138. In Pisias, N.G., Mayer, L.A., Janecek,T.R., Palmer-Julson, A., and van Andel, T.H. (Eds.), Proc. ODP, Sci Results, 138: Col-lege Station, TX (Ocean Drilling Program), 31–46.
Hagelberg, T., Shackleton, N., Pisias, N., and Shipboard Scientific Party, 1992. Devel-opment of composite depth sections for Sites 844 through 854. In Mayer, L., Pisias,N., Janecek, T., et al., Proc. ODP, Init. Repts., 138 (Pt. 1): College Station, TX (OceanDrilling Program), 79–85.
Harris, S., Hagelberg, T., Mix, A., Pisias, N.G., and Shackleton, N.J., 1995. Sedimentdepths determined by comparisons of GRAPE and logging density data during Leg138. In Pisias, N.G., Mayer, L.A., Janecek, T.R., Palmer-Julson, A., and van Andel,T.H. (Eds.), Proc. ODP, Sci. Results, 138: College Station, TX (Ocean Drilling Pro-gram), 47–57.
Jansen, E., Raymo, M.E., Blum, P., et al., 1996. Proc. ODP, Init. Repts., 162: College Sta-tion, TX (Ocean Drilling Program).
Lanci, L., Parés, J.M., Channell, J.E.T., and Kent, D.V., 2004. Miocene magnetostratig-raphy from equatorial Pacific sediments (ODP Site 1218, Leg 199). Earth Planet. Sci.Lett., 226(1–2):207–224.
Lyle, M., Koizumi, I., Richter, C., et al., 1997. Proc. ODP, Init. Repts., 167 [Online].Available from World Wide Web: <http://www-odp.tamu.edu/publications/167_IR/167TOC.HTM>. [Cited 2004-04-10]
Lyle, M., Wilson, A., Janecek, T.R., et al., 2002. Proc. ODP, Init. Repts., 199 [Online].Available from World Wide Web: <http://www-odp.tamu.edu/publications/199_IR/199ir.htm>. [Cited 2004-04-10]
Moran, K., 1997. Elastic property corrections applied to Leg 154 sediment, Ceara Rise.In Shackleton, N.J., Curry, W.B., Richter, C., and Bralower, T.J. (Eds.), Proc. ODP, Sci.Results, 154: College Station, TX (Ocean Drilling Program), 151–155.
Norris, R.D., Kroon, D., Klaus, A., et al., 1998. Proc. ODP, Init. Repts., 171B [Online].Available from World Wide Web: <http://www-odp.tamu.edu/publications/171B_IR/171BTOC.HTM>. [Cited 2004-04-10].
Pälike, H., Shackleton, N.J., and Röhl, U., 2001. Astronomical forcing in late Eocenemarine sediments. Earth Planet. Sci. Lett., 193(3–4):10.1016/S0012-821X(01)00501-5.
Rea, D.K., and Lyle, M.W., 2005. Paleogene calcite compensation depth in the easternsubtropical Pacific: answers and questions. Paleoceanography, 20(1):10.1029/2004PA001064.
Ruddiman, W.F., Cameron, D., and Clement, B.M., 1987. Sediment disturbance andcorrelation of offset holes drilled with the hydraulic piston corer: Leg 94. In Ruddi-man, W.F., Kidd, R.B., Thomas, E., et al., Init. Repts. DSDP, 94 (Pt. 2): Washington(U.S. Govt. Printing Office), 615–634.
H. PÄLIKE ET AL.INTEGRATED STRATIGRAPHIC CORRELATION AND IMPROVED COMPOSITE DEPTH SCALES 11
Shackleton, N.J., and Crowhurst, S., 1997. Sediment fluxes based on an orbitallytuned time scale 5 Ma to 14 Ma, Site 926. In Shackleton, N.J., Curry, W.B., Richter,C., and Bralower, T.J. (Eds.), Proc. ODP, Sci. Results, 154: College Station, TX (OceanDrilling Program), 69–82.
Shackleton, N.J., Crowhurst, S., Hagelberg, T., Pisias, N.G., and Schneider, D.A., 1995.A new late Neogene time scale: application to Leg 138 sites. In Pisias, N.G., Mayer,L.A., Janecek, T.R., Palmer-Julson, A., and van Andel, T.H. (Eds.), Proc. ODP, Sci.Results, 138: College Station, TX (Ocean Drilling Program), 73–101.
Shackleton, N.J., Crowhurst, S.J., Weedon, G.P., and Laskar, J., 1999. Astronomicalcalibration of Oligocene–Miocene time. Philos. Trans. R. Soc. London, Ser. A,357:1907–1929.
Shipboard Scientific Party, 1998. Site 1052. In Norris, R.D., Kroon, D., Klaus, A., et al.,Proc. ODP, Init. Repts., 171B, 241–319 [Online]. Available from World Wide Web:<http://www-odp.tamu.edu/publications/171B_IR/CHAP_06.PDF>. [Cited 2004-04-10]
Shipboard Scientific Party, 2002a. Leg 198 summary. In Bralower, T.J., Premoli Silva,I., Malone, M.J., et al., Proc. ODP, Init. Repts., 198, 1–148 [Online]. Available fromWorld Wide Web: http://www-odp.tamu.edu/publications/198_IR/VOLUME/CHAPTERS/IR198_01.PDF. [Cited 2004-04-10]
Shipboard Scientific Party, 2002b. Site 1218. In Lyle, M., Wilson, P.A., Janecek, T.R., etal., Proc. ODP, Init. Repts., 199, 1–126 [Online]. Available from World Wide Web:http://www-odp.tamu.edu/publications/199_IR/VOLUME/CHAPTERS/IR199_11.PDF. [Cited 2004-04-10]
Shipboard Scientific Party, 2002c. Site 1219. In Lyle, M., Wilson, P.A., Janecek, T.R., etal., Proc. ODP, Init. Repts., 199, 1–129 [Online]. Available from World Wide Web:http://www-odp.tamu.edu/publications/199_IR/VOLUME/CHAPTERS/IR199_12.PDF. [Cited 2004-04-10]
Shipboard Scientific Party, 2003. Leg 202 summary. In Mix, A.C., Tiedemann, R.,Blum, P., et al., Proc. ODP, Init. Repts., 202, 1–145 [Online]. Available from WorldWide Web: <http://www-odp.tamu.edu/publications/202_IR/VOLUME/CHAP-TERS/IR202_01.PDF>. [Cited 2004-04-10]
Skinner, L.C., and McCave, I.N., 2003. Analysis and modelling of gravity and pistoncoring based on soil mechanics. Mar. Geol., 199(1–2):181–204.
Wade, B.S., and Pälike, H., 2004. Oligocene climate dynamics. Paleoceanography,19:10.1029/2004PA001042.
H. PÄLIKE ET AL.INTEGRATED STRATIGRAPHIC CORRELATION AND IMPROVED COMPOSITE DEPTH SCALES 12
Figure F1. Site map of Ocean Drilling Program (ODP) Leg 199 drilling sites, on ETOPO2 bathymetry. DSDP= Deep Sea Drilling Project, F.Z. = fracture zone.
0°
88
Site 1215
Site 1216
Site 1217
Site 1218
Site 1219
Site 1220
Site 1221
Site 1222
40 and 41
42
43
1223
1224
67
69
315
70
71
72
160161
162
163
77 and 573
842 and 843
574
575
Honolulu
Leg 199 SitesODP/DSDP Sites
Clarion F.Z.
742 km
160°W 150° 140° 130°
10°
20°
30°N
0 500 1000 km
-6 -5 -4 -3 -2 -1
Bathymetry (km)
Molokai F.Z.
Clipperton F.Z.
316
H. PÄLIKE ET AL.INTEGRATED STRATIGRAPHIC CORRELATION AND IMPROVED COMPOSITE DEPTH SCALES 13
Figure F2. Illustration of mbsf, mcd, and revised mcd (rmcd) depth scale concept. GRA = gamma ray atten-uation.
Driller's depthHoles A, B, C
Compositedepth and splice
"Stretched and squeezed"revised composite and stack
60
70
80
90
100
110
50
60
70
80
90
100
60
70
80
90
100
110
Dep
th (
mbs
f)
Dep
th (
mcd
)
Dep
th (
rmcd
)
1.0 1.4 1.81.0 1.4 1.81.0 1.4 1.81.0 1.4 1.81.0 1.4 1.8
GRA density(g/cm3)
GRA density(g/cm3)
GRA density(g/cm3)

H. PÄLIKE ET AL.INTEGRATED STRATIGRAPHIC CORRELATION AND IMPROVED COMPOSITE DEPTH SCALES 14
Figure F3. Site 1218 MST data on rmcd scale and stack. GRA= gamma ray attenuation. (Continued on nextfive pages.)
Magneticpolarity
1218A
Color L*(%)
1218B1218C
0
10
20
30
40
50
Dep
th (
rmcd
)
1.0 1.2
040
20 40 60
Magneticsusceptibility
(10-6 SI)
GRA density(g/cm3)

H. PÄLIKE ET AL.INTEGRATED STRATIGRAPHIC CORRELATION AND IMPROVED COMPOSITE DEPTH SCALES 15
Figure F3 (continued).D
epth
(rm
cd)
1.0 1.4
02040
20 60
1218A1218B
1218C
Magneticpolarity Color L*
(%) Magneticsusceptibility
(10-6 SI)
GRA density(g/cm3)
50
60
70
80
90
100

H. PÄLIKE ET AL.INTEGRATED STRATIGRAPHIC CORRELATION AND IMPROVED COMPOSITE DEPTH SCALES 16
Figure F3 (continued).
1.0 1.4
02040
20 60
1218A1218B
1218C
Dep
th (
rmcd
)
Magneticpolarity Color L*
(%) Magneticsusceptibility
(10-6 SI)
GRA density(g/cm3)
100
110
120
130
140
150

H. PÄLIKE ET AL.INTEGRATED STRATIGRAPHIC CORRELATION AND IMPROVED COMPOSITE DEPTH SCALES 17
Figure F3 (continued).
1.4 1.6
01020
60 80
1218A1218B
1218C
150
160
170
180
190
200
Dep
th (
rmcd
)
Magneticpolarity Color L*
(%) Magneticsusceptibility
(10-6 SI)
GRA density(g/cm3)
H. PÄLIKE ET AL.INTEGRATED STRATIGRAPHIC CORRELATION AND IMPROVED COMPOSITE DEPTH SCALES 18
Figure F3 (continued).
1.2 1.6
02040
20 60
200
210
220
230
240
250
1218A1218B
1218C
Dep
th (
rmcd
)
Magneticpolarity Color L*
(%) Magneticsusceptibility
(10-6 SI)
GRA density(g/cm3)

H. PÄLIKE ET AL.INTEGRATED STRATIGRAPHIC CORRELATION AND IMPROVED COMPOSITE DEPTH SCALES 19
Figure F3 (continued).
1.2 1.6 2.0
04080
20 60
250
260
270
280
290
300
1218A1218B
1218C
Dep
th (
rmcd
)
Color L*(%) Magnetic
susceptibility(10-6 SI)
GRA density(g/cm3)
H. PÄLIKE ET AL.INTEGRATED STRATIGRAPHIC CORRELATION AND IMPROVED COMPOSITE DEPTH SCALES 20
Figure F4. Site 1219 MST data on rmcd scale and stack. GRA = gamma ray attenuation. (Continued on nextfive pages.)
1219A 1219B
1.0 1.4
02040
20 40 60 80
Dep
th (
rmcd
)
Magneticpolarity Color L*
(%) Magneticsusceptibility
(10-6 SI)
GRA density(g/cm3)
0
10
20
30
40
50

H. PÄLIKE ET AL.INTEGRATED STRATIGRAPHIC CORRELATION AND IMPROVED COMPOSITE DEPTH SCALES 21
Figure F4 (continued).
1219A 1219B
1.0 1.4
020
40 60 80
50
60
70
80
90
100
Dep
th (
rmcd
)
Magneticpolarity Color L*
(%) Magneticsusceptibility
(10-6 SI)
GRA density(g/cm3)

H. PÄLIKE ET AL.INTEGRATED STRATIGRAPHIC CORRELATION AND IMPROVED COMPOSITE DEPTH SCALES 22
Figure F4 (continued).
1219A 1219B
1.2 1.6
020
60 80
100
110
120
130
140
150
Dep
th (
rmcd
)
Magneticpolarity Color L*
(%) Magneticsusceptibility
(10-6 SI)
GRA density(g/cm3)

H. PÄLIKE ET AL.INTEGRATED STRATIGRAPHIC CORRELATION AND IMPROVED COMPOSITE DEPTH SCALES 23
Figure F4 (continued).
1219A 1219B
1.2 1.6
02040
40 60 80
150
160
170
180
190
200
Dep
th (
rmcd
)
Magneticpolarity Color L*
(%) Magneticsusceptibility
(10-6 SI)
GRA density(g/cm3)
H. PÄLIKE ET AL.INTEGRATED STRATIGRAPHIC CORRELATION AND IMPROVED COMPOSITE DEPTH SCALES 24
Figure F4 (continued).
1219A 1219B
1.2 1.6
02040
40 60 80
200
210
220
230
240
250
Dep
th (
rmcd
)
Magneticpolarity Color L*
(%) Magneticsusceptibility
(10-6 SI)
GRA density(g/cm3)

H. PÄLIKE ET AL.INTEGRATED STRATIGRAPHIC CORRELATION AND IMPROVED COMPOSITE DEPTH SCALES 25
Figure F4 (continued).
1219A 1219B
1.2 1.6 2.0
04080
40 60 80
250
260
270
280
Dep
th (
rmcd
)
Magneticpolarity Color L*
(%)Magnetic
susceptibility(10-6 SI)
GRA density(g/cm3)

H. PÄLIKE ET AL.INTEGRATED STRATIGRAPHIC CORRELATION AND IMPROVED COMPOSITE DEPTH SCALES 26
Figure F5. Site-to-site correlation of MST data (Sites 1218 and 1219). GRA = gamma ray attenuation.
Site 1218 depth (rmcd)
C7n C7An C8n C9n C10nC6Cn1218
1219
1218
1219
1218
12181219
1219
90 100 110 120 130 140 150 160 170
1.2
1.6
40
60
80
0
10
20Mag
netic
susc
eptib
ility
(10-
6 S
I)C
olor
L*
(%)
GR
Ade
nsity
(g/c
m3 )
Mag
netic
pola
rity

H. PÄLIKE ET AL.INTEGRATED STRATIGRAPHIC CORRELATION AND IMPROVED COMPOSITE DEPTH SCALES 27
Figure F6. Estimated CaCO3 content regressions from stacked MST data for Sites 1218 and 1219, comparedwith subsidence estimates, and shown against rmcd and the timescale of Cande and Kent (1995). MST =multisensor track, CCD = carbonate compensation depth.
60 80 100 120 140 160 180 200
CCD depthCCD depthSite 1219 subsidence
220 240
Site 1218 depth (rmcd)
20 22 24 26 28 30 32 34
Age CK1995 (Ma)
Age (Ma)
C6CnC6n C6AnC6Bn C13nC12nC11nC10nC9nC8nC7n
Miocene/OligoceneBoundary
1218
1219
1218
1219
0
40
80
0
40
80
4.0
4.4
CaC
O3
(wt%
)(M
ST
est
imat
e)
Miocene/OligoceneBoundary
20 22 24 26 28 30 32 34
Site 1218 subsidence
CaC
O3
(wt%
)(M
ST
est
imat
e)P
aleo
dept
h(k
m)

H. PÄLIKE ET AL.INTEGRATED STRATIGRAPHIC CORRELATION AND IMPROVED COMPOSITE DEPTH SCALES 28
Figure F7. Stacked gamma ray attenuation (GRA) bulk density data for Sites 1218 and 1219, adjusted towireline logging depth scale (lmbsf). GRA = gamma ray attenuation, FMS = Formation Microscanner, uncal.= uncalibrated.
120 140
ODP1218
ODP1219
ODP1218A
C13n C16nC12nC11nC10nC9n C17n
ODP1218A
ODP1218
ODP1219
160 180 200 220
Depth (mbsf)
GR
A d
ensi
ty(g
/cm
3 )Li
thod
ens.
(g/c
m3 )
FM
S u
ncal
.co
nduc
tivity
Lim
esto
nepo
rosi
tylo
g
1.2
1.6
2.0
1.2
1.6
2.0
low
high
low
high

H. PÄLIKE ET AL.INTEGRATED STRATIGRAPHIC CORRELATION AND IMPROVED COMPOSITE DEPTH SCALES 29
Table T1. Revised composite depth scale for Site 1218. (See table notes. Continued on next two pages.)
Core
Depth
SPL(mbsf) (mcd) (rmcd)
199-1218A-1H 0.00 0.00 0.00 TS1H 6.54 6.54 6.54 S1H 7.28 7.28 7.351H 8.26 8.26 8.26 B2H 8.20 8.98 9.35 T2H 8.58 9.36 9.782H 9.36 10.14 10.282H 10.24 11.02 10.942H 10.68 11.46 11.46 S2H 17.26 18.04 18.04 S2H 18.00 18.78 18.70 B3H 17.70 20.04 20.04 T3H 18.40 20.74 20.773H 18.84 21.18 21.243H 21.00 23.34 23.34 S3H 26.52 28.86 28.86 S3H 26.70 29.04 29.283H 27.81 30.15 30.45 B4H 27.20 31.62 31.35 T4H 29.36 33.78 33.78 S4H 36.02 40.44 40.44 S4H 37.08 41.50 41.15 B5H 36.70 41.50 41.75 T5H 37.52 42.32 42.695H 39.70 44.50 44.50 S5H 45.90 50.70 50.70 S5H 46.40 51.20 51.20 B6H 46.20 53.04 52.92 T6H 47.82 54.66 54.66 S6H 54.58 61.42 61.42 S6H 55.37 62.21 62.41 B7H 55.70 63.76 63.46 T7H 57.14 65.20 65.20 S7H 63.28 71.34 71.34 S7H 65.75 73.81 74.01 B8H 65.20 73.16 73.16 T8H 68.09 76.05 76.05 S8H 72.32 80.28 80.28 S8H 74.18 82.14 82.30 B9H 74.70 84.96 84.96 T9H 77.16 87.42 87.42 S9H 83.32 93.58 93.58 S9H 84.73 94.99 95.09 B10H 84.20 96.10 96.00 T10H 87.56 99.46 99.46 S10H 92.62 104.52 104.52 S10H 93.91 105.81 105.56 B11H 93.70 107.10 106.72 T11H 94.84 108.24 107.9511H 95.54 108.94 108.9411H 97.42 110.82 110.7211H 98.06 111.46 111.3311H 98.32 111.72 111.72 S11H 102.56 115.96 115.96 S11H 103.77 117.17 117.17 B12H 103.20 117.67 117.67 T12H 107.11 121.58 121.58 S12H 110.32 124.79 124.79 S12H 111.22 125.69 125.9112H 112.86 127.33 127.41 B13H 112.70 127.61 127.51 T13H 113.14 128.05 128.3913H 113.34 128.25 128.6013H 113.72 128.63 128.9513H 114.59 129.47 129.7713H 116.92 131.83 131.83 S13H 120.64 135.55 135.55 S13H 122.81 137.72 137.57 B
14H 122.20 137.62 137.77 T14H 124.10 139.52 139.52 S14H 130.74 146.16 146.16 S14H 131.77 147.19 147.19 B15H 131.70 147.92 147.92 T15H 133.90 150.12 150.12 S15H 141.18 157.40 157.40 S15H 141.87 158.09 158.09 B16H 141.20 159.04 158.74 T16H 144.26 162.10 161.9116H 145.48 163.32 163.32 S16H 149.34 167.18 167.18 S16H 150.83 168.67 168.67 B17H 150.70 168.60 168.60 T17H 157.10 175.00 173.9617H 160.84 178.74 177.68 B18H 160.20 180.76 180.02 T18H 161.25 181.81 181.1718H 162.00 182.56 181.9618H 162.64 183.20 183.20 S18H 166.20 186.76 186.76 S18H 167.51 188.07 188.0818H 169.71 190.27 190.02 B19H 169.70 190.08 190.08 T19H 170.68 191.06 191.06 S19H 177.96 198.34 198.34 S19H 178.36 198.74 198.5219H 179.83 200.21 199.60 B20H 179.20 201.48 201.48 T20H 180.72 203.00 203.00 S20H 187.62 209.90 209.90 S20H 188.52 210.80 210.80 B21X NA NA NA22X 195.90 218.20 218.40 T22X 197.34 219.64 219.7222X 202.26 224.56 224.5822X 203.63 225.93 225.72 B23X 205.50 228.74 229.04 T23X 206.36 229.60 230.1623X 206.90 230.14 230.3823X 207.52 230.76 230.76 S23X 212.42 235.66 235.66 S23X 212.88 236.12 236.1223X 215.39 238.63 238.63 B24X 215.10 240.18 240.05 T24X 215.64 240.72 240.7224X 216.02 241.10 241.1624X 216.42 241.50 241.5024X 216.70 241.78 241.8024X 217.60 242.68 242.6024X 218.19 243.27 243.0024X 220.06 245.14 244.5824X 221.46 246.54 245.8424X 223.28 248.36 247.3024X 223.86 248.94 247.8424X 224.92 250.00 248.75 B25X 224.70 250.97 250.87 T25X 225.39 251.66 251.6525X 225.91 252.18 252.1725X 226.12 252.39 252.2725X 226.30 252.57 252.5625X 226.48 252.75 252.6525X 226.68 252.95 252.7725X 227.78 253.93 253.7525X 228.54 254.61 254.6025X 229.00 255.13 255.3325X 230.12 256.39 256.4525X 232.60 258.87 258.7425X 234.31 260.58 260.48 B
Core
Depth
SPL(mbsf) (mcd) (rmcd)
26X 234.30 260.37 260.95 T26X 236.30 262.37 262.37 S26X 241.86 267.93 267.93 S26X 243.16 269.23 269.1526X 244.17 270.24 270.24 B27X 243.90 270.03 270.23 T27X 246.30 272.43 272.4327X 250.43 276.56 276.56 B28X 253.50 277.43 279.05 T28X 254.90 278.83 280.0328X 255.68 279.61 280.5128X 256.38 280.31 281.45 NS28X 262.98 286.91 288.05 B29X 263.10 287.33 288.47 TS29X 268.92 293.15 294.29 B30X 270.70 294.93 296.07 TS30X 274.34 298.57 299.71 B
199-1218B-1H 0.00 0.00 0.07 T1H 0.56 0.56 0.661H 1.96 1.96 1.811H 2.34 2.34 2.261H 2.82 2.82 2.701H 3.50 3.50 3.621H 3.86 3.86 3.98 B2H 3.90 5.30 5.20 T2H 4.69 5.96 6.152H 5.38 6.54 6.54 S2H 10.30 11.46 11.46 S2H 11.14 12.30 12.422H 11.28 12.44 12.542H 11.34 12.50 12.702H 12.73 13.89 14.12 B3H 13.40 17.22 16.84 T3H 13.84 17.66 17.643H 14.22 18.04 18.04 S3H 19.52 23.34 23.34 S3H 20.82 24.64 24.753H 23.39 27.21 27.36 B4H 22.90 28.08 28.08 T4H 23.68 28.86 28.86 S4H 28.60 33.78 33.78 S4H 28.96 34.14 34.244H 31.60 36.78 36.38 B5H 32.40 38.06 38.06 T5H 34.78 40.44 40.44 S5H 38.84 44.50 44.50 S5H 39.40 45.06 45.065H 42.42 48.08 48.38 B6H 41.90 49.56 49.36 T6H 43.04 50.70 50.70 S6H 47.00 54.66 54.66 S6H 49.63 57.29 57.296H 51.02 58.68 58.65 B7H 51.40 58.69 58.99 T7H 54.13 61.42 61.42 S7H 57.91 65.20 65.20 S7H 58.20 65.49 65.567H 61.27 68.56 68.26 B8H 60.90 69.29 69.29 T8H 62.95 71.34 71.34 S8H 67.66 76.05 76.05 S8H 70.28 78.67 78.47 B9H 70.40 78.74 78.74 T9H 71.94 80.28 80.28 S9H 79.08 87.42 87.42 S9H 79.66 88.00 87.809H 80.47 88.81 88.81 B10H 79.90 90.70 90.40 T
Core
Depth
SPL(mbsf) (mcd) (rmcd)

H. PÄLIKE ET AL.INTEGRATED STRATIGRAPHIC CORRELATION AND IMPROVED COMPOSITE DEPTH SCALES 30
10H 80.22 91.02 91.2910H 82.78 93.58 93.58 S10H 88.66 99.46 99.46 S10H 89.68 100.48 100.48 B11H 89.40 102.78 102.68 T11H 91.14 104.52 104.52 S11H 98.34 111.72 111.72 S11H 99.41 112.79 112.90 B12H 98.90 114.14 113.84 T12H 99.94 115.18 115.1512H 100.72 115.96 115.96 S12H 106.34 121.58 121.58 S12H 109.07 124.31 124.01 B13H 108.40 123.89 124.02 T13H 109.30 124.79 124.79 S13H 116.34 131.83 131.83 S13H 118.51 134.00 134.00 B14H 117.90 134.36 134.36 T14H 119.09 135.55 135.55 S14H 123.06 139.52 139.52 S14H 127.76 144.22 144.48 B15H 127.40 145.22 145.02 T15H 128.34 146.16 146.16 S15H 132.30 150.12 150.12 S15H 135.60 153.42 153.6215H 137.41 155.23 155.23 B16H 136.90 155.92 155.92 T16H 138.38 157.40 157.40 S16H 144.30 163.32 163.32 S16H 145.92 164.94 164.74 B17H 146.40 166.18 166.18 T17H 147.40 167.18 167.18 S17H 154.36 174.14 174.14 S17H 156.41 176.19 176.19 B18H 155.90 176.02 176.22 T18H 159.08 179.20 179.20 S18H 163.08 183.20 183.20 S18H 164.56 184.68 184.9618H 165.91 186.03 186.03 B19X 165.40 184.44 184.79 T19X 166.61 185.65 185.7619X 166.99 186.03 186.3919X 169.43 188.47 188.0019X 172.83 191.87 191.8519X 175.20 194.24 194.24 B20X 175.10 195.80 195.96 T20X 175.95 196.65 196.6820X 177.64 198.34 198.34 S20X 182.30 203.00 203.00 S20X 183.71 204.41 205.35 B21X 184.80 207.32 207.32 T21X 187.38 209.90 209.90 S21X 192.96 215.48 215.48 S21X 193.42 215.94 215.7821X 194.50 217.02 216.92 B22X 194.40 217.42 217.42 T22X 195.36 218.38 218.38 S22X 203.23 226.25 226.25 S22X 203.99 227.01 227.26 B23X 204.10 227.88 228.82 T23X 205.48 229.34 230.2623X 206.20 230.10 230.7223X 206.99 230.89 231.4323X 208.34 232.22 232.4423X 209.65 233.51 233.7223X 210.00 233.85 233.9523X 211.88 235.70 235.7323X 212.68 236.48 236.3523X 213.02 236.81 236.87
Core
Depth
SPL(mbsf) (mcd) (rmcd)
Table T1 (continued).
23X 213.82 237.60 237.60 B24X 213.70 240.16 240.21 T24X 214.20 240.66 240.7324X 214.72 241.18 241.18 S24X 222.14 248.60 248.60 S24X 222.36 248.82 249.2324X 222.60 249.06 249.7724X 223.46 249.92 250.50 B25X 223.30 251.43 251.05 T25X 223.78 251.91 251.7825X 224.24 252.37 252.2525X 224.61 252.74 252.5725X 224.72 252.85 252.7525X 227.60 255.73 255.63 B26X 228.30 255.91 255.91 T26X 228.70 256.31 256.31 S26X 234.76 262.37 262.37 S26X 235.88 263.49 263.7126X 237.89 265.50 265.80 B27X 237.90 267.03 266.80 T27X 238.80 267.93 267.93 S27X 246.72 275.85 275.85 S27X 247.65 276.78 276.78 B28X 247.50 278.03 278.03 T28X 249.20 279.73 279.6528X 249.80 280.33 280.3228X 250.90 281.43 281.2728X 252.67 283.20 283.40 B29X 257.20 287.83 290.33 T29X 258.52 289.15 291.2729X 258.82 289.45 291.9729X 259.74 290.37 292.7129X 261.64 292.27 294.57 B
199-1218C-1H 55.00 63.04 62.84 T1H 57.46 65.50 65.661H 59.42 67.46 67.601H 61.36 69.40 69.491H 64.96 73.00 73.25 B2H 64.50 73.86 73.65 T2H 65.30 74.66 74.662H 68.92 78.28 78.462H 71.56 80.92 81.362H 74.03 83.39 83.64 B3H 74.00 83.78 83.65 T3H 74.95 84.73 84.733H 77.40 87.18 87.283H 80.94 90.72 90.713H 84.16 93.94 93.54 B4H 83.50 95.08 94.83 T4H 87.54 99.12 99.124H 92.18 103.76 104.40 B5H 93.00 105.82 105.75 T5H 94.75 107.59 107.475H 98.64 111.44 111.615H 100.17 112.97 113.445H 101.35 114.16 114.865H 103.13 115.95 116.95 B6H 102.50 118.08 118.08 T6H 105.40 120.98 121.736H 107.10 122.68 123.026H 107.82 123.40 123.886H 112.24 127.82 127.60 B7H 112.00 126.09 127.00 T7H 113.89 127.98 127.907H 114.00 128.09 128.257H 114.40 128.49 128.577H 115.90 129.99 130.017H 117.96 132.05 131.86
Core
Depth
SPL(mbsf) (mcd) (rmcd)
7H 119.24 133.33 132.957H 122.21 136.30 135.90 B8H 121.50 135.97 135.97 T8H 124.92 139.39 139.438H 127.28 141.75 141.968H 128.53 143.00 143.398H 131.27 145.74 145.74 B9H 131.00 146.90 147.20 T9H 135.10 151.00 150.959H 138.90 154.80 154.609H 141.08 156.98 156.98 B10H 144.50 162.34 162.34 T10H 145.60 163.44 163.4410H 150.30 168.14 167.8010H 154.26 172.10 171.60 B11H 154.00 172.62 172.62 T11H 155.52 174.14 174.14 S11H 160.58 179.20 179.20 S11H 163.99 182.61 183.06 B12X 163.50 183.28 183.85 T12X 164.78 184.56 184.7912X 166.27 185.05 186.0412X 166.98 186.76 186.76 S12X 171.28 191.06 191.06 S12X 172.23 192.01 192.01 B13X 172.00 191.76 191.76 T13X 178.58 198.34 198.3413X 178.97 198.73 198.5013X 179.81 199.57 199.1013X 180.09 199.85 199.3013X 181.33 201.09 199.99 B14X 181.60 201.41 202.21 T14X 186.92 206.73 206.7314X 191.18 210.99 210.99 B15X 191.20 213.12 213.12 T15X 192.54 214.46 214.4615X 193.22 215.14 214.9215X 193.56 215.48 215.48 S15X 196.46 218.38 218.38 S15X 198.60 220.52 220.9415X 199.28 221.20 222.1615X 199.66 221.58 222.6215X 200.99 222.91 223.79 B16X 200.80 224.70 224.40 T16X 202.18 226.08 225.9016X 202.35 226.25 226.25 S16X 206.86 230.76 230.76 S16X 207.86 231.76 231.8816X 209.34 233.24 233.24 B17X 210.40 233.86 233.86 T17X 212.20 235.66 235.66 S17X 217.72 241.18 241.18 S17X 218.12 241.58 241.5017X 218.50 241.96 241.9117X 219.40 242.86 242.9217X 220.12 243.58 243.66 B18X 223.00 247.42 247.52 T18X 224.18 248.60 248.60 S18X 231.89 256.31 256.31 S18X 232.74 257.16 257.16 B19X 232.60 257.53 258.48 T19X 234.22 259.15 259.6919X 235.36 260.29 260.7819X 236.15 261.08 261.1819X 237.58 262.51 262.5119X 238.84 263.78 263.8819X 239.68 264.62 264.9019X 240.42 265.36 266.1619X 240.82 265.76 267.00
Core
Depth
SPL(mbsf) (mcd) (rmcd)

H. PÄLIKE ET AL.INTEGRATED STRATIGRAPHIC CORRELATION AND IMPROVED COMPOSITE DEPTH SCALES 31
Notes: mbsf = meters below seafloor, mcd = meters compositedepth, rmcd = revised meters composite depth. The SPL columnindicates whether a particular tie-point corresponds to a splicepoint (S), to modified splice points (NS), or to the top (T) or bot-tom (B) of a core. NA = not available. This table is also availablein ASCII.
19X 242.20 267.13 268.75 B20X 242.20 269.65 269.45 T20X 244.98 272.43 272.4820X 247.73 275.18 275.18 B21X 247.20 274.77 274.77 T21X 248.28 275.85 275.85 S21X 253.88 281.45 281.45 NS21X 254.34 281.91 282.1521X 255.30 282.87 283.6521X 256.68 284.25 285.33 B
Core
Depth
SPL(mbsf) (mcd) (rmcd)
Table T1 (continued).
H. PÄLIKE ET AL.INTEGRATED STRATIGRAPHIC CORRELATION AND IMPROVED COMPOSITE DEPTH SCALES 32
Table T2. Revised composite depth scale for Site 1219. [N1]
Depth
Core (mbsf) (mcd) (rmcd) SPL
199-1219A-1H 0.00 0.00 0.00 TS1H 5.95 5.95 5.95 BS2H 6.00 6.00 6.00 TS2H 15.78 15.66 15.78 S2H 16.04 16.04 16.04 B3H 15.50 15.50 15.50 T3H 15.78 15.66 15.78 S3H 23.32 23.32 23.32 S3H 25.35 25.35 25.50 B4H 25.00 25.88 25.88 T4H 29.97 30.85 30.85 S4H 33.78 34.66 34.66 S4H 34.87 35.75 35.75 B5H 34.50 36.79 36.79 T5H 37.48 39.77 39.77 S5H 43.90 46.19 46.19 S5H 44.47 46.76 46.76 B6H 44.00 48.02 47.58 T6H 45.49 49.33 49.51 S6H 51.24 55.26 55.26 S6H 52.15 56.17 56.176H 53.95 57.97 57.57 B7H 53.50 55.57 55.87 T7H 55.56 57.63 58.007H 56.82 58.89 58.607H 57.44 59.51 59.307H 60.33 62.40 62.40 S7H 62.12 63.98 64.19 S7H 62.99 65.06 65.06 B8H 63.00 66.05 66.05 T8H 69.21 72.26 72.26 S8H 72.32 75.37 75.37 S8H 73.09 76.14 76.45 B9H 72.50 79.87 79.32 T9H 75.01 82.38 82.38 S9H 81.98 89.35 89.35 S9H 82.39 89.76 89.76 B10H 82.00 90.97 91.77 T10H 89.32 98.29 99.09 NS?10H 91.62 100.59 100.80 B11H 91.50 104.91 102.07 T11H 92.98 106.08 103.55 S11H 97.58 110.99 108.15 S11H 101.19 114.60 111.76 B12H 101.00 116.13 113.29 T12H 103.55 118.68 115.84 S12H 108.78 123.65 121.07 S12H 111.14 126.27 123.43 B13H 110.50 130.31 127.25 TS13H 117.30 136.89 134.05 S13H 118.16 137.75 135.10
13H 120.13 139.72 136.88 B14H 120.00 141.45 138.61 T14H 127.08 148.53 145.5314H 130.01 151.46 148.62 B15H 129.50 152.49 149.51 TS15H 139.27 162.12 159.28 BS16H 139.00 163.33 160.49 TS16H 148.94 173.27 170.43 BS17H 148.50 173.83 170.99 TS17H 158.33 183.66 180.82 BS18H 158.00 184.33 181.49 TS18H 168.02 194.35 191.51 BS19H 167.50 194.89 191.99 TS19H 177.01 204.34 201.50 BS20H 177.00 205.33 202.49 TS20H 186.93 215.26 212.42 BS21H 186.50 215.71 212.99 TS21H 196.35 225.68 222.84 BS22H 196.00 226.33 223.49 TS22H 205.84 236.17 233.33 BS23H 205.50 236.83 233.99 TS23H 215.47 246.80 243.96 BS24H 215.00 247.33 244.49 TS24H 224.91 257.24 254.40 BS25X 224.50 257.83 254.99 TS25X 226.95 260.28 257.44 BS26X 234.10 268.43 265.59 TS26X 238.10 272.43 269.59 BS27X 243.70 279.03 276.19 TS27X 244.92 280.25 277.41 BS
199-1219B-2H 21.00 22.56 22.56 T2H 21.76 23.32 23.32 S2H 29.29 30.85 30.85 S2H 30.95 32.51 32.51 B3H 30.50 33.85 33.85 T3H 31.31 34.66 34.66 S3H 36.42 39.77 39.77 S3H 36.84 40.19 40.193H 39.68 43.03 42.73 B4H 40.00 44.41 44.41 T4H 41.78 46.19 46.19 S4H 45.10 49.33 49.51 S4H 46.52 50.82 50.934H 48.75 53.16 52.86 B5H 49.50 54.40 54.40 T5H 50.36 55.26 55.26 S5H 57.50 62.40 62.40 S5H 58.79 63.69 63.39 B6H 59.00 63.34 63.34 T6H 59.85 63.98 64.19 S
Depth
Core (mbsf) (mcd) (rmcd) SPL
Notes: mbsf = meters below seafloor,mcd = meters composite depth, rmcd= revised meters composite depth.The SPL column indicates whether aparticular tie-point corresponds to asplice point (S), to modified splicepoints (NS), or to the top (T) or bot-tom (B) of a core. This table is alsoavailable in ASCII.
6H 67.92 72.26 72.26 S6H 68.97 73.31 73.31 B7H 68.50 74.48 74.48 T7H 69.39 75.37 75.37 S7H 76.40 82.38 82.38 S7H 78.30 84.28 84.00 B8H 78.00 89.91 84.50 TS8H 78.84 90.75 85.618H 79.42 91.33 86.798H 80.84 92.75 88.268H 88.10 100.01 95.52 BS9H 87.50 100.11 96.87 TS9H 88.92 101.46 98.699H 92.82 105.17 102.599H 93.78 106.08 103.55 S9H 97.00 109.61 106.97 B10H 97.00 110.20 107.36 T10H 97.79 110.99 108.15 S10H 105.48 118.68 115.84 S10H 106.81 120.01 117.17 B11H 106.50 120.57 117.73 T11H 109.84 123.65 121.07 S11H 116.14 130.42 127.37 S11H 116.38 130.45 127.61 B12H 116.00 131.29 128.20 T12H 121.60 136.89 134.05 S12H 125.74 141.03 138.19 S12H 125.88 141.17 138.33 B13H 125.50 141.79 138.95 T13H 125.50 141.79 138.95 S13H 134.98 151.34 148.43 S13H 135.18 151.47 148.63 B14H 135.00 152.29 150.00 T14H 140.24 157.53 154.6914H 145.13 162.42 159.58 B15H 144.50 163.85 160.85 T15H 149.98 169.33 166.4915H 153.18 172.53 169.99 B16H 154.00 173.35 170.81 T16H 157.95 177.30 174.76 B
Depth
Core (mbsf) (mcd) (rmcd) SPL

H. PÄLIKE ET AL.INTEGRATED STRATIGRAPHIC CORRELATION AND IMPROVED COMPOSITE DEPTH SCALES 33
Table T3. Stacked multisensor track data from Site 1218 (on 1218 rmcd depth scale).
Depth (rmcd)
GRA stack (g/cm3)
MS stack (10–6 SI)
Color reflectance stack (%)
L* a* b*
0.42 1.090 19.4 52.65 7.11 20.860.44 1.067 20.0 51.83 6.76 20.250.46 1.091 20.5 51.49 6.46 19.740.48 1.114 20.7 52.01 6.50 19.830.50 1.098 20.5 53.26 7.15 20.910.52 1.081 20.4 53.90 7.47 21.410.54 1.092 21.0 54.21 7.31 20.910.56 1.104 22.0 54.50 7.18 20.310.58 1.103 22.4 54.60 7.19 20.410.60 1.100 22.2 54.36 7.27 20.610.62 NA 21.7 53.58 7.16 20.340.64 1.079 18.4 52.90 7.09 20.260.66 NA 18.5 53.31 7.25 20.600.68 1.058 19.8 53.72 7.46 20.590.70 1.054 21.3 54.34 7.45 20.140.72 1.053 22.1 54.59 7.29 20.020.74 1.078 22.1 54.19 7.16 20.160.76 1.104 22.3 54.11 7.14 20.250.78 1.107 22.7 54.62 7.16 20.100.80 1.107 23.0 54.62 7.04 19.770.82 1.111 23.0 54.23 6.97 19.750.84 1.116 23.1 53.96 7.07 20.240.86 1.114 23.2 53.60 7.26 20.780.88 1.111 23.0 53.44 7.39 20.880.90 1.092 22.6 53.48 7.30 20.760.92 1.074 22.4 53.63 7.14 20.640.94 1.090 22.3 53.21 7.02 20.390.96 1.108 22.5 53.13 6.96 20.140.98 1.124 22.7 53.76 7.07 20.171.00 1.138 22.6 54.20 7.07 20.041.02 1.117 22.2 54.15 6.83 19.511.04 1.093 21.4 54.09 6.80 19.641.06 1.086 20.7 54.07 6.92 20.061.08 1.081 20.7 53.89 6.91 19.911.10 1.090 20.7 54.04 6.85 19.691.12 1.101 21.0 54.73 6.96 19.881.14 1.108 20.7 55.10 7.22 20.591.16 1.114 19.7 55.34 7.29 20.791.18 1.100 19.6 55.87 7.04 19.461.20 1.087 21.0 56.32 6.58 17.201.22 1.093 22.3 56.31 6.27 16.051.24 1.099 23.0 56.03 6.16 15.701.26 1.086 23.6 54.28 6.10 15.451.28 1.072 23.8 52.51 5.98 15.031.30 1.089 23.5 53.01 5.91 14.741.32 1.108 23.1 53.51 5.97 14.901.34 1.117 23.0 53.36 6.12 15.301.36 1.125 NA 53.89 6.28 15.631.38 NA NA 53.60 6.31 15.541.56 NA 23.2 54.27 7.41 20.011.58 1.136 23.8 54.35 7.34 19.651.60 1.113 24.2 54.44 7.57 20.501.62 1.090 24.3 54.85 7.76 21.171.64 1.091 24.7 55.16 7.67 20.741.66 1.094 24.1 54.19 7.33 19.791.68 1.103 24.6 52.33 6.81 18.741.70 1.099 25.0 51.98 6.74 18.811.72 1.104 25.5 53.52 7.23 19.951.74 1.119 26.5 52.18 6.92 19.251.76 1.122 27.6 52.49 7.27 20.111.78 1.112 28.1 52.79 7.29 20.271.80 1.106 27.2 53.40 7.38 20.521.82 1.107 26.6 53.76 7.50 20.861.84 1.110 26.8 53.07 7.36 20.631.86 1.113 27.3 52.56 7.02 19.971.88 1.108 27.2 53.26 7.09 20.121.90 1.103 26.4 54.02 7.44 21.031.92 1.102 25.4 54.23 7.66 21.481.94 1.101 24.8 54.26 7.66 21.41
Notes: GRA = gamma ray attenuation, MS = magneticsusceptibility, NA = not available. Only a portion ofthis table appears here. The complete table is avail-able in ASCII.
1.96 1.099 24.6 53.49 7.48 20.921.98 1.100 24.6 52.08 7.18 20.112.00 1.102 25.1 51.70 7.05 19.812.02 1.101 25.9 50.95 6.79 19.312.04 1.108 26.2 50.35 6.43 18.402.06 1.123 26.5 51.63 6.52 18.272.08 1.131 26.9 52.61 6.86 18.972.10 1.123 27.1 50.84 6.52 18.532.12 1.119 27.4 49.30 6.01 17.672.14 1.120 27.3 49.93 6.04 17.872.16 1.121 27.1 51.05 6.23 18.062.18 1.119 27.0 51.86 6.30 18.052.20 1.119 26.3 52.71 6.43 18.422.22 1.117 25.3 53.56 6.59 18.812.24 1.099 24.3 52.93 6.40 17.962.26 1.079 23.6 52.22 6.35 17.372.28 1.088 23.9 53.26 6.79 19.042.30 1.097 24.3 54.31 7.28 20.592.32 1.101 24.6 54.58 7.43 20.842.34 1.102 24.4 54.53 7.52 21.132.36 1.097 24.1 53.50 7.54 21.392.38 1.100 24.4 51.75 7.19 20.852.40 1.111 24.9 50.33 6.51 19.422.42 1.110 25.7 49.49 5.93 18.032.44 1.106 26.3 48.16 5.54 17.142.46 1.111 26.7 47.19 5.27 16.652.48 1.118 27.2 46.52 4.89 15.662.50 1.125 27.6 45.63 4.69 15.162.52 1.123 27.6 44.61 4.59 15.002.54 1.111 27.6 44.31 4.51 14.662.56 1.113 27.7 44.70 4.61 14.922.58 1.127 27.4 46.09 4.97 15.922.60 1.124 27.2 47.46 5.35 16.902.62 1.113 26.9 48.41 5.73 17.722.64 1.110 26.8 49.63 6.25 18.602.66 1.106 26.8 50.87 6.61 19.072.68 1.111 26.6 51.44 6.66 18.972.70 1.119 26.3 51.30 6.65 18.912.72 1.116 25.9 49.61 6.12 17.792.74 1.113 25.9 48.68 5.71 16.862.76 1.114 26.1 48.48 5.63 16.562.78 1.117 26.4 47.61 5.54 16.202.80 1.118 26.6 47.13 5.36 15.282.82 1.116 26.3 47.06 5.42 15.322.84 1.108 25.7 47.39 5.44 15.542.86 1.105 25.5 47.95 5.23 14.962.88 1.094 25.2 48.83 5.10 14.542.90 1.093 24.7 48.55 4.89 14.252.92 NA 24.5 45.57 4.66 14.402.94 NA NA 45.80 4.84 14.863.00 NA NA 47.95 4.90 12.183.02 NA 26.0 45.65 3.99 9.953.04 1.144 26.2 43.88 4.07 10.213.06 1.144 26.2 46.15 4.95 13.743.08 1.139 26.3 47.15 4.89 13.643.10 1.133 26.5 46.76 4.91 13.623.12 1.128 26.4 45.92 4.97 13.853.14 1.108 26.1 46.25 4.92 13.663.16 1.097 26.0 46.57 4.80 13.173.18 1.099 25.6 46.13 4.65 12.893.20 1.106 25.3 45.48 4.50 12.803.22 1.106 25.4 44.53 4.26 12.293.24 1.107 25.7 43.79 4.24 12.29
Depth (rmcd)
GRA stack (g/cm3)
MS stack (10–6 SI)
Color reflectance stack (%)
L* a* b*
H. PÄLIKE ET AL.INTEGRATED STRATIGRAPHIC CORRELATION AND IMPROVED COMPOSITE DEPTH SCALES 34
Table T4. Stacked multisensor track data from Site 1219 (on 1219 rmcd depth scale).
Depth (rmcd)
GRA stack (g/cm3)
MS stack (10–6 SI)
Color reflectance stack (%)
L* a* b*
0.68 1.096 24.2 43.47 5.68 17.450.70 1.100 24.0 40.17 5.17 15.750.72 1.104 23.9 40.00 5.27 15.430.74 1.102 23.5 40.36 5.43 15.830.76 1.100 23.1 39.93 5.33 15.400.78 1.084 22.9 39.47 5.21 14.760.80 1.067 22.8 39.86 5.28 15.260.82 NA 22.9 41.33 5.37 15.750.84 NA NA 42.98 5.59 16.090.86 NA NA 42.64 5.38 15.590.88 NA NA 42.39 5.18 15.120.90 NA NA 42.84 5.28 15.420.92 NA NA NA NA NA0.94 NA NA 42.30 5.45 16.420.96 NA NA NA NA NA0.98 NA 23.3 41.09 5.54 16.891.00 1.080 22.8 40.66 5.45 16.121.02 1.081 22.5 41.25 5.28 15.351.04 1.083 22.6 41.92 5.13 15.071.06 1.098 23.1 42.72 5.11 15.241.08 1.114 23.9 42.54 5.23 15.801.10 1.113 24.2 43.23 5.62 16.891.12 1.110 24.2 46.64 6.22 18.951.14 1.100 24.4 46.49 6.13 18.901.16 1.090 24.4 43.95 5.68 17.511.18 1.084 24.3 41.72 5.34 16.631.20 1.078 24.5 40.75 5.10 15.791.22 1.085 24.6 40.55 4.96 15.181.24 1.093 24.3 40.99 4.91 14.871.26 1.102 24.2 40.80 4.79 14.321.28 1.111 24.5 40.01 4.61 13.751.30 1.108 24.7 39.08 4.50 13.521.32 1.103 24.7 38.26 4.33 12.871.34 1.090 24.8 39.22 4.18 11.871.36 1.076 24.6 40.69 4.23 11.851.38 1.076 24.6 41.09 4.35 12.511.40 1.076 24.7 42.49 4.61 13.571.42 NA 24.6 43.25 4.67 13.631.44 NA NA 43.53 4.63 13.411.46 NA NA NA NA NA1.48 NA NA NA NA NA1.50 NA NA NA NA NA1.52 NA NA NA NA NA1.54 NA NA NA NA NA1.56 NA 24.6 45.38 3.74 10.061.58 1.084 24.9 44.69 4.07 11.151.60 1.090 25.0 42.98 4.27 11.801.62 1.096 24.7 42.03 4.18 11.741.64 1.084 24.1 42.63 4.08 11.991.66 1.072 23.5 42.86 4.12 12.881.68 1.077 23.1 42.51 4.05 12.891.70 1.084 23.0 41.72 3.47 10.541.72 1.091 22.7 43.83 3.59 10.211.74 1.099 22.3 48.06 4.33 11.931.76 1.106 22.0 46.69 4.24 11.801.78 1.114 22.1 42.41 3.90 11.601.80 1.119 22.6 39.69 3.52 11.281.82 1.123 23.4 38.56 3.44 11.371.84 1.117 24.0 38.38 3.35 11.191.86 1.110 24.4 38.10 3.25 10.641.88 1.107 24.5 38.24 3.24 10.221.90 1.104 24.4 38.57 3.27 10.271.92 1.105 24.3 38.68 3.21 9.901.94 1.106 24.5 37.67 2.99 8.881.96 1.098 24.9 37.77 3.24 9.821.98 1.088 25.0 37.43 3.45 10.522.00 1.072 25.1 37.10 3.53 11.042.02 1.058 25.3 38.04 3.67 11.912.04 1.081 25.3 39.62 3.75 12.46
Notes: GRA = gamma ray attenuation, MS = magneticsusceptibility, NA = not available. Only a portion ofthis table appears here. The complete table is avail-able in ASCII.
2.06 1.106 25.5 42.03 3.98 13.382.08 1.110 26.0 40.21 3.77 12.032.10 1.112 26.4 38.06 3.31 10.172.12 1.110 26.4 38.62 3.14 9.592.14 1.107 26.1 38.37 2.97 8.782.16 1.098 25.9 38.20 2.92 8.542.18 1.090 25.6 39.06 3.03 8.872.20 1.106 25.1 40.39 2.88 8.432.22 1.122 24.5 42.48 2.85 8.692.24 1.110 24.2 42.43 2.94 9.102.26 1.096 23.6 41.69 3.25 9.612.28 1.079 22.5 42.45 3.82 11.122.30 1.064 21.9 44.77 4.05 12.772.32 1.072 21.6 48.17 4.36 14.882.34 1.080 21.4 50.23 4.87 16.822.36 1.068 21.1 48.51 4.69 16.082.38 1.055 21.1 47.60 4.37 15.582.40 1.060 21.0 49.88 4.84 17.412.42 1.065 20.5 52.21 5.35 18.912.44 1.058 20.4 53.46 5.54 19.372.46 1.050 20.6 56.04 6.09 20.782.48 1.050 21.0 57.12 6.37 21.522.50 1.051 21.1 54.00 5.90 20.122.52 1.072 20.9 50.23 5.25 18.402.54 1.093 21.0 54.55 5.80 20.372.56 1.076 21.4 58.10 6.28 21.932.58 1.057 21.7 57.76 6.18 21.352.60 1.052 22.1 56.16 5.89 20.292.62 1.049 22.2 54.74 5.88 20.102.64 1.066 22.4 51.88 5.77 19.682.66 1.083 22.5 48.46 5.16 18.422.68 1.081 22.4 48.63 4.63 17.362.70 1.077 22.2 48.85 4.21 15.832.72 1.078 22.3 47.93 4.14 15.332.74 1.080 22.1 47.84 3.93 14.092.76 1.086 22.1 48.16 3.60 12.972.78 1.091 22.4 47.66 3.42 12.632.80 1.076 22.5 48.22 3.54 13.562.82 1.060 22.4 48.25 3.78 14.662.84 1.052 22.3 48.12 3.79 14.452.86 1.044 22.5 47.01 3.19 12.272.88 NA 22.9 44.46 2.61 9.852.90 NA NA 45.84 3.19 11.582.92 NA NA 50.67 4.51 16.252.94 NA NA NA NA NA2.96 NA NA NA NA NA2.98 NA NA NA NA NA3.00 NA NA NA NA NA3.02 NA NA NA NA NA3.04 NA NA NA NA NA3.06 NA 26.4 37.17 2.16 5.793.08 1.102 27.2 37.39 2.29 6.383.10 1.100 28.1 36.44 2.52 7.133.12 1.098 28.7 35.59 2.67 7.343.14 1.113 29.0 35.81 2.59 6.933.16 1.128 28.7 36.54 2.57 6.993.18 1.126 28.0 37.24 2.79 7.963.20 1.122 27.2 38.41 2.88 8.373.22 1.120 26.6 40.46 3.06 9.163.24 1.117 25.6 43.43 3.57 11.093.26 1.095 24.7 47.87 4.58 14.68
Depth (rmcd)
GRA stack (g/cm3)
MS stack (10–6 SI)
Color reflectance stack (%)
L* a* b*

H. PÄLIKE ET AL.INTEGRATED STRATIGRAPHIC CORRELATION AND IMPROVED COMPOSITE DEPTH SCALES 35
Table T5. Depth mapping pairs from Site 1219 to 1218 (in rmcd).
Depth (rmcd)
Site 1219 Site 1218
0.00 0.004.12 16.544.70 18.964.88 19.495.18 20.295.40 20.525.55 20.835.65 20.996.83 23.517.50 25.798.80 30.468.82 31.789.38 31.969.82 33.50
10.23 34.7814.86 40.5217.78 44.8619.54 46.6020.38 47.2220.98 47.9021.24 48.1421.34 48.3421.68 49.2022.10 49.7623.23 51.1924.04 52.3424.22 52.3824.45 52.5524.81 52.9525.12 53.2926.65 55.2227.22 55.9428.20 57.4029.37 58.9129.43 59.1529.93 59.3530.44 60.5830.86 61.3031.22 62.3231.42 62.7431.76 63.4231.92 63.7432.14 64.2032.70 65.5433.46 66.7633.96 67.6434.52 68.5835.00 69.3035.26 69.7435.48 70.1435.96 70.9836.34 71.6436.98 72.7437.78 74.1038.10 74.6839.22 76.2039.24 76.3239.88 77.1640.26 77.7440.74 78.5240.92 78.8841.28 79.6641.50 80.1041.74 80.6642.36 81.72
44.56 83.0645.04 83.7845.36 84.2645.84 85.0646.12 85.3646.56 85.9646.80 86.3047.04 86.6047.56 87.2447.82 87.7448.56 88.6049.10 89.2450.28 90.7050.88 91.7051.46 92.5251.58 92.7651.74 92.9452.04 93.3852.62 94.3853.80 96.3054.52 97.3855.12 98.2055.82 99.1456.12 99.7056.64 100.6456.88 101.0257.62 102.3657.90 103.7658.58 105.3059.10 106.7659.78 107.8860.08 108.3660.46 108.8860.76 109.3661.32 110.2261.86 110.8862.20 111.3862.52 112.0263.30 113.4463.54 115.8664.18 116.6464.42 117.0064.68 117.4265.22 118.3865.34 118.6666.64 120.5467.56 122.5068.46 123.5468.78 124.0068.94 124.2869.96 126.2870.30 127.2070.62 128.0471.14 128.6071.68 129.3272.02 129.7272.90 131.3673.28 131.7673.90 132.2274.76 132.8675.20 133.2275.64 133.7076.62 134.8677.16 135.4277.70 135.94
Depth (rmcd)
Site 1219 Site 1218
78.16 136.4879.16 137.4479.56 137.8680.34 138.7281.16 139.4481.84 140.1482.16 140.4482.60 140.9883.88 142.0485.46 142.9286.72 143.5087.36 144.4887.90 145.1088.14 145.5488.66 146.9489.12 147.8489.72 148.5690.24 148.9490.70 149.5492.06 150.9892.48 151.3892.84 151.8893.50 152.5093.96 153.1094.32 153.5694.66 153.8895.50 154.8296.56 155.7897.46 156.7898.68 157.8299.18 158.38
100.62 160.10102.52 162.06102.86 162.54103.44 163.22103.92 163.78104.88 164.70108.20 167.70109.78 169.00110.64 169.76112.22 171.38113.44 172.50114.86 173.90115.92 175.12120.14 179.38135.40 196.28136.66 198.00140.38 201.06141.46 201.94143.82 205.38144.48 205.96145.00 206.68145.84 207.68152.50 215.66156.92 220.92160.54 225.13160.84 225.46161.54 226.26161.74 226.41162.45 227.01162.62 227.18163.25 227.82163.50 228.00164.30 228.75164.65 229.02
Depth (rmcd)
Site 1219 Site 1218
Note: This table is alsoavailable in ASCII.
164.95 229.26165.11 229.38165.77 229.95165.92 230.10166.28 230.37166.68 230.69166.98 231.00167.04 231.06167.20 231.18167.70 231.82168.16 232.27168.53 232.54168.79 232.84169.08 233.17170.14 234.22170.43 234.67171.14 236.95171.90 237.82172.06 238.12172.17 238.36172.50 238.69172.81 239.11173.08 239.65173.30 240.07173.40 240.44174.40 240.94174.86 241.50177.66 244.52180.18 247.22187.30 252.92189.04 254.84193.06 257.42193.40 257.68194.32 258.90196.78 260.84199.00 262.70200.06 263.90203.42 267.24203.78 267.48207.86 270.64208.96 271.56212.04 274.34213.42 276.18214.04 276.76214.40 277.12216.06 278.92218.74 281.20219.58 282.40219.96 283.12220.50 283.80221.32 284.90221.84 285.62222.42 286.34223.84 290.12224.04 290.68224.40 291.12224.58 291.34225.38 292.52226.32 293.74227.72 296.24228.40 296.74229.98 298.12
Depth (rmcd)
Site 1219 Site 1218

H. PÄLIKE ET AL.INTEGRATED STRATIGRAPHIC CORRELATION AND IMPROVED COMPOSITE DEPTH SCALES 36
Table T6. Magnetochrons for Site 1218 and 1219, on rmcd depth scale. (See tablenotes. Continued on next two pages.)
Site 1219 mid
Top, Bottom Chron (rmcd)
1218 equivalent
(rmcd)Site 1218 mid
(rmcd)Site 1219 top
(rmcd)Site 1219 base
(rmcd)Site 1218 top
(rmcd)Site 1218 base
(rmcd)
T C1nB C1n 1.00 4.01 5.44 0.90 1.10T C1r.1n 1.18 4.72 7.79 1.15 1.20B C1r.1n 1.33 5.32 8.31 1.25 1.40T C1r.2nB C1r.2nT C2n 2.10 8.43 10.02 2.00 2.20B C2n 2.33 9.33 11.73 2.20 2.45T C2An.1n 2.98 11.94 13.78 2.85 3.10B C2An.1nT C2An.2nB C2An.2nT C2An.3n 16.28B C2An.3n 3.85 15.46 17.98 3.80 3.90T C3n.1n 4.70 18.95 18.96 4.60 4.80 18.81 19.10B C3n.1n 4.88 19.49 19.49 4.80 4.95 19.43 19.54T C3n.2n 5.18 20.28 20.29 5.10 5.25 20.24 20.33B C3n.2n 5.40 20.52 20.52 5.30 5.50 20.48 20.56T C3n.3n 5.55 20.83 20.83 5.50 5.60 20.77 20.88B C3n.3n 5.65 20.99 20.99 5.60 5.70 20.94 21.03T C3n.4n 21.28 21.23 21.32B C3n.4n 21.68 21.58 21.78T C3An.1n 6.83 23.51 23.51 6.75 6.90 23.40 23.62B C3An.1n 24.24 24.18 24.29T C3An.2n 24.76 24.66 24.85B C3An.2n 7.50 25.78 25.79 7.45 7.55 25.65 25.92T C3Bn 27.03 28.45 28.63B C3Bn 27.27 29.72 29.89T C3Br.1n 27.31B C3Br.1n 27.44T C3Br.2nB C3Br.2nT C4n.1n 8.80 30.45 30.46 8.65 8.95 30.37 30.54B C4n.1n 30.61 30.59 30.63T C4n.2n 30.87 30.76 30.98B C4n.2n 9.38 31.96 31.96 9.25 9.50 31.72 32.20T C4r.1nB C4r.1nT C4AnB C4AnT C4Ar.1n 33.11 32.98 33.23B C4Ar.1n 33.52 33.43 33.60T C4Ar.2n 33.96 33.85 34.06B C4Ar.2n 34.49 34.43 34.55T C5n.1n 34.78 34.68 34.88B C5n.1n 12.15 37.16 11.80 12.50T C5n.2nB C5n.2nT C5r.1n 36.19 36.17 36.21B C5r.1n 36.52 36.46 36.58T C5r.2n 37.82 37.58 37.86B C5r.2n 38.07 38.03 38.20T C5An.1n 38.97 38.86 38.94B C5An.1n 39.33 39.35 39.44T C5An.2n 39.64 39.64 39.73B C5An.2n 40.18 40.51 40.64T C5Ar.1n 41.22 41.18 41.26B C5Ar.1n 41.38 41.30 41.46T C5Ar.2n 41.66 41.55 41.67B C5Ar.2n 41.85 41.80 41.92T C5AAn 42.30 42.21 42.38B C5AAn 42.77 42.71 42.96T C5ABn 43.23 43.08 43.29B C5ABn 43.95 43.78 43.95T C5ACn 44.29 44.12 44.40B C5ACn 44.99 44.86 44.02

H. PÄLIKE ET AL.INTEGRATED STRATIGRAPHIC CORRELATION AND IMPROVED COMPOSITE DEPTH SCALES 37
T C5ADn 45.11 45.07 45.15B C5ADn 46.16 46.02 46.23T C5Bn.1n 46.64 46.47 46.64B C5Bn.1n 46.85 46.76 46.97T C5Bn.2n 20.38 47.22 47.20 20.30 20.45 47.10 47.34B C5Bn.2n 20.83 47.73 47.62 20.70 20.95 47.55 47.72T C5Cn.1n 23.23 51.19 51.19 23.16 23.30 51.13 51.26B C5Cn.1n 24.04 52.34 52.34 23.91 24.17 52.00 52.05T C5Cn.2n 24.22 52.38 52.38 24.17 24.27 52.14 52.39B C5Cn.2n 24.45 52.55 52.55 24.32 24.57 52.53 52.61T C5Cn.3n 24.81 52.95 52.95 24.69 24.92 52.88 52.96B C5Cn.3n 25.12 53.29 53.29 25.02 25.22 53.27 53.40T C5Dn 26.65 55.21 55.22 55.14 55.36B C5Dn 27.22 55.94 55.94 55.93 56.14T C5Dr.1n 27.43 56.25B C5Dr.1n 27.53 56.40T C5En 28.20 57.39 57.40 57.28 57.58B C5En 29.37 58.91 58.91 59.06 59.24T C6n 29.93 59.35 59.35 59.76 59.85B C6n 33.46 66.75 66.76 66.64 67.01T C6An.1n 35.06 69.39 69.30 69.26 69.38B C6An.1n 35.63 70.39 70.25 70.21 70.46T C6An.2n 36.28 71.53 71.43 71.16 71.49B C6An.2n 37.28 73.24 73.16 73.15 73.69T C6AAn 39.94 77.25 76.71 76.01 76.62B C6AAn 40.27 77.75 77.68 77.63 77.80T C6AAr.1n 42.39 81.74 81.20B C6AAr.1n 43.14 82.20 82.57T C6AAr.2n 45.09 83.86 83.89 83.81 83.94B C6AAr.2n 45.49 84.48 84.31 84.25 84.38T C6Bn.1n 45.99 85.22 85.05 84.99 85.08B C6Bn.1n 46.89 86.41 86.34 86.30 86.43T C6Bn.2n 47.16 86.75 86.74 86.73 86.82B C6Bn.2n 49.16 89.31 89.48 89.45 89.87T C6Cn.1n 51.46 92.51 92.48 92.27 92.59B C6Cn.1n 52.12 93.52 93.37 93.32 93.58T C6Cn.2n 53.04 95.06 94.91 94.42 95.15B C6Cn.2n 53.80 96.29 96.20 96.04 96.41T C6Cn.3n 55.58 98.81 98.80 98.65 98.86B C6Cn.3n 56.09 99.63 99.62 99.59 100.85T C7n.1n 59.18 106.88 106.87 106.81 106.92B C7n.1n 59.40 107.25 107.18 107.12 107.23T C7n.2n 60.05 108.31 108.02 107.72 108.32B C7n.2n 62.39 111.75 111.59 111.37 111.81T C7An 63.73 116.09 115.49 63.16 64.29 115.37 115.60B C7An 64.63 117.33 117.88 64.54 64.71 117.73 118.03T C8n.1n 65.92 119.49 119.49 65.74 66.09 119.41 119.56B C8n.1n 67.32 121.98 121.59 67.24 67.39 121.47 121.70T C8n.2n 67.62 122.56 122.12 67.44 67.79 122.00 122.23B C8n.2n 72.55 130.70 131.27 72.09 73.00 131.00 131.53T C9n 79.41 137.70 137.33 79.18 79.63 136.60 138.05B C9n 92.87 151.91 151.63 92.67 93.07 151.47 151.78T C10n.1n 98.80 157.95 157.84 98.47 99.12 157.72 157.95B C10n.1n 101.87 161.39 161.20 101.57 102.17 160.93 161.46T C10n.2n 102.60 162.17 162.18 102.37 102.82 161.99 162.37B C10n.2n 104.30 164.14 164.02 104.02 104.57 163.90 164.13T C11n.1n 178.45 178.36 178.53B C11n.1n 184.41 184.28 184.54T C11n.2n 185.11 184.93 185.28B C11n.2n 191.43 189.73 193.12T C12n 138.45 199.47 200.40 137.85 139.05 199.05 201.75B C12n 143.03 204.22 204.67 142.80 143.25 204.54 204.80T C13n 169.80 233.88B C13n 173.36 240.29T C15n 179.96 246.98B C15n 180.56 247.52T C16n.1n 181.08 247.94
Site 1219 mid
Top, Bottom Chron (rmcd)
1218 equivalent
(rmcd)Site 1218 mid
(rmcd)Site 1219 top
(rmcd)Site 1219 base
(rmcd)Site 1218 top
(rmcd)Site 1218 base
(rmcd)
Table T6 (continued).
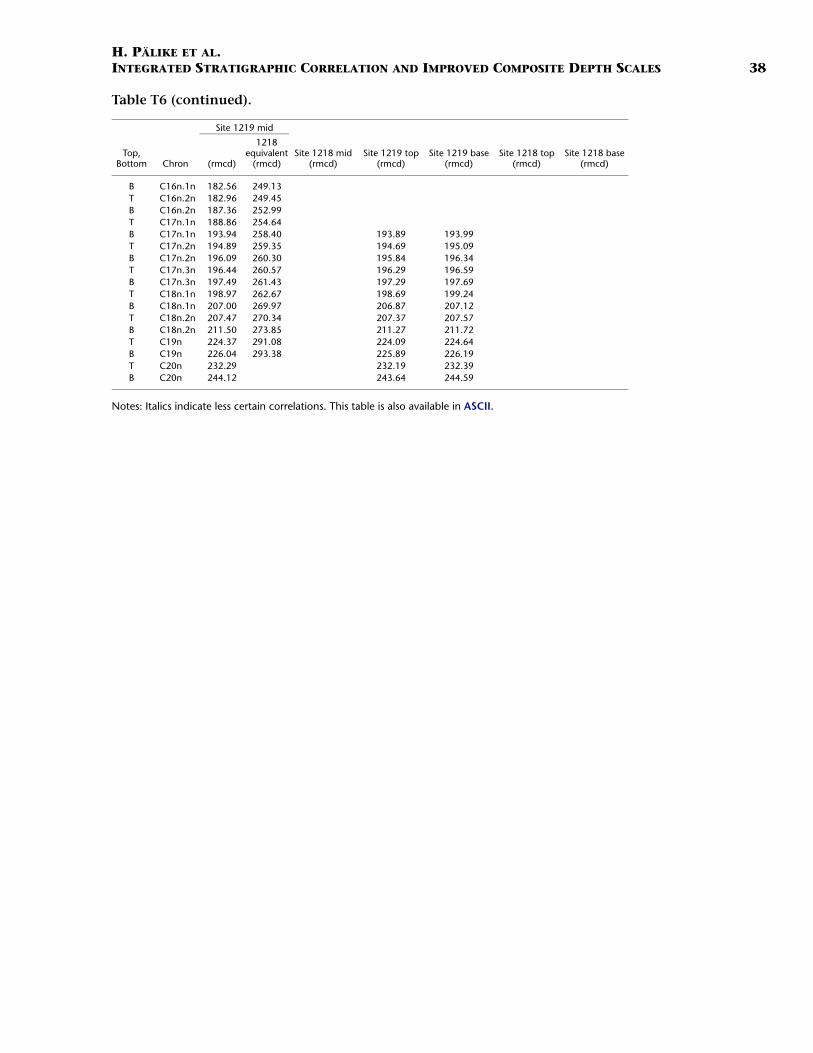
H. PÄLIKE ET AL.INTEGRATED STRATIGRAPHIC CORRELATION AND IMPROVED COMPOSITE DEPTH SCALES 38
Notes: Italics indicate less certain correlations. This table is also available in ASCII.
B C16n.1n 182.56 249.13T C16n.2n 182.96 249.45B C16n.2n 187.36 252.99T C17n.1n 188.86 254.64B C17n.1n 193.94 258.40 193.89 193.99T C17n.2n 194.89 259.35 194.69 195.09B C17n.2n 196.09 260.30 195.84 196.34T C17n.3n 196.44 260.57 196.29 196.59B C17n.3n 197.49 261.43 197.29 197.69T C18n.1n 198.97 262.67 198.69 199.24B C18n.1n 207.00 269.97 206.87 207.12T C18n.2n 207.47 270.34 207.37 207.57B C18n.2n 211.50 273.85 211.27 211.72T C19n 224.37 291.08 224.09 224.64B C19n 226.04 293.38 225.89 226.19T C20n 232.29 232.19 232.39B C20n 244.12 243.64 244.59
Site 1219 mid
Top, Bottom Chron (rmcd)
1218 equivalent
(rmcd)Site 1218 mid
(rmcd)Site 1219 top
(rmcd)Site 1219 base
(rmcd)Site 1218 top
(rmcd)Site 1218 base
(rmcd)
Table T6 (continued).

H. PÄLIKE ET AL.INTEGRATED STRATIGRAPHIC CORRELATION AND IMPROVED COMPOSITE DEPTH SCALES 39
Table T7. Site 1218 calcareous nannofossils on rmcd depth scale.
Notes: T = top, B = bottom. This table is also available in ASCII.
EventMid-depth
(rmcd)Error
(rmcd) Hole
DepthCore, section, interval (cm) Top
(mbsf)Base
(mbsf)Top
(rmcd)Base
(rmcd)Top Base
199-B Discoaster kugleri 40.28 0.16 1218B 5H-2, 56 5H-2, 88 34.46 34.78 40.12 40.44B Catinaster coalitus 41.33 0.43 1218A 4H-7, 50 4H-CC 36.70 37.08 40.90 41.75T Cyclicargolithus floridanus 48.07 0.32 1218B 5H-7, 45 5H-CC 41.85 42.42 47.75 48.38T Sphenolithus heteromorphus 50.93 0.28 1218A 5H-7, 15 5H-CC 45.85 46.40 50.65 51.20T Discoaster deflandrei acme 50.93 0.28 1218A 5H-7, 15 5H-CC 45.85 46.40 50.65 51.20T Triquetrorhabdulus carinatus 63.63 1.28 1218A 6H-CC 7H-1, 120 55.32 56.90 62.35 64.91T Triquetrorhabdulus carinatus acme 87.51 0.25 1218A 9H-2, 80 9H-2, 130 77.00 77.50 87.26 87.76B Sphenolithus disbelemnos 90.51 0.25 1218A 9H-4, 80 9H-4, 130 80.00 80.50 90.26 90.76B Discoaster druggii 92.46 0.20 1218A 9H-5, 130 9H-6, 20 82.00 82.40 92.26 92.66T Sphenolithus delphix 97.00 0.40 1218B 10H-4, 140 10H-5, 70 85.80 86.60 96.60 97.40T Sphenolithus delphix 97.55 0.11 1218A 10H-1, 140 10H-2, 10 85.60 85.80 97.44 97.65B Sphenolithus delphix 99.25 0.35 1218B 10H-6, 70 10H6, 140 88.10 88.80 98.90 99.60B Sphenolithus delphix 100.40 0.10 1218A 10H-3, 120 10H-3, 140 88.40 88.60 100.30 100.50T Sphenolithus ciperoensis 110.33 0.75 1218B 11H-5, 80 11H-6, 80 96.20 97.70 109.58 111.08T Sphenolithus ciperoensis 110.56 0.71 1218A 11H-2, 130 11H-3, 130 96.50 98.00 109.85 111.27T Cyclicargolithus abisectus acme 113.19 0.29 1218A 11H-4, 130 11H-5, 38 99.50 100.08 112.90 113.48T Sphenolithus distentus 131.99 0.57 1218A 13H-3, 75 13H-4, 45 116.45 117.65 131.42 132.56T Dictyococcites bisectus 132.53 0.34 1218B 13H-6, 80 13H-6, 148 116.70 117.38 132.19 132.87T Sphenolithus distentus 132.54 0.15 1218B 13H-6, 100 13H-6, 130 116.90 117.20 132.39 132.69B Sphenolithus ciperoensis 145.17 0.75 1218A 14H-5, 80 14H-6, 80 129.00 130.50 144.42 145.92B Sphenolithus ciperoensis 146.32 0.10 1218B 15H-1, 100 15H-1, 120 128.40 128.60 146.22 146.42B Sphenolithus distentus 190.58 0.70 1218A 18H-CC 19H-1, 120 169.54 170.90 189.87 191.28T Reticulofenestra umbilicus �14 µm 220.85 0.38 1218A 22X-2, 70 22X-2, 147 198.10 198.87 220.47 221.23T Ericsonia formosa 231.91 0.19 1218A 23X-2, 148 23X-3, 35 208.48 208.85 231.72 232.09T Discoaster saipanensis 244.57 0.06 1218A 24X-4, 78 24X-4, 90 219.98 220.10 244.51 244.62T Discoaster barbadiensis 245.79 0.13 1218A 24X-5, 56 24X-5, 85 221.26 221.55 245.66 245.91T Chiasmolithus grandis 260.27 0.21 1218A 25X-7, 70 25X-CC 233.90 234.31 260.06 260.48B Dictyococcites bisectus 268.01 1.04 1218A 26X-5, 60 26X-6, 125 240.90 243.05 266.97 269.05T Chiasmolithus solitus 277.82 1.58 1218A 27X-CC 28X-1, 50 250.11 254.00 276.24 279.40T Nannotetrina spp. 298.78 0.31 1218A 30X-2, 90 30X-3, 2 273.10 273.72 298.47 299.09

H. P
ÄL
IKE E
T AL.
I NT
EG
RA
TE
D S
TR
AT
IGR
AP
HIC C
OR
RE
LA
TIO
N A
ND
IMP
RO
VE
D C
OM
PO
SITE D
EP
TH
SC
AL
ES
40
Table
Notes:
T CyclT SpheT DiscT TriquT TriquB SpheT SpheT SpheB SpheB SpheT SpheT CyclT SpheT SpheB SpheT SpheT SpheB SpheT ReticT ReticT EricsT EricsT DiscT DiscT ChiaB DictT DictB ReticP NanP NanX T. coT-T T.
T8. Site 1219 calcareous nannofossils on (rmcd) depth scale.
T = top, B = bottom. This table is also available in ASCII.
EventDepth
(mid) (rmcd) ± Site/Hole
Depth
Depth (mid) 1218 (rmcd) ±
Core, section, interval (cm) Top (mbsf)
Base (mbsf)
Top (rmcd)
Base (rmcd)Top Base
199-1219-icargolithus floridanus 19.71 0.23 A 3H-3, 92 3H-3, 138 19.42 19.88 19.48 19.93 46.72 0.17nolithus heteromorphus 20.71 0.78 A 3H-3, 138 3H-4, 145 19.88 21.45 19.93 21.48 47.59 0.90
oaster deflandrei acme 22.71 0.94 A 3H-5, 25 3H-6, 26 21.75 23.62 21.77 23.64 50.53 1.23etrorhabdulus carinatus 31.54 0.24 A 4H-4, 92 4H-4, 140 30.42 30.90 31.30 31.78 62.98 0.49etrorhabdulus carinatus acme 47.84 1.08 A 5H-CC 6H-1, 90 44.47 44.90 46.76 48.91 87.76 1.39nolithus disbelemnos 50.40 0.32 A 6H-2, 40 6H-2, 105 45.90 46.55 50.08 50.71 90.89 0.48nolithus delphix 53.78 0.92 B 4H-CC 5H-1, 30 48.75 49.80 52.86 54.70 96.27 1.43nolithus delphix 54.64 0.29 A 6H-5, 30 6H-5, 90 50.30 50.90 54.35 54.93 97.54 0.41nolithus delphix 56.75 0.05 B 5H-2, 80 5H-2, 90 51.80 51.90 56.70 56.80 100.81 0.08nolithus delphix 56.80 0.20 A 6H-6, 120 6H-7, 20 52.70 53.20 56.60 56.99 100.89 0.33nolithus ciperoensis 61.83 0.38 A 7H-5, 10 7H-5, 80 59.44 60.14 61.45 62.20 110.84 0.50
icargolithus abisectus acme 63.10 0.90 A 7H-5, 80 7H-6, 90 60.14 61.74 62.20 64.00 113.08 2.52nolithus ciperoensis 63.98 0.16 B 5H-CC 6H-1, 60 58.79 59.60 63.81 64.14 116.39 0.20nolithus distentus 70.80 0.75 A 8H-3, 100 8H-4, 100 67.00 68.50 70.05 71.55 128.23 1.31nolithus ciperoensis 83.52 0.75 A 9H-2, 140 9H-3, 140 75.40 76.90 82.77 84.27 141.74 0.57nolithus pseudoradians 121.04 0.73 A 12H-5, 80 12H-6, 80 107.80 109.30 120.31 121.77 180.38 0.81nolithus pseudoradians 121.95 0.16 B 11H-3, 85 11H-3, 120 110.35 110.70 121.78 122.11 181.38 0.18nolithus distentus 131.27 0.77 A 13H-3, 80 13H-4, 80 113.86 115.36 130.49 132.04 191.70 0.86ulofenestra umbilicus �14 µm 156.98 0.10 A 15H-5, 140 15H-6, 10 136.90 137.10 156.88 157.08 220.99 0.12ulofenestra umbilicus �14 µm 159.00 0.15 B 14H-7, 40 14H-7, 70 144.40 144.70 158.85 159.15 223.34 0.17onia formosa 167.23 0.78 A 16H-4, 140 16H-5, 140 144.96 146.51 166.45 168.00 231.21 0.80onia formosa 167.56 0.15 B 15H-5, 76 15H-5, 104 150.82 151.10 167.41 167.71 231.64 0.19oaster saipanensis 187.22 13.83 A 17H-2, 90 19H-7, 5 150.90 176.55 173.39 201.04 252.85 12.24oaster barbadiensis 187.22 13.83 A 17H-2, 90 19H-7, 5 150.90 176.55 173.39 201.04 252.85 12.24smolithus grandis 188.51 15.12 A 17H-2, 90 20H-1, 114 150.90 178.14 173.39 203.63 254.26 13.49yococcites bisectus 210.69 6.18 A 20H-2, 52 21H-3, 80 179.02 190.30 204.51 216.86 273.12 5.78yococcites hesslandii 210.69 6.18 A 20H-2, 52 21H-3, 80 179.02 190.30 204.51 216.86 273.12 5.78ulofenestra umbilicus �14 µm 227.36 0.38 A 22H-3, 49 22H-3, 125 199.49 200.25 226.98 227.74 295.60 0.67notetrina spp. 239.09 5.76 A 22H-CC 24H-1, 36 205.84 215.36 233.33 244.85notetrina alata 244.09 0.47 A 23H-7, 63 24H-1, 6 215.13 215.06 243.62 244.55ntortus/T. orthostylus 266.43 0.24 A 26X-1, 60 26X-1, 107 234.70 235.17 266.19 266.66contortus/F. tympaniformis 273.26 4.15 A 26X-3, 52 27X-CC 237.62 244.92 269.11 277.41

H. PÄLIKE ET AL.INTEGRATED STRATIGRAPHIC CORRELATION AND IMPROVED COMPOSITE DEPTH SCALES 41
Table T9. Depth re-mapping pairs from Site 1218core (rmcd) to 1218 logging (mbsf).
Depth
(rmcd) (lmbsf)
199-1218-0.00 0.00
87.22 78.8491.96 82.73
103.42 89.89113.26 98.12127.78 112.47132.04 116.31137.14 120.95138.70 122.20140.48 123.70142.54 125.73151.04 131.27152.26 132.41153.76 133.73155.28 135.94156.80 137.46157.78 138.61158.80 139.57161.12 142.04163.12 143.56164.88 145.79167.32 148.41169.02 149.88172.36 151.74172.96 152.40174.60 153.97177.88 157.73179.40 158.95181.64 160.09184.14 161.21186.26 164.29187.60 166.11189.96 168.15192.52 169.82 Note: This table is also available in ASCII.
197.36 173.51200.96 178.15203.26 180.41205.50 182.80209.02 186.21211.40 187.65213.28 189.38215.70 191.74216.02 192.35217.36 193.09220.42 196.65221.30 197.48222.14 198.12223.48 198.93226.76 200.84227.42 201.57230.52 205.03231.80 206.35234.54 208.23235.32 209.37239.58 212.39241.38 214.09242.14 214.53243.82 216.08244.74 216.79246.38 218.24248.08 219.99252.20 223.85264.76 237.18277.70 251.66281.48 254.89286.92 259.76302.17 281.20
Depth
(rmcd) (lmbsf)

H. PÄLIKE ET AL.INTEGRATED STRATIGRAPHIC CORRELATION AND IMPROVED COMPOSITE DEPTH SCALES 42
*Dates reflect file corrections or revisions.
CHAPTER NOTES*
N1. After final pages had been printed for Vol. 199 of the Scientific Results of the ODPProceedings, an error was found in Table T2. The values in the "mcd" and "rmcd"columns were reversed. The error is corrected in this electronic volume.