Embed Size (px)
Citation preview

Package ‘biosignalEMG’February 18, 2018
Type Package
Title Tools for Electromyogram Signals (EMG) Analysis
Version 2.1.0
Date 2018-02-18
Author J.A. Guerrero, J.E. Macias-Diaz
Maintainer Antonio Guerrero <[email protected]>
Description Data processing tools to compute the rectified, integrated and the averaged EMG. Rou-tines for automatic detection of activation phases. A routine to compute and plot the ensem-ble average of the EMG. An EMG signal simulator for general purposes.
License GPL (>= 3)
Imports graphics, stats, utils, signal
NeedsCompilation no
Repository CRAN
Date/Publication 2018-02-18 08:11:14 UTC
R topics documented:biosignalEMG-package . . . . . . . . . . . . . . . . . . . . . . . . . . . . . . . . . . . 2as.emg . . . . . . . . . . . . . . . . . . . . . . . . . . . . . . . . . . . . . . . . . . . . 3dcbiasremoval . . . . . . . . . . . . . . . . . . . . . . . . . . . . . . . . . . . . . . . . 5eaemg . . . . . . . . . . . . . . . . . . . . . . . . . . . . . . . . . . . . . . . . . . . . 6emg . . . . . . . . . . . . . . . . . . . . . . . . . . . . . . . . . . . . . . . . . . . . . 8emg95306000 . . . . . . . . . . . . . . . . . . . . . . . . . . . . . . . . . . . . . . . . 10emg96627009 . . . . . . . . . . . . . . . . . . . . . . . . . . . . . . . . . . . . . . . . 10envelope . . . . . . . . . . . . . . . . . . . . . . . . . . . . . . . . . . . . . . . . . . . 11extractchannel . . . . . . . . . . . . . . . . . . . . . . . . . . . . . . . . . . . . . . . . 13highpass . . . . . . . . . . . . . . . . . . . . . . . . . . . . . . . . . . . . . . . . . . . 14integration . . . . . . . . . . . . . . . . . . . . . . . . . . . . . . . . . . . . . . . . . . 16loadABF1 . . . . . . . . . . . . . . . . . . . . . . . . . . . . . . . . . . . . . . . . . . 18lowpass . . . . . . . . . . . . . . . . . . . . . . . . . . . . . . . . . . . . . . . . . . . 19movingaverage . . . . . . . . . . . . . . . . . . . . . . . . . . . . . . . . . . . . . . . 20on/off detection quality measures . . . . . . . . . . . . . . . . . . . . . . . . . . . . . . 22
1

2 biosignalEMG-package
onoff_bonato . . . . . . . . . . . . . . . . . . . . . . . . . . . . . . . . . . . . . . . . 24onoff_singlethres . . . . . . . . . . . . . . . . . . . . . . . . . . . . . . . . . . . . . . 25phasestats . . . . . . . . . . . . . . . . . . . . . . . . . . . . . . . . . . . . . . . . . . 27rectification . . . . . . . . . . . . . . . . . . . . . . . . . . . . . . . . . . . . . . . . . 28syntheticemg . . . . . . . . . . . . . . . . . . . . . . . . . . . . . . . . . . . . . . . . 30whitening . . . . . . . . . . . . . . . . . . . . . . . . . . . . . . . . . . . . . . . . . . 31
Index 34
biosignalEMG-package Tools for Electromyogram Signals (EMG) Analysis
Description
Data processing tools to compute the rectified, integrated and the averaged EMG. Routines forautomatic detection of activation phases. A routine to compute and plot the ensemble average ofthe EMG. An EMG signal simulator for general purposes.
Details
Package: biosignalEMGType: PackageVersion: 2.1.0Date: 2018-02-18License: GPL (>= 3)
Standard processing tools (rectification, integration, average, ensemble-average, onset/offset detec-tion) of raw data of an EMG signal.
Author(s)
J.A. Guerrero, J.E. Macias-Diaz
Maintainer: J.A. Guerrero <[email protected]>
References
Konrad P. (2005) The ABC of EMG: A Practical Introduction to Kinesiological Electromyography.Version 1.0, Noraxon INC. USA
Winter D.A., Rau G., Kadefors R., Broman H., Deluca C.J. (1980) Units, Terms, and Sandards inthe Reporting of EMG Research: A Report by the AdHoc Committee of the International Societyof Electrophysiology and Kinesiology.
Guerrero J.A., Macias-Diaz J.E. (2014) A computational method for the detection of activation/deactivationpatterns in biological signals with three levels of electric intensity. Math. Biosci. 248, 117–127.

as.emg 3
Examples
# change graphical parameters to show multiple plotsop <- par(mfrow = c(2, 2))
# Simulate 5 seconds of an EMGemgx <- syntheticemg(n.length.out = 5000, on.sd = 1, on.duration.mean = 350,
on.duration.sd = 10, off.sd = 0.05, off.duration.mean = 300, off.duration.sd = 20,on.mode.pos = 0.75, shape.factor = 0.5, samplingrate = 1000, units = "mV",data.name = "Synthetic EMG")
plot(emgx, main = "Synthetic EMG")
# Full-wave rectified EMGemgr <- rectification(emgx, rtype = "fullwave")plot(emgr, main = "Rectified EMG")
# Integration of the full-wave rectified EMG with reset points every# 200 samplesemgi <- integration(emgr, reset = TRUE, reset.criteria = "samples", vreset = 200)plot(emgi, main = "Integrated EMG")
# MA-envelopeemgma <- envelope(emgx, method = "MA", wsize = 60)# Ensemble-averaged EMGea <- eaemg(emgma, runs = emgx$on.off, what = 1, timenormalization = "mean",
scalem = 1, empirical = TRUE, level = 0.9)plot(ea, lwd = 2, main = "Ensemble-averaged EMG")
# reset graphical parameterspar(op)
as.emg Coerce to an ’emg’ object
Description
Functions to check if an object is an ‘emg’ object, or coerce it if possible.
Usage
as.emg(x, ...)## Default S3 method:as.emg(x, ...)## S3 method for class 'numeric'as.emg(x, ...)## S3 method for class 'matrix'as.emg(x, ...)## S3 method for class 'data.frame'as.emg(x, ...)is.emg(x)

4 as.emg
Arguments
x any R object.
... additional arguments to be passed to methods (such as the samplingrate or theunits of the EMG signal).
Details
as.emg is a generic function with many methods to coerce an object to an ‘emg’ object.
is.emg checks if x is an ‘emg’ object.
Value
as.emg returns an ‘emg’ object.
is.emg returns TRUE if its argument is an ‘emg’ object (that is, has “emg” amongst its classes) andFALSE otherwise.
Author(s)
J.A. Guerrero <[email protected]>
See Also
emg
Examples
# Creates 1 sec. of a simulated EMG with only baseline noisex <- rnorm(1000)# Coerce a vector into an 'emg' objectemgx <- as.emg(x, sampligrate = 1000)# Plot the data in emgxplot(emgx, main = "Synthetic EMG noise")
# Load a data.frame with EMG datadata(emg96627009)# Coerce a data.frame into an 'emg' objectx <- as.emg(emg96627009)# Plot the data in xplot(x, main = "EMG of limb muscles of decorticated cat")

dcbiasremoval 5
dcbiasremoval Remove the DC bias
Description
Adds a constant to all samples in the EMG to move the baseline noise mean in the presence ofDC-offset or DC-bias.
Usage
dcbiasremoval(data, channel, baseline, data.name)
Arguments
data an ‘emg’ object.
channel in case of multi-channel data, channel is the specific channel to be consideredby the procedure. Possible values: a character vector specifying the name ofthe channel to be considered (case sensitive) or a numeric value specifying thechannel to be considered (number of column in data).
baseline constant to be substracted to the EMG signal. If not provided, this values is setso the resulting EMG has and overall mean of 0.
data.name a string specifying the name of the variable which will appears on the plots. Ifempty or not provided is taken from the object given as data.
Value
An ‘emg’ object.
Author(s)
J.A. Guerrero <[email protected]>
See Also
See also emg
Examples
# change graphical parameters to show multiple plotsop <- par(mfrow = c(2, 1))
# Creates a random vector to simulate a baseline noise with a DC-offsetx <- rnorm(1000, 1, 1)emg1 <- emg(x, samplingrate = 1000, units = "mV", data.name = "")plot(emg1, main = "Simulated EMG with a DC-offset")abline(h = mean(emg1$values), col = "red", lwd = 2) # Show the position of the overall mean
# Remove the baseline noise mean

6 eaemg
emg2 <- dcbiasremoval(emg1)plot(emg2, main = "Simulated EMG with an overall zero mean")abline(h = mean(emg2$values), col = "red", lwd = 2) # Show the position of the overall mean
# reset graphical parameterspar(op)
eaemg Ensemble-averaged EMG
Description
Creates an ensemble-averaged EMG associated with a cyclical activity.
Usage
eaemg(data, channel, runs, what, timenormalization = c("min", "mean", "median", "max"),scalem = 1, empirical = TRUE, level = 0.9)
## S3 method for class 'eaemg'plot(x, ci.lty ="dashed", ...)## S3 method for class 'eaemg'print(x, ...)## S3 method for class 'eaemg'summary(object, ...)
Arguments
data an ‘emg’ object, usually rectified, moving-average of a rectified EMG or thecomputed envelope of an EMG.
channel in case of multi-channel data, channel is the specific channel to be consideredby the procedure. Possible values: a character vector specifying the name ofthe channel to be considered (case sensitive) or a numeric value specifying thechannel to be considered (number of column in data).
runs an ‘rle’ object indicating the lengths of succesive phases (active and inactive) oran atomic vector indicating in each position if the signal corresponds to a silencephase (0) or an active phase (1 or a greater integer).
what which phases are going to be ensemble-averaged, active phases (1) or silencephases (0).
timenormalization
a string that indicates with respect to which value all phase durations should benormalized. It can be the “min” (default), “mean”, “median” or “max” durationof the phases.
scalem a value (>=1) that controls the local detail of the ensemble.
empirical logical; if TRUE (default), the confidence intervals are computed based on theempirical quantiles; if FALSE, confidence intervals are computed asumming aGaussian distribution.

eaemg 7
level a value in [0, 1] indicating the confidence level.
x, object an ‘eaemg’ object.
ci.lty line type to plot the confidence intervals.
... additional arguments to be passed to the generic function.
Details
Ensemble-Averaged EMG is usually applied to EMG signals associated with cyclical activities. InEnsemble-Averaged EMG the time base for each cycle is normalized and all the profiles are aver-aged. To successfully obtain the average profile, the data should be a rectified EMG, the movingaverage of a rectified EMG or the envelope of an EMG signal.
The runs argument can be computed througth the rle function of a thresholded envelope (seeExamples) or computed with an onset/offset detection algorithm (see onoff_singlethres andonoff_bonato).
Value
returns an object of class ‘eaemg’ which is a list with components:
intervals a matrix with three columns, each corresponding to the lower limit of the inter-val, the ensemble average and the upper limit of the interval.
empirical the empirical argument
level the level argument
Author(s)
J.A. Guerrero <[email protected]>
References
Kumar S., Mital A. (1996) Electromyography In Ergonomics Taylor & Francis.
Esquivel M.E., Guerrero J.A., Macias-Diaz J.E. (2010) Activity pattern detection in electroneuro-graphic and electromyogram signals through a heteroscedastic change-point method. MathematicalBiosciences 224(2) 109–117
See Also
rectification, movingaverage, envelope, onoff_singlethres, onoff_bonato
Examples
# change graphical parameters to show multiple plotsop <- par(mfrow = c(2, 1))
# Simulate 10 seconds of an EMGemgx <- syntheticemg(n.length.out = 10000, on.sd = 1, on.duration.mean = 350,
on.duration.sd = 10, off.sd = 0.05, off.duration.mean = 300, off.duration.sd = 20,on.mode.pos = 0.75, shape.factor = 0.5, samplingrate = 1000, units = "mV",data.name = "Synthetic EMG")

8 emg
# MA-envelopeemgma <- envelope(emgx, method = "MA", wsize = 60)# Ensemble-averaged EMGea1 <- eaemg(emgma, runs = rle(emgx$on.off), what = 1, timenormalization = "max",
scalem = 1, empirical = TRUE, level = 0.9)plot(ea1, lwd = 2, main = "Ensemble-averaged EMG using apriori onset/offset")
# Determine the onset/offset runs using a thresholded envelopeempiricalonoff <- onoff_singlethres(emgx, t = 0.05)ea2 <- eaemg(emgma, runs = empiricalonoff, what = 1, timenormalization = "max",
scalem = 1, empirical = TRUE, level = 0.9)plot(ea2, lwd = 2, main = "Ensemble-averaged EMG using empirical onset/offset")
# reset graphical parameterspar(op)
emg EMG object
Description
Creates an ‘emg’ object to store an EMG signal.
Usage
emg(data, samplingrate = 0, units = "", data.name = "")## S3 method for class 'emg'plot(x, channels = "all", samples = 0, type = "l", timeunits = c("samples", "seconds"),add = FALSE, ...)
## S3 method for class 'emg'print(x, ...)## S3 method for class 'emg'summary(object, ...)
Arguments
data a vector or a matrix (one column per channel) containing the observed data.samplingrate number of samples carried per second, measured in Hertz. A value of 0 indicates
that this value is missing or unknown.units a character vector specifying the units (usually ‘mV’) of the EMG data.data.name a string specifying the name of the variable which will appears on the plots. If
empty or not provided is taken from the object given as data.x, object an object of class ‘emg’.type what type of plot should be drawn. See plot for details.channels channels to be considered by the procedure. Possible values: "all" to consider
all channels in data, a (vector of) character vector(s) specifying the names(s) ofthe channel(s) to be considered (case sensitive) or a numeric vector specifyingthe channels to be considered (number(s) of column(s) in data).

emg 9
samples samples to be plotted. Possible values: 0 (all samples), an integer ‘n’ (to plot thefirst ‘n’ samples) and a vectors of 2 integers ‘n1’ and ‘n2’ (to plot samples from‘n1’ to ‘n2’).
timeunits a character vector specifying the units (samples or seconds) for the time axis.
add logical; if TRUE add to an already existing plot; if FALSE start a new plot.
... additional arguments to be passed to the generic function.
Value
returns an object of class ‘emg’ which is a list with components:
values a copy of data
units the units argument
samplingrate the samplingrate argument
data.name the data.name argument
Author(s)
J.A. Guerrero <[email protected]>
References
Konrad P. (2005) The ABC of EMG: A Practical Introduction to Kinesiological Electromyography.Version 1.0, Noraxon INC. USA.
Winter D.A., Rau G., Kadefors R., Broman H., Deluca C.J. (1980) Units, Terms, and Sandards inthe Reporting of EMG Research: A Report by the AdHoc Committee of the International Societyof Electrophysiology and Kinesiology.
See Also
iemg, eaemg
Examples
# Creates a random vector to simulate an EMG signalx <- rnorm(10000, 0, 1)# Creates an 'emg' object to store xemg1 <- emg(x, samplingrate=1000, units="mV", data.name="")
# Summarize and visualize the datasummary(emg1)plot(emg1, main="Simulated EMG")

10 emg96627009
emg95306000 Sample EMG data from a decorticate cat
Description
Activity profile of spinal motoneurons recorded during fictive motion (scratching) evoked in animmobilized decorticate cat.
Usage
data("emg95306000")
Format
A data frame with 1999 observations on the following variable.
emg95306000 a numeric vector of EMG data
Details
The sampling rate of the recorded data was 1000Hz. The data is in "mV".
References
Esquivel M.E., Guerrero J.A., Macias-Diaz J.E. (2010) Activity pattern detection in electroneuro-graphic and electromyogram signals through a heteroscedastic change-point method. MathematicalBiosciences 224(2), 109–117
Examples
# Load datadata(emg95306000)# Coerce data into an 'emg' objectx <- as.emg(emg95306000, samplingrate=1000, units="mV")plot(x, main = "EMG of limb muscles of decorticated cat")
emg96627009 Sample EMG data from a decorticate cat (4 channels)
Description
Activity profiles of spinal motoneurons recorded during fictive motion (scratching) evoked in animmobilized decorticate cat.
Usage
data("emg96627009")
envelope 11
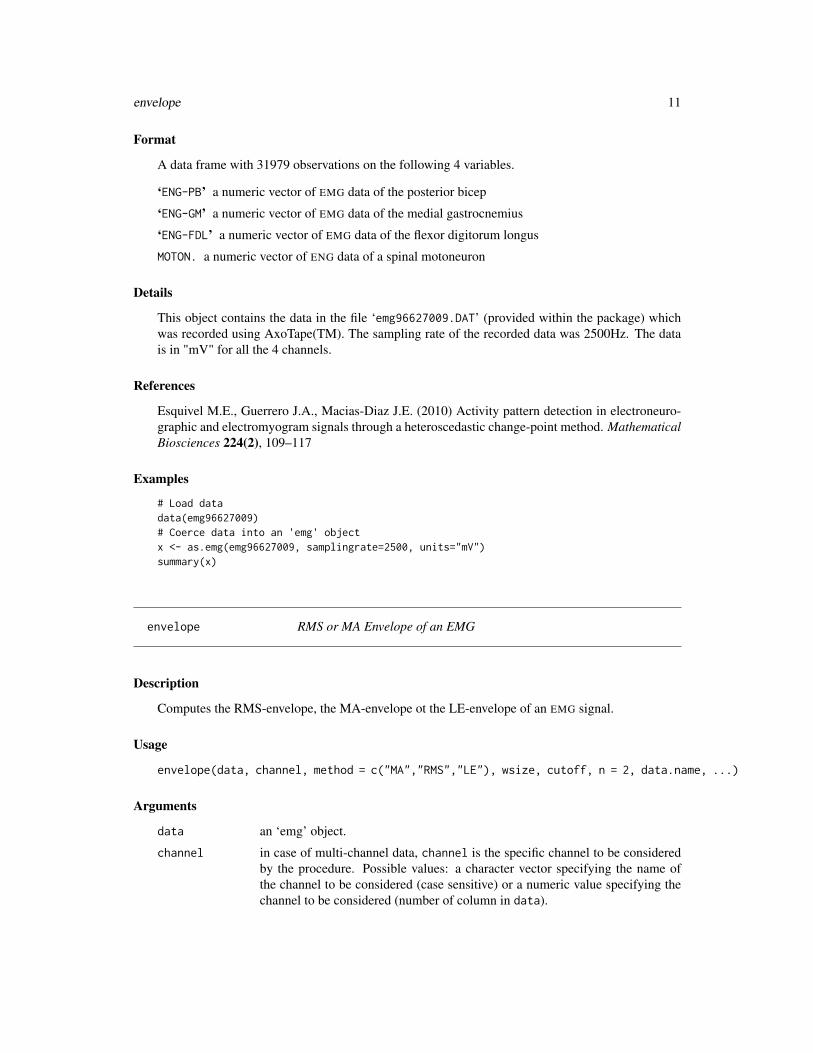
Format
A data frame with 31979 observations on the following 4 variables.
‘ENG-PB’ a numeric vector of EMG data of the posterior bicep
‘ENG-GM’ a numeric vector of EMG data of the medial gastrocnemius
‘ENG-FDL’ a numeric vector of EMG data of the flexor digitorum longus
MOTON. a numeric vector of ENG data of a spinal motoneuron
Details
This object contains the data in the file ‘emg96627009.DAT’ (provided within the package) whichwas recorded using AxoTape(TM). The sampling rate of the recorded data was 2500Hz. The datais in "mV" for all the 4 channels.
References
Esquivel M.E., Guerrero J.A., Macias-Diaz J.E. (2010) Activity pattern detection in electroneuro-graphic and electromyogram signals through a heteroscedastic change-point method. MathematicalBiosciences 224(2), 109–117
Examples
# Load datadata(emg96627009)# Coerce data into an 'emg' objectx <- as.emg(emg96627009, samplingrate=2500, units="mV")summary(x)
envelope RMS or MA Envelope of an EMG
Description
Computes the RMS-envelope, the MA-envelope ot the LE-envelope of an EMG signal.
Usage
envelope(data, channel, method = c("MA","RMS","LE"), wsize, cutoff, n = 2, data.name, ...)
Arguments
data an ‘emg’ object.
channel in case of multi-channel data, channel is the specific channel to be consideredby the procedure. Possible values: a character vector specifying the name ofthe channel to be considered (case sensitive) or a numeric value specifying thechannel to be considered (number of column in data).

12 envelope
method a string, "MA" (default) for MA-envelope, "RMS" for the RMS-envelope and"LE" for the LE-envelope.
wsize determines the length of the moving window that is used to calculate the localaverages of the data in RMS and MA envelopes.
cutoff cutoff frequency in Hertz for the lowpass filter used in LE-envelope.
n filter order for the lowpass filter used in LE-envelope.
data.name a string specifying the name of the variable which will appears on the plots. Ifempty or not provided is taken from the object given as data.
... Optional parameters for a MA-envelope: rtype for a rectification. See rectificationfor details.
Details
The MA-envelope corresponds to the moving average of the rectified EMG.
The RMS-envelope corresponds to the moving average of
yi = (xi − µx)2
where xi is each value of the EMG signal and µx is the overall mean of the EMG signal.
LE-envelope or linear envelope is lowpass filtered rectified signal.
Value
An ‘emg’ object containing the envelope of the EMG.
Author(s)
J.A. Guerrero <[email protected]>
References
Konrad P. (2005) The ABC of EMG: A Practical Introduction to Kinesiological Electromyography.Version 1.0, Noraxon INC. USA.
See Also
emg, movingaverage
Examples
# Simulate 5 seconds of an EMGemgx <- syntheticemg(n.length.out = 5000, on.sd = 1, on.duration.mean = 350,
on.duration.sd = 10, off.sd = 0.05, off.duration.mean = 300, off.duration.sd = 20,on.mode.pos = 0.75, shape.factor = 0.5, samplingrate = 1000, units = "mV",data.name = "Synthetic EMG")
# MA-envelopeemgma <- envelope(emgx, method = "MA", wsize = 60)# Superimpose the envelope on the EMG

extractchannel 13
plot(emgx, main = "MA-envelope")plot(emgma, add = TRUE, lwd = 4, col = "red")
# RMS-envelopeemgrms <- envelope(emgx, method = "RMS", wsize = 60)# Superimpose the envelope on the EMGplot(emgx, main = "RMS-envelope")plot(emgrms, add = TRUE, lwd = 4, col = "red")
# RMS-envelopeemgle <- envelope(emgx, method = "LE", cutoff = 10) #10Hz# Superimpose the envelope on the EMGplot(emgx, main = "LE-envelope")plot(emgle, add = TRUE, lwd = 4, col = "red")
extractchannel Extracts a single channel from a multichannel ’emg’ object
Description
Extracts a specific channel from a multichannel ‘emg’ object.
Usage
extractchannel(data, channel, data.name)
Arguments
data an ‘emg’ object.
channel the specific channel to be extracted. Possible values: a character vector specify-ing the name of the channel to be considered (case sensitive) or a numeric valuespecifying the channel to be considered (number of column in data).
data.name a string specifying the name of the variable which will appears on the plots. Ifempty or not provided is taken from the object given as data (a channel namein data, if it exists).
Details
if channel is a single channel ‘emg’ object, that single channel is returned as the output.
Value
an ‘emg’ object containing a single channel.
Author(s)
J.A. Guerrero <[email protected]>

14 highpass
See Also
emg, as.emg
Examples
# Load a data.frame with EMG datadata(emg96627009)# Coerce a data.frame into an 'emg' objectx <- as.emg(emg96627009)
# Extract the second channel in xy <- extractchannel(x, 2)# Plot the data in yplot(y, main = "Second channel of emg96627009")
# Extract the channel 'ENG-FDL' in x (third channel)z <- extractchannel(x, "ENG-FDL")# Plot the data in zplot(z, main = "Third channel of emg96627009")
highpass Highpass filter an EMG signal
Description
Highpass filter an EMG signal to remove signal artifacts and baseline noise contamination.
Usage
highpass(data, channel, cutoff = 50, n = 5, data.name)
Arguments
data an ‘emg’ object.
channel in case of multi-channel data, channel is the specific channel to be consideredby the procedure. Possible values: a character vector specifying the name ofthe channel to be considered (case sensitive) or a numeric value specifying thechannel to be considered (number of column in data).
cutoff cutoff frequency in Hertz for the highpass filter. See ‘Details’ for recommendedvalues.
n filter order for the highpass filter.
data.name a string specifying the name of the variable which will appears on the plots. Ifempty or not provided is taken from the object given as data.

highpass 15
Details
This procedure performs a highpass filtering to the EMG signal in order to remove signal artifactsand baseline noise contamination (such as the DC-bias).
There are various recommendations for the value of the cutoff frequency, for example 5Hz (Merletti,1999) and 10-20Hz (Freriks et.al., 1999).
Value
An ‘emg’ object which contains the filtered EMG.
Note
This procedure only uses a butterworth type filter of order n. In order to apply a different type offilter, please see the documentation of the ‘signal’ package.
Author(s)
J.A. Guerrero <[email protected]>
References
Merletti R. (1999) Standards for Reporting EMG data. Journal of Electromyography and Kinesiol-ogy 9(1), III-IV http://www.isek-online.org/standards_emg.html
Freriks B., Stegeman D.F. and Hermens H.J. (1999) European Recommendations Standards forSurface Electromyography for Surface Electromyography, results of the SENIAM project. ISBN:90-75452-14-4.
See Also
dcbiasremoval, whitening, lowpass
Examples
# Load a data.frame with EMG datadata(emg95306000)# Coerce a data.frame into an 'emg' objectx <- as.emg(emg95306000, samplingrate = 1000, units = "mV")
# Filter the fourth channel in xy <- highpass(x, cutoff = 100)
# change graphical parameters to show multiple plotsop <- par(mfcol = c(2, 2))
# Compute the rectified signals to see the effect of the filterx_rect <- rectification(x)y_rect <- rectification(y)
# plot the original channel, the filtered channel and the corresponding# rectified signals

16 integration
plot(x, channel = 1, main = "Original channel")plot(y, main = "Highpass filtered channel")plot(x_rect, main = "Rectified channel")plot(y_rect, main = "Rectified highpass filtered channel")
# reset graphical parameterspar(op)
integration Integration of an EMG
Description
Computes the integrated EMG, with or without reset points.
Usage
integration(data, channel, reset = FALSE, reset.criteria = c("samples", "time", "value"),vreset, units, data.name)
Arguments
data an ‘emg’ object, usually rectified, a moving averaged rectified EMG or a com-puted envelope of an EMG.
channel in case of multi-channel data, channel is the specific channel to be consideredby the procedure. Possible values: a character vector specifying the name ofthe channel to be considered (case sensitive) or a numeric value specifying thechannel to be considered (number of column in data).
reset, reset.criteria
if reset=TRUE, The integrated signal is reset to zero at a regular number of sam-ples (reset.criteria="samples"), at regular intervals of time (reset.criteria="time")or when a voltage level is reached (reset.criteria="value").
vreset a value to determine the reset points in an EMG, see Details.units a character vector specifying the units (usually "mV.s") of the integrated EMG
data.data.name a string specifying the name of the variable which will appears on the plots. If
empty or not provided is taken from the object given as data.
Details
If reset=FALSE, the integrated EMG is the cumulative sum of the values in data. If reset=TRUE,the cumulative sum is reset to zero at some points, which are determined based on the value ofreset.criteria and vreset:
• reset.criteria = samples : reset points are located every vreset samples.• reset.criteria = time : reset points are located every vreset seconds.• reset.criteria = value : reset points appear every time a value vreset is reached in the
cumulative sum.

integration 17
Value
An ‘iemg’ object storing the integrated EMG.
Author(s)
J.A. Guerrero <[email protected]>
References
Winter D.A., Rau G., Kadefors R., Broman H., Deluca C.J. (1980) Units, Terms, and Sandards inthe Reporting of EMG Research: A Report by the AdHoc Committee of the International Societyof Electrophysiology and Kinesiology.
See Also
iemg
Examples
# change graphical parameters to show multiple plotsop <- par(mfrow = c(2, 2))
# Simulate 5 seconds of an EMGemgx <- syntheticemg(n.length.out = 5000, on.sd = 1, on.duration.mean = 350,
on.duration.sd = 10, off.sd = 0.05, off.duration.mean = 300, off.duration.sd = 20,on.mode.pos = 0.75, shape.factor = 0.5, samplingrate = 1000, units = "mV",data.name = "Synthetic EMG")
plot(emgx, main = "Synthetic EMG")
# Full-wave rectified EMGemgr <- rectification(emgx, rtype = "fullwave")
# Integration of the full-wave rectified EMG without reset pointsemgi1 <- integration(emgr, reset = FALSE)plot(emgi1, main = "Integrated EMG (no reset)")
# Integration of the full-wave rectified EMG with reset points every# 200 samplesemgi2 <- integration(emgr, reset = TRUE, reset.criteria = "samples", vreset = 200)plot(emgi2, main = "Integrated EMG (with reset)")
# Integration of the full-wave rectified EMG with a reset point each# time the value 200 is reachedemgi3 <- integration(emgr, reset = TRUE, reset.criteria = "value", vreset = 200)plot(emgi3, main = "Integrated EMG (with reset)")
# reset graphical parameterspar(op)

18 loadABF1
loadABF1 Imports data in the Axon(TM) ABF format v1.0
Description
Loads ABFv1.0 files containing data from electrophysiological recordings, as created by AxonInstruments/Molecular Devices software such as AxoTape(TM) and AxoScope(TM).
Usage
loadABF1(filename, const = 0.00489615)
Arguments
filename name of the ABF file to load.
const a multiplier to obtain the value represented in each datum (see ‘References’).
Details
Loads electrophysiology data from Version 1.0 ABF files, as created by software like AxoTape andAxoScope. The routine only loads the data section and some parts of the header to know how manychannels are represented in the data.
Value
Returns an object of class ‘emg’.
Note
To load an Axon ABFv2.x file, please use the R package abf2.
Author(s)
J.A. Guerrero <[email protected]>
References
Axon(TM) Binary File Format (ABF): User Guide. http://mdc.custhelp.com/euf/assets/software/FSP_ABFHelp_2.03.pdf
Half-precision floating-point format (2015, June 26). In Wikipedia, The Free Encyclopedia. Re-trieved July 9, 2015, https://en.wikipedia.org/w/index.php?title=Half-precision_floating-point_format&oldid=668770694
See Also
emg

lowpass 19
Examples
## Not run:## Local path to sample data filepath <- paste(system.file("extdata", package = "biosignalEMG"), "/96627009.DAT",
sep = "")
## Load and show the dataemg <- loadABF1(path)plot(emg)
## End(Not run)
lowpass Lowpass filter an EMG signal
Description
Lowpass filter an EMG signal.
Usage
lowpass(data, channel, cutoff = 50, n = 5, data.name)
Arguments
data an ‘emg’ object.
channel in case of multi-channel data, channel is the specific channel to be consideredby the procedure. Possible values: a character vector specifying the name ofthe channel to be considered (case sensitive) or a numeric value specifying thechannel to be considered (number of column in data).
cutoff cutoff frequency in Hertz for the lowpass filter.
n filter order for the lowpass filter.
data.name a string specifying the name of the variable which will appears on the plots. Ifempty or not provided is taken from the object given as data.
Details
This procedure performs a lowpass filtering to the EMG signal with delay correction.
Value
An ‘emg’ object which contains the filtered EMG.
Note
This procedure only uses a butterworth type filter of order n. In order to apply a different type offilter, please see the documentation of the ‘signal’ package.

20 movingaverage
Author(s)
J.A. Guerrero <[email protected]>
See Also
dcbiasremoval, whitening, highpass
Examples
# This example computes the LE-envelope using the lowpass routine# Load a data.frame with EMG datadata(emg95306000)# Coerce a data.frame into an 'emg' objectx <- as.emg(emg95306000, samplingrate = 1000, units = "mV")
# Compute the rectified signalx_rect <- rectification(x)
# Filter the rectified signaly <- lowpass(x_rect, cutoff = 100)
# change graphical parameters to show multiple plotsop <- par(mfrow = c(3, 1))
# plot the original channel, the filtered channel and the# LE-envelopeplot(x, channel = 1, main = "Original channel")plot(x_rect, main = "Rectified channel")plot(y, main = "LE-envelope")
# reset graphical parameterspar(op)
movingaverage Moving average of an EMG
Description
Smooths an EMG by taking local averages.
Usage
movingaverage(data, channel, wsize, units = c("samples", "time"), data.name)

movingaverage 21
Arguments
data an ‘emg’ object, usually rectified.
channel in case of multi-channel data, channel is the specific channel to be consideredby the procedure. Possible values: a character vector specifying the name ofthe channel to be considered (case sensitive) or a numeric value specifying thechannel to be considered (number of column in data).
wsize, units determines the length of the moving window that is used to calculate the localaverages of the data.
data.name a string specifying the name of the variable which will appears on the plots. Ifempty or not provided is taken from the object given as data.
Details
The moving average is a running average computed over a moving window over the length of theEMG. Usually, the EMG signal is first rectified due that, generally, the mean value of an EMG signalis zero.
The window length is the double of the value of wsize in samples. The units of the window sizecould be in number of samples ("samples") or in seconds ("time").
Value
An ‘emg’ object containing the moving-averaged EMG.
Author(s)
J.A. Guerrero <[email protected]>
References
Konrad P. (2005) The ABC of EMG: A Practical Introduction to Kinesiological Electromyography.Version 1.0, Noraxon INC. USA.
See Also
rectification, filter
Examples
# change graphical parameters to show multiple plotsop <- par(mfrow = c(2, 1))
# Simulate 5 seconds of an EMGemgx <- syntheticemg(n.length.out = 5000, on.sd = 1, on.duration.mean = 350,
on.duration.sd = 10, off.sd = 0.05, off.duration.mean = 300, off.duration.sd = 20,on.mode.pos = 0.75, shape.factor = 0.5, samplingrate = 1000, units = "mV",data.name = "Synthetic EMG")
plot(emgx, main = "Synthetic EMG")
# Compute the moving average of the rectified EMG

22 on/off detection quality measures
emgr <- rectification(emgx, rtype = "fullwave")emgma <- movingaverage(emgr, wsize = 30, units = "samples")plot(emgma, main = "Moving average of the rectified EMG")
# reset graphical parameterspar(op)
on/off detection quality measures
Measure the quality of an automatic on/off detection
Description
These quantities measure different aspects of the accuracy in the determination of activity changesof an electric signal.
Usage
ANDP(b, bE)MNChPD(b, bE)PCE(b, bE)PR(b, bE, t)TD(b, bE, t)
Arguments
b reference vector (target values) indicating for each position if the datum corre-sponds to a silence phase (0) or an active phase (1 or a greater integer indicatingthe level of activation).
bE detected vector (output of an automatic detector) indicating for each position ifthe datum corresponds to a silence phase (0) or an active phase (1 or a greaterinteger indicating the level of activation).
t tolerance value (see Details).
Details
These quality measures are defined as
ANDP The absolute difference of the number of detected phases and the actual number of pahsesMNChPD The mean of the distances of each detected change-point to the nearest actual change-pointPCE The percentage of incorrectly classified points (silence-activity)TD temporal deviationPR computes the true positive ratio (TPR) and the false positive ratio (FPR).
TD and PR depends on the value of t, which is a tolerance for the difference between the calculatedand exact changepoints.See Guerrero et.al. (2014) for details on the computation of these measures.

on/off detection quality measures 23
Value
ANDP, MNChPD, PCE, TD: a numeric value. PR: a list of two numeric values (TPR and FPR).
Note
The parameter t should be adjusted in terms of the sampling rate of the EMG.
Author(s)
J.A. Guerrero <[email protected]>
References
Guerrero J.A., Macias-Diaz J.E. (2014) A computational method for the detection of activation/deactivationpatterns in biological signals with three levels of electric intensity. Math. Biosci. 248, 117–127.
Pistohl T., Schmidt T.S.B., Ball T., Schulze-Bonhage A., Aertsen A., Mehring C. (2013) Graspdetection from human ECoG during natural reach-to-grasp movements. PLoS ONE 8
See Also
onoff_bonato, onoff_singlethres
Examples
# Simulate 10 seconds of an EMGemgx <- syntheticemg(n.length.out = 10000, on.sd = 1, on.duration.mean = 350,
on.duration.sd = 10, off.sd = 0.05, off.duration.mean = 300, off.duration.sd = 20,on.mode.pos = 0.75, shape.factor = 0.5, samplingrate = 1000, units = "mV",data.name = "Synthetic EMG")
# Detect the phases of activation in emgxb_bonato <- onoff_bonato(emgx, sigma_n = 0.05, m = 10, minL = 30)b_singlet <- onoff_singlethres(emgx, t = 0.2)
# Compute the quality measuresqm_bonato <- c(ANDP(b_bonato, emgx$on.off), MNChPD(b_bonato, emgx$on.off),
PCE(b_bonato, emgx$on.off), PR(b_bonato, emgx$on.off, t = 10), TD(b_bonato,emgx$on.off, t = 10))
qm_singlet <- c(ANDP(b_singlet, emgx$on.off), MNChPD(b_singlet, emgx$on.off),PCE(b_singlet, emgx$on.off), PR(b_singlet, emgx$on.off, t = 10), TD(b_singlet,
emgx$on.off, t = 10))
res <- as.matrix(cbind(qm_bonato, qm_singlet))rownames(res) <- c("ANDP", "MNChPD", "PCE", "TPR", "FPR", "TD")print(res)

24 onoff_bonato
onoff_bonato Automatic on/off detection algorithm based on a double thresholdscheme
Description
Automatic detection algorithm to determine the times at which muscles “turn on” (activity periods)and “turn off” (silence periods) in an EMG signal.
Usage
onoff_bonato(data, channel, sigma_n, Pfa = 0.05, m = 5, r0 = 1, minL = 15, data.name)
Arguments
data an ‘emg’ object.
channel in case of multi-channel data, channel is the specific channel to be consideredby the procedure. Possible values: a character vector specifying the name ofthe channel to be considered (case sensitive) or a numeric value specifying thechannel to be considered (number of column in data).
sigma_n standard deviation of the baseline noise (need to be estimated).
Pfa false-alarm probability (see ‘Details’).
m number of samples observed to perform the detection.
r0 minimum number of samples out of m which must be over the threshold (seeDetails) to detect the signal.
minL minimum length allowed of the detected phases.
data.name a string specifying the name of the variable which will appears on the plots. Ifempty or not provided is taken from the object given as data.
Details
This technique of detection consists of selecting a initial threshold (such that the probability of falsealarm is Pfa) and then observing m successive samples: if at least r0 out of the m successive samplesare above the threshold the presence of the signal is acknowledged.
Value
A numeric vector with values 0 (silence) and 1 (activity).
Note
The default values of m and minL where choosen for a sampling rate of 500Hz.
Author(s)
J.A. Guerrero <[email protected]>

onoff_singlethres 25
References
Bonato P., D’Alessio T. and Knaflitz M. (1998) A statistical method for the measurement of muscleactivation intervals from surface myoelectric signal during gait. IEEE Transactions on BiomedicalEngineering 45 (3), 287–299. ISSN 0018–9294.
See Also
onoff_singlethres
Examples
# Load a data.frame with EMG datadata(emg95306000)# Coerce a data.frame into an 'emg' objectx <- as.emg(emg95306000, samplingrate = 1000, units = "mV")
# change graphical parameters to show multiple plotsop <- par(mfrow = c(2, 1))
# Estimate 'sigma_n' from the last 200 samples (only baseline noise)sigma_n <- sd(tail(x$values, 200))
# Detect the phases of activation in xb <- onoff_bonato(x, sigma_n = sigma_n, m = 10, minL = 30)
# Plot 'x' and the detected phasesplot(x, main = "Sample EMG")plot(b, type = "l", main = "Detected phases (Bonato's method)")
# reset graphical parameterspar(op)
onoff_singlethres Automatic on/off detection algorithm based on a simple threshold rule
Description
Automatic detection algorithm to determine the times at which muscles “turn on” (activity periods)and “turn off” (silence periods) in an EMG signal.
Usage
onoff_singlethres(data, channel, eemg, t = 0.05, data.name)

26 onoff_singlethres
Arguments
data an ‘emg’ object.
channel in case of multi-channel data, channel is the specific channel to be consideredby the procedure. Possible values: a character vector specifying the name ofthe channel to be considered (case sensitive) or a numeric value specifying thechannel to be considered (number of column in data).
eemg an ‘emg’ object containing an envelope.
t a threshold value to determine if a datum reresent activity (above the threshold)or silence (below the threshold) in a signal.
data.name a string specifying the name of the variable which will appears on the plots. Ifempty or not provided is taken from the object given as data.
Details
In this procedure, on and off time estimation is determined by the times at which the envelope ofthe signal (eemg or determined using envelope) exceeds a threshold.
Value
A numeric vector with values 0 (silence) and 1 (activity).
Author(s)
J.A. Guerrero <[email protected]>
References
Rose W. (2014) Electromyogram Analysis. Mathematics and Signal Processing for Biomechanics.http://www.udel.edu/biology/rosewc/kaap686/
See Also
envelope, onoff_bonato
Examples
# Load a data.frame with EMG datadata(emg95306000)# Coerce a data.frame into an 'emg' objectx <- as.emg(emg95306000, samplingrate = 1000, units = "mV")
# change graphical parameters to show multiple plotsop <- par(mfrow = c(2, 1))
# Detect the phases of activation in xb <- onoff_singlethres(x, t = 0.1)
# Plot 'x' and the detected phasesplot(x, main = "Sample EMG")

phasestats 27
plot(b, type = "l", main = "Detected phases (single thresholding)")
# reset graphical parameterspar(op)
phasestats local statistics of each phase on an EMG (beta)
Description
Computes local statistics "f" of each phase on an EMG signal. The phases are defined by the con-tiguos points that have the same class.
Usage
phasestats(data,class,f)
Arguments
data an ‘emg’ object.
class a vector that indicates the class of each point in data.
f A function that computes the desired local statistic.
Details
class is usually the result of a detection step (0=not active, 1=active). "f" could be the mean, standarddeviaton, sum, length, etc.
Value
An object storing the local statistics and the class of each value.
Author(s)
J.A. Guerrero <[email protected]>
References
None
See Also
onoff_singlethres

28 rectification
Examples
# Load a data.frame with EMG datadata(emg95306000)# Coerce a data.frame into an 'emg' objectx <- as.emg(emg95306000, samplingrate = 1000, units = "mV")
# Detect the phases of activation in xb <- onoff_singlethres(x, t = 0.1)
# Computes the length of the detected phasesplengths<-phasestats(x,b,length)plengths# Computes the mean of the values within the detected phasespmeans<-phasestats(x,b,mean)pmeans
# Only show the means of the active phasespmeans$stats[names(pmeans$stats)==1]
rectification Full-wave and half-wave rectification of an EMG
Description
Obtains the full-wave or half-wave rectification of an EMG.
Usage
rectification(data, channel, rtype = c("fullwave", "halfwave"), data.name, ...)
Arguments
data an ‘emg’ object.
channel in case of multi-channel data, channel is the specific channel to be consideredby the procedure. Possible values: a character vector specifying the name ofthe channel to be considered (case sensitive) or a numeric value specifying thechannel to be considered (number of column in data).
rtype a string indicating if the rectification is full-wave ("fullwave", default) or half-wave ("halfwave").
data.name a string specifying the name of the variable which will appears on the plots. Ifempty or not provided is taken from the object given as data.
... additional arguments to be passed to the generic function.

rectification 29
Details
A full-wave rectified EMG is obtained by computing the absolute value of the raw signal; In halfwave rectification, the positive values are passed, while the negatives values are blocked (set tozero).
Rectification is mainly used as a pre-proccessing step before another process like averaging orcomputing the envelope of the signal.
Value
An ‘emg’ object which contains the rectified EMG.
Author(s)
J.A. Guerrero <[email protected]>
References
Konrad P. (2005) The ABC of EMG: A Practical Introduction to Kinesiological Electromyography.Version 1.0, Noraxon INC. USA.
See Also
emg, dcbiasremoval, syntheticemg
Examples
# change graphical parameters to show multiple plotsop <- par(mfrow = c(3, 1))
# Simulate 5 seconds of an EMGemgx <- syntheticemg(n.length.out = 5000, on.sd = 1, on.duration.mean = 350,
on.duration.sd = 10, off.sd = 0.05, off.duration.mean = 300, off.duration.sd = 20,on.mode.pos = 0.75, shape.factor = 0.5, samplingrate = 1000, units = "mV",data.name = "Synthetic EMG")
plot(emgx, main = "Synthetic EMG")
# Full-wave rectified EMGemgr1 <- rectification(emgx, rtype = "fullwave")plot(emgr1, main = "Full-wave rectified EMG")
# Half-wave rectified EMGemgr2 <- rectification(emgx, rtype = "halfwave")plot(emgr2, main = "Half-wave rectified EMG")
# reset graphical parameterspar(op)

30 syntheticemg
syntheticemg Synthetic EMG
Description
Creates a synthetic EMG based on a simple heteroscedastic model.
Usage
syntheticemg(n.length.out = 10000, on.sd = 1, on.duration.mean = 350,on.duration.sd = 10, off.sd = 0.05, off.duration.mean = 300,off.duration.sd = 20, on.mode.pos = 0.75, shape.factor = 0.5,samplingrate = 0, units = "", data.name = "Synthetic EMG")
Arguments
n.length.out number of observations.
on.sd Standard deviation of the random values during an active phase.on.duration.mean
mean lengths of active phases in number of samples.
on.duration.sd standard deviation of lengths of active phases in number of samples.
off.sd standard deviation of the random values during an silence phase (i.e. for thebaseline noise).
off.duration.mean
mean lengths of silence phases in number of samples.off.duration.sd
standard deviation of lengths of silence phases in number of samples.
on.mode.pos a value between 0 (beginning of the active phase) and 1 (end of the active phase)indicating the relative position in which the maximum amplitude of an activephase will be located.
shape.factor shape parameter (recommended values between 0 and 2).
samplingrate sampling rate associated to the synthetic EMG.
units units associated to the synthetic EMG.
data.name a string specifying the name of the variable which will appears on the plots.
Details
A random synthetic EMG signal is generated using an heteroscedastic Gaussian model. There aretwo parameters that control the amplitude of the active and silence phases (on.sd and off.sd), twothat control the (random) length of the active phases (on.duration.mean and on.duration.sd),two that control the (random) length of the silence phases (off.duration.mean and off.duration.sd)and two that control the shape of the burst during an active phase (on.mode.pos and shape.factor).A binary vector stores which samples are associated to an active phase for test purposes.

whitening 31
Value
A derived ‘emg’ object which also contains a binary vector on.off to indicate which samplescorrespond to an active phase (1) and which to a silence phase (0).
Author(s)
J.A. Guerrero <[email protected]>
References
Esquivel M.E., Guerrero J.A., Macias-Diaz J.E. (2010) Activity pattern detection in electroneuro-graphic and electromyogram signals through a heteroscedastic change-point method. MathematicalBiosciences 224(2) 109–117
See Also
emg
Examples
# change graphical parameters to show multiple plotsop <- par(mfrow = c(2, 1))
# Simulate 10 seconds of an EMGemg1 <- syntheticemg(n.length.out = 10000, on.sd = 1, on.duration.mean = 350,
on.duration.sd = 10, off.sd = 0.05, off.duration.mean = 300, off.duration.sd = 20,on.mode.pos = 0.75, shape.factor = 0.5, samplingrate = 1000, units = "mV",data.name = "Synthetic EMG")
plot(emg1, main = "Synthetic EMG")
# Simulate 10 seconds of an EMG (pulse trains)emg2 <- syntheticemg(n.length.out = 10000, on.sd = 1, on.duration.mean = 350,
on.duration.sd = 10, off.sd = 0.05, off.duration.mean = 300, off.duration.sd = 20,on.mode.pos = 0.5, shape.factor = 0, samplingrate = 1000, units = "mV",data.name = "Synthetic EMG")
plot(emg2, main = "Synthetic EMG (pulse trains)")
# reset graphical parameterspar(op)
whitening Decorrelates an EMG signal
Description
Decorrelates an EMG signal using an SVD decomposition of a covariance matrix.

32 whitening
Usage
whitening(data, channel, method = c("PCA", "ZCA"), k = 4, r = 1, data.name)
Arguments
data an ‘emg’ object.
channel in case of multi-channel data, channel is the specific channel to be consideredby the procedure. Possible values: a character vector specifying the name ofthe channel to be considered (case sensitive) or a numeric value specifying thechannel to be considered (number of column in data).
method the whitening method to be applied to the EMG signal: "PCA" (default) or"ZCA" (see ‘References’).
k number of columns (see ‘Details’) to construct the covariance matrix.
r column to be used as the whitened signal (see ‘Details’).
data.name a string specifying the name of the variable which will appears on the plots. Ifempty or not provided is taken from the object given as data.
Details
Whitening an EMG signal is a preprocessing step that can improve amplitude estimation, onsetactivation detection and fecature classification.
A whitening transformation reduces autocorrelation within a signal.
The implemented methods are PCA and ZCA, both based on a SVD decomposition of a covariancematrix. The (artificial) matrix is constructed with k shifted versions of the EMG signal. The result isthen an matrix with k columns. The output of the whitening procedure is (usually) the first column(r=1).
Value
An ‘emg’ object storing the whitened EMG.
Note
The output is not fully whitened. The method decorrelates the columns of the artificial matrix, whichcontains a shifted version of the signal. At the end only one column (which can be autocorrelated)is taken as the output. Also, it works better when the sampling rate is high (low sampling rates tendto produce decorrelated samples).
Author(s)
J.A. Guerrero <[email protected]>
References
Implementing PCA/Whitening http://ufldl.stanford.edu/wiki/index.php/Implementing_PCA/Whitening

whitening 33
See Also
dcbiasremoval, highpass
Examples
# Load a data.frame with EMG datadata(emg95306000)# Coerce a data.frame into an 'emg' objectx <- as.emg(emg95306000, samplingrate = 1000, units = "mV")
# Whitening xy <- whitening(x)
# change graphical parameters to show multiple plotsop <- par(mfrow = c(2, 1))
# plot the original channel and the corresponding whitened channelplot(x, main = "Original channel")plot(y, main = "Whitened channel")
# reset graphical parameterspar(op)

Index
∗Topic datagensyntheticemg, 30
∗Topic datasetsemg95306000, 10emg96627009, 10
∗Topic graphseaemg, 6emg, 8
∗Topic manipas.emg, 3dcbiasremoval, 5emg, 8envelope, 11extractchannel, 13highpass, 14integration, 16loadABF1, 18lowpass, 19movingaverage, 20on/off detection quality measures,
22onoff_bonato, 24onoff_singlethres, 25phasestats, 27rectification, 28whitening, 31
∗Topic miscloadABF1, 18
∗Topic packagebiosignalEMG-package, 2
ANDP (on/off detection qualitymeasures), 22
as.emg, 3, 14
biosignalEMG (biosignalEMG-package), 2biosignalEMG-package, 2
dcbiasremoval, 5, 15, 20, 29, 33
eaemg, 6, 9
emg, 4, 5, 8, 12, 14, 18, 29, 31emg95306000, 10emg96627009, 10envelope, 7, 11, 26extractchannel, 13
filter, 21
highpass, 14, 20, 33
iemg, 9, 17integration, 16is.emg (as.emg), 3
loadABF1, 18lowpass, 15, 19
MNChPD (on/off detection qualitymeasures), 22
movingaverage, 7, 12, 20
on/off detection quality measures, 22onoff_bonato, 7, 23, 24, 26onoff_singlethres, 7, 23, 25, 25, 27
PCE (on/off detection qualitymeasures), 22
phasestats, 27plot, 8plot.eaemg (eaemg), 6plot.emg (emg), 8PR (on/off detection quality measures),
22print.eaemg (eaemg), 6print.emg (emg), 8
rectification, 7, 12, 21, 28
summary.eaemg (eaemg), 6summary.emg (emg), 8syntheticemg, 29, 30
34

INDEX 35
TD (on/off detection quality measures),22
whitening, 15, 20, 31