Embed Size (px)
Citation preview

Title: Variability in Surface Electromyogram during Gait Analysis of Low Back Pain Patients
Authors:
Wai Ming Poon
School of Electrical and Computer Engineering,
RMIT University, GPO Box 2476, Melbourne, Victoria 3001, Australia
Dinesh Kant Kumar
School of Electrical and Computer Engineering,
RMIT University, GPO Box 2476, Melbourne, Victoria 3001, Australia
Sridhar Poosapadi Arjunan
School of Electrical and Computer Engineering,
RMIT University, GPO Box 2476, Melbourne, Victoria 3001, Australia
Heiko Rudolph
School of Electrical and Computer Engineering,
RMIT University, GPO Box 2476, Melbourne, Victoria 3001, Australia
Yong Hu
Department of Orthopaedics & Traumatology, The University of Hong Kong.
Corresponding Author: Sridhar Poosapadi Arjunan
Ph No: +61 3 9925 1954
Fax No: +61 3 9925 2007
Email: [email protected]
Running title: Variability in SEMG for low back pain
1
Abstract
This paper describes the analysis of the variance of the amplitude of surface electromyogram (sEMG)
recorded from L4/ L5 region of the erector spinae for healthy participants and people suffering with Lower
Back Pain (LBP) when they were walking and running on a treadmill. The results indicate that there was no
significant difference in the variance and in the change of variance over time of the exercise between the
two groups when the participants were walking. However when the participants were running, there was a
significant difference in the two cohorts. While there was an increase in the variance over the duration of
the exercise for both the groups, the increase in variance of the LBP group was much greater (order of ten
times) compared with the healthy participants. The difference between the two groups was also very
significant when observing the change of variance over time. From these results, it is suggested that
variance of sEMG of the muscles of the lower back, recorded when the participants are running, can be
used to identify LBP patients.
Keywords: Low back pain, Surface Electromyogram (sEMG), Gait analysis, Variance
2
1. Introduction
Low back pain (LBP) has been associated with the weakness of the muscles of the lumbar region [1-3].
The current techniques to evaluate a patient for muscle weakness are based on magnetic resonance imaging
(MRI), x-ray imaging and ultrasonography by measuring the resulting changes in muscle volumes and
muscle atrophy which are associated with pain or fatigue [4, 5]. These modalities require special purpose
expensive facilities and hence are generally used only for patients in advanced situations. Wand et al. [6]
have determined that intervention at an early stage is necessary for the success of the treatment of the
disorder. There is need for a modality that can be used for early identification of the problem.
Muscle weakness results in the early onset of muscle fatigue. Surface electromyography (sEMG) is the
recording of electrical activity associated with muscle contraction and has been used to identify the onset of
muscle fatigue. SEMG has the advantage of being non-invasive, and is relatively easy to record with
equipment that is inexpensive and portable. It has been reported that occurrence of Chronic LBP can be
predicted using sEMG of the lumbar back [7-9]. This is based on identifying muscle fatigue and/or
identifying variations in the activity of lateral muscles. Unfortunately sEMG is not very reliable when
muscle activity level is low [9, 10], and when there are multiple muscles that are simultaneously active in
the region of the electrodes. There is also the shortcoming of large inter-subject and inter-experimental
variations, making it difficult to classify the recordings. Work by Kamei et al. [11] suggests that sEMG of
the lumbar region during static posture is not reliable. They have identified that the shortcoming in the use
of sEMG for back muscles is due to the low level of activity during maintained posture.
Another option to identify LBP patients is based on gait analysis. Human walking is composed of
chaotic but rhythmic and coordinated movements of limbs, pelvis, trunk, and head. In unimpaired gait,
these interaction or couplings are relatively stable, yet adapt flexibly to changes in walking velocity [12].
Chronic LBP patients often experience difficulties related to walking or running and experience early onset
3
of muscle fatigue compared with their healthy counterparts. On average, they walk slower than healthy
people [13]. Lind et al. [14] suggested that this is related to the pain-adaptation model. It has been
hypothesized that LBP patients augment the antagonist activity to effectively inhibit the activity of the
agonist and minimize the movement of the painful segment [3]. Patients with chronic LBP may alter the
neuromuscular control of gross motor activities such as locomotion by way of ‘protective guarding’ or
‘splinting’ [15, 16].
Work by Lee et al. [17] has identified that gait of a healthy person has less variations compared with
that of a person with back muscle ailments. This is attributable to the early onset of muscle fatigue among
people suffering from LBP [13]. These changes have been observed to be significant and may be used a
measure to identify people with back muscles ailments. However current methods for gait analysis require
elaborate and expensive gait laboratories making such analysis unsuitable for early detection. Some experts
are known to qualitatively identify these changes visually without formal gait analysis, but such measures
are highly subjective, cannot be quantified and not suitable for general clinical practice.
To overcome this shortcoming, use of sEMG for gait analysis has been suggested [2, 18]. Arendt-Nielsen
et al. [18] have determined that sEMG recorded during walking is useful for identifying low back ailments.
The analysis of the activity of the associated lumbar musculature such as erector spinae (ES) and Posoas
major muscle have been proven to be useful in the study of human gait [17,19]. Work by Lee et al. [20] has
identified the change in spectrum of muscles in L5 region suggesting early onset of muscle fatigue among
the LBP patients. However, while earlier works have identified differences in the gait of people with
chronic LBP and people with no LBP, there appears to be a difference in opinion in the reliability of sEMG
in this application [21-23]. There are also differences in opinion in the use of treadmills because walking
and /or running on a tread mill shows significant differences in joint moments, and in muscle activation
patterns when compared with over the ground walking [24,25].
4
Work by Kamei et al. [11] and Dimitrova et al. [26] has demonstrated that the change in spectrum of the
sEMG in response to muscle fatigue of the lower back muscles is not significant. Change in sEMG due to
LBP may be attributable to number of different factors such as changes in muscle activation pattern,
location of the active muscles and changes in motor recruitment pattern due to the onset of muscle fatigue,
and these may have varied influence on the spectrum of the signal. While sEMG is a convenient,
non-invasive and economical option to identify the LBP patients, the above limitations has prevented wide
acceptance.
This study is based on the theory that LBP patients have an early manifestation of lumbar muscle fatigue
during exercise [2]. This research tests the hypothesis that there would be a greater variation in the
amplitude of sEMG over the duration of the exercise for people with LBP compared with people with
healthy backs. The variance of the amplitude of the sEMG signal and the ratio of the change of variance
from the start to the end were calculated and compared between people with no LBP and people with LBP
when the participants were walking and running respectively.
2. Materials and methods
2.1 Subjects
Thirteen men volunteers (9 healthy and 4 LBP) aged between 20 to 50 years participated in this study.
Oswestry disability index [27] on visual analogue scale (VSA) was used to assess the participants prior to
the experiments. Participants were classified as having no LBP if they had never required medical attention
due to back pain, nor had they ever experienced low back pain episodes that they could recollect and the
VSA was less than 0.5. All the LBP patients were recruited from the LBP clinic associated with the
University of Hong Kong. As per clinician, they were all experiencing non-specific mild to moderate LBP
for more than 6 weeks and less than 4 months and for whom the medical treatment had not yet been started
at the time of participating in this experiment. The statistics of the participants are tabulated in Table 1. The
5
average Oswestry disability index for pain on VSA for the LBP participants was 3.5 (+ 0.59). People with
acute LBP or those who had undergone spinal surgery were not included in this study. Pregnant women,
people with progressive neurological disorders and people with psychiatric disorders were also excluded
from this study. Also excluded from this study were people suffering from LBP due to fracture, spinal
stenosis arthritides, disc lesion, spondylolisthesis, cancer and other structural spinal abnormalities.
Experiments were conducted after receiving approval from RMIT University Ethics Committee for Human
Experiments and Institutional Review Board for clinical research ethics review, The University of Hong
Kong. Each participant was given an oral and a written summary of the experimental protocol and the
purpose of the study and then was required to sign a consent form prior to the participation.
[Location for Table 1]
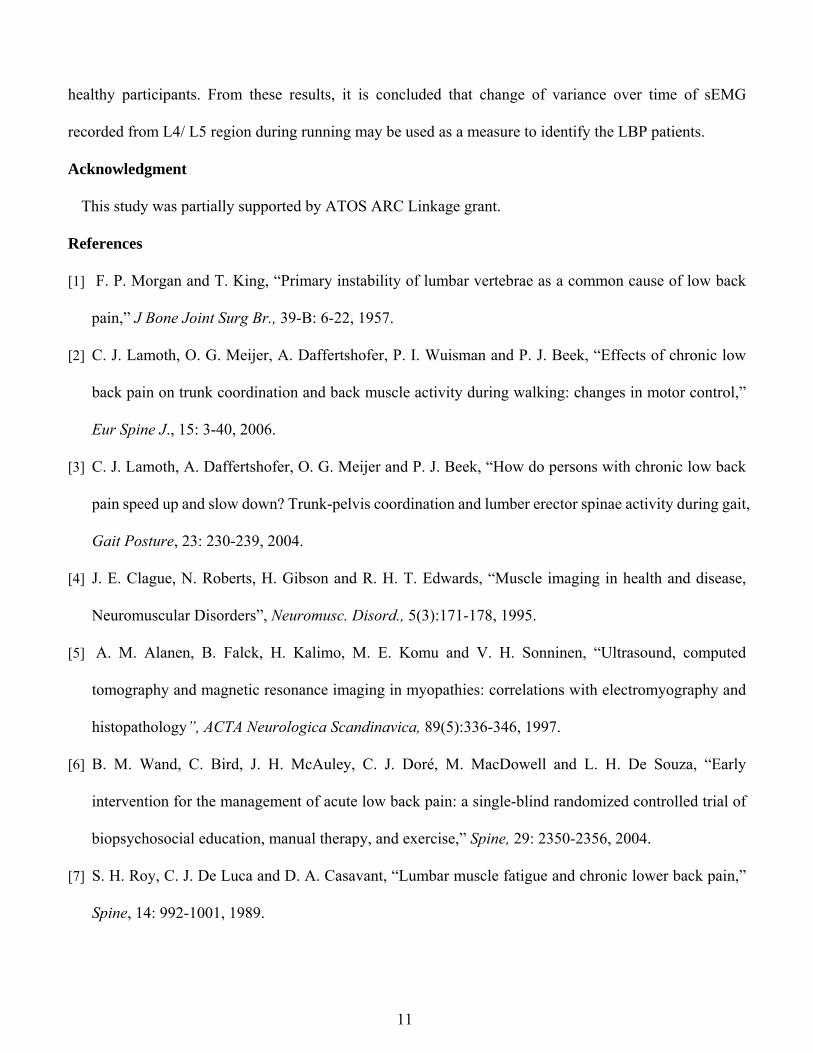
2.2 Muscles studied
In accordance with the study of Lee et al. [20], electrodes were placed on both, left and right side of the
spine in the forth and fifth lumbar region. For comparative purposes, electrodes were also attached to both
sides of the trunk at the second lumbar vertebra (L1/L2). The muscles studied for this research has been
tabulated in Table 2. Electrodes were placed at 2 to 3 cm lateral from the vertebral column, depending on
the surface area of the upper trunk and the length of the erector spinae (refer Fig.1 (a)). Neoprene bands
were used to prevent any movement of the electrodes. Foot sensor was attached (as shown in Fig.1 (b)) to
the heel to obtain the gait cycle. The purpose of the foot sensor was to help identify the time of the heel
strike and to measure the time between heel strike and lumbar muscle activation.
[Location for Fig. 1]
[Location for Table 2]
6
2.3 Surface EMG recording procedure
Surface Electromyogram (sEMG) was recorded using a “Bagnoli™ Desktop EMG System” (Delsys,
Boston, MA, USA). This system has bipolar differential electrodes (DE-3.1, BagnoliTM, 41 × 20 × 5 mm)
with two bar electrodes having fixed inter-electrode distance of 10 mm. The International Society of
Electrophysiology and Kinesiology (ISEK) EMG recording protocol was followed when conducting the
experiments [28]. The system gain was 1000, CMRR was 92dB, overall noise of ≤ 1.2 μV (RMS) and
bandwidth was 20-450 Hz, with 12dB/ octave roll-off. The sampling rate was 1000, and signal resolution
was 16 bits. The input impedance of the system is 115 Pico-farad in parallel with 1 KΩ. Prior to placing the
electrodes, the skin of the participant was prepared by shaving (if required) and exfoliation to remove dead
skin. Skin was cleaned with 70% v/v alcohol swab to remove any oil or dust from the skin surface. This is to
ensure that the skin impedance was less than 500 kΩ. The skin impedance was measured before and after
the cleaning procedure and with the electrodes mounted suitably. If the impedance is not within tolerable
limits, electrode connections and the skin cleanliness have to be checked.
2.4 Experiment protocol
Four pairs of electrodes were placed on the surface of low back muscles as shown in Fig. 1(a). SEMG was
recorded when the participants (healthy and LBP cohorts) were on the treadmill. Two sets of experiments
were performed. In the first set, the participants walked on the treadmill at 4 km/ hour, and in the second set
of experiments, the participants ran/ jogged on the treadmill at 8 km/hour. Participants were asked to walk
or jog in their normal way for the duration of 10 minutes. The participants were allowed to stop the trial
whenever they felt pain or excessive fatigue. A rest time of 15 minutes or more was given to all subjects
after finishing the walking trial and before the running trial to ensure that the subjects were rested prior to
the running exercise. Prior to recording, participants were requested to familiarize themselves with the
experiment and the equipment.
7
2.5 Data analysis
It is expected that at the start of the exercise the muscles would be the least fatigued muscles and would be
the most fatigued at the end of the exercise. Thus, it is expected that the maximum difference of sEMG
would be observed when comparing the start with the end of the exercise. For this purpose, segments near
the start and the end of the exercise were analyzed and compared.
The data was segmented into one minute segments and the first and the last one minute segments were
considered. This segment length was chosen because one minute is long enough to provide statistically
significant data with approximately 20 walking steps (or 40 running steps) in this duration and it is short
enough to represent stationary status of the muscle. The first minute (at the start) represents the muscle
prior to the exercise while the tenth (last) minute represents the muscle at the end of the exercise. Data was
analyzed using MATLAB R2007b.
The variance in the amplitude of the muscle activity recording was computed over each cycle and
averaged for the first and last segments. Variance of the amplitude of sEMG is due to change in the pathway
of the electrical pulse and indicates the spread and depth of the active motor units. The change in the
variance would indicate the variations in the muscle activity due to changes in the recruitment pattern and
in the activation strategies.
2.5.1 Non-parametric Statistical analysis
In order to identify the significance in variability between healthy and LBP cohorts, a non-parametric
statistical test was performed. Non-parametric tests have the obvious advantage of not requiring the
assumption of normality or the assumption of homogeneity of variance. They compare medians rather than
means and, as a result, if the data have one or two outliers, their influence is negated. The
Kolmogorov-Smirnov test, a most useful and general non- parametric method of statistics was used in the
analysis [29]. The test was performed at 5% significance level.
8
3. Results
The magnitude of the sEMG during activity was in the range of 10 to 50 µV while the background activity
was in the range of 0 to 2 µV. The results have been summarized in Tables 3 and 4. Table 3 and Table 4
show the average variance (during first and last segments) of the amplitudes of sEMG , ratio of the change
of variance from the start to the end between people with no LBP and people with LBP and the
non-parametric statistical significance of the results, when the participants were walking and running
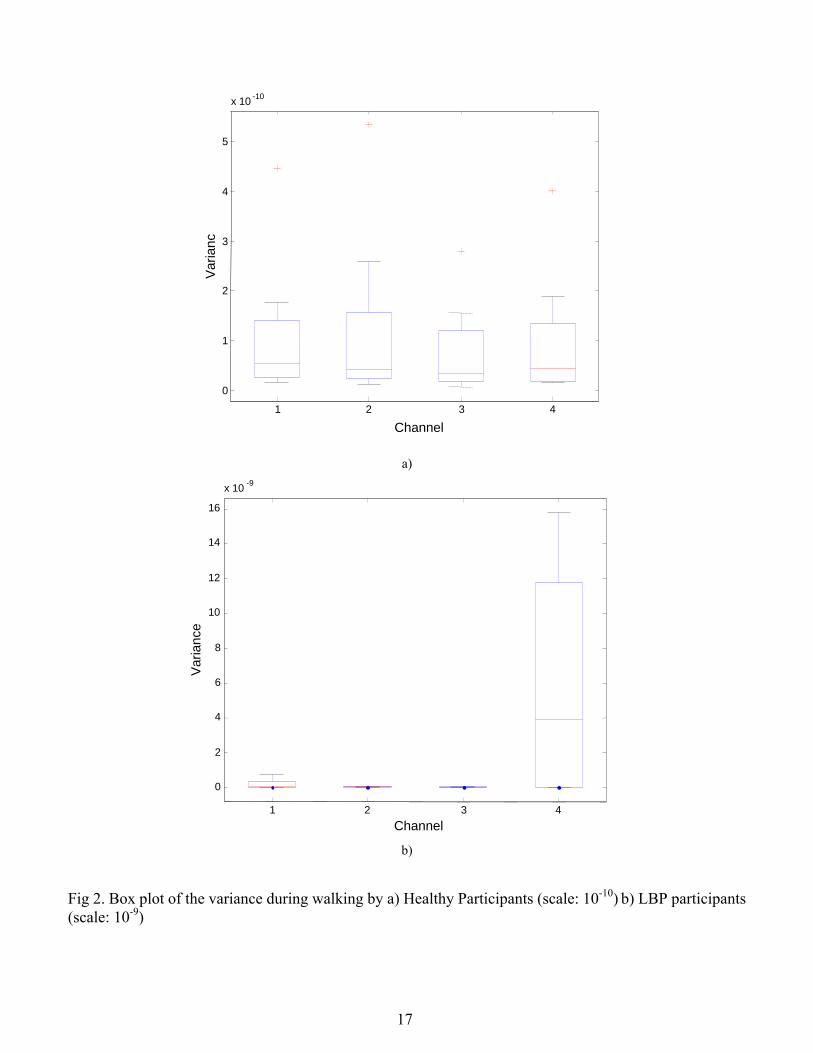
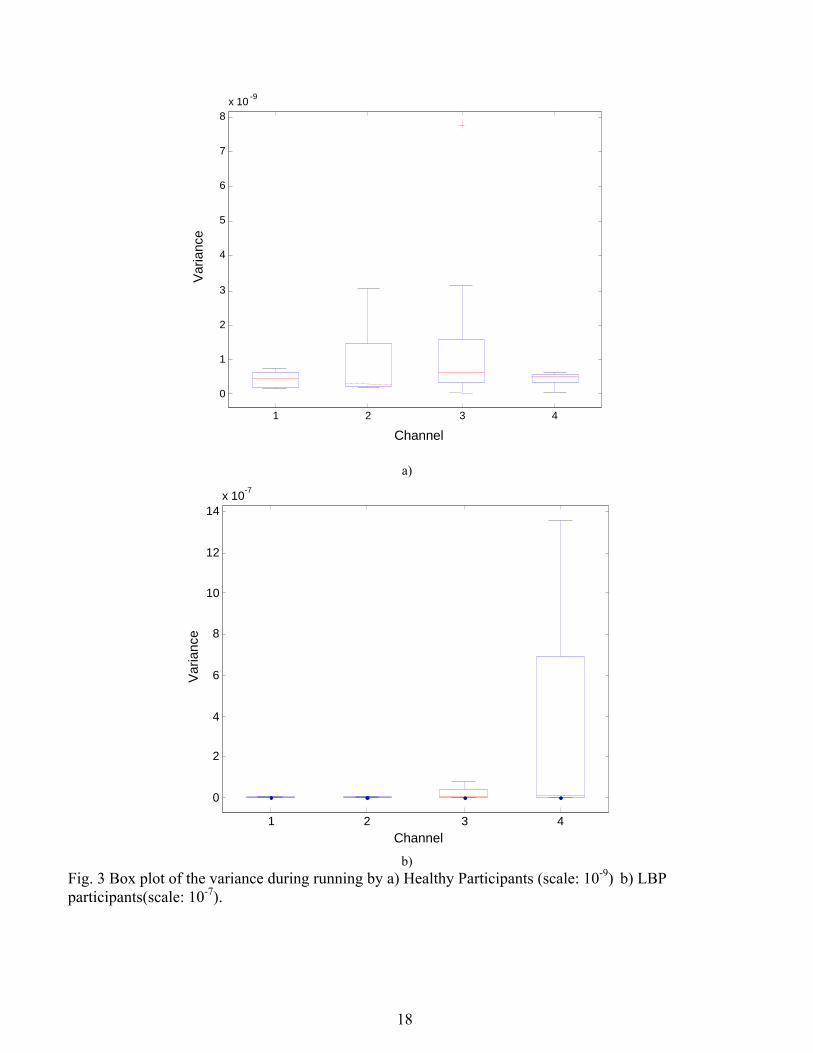
respectively. The box plot depicting the variance of the amplitudes of sEMG for 4 different channels for the
two cohorts during Walking and Running has been plotted in Fig. 2 and Fig. 3 respectively. Obvious outlier
are shown in red and were discarded for further analysis.
[Location for Tables 3- 4]
[Location for Fig. 2 and Fig.3]
From Table 3 and Fig.2, it is observed that there was no significant difference in the variance of the
amplitude or in the change of variance over time of sEMG of the two cohorts when the participants were
walking. From Table 4 it is observed that there were significant differences between the variance of
amplitude of EMG recorded at channel 3 and channel 4 of the healthy and LBP cohorts when the
participants were running. While there was significant increase in the variance for both cohorts when the
participants were running, the increase in the LBP patients was much greater when compared with the
healthy participants. From Fig. 3, it is also observed that there is a significant and large difference in the
variance of amplitude of sEMG between the two cohorts during running trials. The results (Table 4) also
indicate that the change in the variance is more significant in the L4/ L5 region not in L1/ L2 region.
4. Discussion and Conclusion
The variance of the two cohorts is comparable when the participants were walking. This indicates that
there was no change in the status of the muscles for all the participants over the ten minutes duration when
9
they were walking. Ten minutes of walking did not result the in onset of muscle fatigue among these
participants and this is consistent with the expectations. Most people, even LBP patients, in general walk
for longer than 10 minutes and do not get fatigued in this relatively short duration of time. The results also
indicate that there was a significant increase of variance during running for all the participants over the
duration of the running exercise. Increase in variance during running may also be attributable to factors
such as increase in number of samples (cycles) during running, increase in the magnitude of the signal
during running and change in the muscle status.
To identify the impact of change in muscle status only, the variance was normalized by taking the ratio of
the variance at the start to the end. From the results, the significant contribution of this research is the
observation that the ratio of the start to end variance of EMG during running for LBP is less than 0.1
(~0.03), whereas in healthy cohorts, this ratio is greater than 0.1 (~0.3). Based on this, the ratio of the
variance with a threshold of 0.1 can be used as an index to identify the LBP and healthy cohorts. The
significant difference between the two cohorts observed during running is attributable to the early onset of
muscle fatigue in the LBP cohort. While there is an increase in the variance for both the groups, the LBP
patients alter their activation strategy significantly more over the duration of the exercise. The increase in
the variance due to running may be attributable to change in muscle status such as onset of muscle fatigue
or change of muscle activation strategy or both. The change or alteration of the muscle activation strategy
may also manifest in asymmetrical gait of patients with high level of LBP. This work demonstrates that
variance of sEMG during running trials can identify the differences between the two cohorts effectively
while other researchers were unable to identify the difference when using spectral features [11, 26]. The use
of variance as a measure of the difference between the two cohorts is more effective because it measures the
change in muscle recruitment strategies. These are more pronounced compared with spectrum changes.
The results also confirm the findings of earlier researchers [18] that L4 and L5 is the more suitable
location of electrodes compared with L1/ L2 for identifying the difference in the LBP compared with the
10
healthy participants. From these results, it is concluded that change of variance over time of sEMG
recorded from L4/ L5 region during running may be used as a measure to identify the LBP patients.
Acknowledgment
This study was partially supported by ATOS ARC Linkage grant.
References
[1] F. P. Morgan and T. King, “Primary instability of lumbar vertebrae as a common cause of low back
pain,” J Bone Joint Surg Br., 39-B: 6-22, 1957.
[2] C. J. Lamoth, O. G. Meijer, A. Daffertshofer, P. I. Wuisman and P. J. Beek, “Effects of chronic low
back pain on trunk coordination and back muscle activity during walking: changes in motor control,”
Eur Spine J., 15: 3-40, 2006.
[3] C. J. Lamoth, A. Daffertshofer, O. G. Meijer and P. J. Beek, “How do persons with chronic low back
pain speed up and slow down? Trunk-pelvis coordination and lumber erector spinae activity during gait,
Gait Posture, 23: 230-239, 2004.
[4] J. E. Clague, N. Roberts, H. Gibson and R. H. T. Edwards, “Muscle imaging in health and disease,
Neuromuscular Disorders”, Neuromusc. Disord., 5(3):171-178, 1995.
[5] A. M. Alanen, B. Falck, H. Kalimo, M. E. Komu and V. H. Sonninen, “Ultrasound, computed
tomography and magnetic resonance imaging in myopathies: correlations with electromyography and
histopathology”, ACTA Neurologica Scandinavica, 89(5):336-346, 1997.
[6] B. M. Wand, C. Bird, J. H. McAuley, C. J. Doré, M. MacDowell and L. H. De Souza, “Early
intervention for the management of acute low back pain: a single-blind randomized controlled trial of
biopsychosocial education, manual therapy, and exercise,” Spine, 29: 2350-2356, 2004.
[7] S. H. Roy, C. J. De Luca and D. A. Casavant, “Lumbar muscle fatigue and chronic lower back pain,”
Spine, 14: 992-1001, 1989.
11
[8] C. Ambroz, A. Scott, A. Ambroz and E. Talbott, “Chronic low back pain assessment using surface
electromyogram,” Journal of Occupational EM, 42: 660-669, 2000.
[9] C. J. De Luca, “Use of the surface EMG signal for performance evaluation of back muscles,” Muscle
and Nerve, 16: 210-216, 2006.
[10] J. Kurt, F. Nils, K. L. Claes and J. Bente, “Electromyography and fatigue during prolonged, low-level
static contractions,” European Journal of Applied Physiology, 57: 316-321, 1988.
[11] K. Kamei, D. K. Kumar and B. Polus, “Reliability and validity of surface electromyography (SEMG)
to study the functional status of lumbar para spinal muscles during execution of the unsupported sitting
posture,” Chiropractic Journal of Australia, 37: 30-37 2007.
[12] J. Crosbie, R. Vachalathiti and R. Smith, “Patterns of spinal motion during walking,” Gait & Posture,
5: 6-12, 1997.
[13] S. Khodadadeh, S. M. Eisenstein, B. Summers and J. Patrick, “Gait asymmetry in patients with chronic
low back pain,” Neuro-Orthop, 6: 24-27, 1988
[14] J. P. Lund, R. Donga, C. G. Widmer and C. S. Stohler, “The pain-adaptation model: a discussion of the
relationship between chronic musculoskeletal pain and motor activity,” Can J Physiol Pharmacol., 69:
683-694, 1991.
[15] D. K. Ahern, D. J. Hannon, A. J. Goreczny, M. J. Follick and J. R. Parziale, “Correlation of chronic
low-back pain behavior and muscle function examination of the flexion-relaxation response,” Spine, 15:
92-95, 1990.
[16] W. Marras and P. Wongsam, “Flexibility and velocity of the normal and impaired lumbar spine,” Arch.
Phys. Med. Rehabil., 67: 213-217, 1986.
[17] C. E. Lee, M. J. Simmonds, B. R. Etnyre and G. S. Morris, “Influence of pain distribution on gait
characteristics in patients with low back pain: part 1: vertical ground reaction force,” Spine, 32:
1329-1336, 2007.
12
[18] L. Arendt-Nielson, T. Graven-Nielson, H. Svarrer and P. Svensson, “The influence of low back pain on
muscle activity and coordination during gait: a clinical and experimental study,” Pain, 64: 231-240,
1995.
[19] F. Zeifang, M. Schiltenwolf, A. Rainer and B. Moradi, “Gait analysis does not correlate with clinical
and MR imaging parameters in patients with symptomatic lumbar spinal stenosis,” BMC
Musculoskeletal Disorder, 9: 89, 2008.
[20] C. Lee, H. Minamitani, K. Ju, K. Wakano, S. Onishi and H. Yamazaki, “Power spectral analysis of
lumbar muscle electromyogram in chronic low-back pain patients during dynamic trunk exercise,”
Proc. IEEE Int. 17th Annual Conf. Engineering in Medicine and Biology Society, 2: 1337-1338, 1995.
[21] M. I. V. Mientjes and J. S. Frank, “Balance in chronic low back pain patients compared to healthy
people under various conditions in upright standing,” Clinical Biomechanics, 14: 710-716, 1999.
[22] P. W. Hodges, “Changes in motor planning of feed forward postural responses of the trunk muscles in
low back pain,” Experimental Brain Research, 141: 261-266, 2001.
[23] J. H. van Dieen and L. P. Selen, “Trunk muscle activation in low-back pain patients, an analysis of the
literature,” J Electromyogr. Kinesiol, 13: 333-351, 2003.
[24] S. C. White and H. J. Yack, “Comparison of vertical ground reaction forces during over ground and
treadmill walking,” Medicine & Science in Sports & Exercise, 30: 1537-1542, 1998.
[25] S. J. Lee and J. Hidler, “Biomechanics of over ground vs. treadmill walking in healthy individuals”, J
Appl Physiol, 104: 747-755, 2008.
[26] N. A. Dimitrova and G. V. Dimitrov, “Interpretation of EMG changes with fatigue: facts, pitfalls, and
fallacies,” Journal of Electromyography and Kinesiology, 13: 13-36, 2003.
[27] J.H.W. Chowa and C.C.H. Chanb, “Validation of the Chinese version of the Oswestry Disability
Index”, Work, 25:307–314, 2005.
[28] A. Rainoldi, G. Galardi, L. Maderna, G. Comi, L. Lo Conte and R. Merletti, “Repeatability of surface
13

EMG variables during voluntary isometric contractions of the biceps brachii muscle”, Journal of
Electromyography and Kinesiology ISEK-XII, 9(2): 105-119, 1999.
[29] B. Weaver, “Chapter 3: Nonparametric Tests”, http://www.angelfire.com/wv/bwhomedir/notes/
nonpar.pdf (Last Access: 16 September 2009), 2002
List of Figures
14

Fig. 1 a) Electrode placement for all 4 channels b) Location of the foot sensor placement Fig 2. Box plot showing the mean and standard deviation of variance during walking by a) Healthy Participants b) LBP participants Fig 3. Box plot showing the mean and standard deviation of variance during running by a) Healthy Participants b) LBP participants
15
a)
b)
Fig. 1 a) Electrode placement for all 4 channels b) Location of the foot sensor placement
16
1 2 3 4
0
1
2
3
4
5
x 10 -10
Var
ian
c
Channel
a)
1 2 3 4
0
2
4
6
8
10
12
14
16 x 10
-9
Var
ian
ce
Channel
b) Fig 2. Box plot of the variance during walking by a) Healthy Participants (scale: 10-10) b) LBP participants (scale: 10-9)
17
1 2 3 4
0
1
2
3
4
5
6
7
8 x 10 -9
Var
ianc
e
Channel
a)
1 2 3 4
0
2
4
6
8
10
12
14 x 10
-7
Var
ian
ce
Channel
b) Fig. 3 Box plot of the variance during running by a) Healthy Participants (scale: 10-9) b) LBP participants(scale: 10-7).
18

List of Tables
Table 1. Statistics of participants in this experiment.
Table 2. Location of the electrode placement on different muscles of lumbar area.
Table 3. The average variance of amplitude, average ratio of the amplitude variance (during the 1st and last
minute) and KS test P values for both healthy & low back ailment subjects during Walking (4 Channels).
Table 4. The average variance of amplitude, average ratio of the amplitude variance (during the 1st and last
minute) and KS test P values for both healthy & low back ailment subjects during running (4 Channels).
19
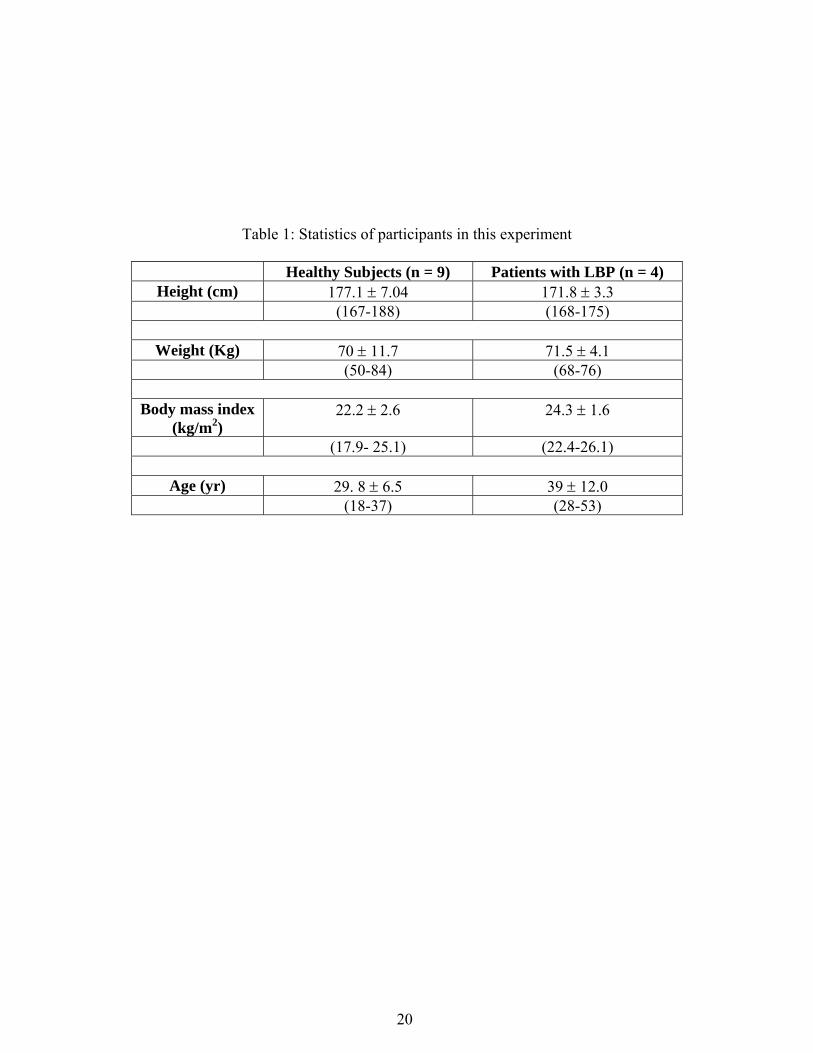
Table 1: Statistics of participants in this experiment
Healthy Subjects (n = 9) Patients with LBP (n = 4) Height (cm) 177.1 7.04 171.8 3.3
(167-188) (168-175)
Weight (Kg) 70 11.7 71.5 4.1 (50-84) (68-76)
Body mass index
(kg/m2) 22.2 2.6 24.3 1.6
(17.9- 25.1) (22.4-26.1)
Age (yr) 29. 8 6.5 39 12.0 (18-37) (28-53)
20
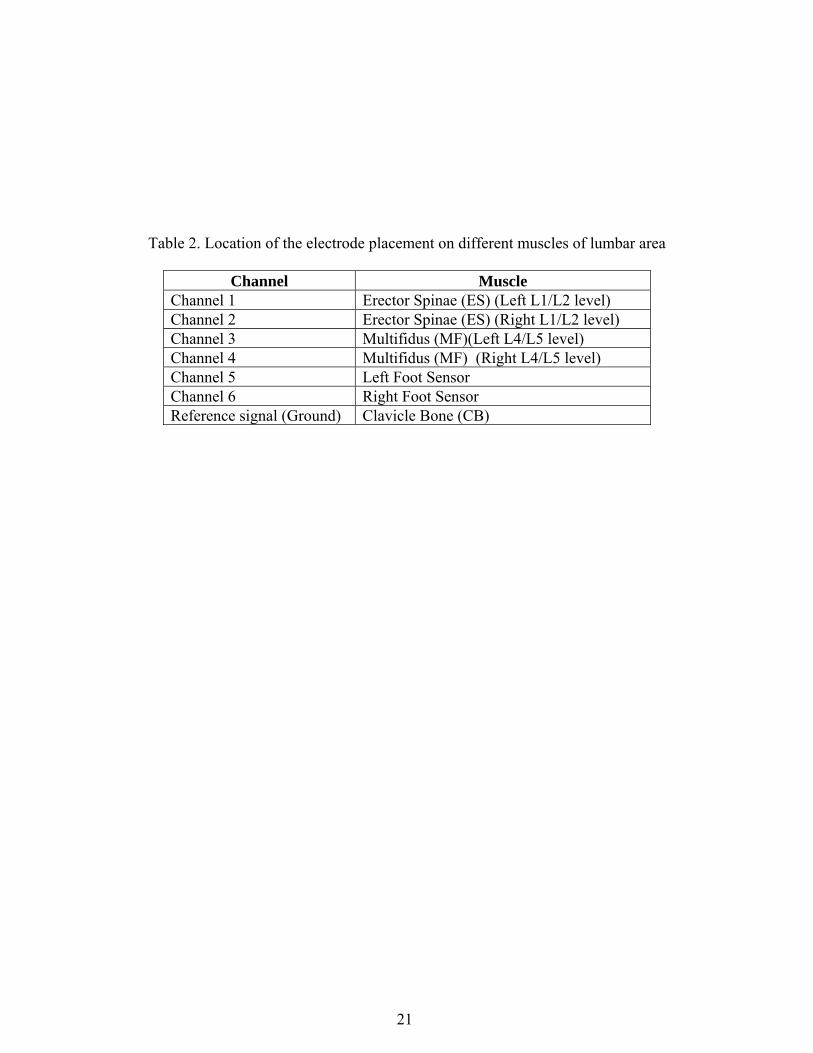
Table 2. Location of the electrode placement on different muscles of lumbar area
Channel Muscle Channel 1 Erector Spinae (ES) (Left L1/L2 level) Channel 2 Erector Spinae (ES) (Right L1/L2 level) Channel 3 Multifidus (MF)(Left L4/L5 level) Channel 4 Multifidus (MF) (Right L4/L5 level) Channel 5 Left Foot Sensor Channel 6 Right Foot Sensor Reference signal (Ground) Clavicle Bone (CB)
21
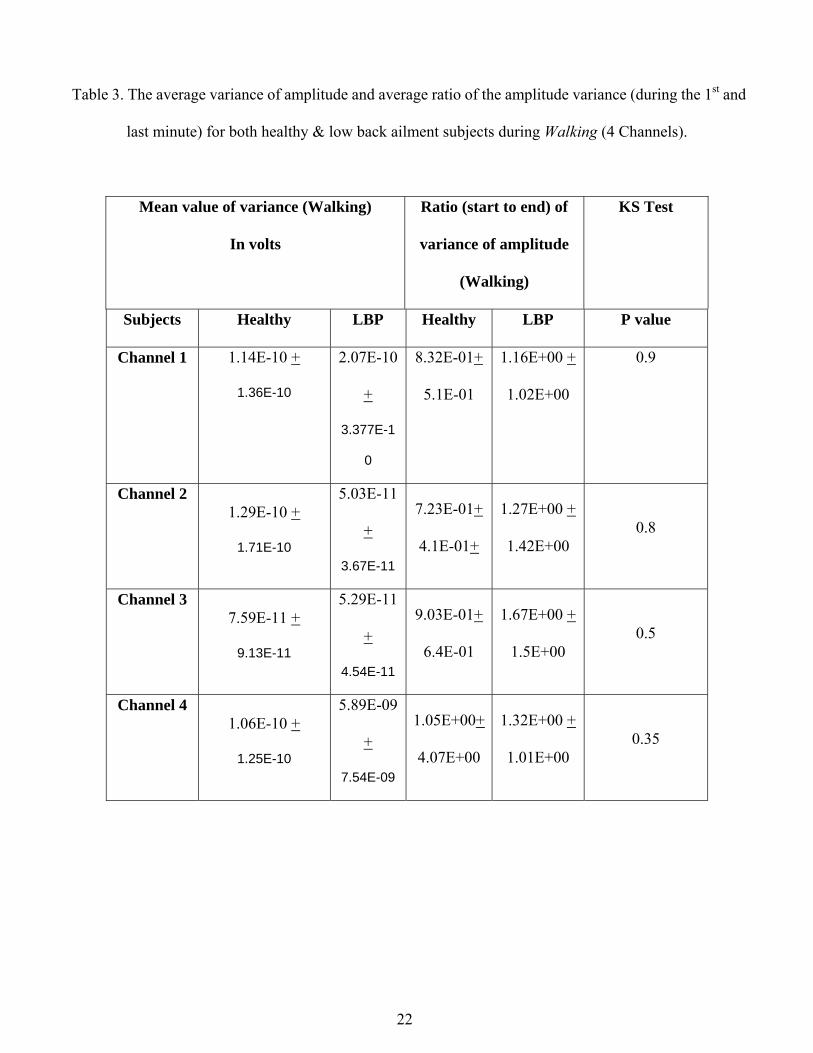
Table 3. The average variance of amplitude and average ratio of the amplitude variance (during the 1st and
last minute) for both healthy & low back ailment subjects during Walking (4 Channels).
Mean value of variance (Walking)
In volts
Ratio (start to end) of
variance of amplitude
(Walking)
KS Test
Subjects Healthy LBP Healthy LBP P value
Channel 1 1.14E-10 +
1.36E-10
2.07E-10
+
3.377E-1
0
8.32E-01+
5.1E-01
1.16E+00 +
1.02E+00
0.9
Channel 2 1.29E-10 +
1.71E-10
5.03E-11
+
3.67E-11
7.23E-01+
4.1E-01+
1.27E+00 +
1.42E+00 0.8
Channel 3 7.59E-11 +
9.13E-11
5.29E-11
+
4.54E-11
9.03E-01+
6.4E-01
1.67E+00 +
1.5E+00 0.5
Channel 4 1.06E-10 +
1.25E-10
5.89E-09
+
7.54E-09
1.05E+00+
4.07E+00
1.32E+00 +
1.01E+00 0.35
22
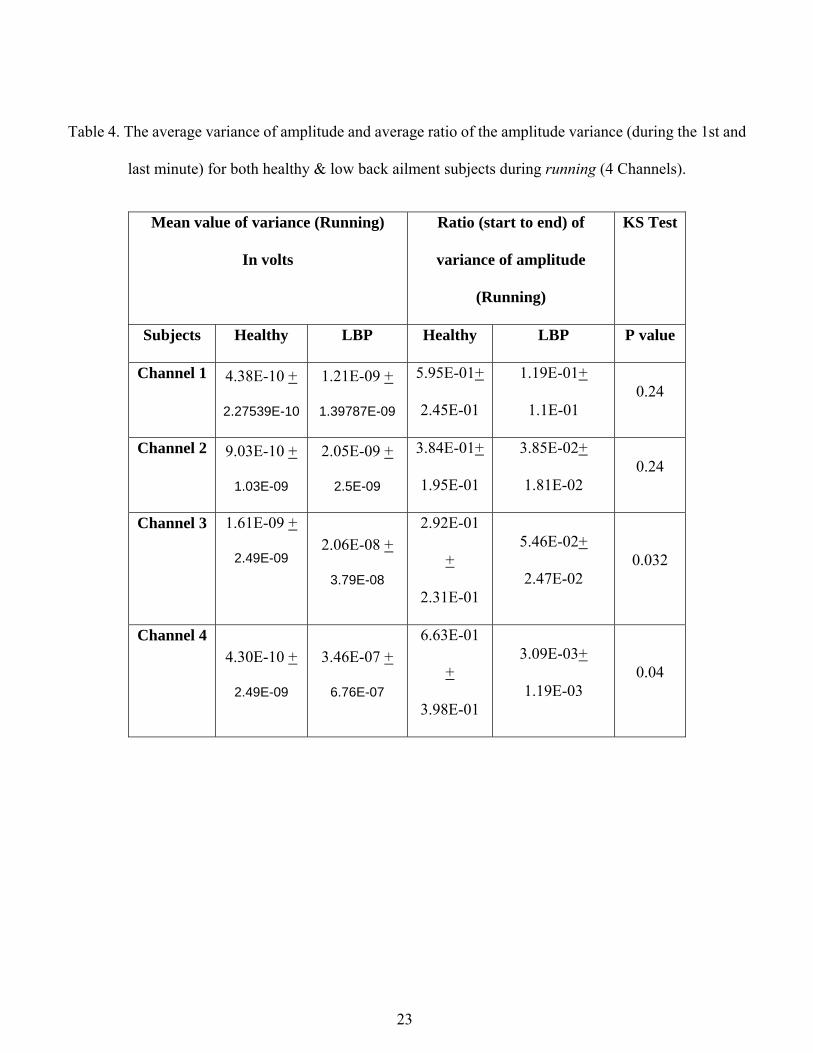
Table 4. The average variance of amplitude and average ratio of the amplitude variance (during the 1st and
last minute) for both healthy & low back ailment subjects during running (4 Channels).
Mean value of variance (Running)
In volts
Ratio (start to end) of
variance of amplitude
(Running)
KS Test
Subjects Healthy LBP Healthy LBP P value
Channel 1 4.38E-10 +
2.27539E-10
1.21E-09 +
1.39787E-09
5.95E-01+
2.45E-01
1.19E-01+
1.1E-01 0.24
Channel 2 9.03E-10 +
1.03E-09
2.05E-09 +
2.5E-09
3.84E-01+
1.95E-01
3.85E-02+
1.81E-02 0.24
Channel 3 1.61E-09 +
2.49E-09 2.06E-08 +
3.79E-08
2.92E-01
+
2.31E-01
5.46E-02+
2.47E-02 0.032
Channel 4 4.30E-10 +
2.49E-09
3.46E-07 +
6.76E-07
6.63E-01
+
3.98E-01
3.09E-03+
1.19E-03 0.04
23

24