Embed Size (px)
Citation preview
Package ‘MOTE’April 10, 2019
Version 1.0.2
Date 2019-04-10
Title Effect Size and Confidence Interval Calculator
Depends R (>= 3.1.0)
Imports MBESS, stats, ez, reshape
Description Measure of the Effect ('MOTE') is an effect size calculator, including awide variety of effect sizes in the mean differences family (all versions of d) andthe variance overlap family (eta, omega, epsilon, r). 'MOTE' provides non-centralconfidence intervals for each effect size, relevant test statistics, and outputfor reporting in APA Style (American Psychological Association, 2010,<ISBN:1433805618>) with 'LaTeX'. In research, an over-reliance on p-valuesmay conceal the fact that a study is under-powered (Halsey, Curran-Everett,Vowler, & Drummond, 2015 <doi:10.1038/nmeth.3288>). A test may be statisticallysignificant, yet practically inconsequential (Fritz, Scherndl, & Kühberger, 2012<doi:10.1177/0959354312436870>). Although the American Psychological Associationhas long advocated for the inclusion of effect sizes (Wilkinson & AmericanPsychological Association Task Force on Statistical Inference, 1999<doi:10.1037/0003-066X.54.8.594>), the vast majority of peer-reviewed,published academic studies stop short of reporting effect sizes and confidenceintervals (Cumming, 2013, <doi:10.1177/0956797613504966>). 'MOTE' simplifiesthe use and interpretation of effect sizes and confidence intervals. For moreinformation, visit <https://www.aggieerin.com/shiny-server>.
License LGPL-3
Encoding UTF-8
LazyData true
RoxygenNote 6.1.1
NeedsCompilation no
Author Erin M. Buchanan [aut, cre] (<https://orcid.org/0000-0002-9689-4189>),Amber M Gillenwaters [aut] (<https://orcid.org/0000-0002-7580-3591>),John E. Scofield [aut] (<https://orcid.org/0000-0001-6345-1181>),K. D. Valentine [aut] (<https://orcid.org/0000-0001-6349-5395>)
Maintainer Erin M. Buchanan <[email protected]>
1

2 R topics documented:
Repository CRAN
Date/Publication 2019-04-10 21:01:35 UTC
R topics documented:apa . . . . . . . . . . . . . . . . . . . . . . . . . . . . . . . . . . . . . . . . . . . . . . 3bn1_data . . . . . . . . . . . . . . . . . . . . . . . . . . . . . . . . . . . . . . . . . . . 3bn2_data . . . . . . . . . . . . . . . . . . . . . . . . . . . . . . . . . . . . . . . . . . . 4chisq_data . . . . . . . . . . . . . . . . . . . . . . . . . . . . . . . . . . . . . . . . . . 4d.dep.t.avg . . . . . . . . . . . . . . . . . . . . . . . . . . . . . . . . . . . . . . . . . . 5d.dep.t.diff . . . . . . . . . . . . . . . . . . . . . . . . . . . . . . . . . . . . . . . . . . 6d.dep.t.diff.t . . . . . . . . . . . . . . . . . . . . . . . . . . . . . . . . . . . . . . . . . 8d.dep.t.rm . . . . . . . . . . . . . . . . . . . . . . . . . . . . . . . . . . . . . . . . . . 9d.ind.t . . . . . . . . . . . . . . . . . . . . . . . . . . . . . . . . . . . . . . . . . . . . 11d.ind.t.t . . . . . . . . . . . . . . . . . . . . . . . . . . . . . . . . . . . . . . . . . . . 13d.prop . . . . . . . . . . . . . . . . . . . . . . . . . . . . . . . . . . . . . . . . . . . . 15d.single.t . . . . . . . . . . . . . . . . . . . . . . . . . . . . . . . . . . . . . . . . . . . 16d.single.t.t . . . . . . . . . . . . . . . . . . . . . . . . . . . . . . . . . . . . . . . . . . 18d.to.r . . . . . . . . . . . . . . . . . . . . . . . . . . . . . . . . . . . . . . . . . . . . . 19d.z.mean . . . . . . . . . . . . . . . . . . . . . . . . . . . . . . . . . . . . . . . . . . . 21d.z.z . . . . . . . . . . . . . . . . . . . . . . . . . . . . . . . . . . . . . . . . . . . . . 23delta.ind.t . . . . . . . . . . . . . . . . . . . . . . . . . . . . . . . . . . . . . . . . . . 24dept_data . . . . . . . . . . . . . . . . . . . . . . . . . . . . . . . . . . . . . . . . . . 26epsilon.full.SS . . . . . . . . . . . . . . . . . . . . . . . . . . . . . . . . . . . . . . . . 27eta.F . . . . . . . . . . . . . . . . . . . . . . . . . . . . . . . . . . . . . . . . . . . . . 28eta.full.SS . . . . . . . . . . . . . . . . . . . . . . . . . . . . . . . . . . . . . . . . . . 29eta.partial.SS . . . . . . . . . . . . . . . . . . . . . . . . . . . . . . . . . . . . . . . . 31g.ind.t . . . . . . . . . . . . . . . . . . . . . . . . . . . . . . . . . . . . . . . . . . . . 32ges.partial.SS.mix . . . . . . . . . . . . . . . . . . . . . . . . . . . . . . . . . . . . . . 34ges.partial.SS.rm . . . . . . . . . . . . . . . . . . . . . . . . . . . . . . . . . . . . . . 36indt_data . . . . . . . . . . . . . . . . . . . . . . . . . . . . . . . . . . . . . . . . . . 38mix2_data . . . . . . . . . . . . . . . . . . . . . . . . . . . . . . . . . . . . . . . . . . 39odds . . . . . . . . . . . . . . . . . . . . . . . . . . . . . . . . . . . . . . . . . . . . . 39omega.F . . . . . . . . . . . . . . . . . . . . . . . . . . . . . . . . . . . . . . . . . . . 40omega.full.SS . . . . . . . . . . . . . . . . . . . . . . . . . . . . . . . . . . . . . . . . 42omega.gen.SS.rm . . . . . . . . . . . . . . . . . . . . . . . . . . . . . . . . . . . . . . 43omega.partial.SS.bn . . . . . . . . . . . . . . . . . . . . . . . . . . . . . . . . . . . . . 45omega.partial.SS.rm . . . . . . . . . . . . . . . . . . . . . . . . . . . . . . . . . . . . . 47r.correl . . . . . . . . . . . . . . . . . . . . . . . . . . . . . . . . . . . . . . . . . . . . 49rm1_data . . . . . . . . . . . . . . . . . . . . . . . . . . . . . . . . . . . . . . . . . . 51rm2_data . . . . . . . . . . . . . . . . . . . . . . . . . . . . . . . . . . . . . . . . . . 51singt_data . . . . . . . . . . . . . . . . . . . . . . . . . . . . . . . . . . . . . . . . . . 52v.chi.sq . . . . . . . . . . . . . . . . . . . . . . . . . . . . . . . . . . . . . . . . . . . 52
Index 54

apa 3
apa APA Format
Description
A function that formats decimals and leading zeroes for creating reports in scientific style.
Usage
apa(value, decimals = 3, leading = TRUE)
Arguments
value A set of numeric values, either a single number, vector, or set of columns.decimals The number of decimal points desired in the output.leading Logical value: TRUE for leading zeroes on decimals and FALSE for no leading
zeroes on decimals. The default is TRUE.
Details
This function creates "pretty" character vectors from numeric variables for printing as part of areport. The value can take a single number, matrix, vector, or multiple columns from a data frame,as long as they are numeric. The values will be coerced into numeric if they are characters or logicalvalues, but this process may result in an error if values are truly alphabetical.
Examples
apa(value = 0.54674, decimals = 3, leading = TRUE)
bn1_data Between Subjects One-way ANOVA Example Data
Description
Dataset for use in eta.F, eta.full.SS, omega.F, omega.full.SS, and epsilon.full.SS, includ-ing ratings of inter-personal attachments of 45-year-olds categorized as being in excellent, fair, orpoor health.
Usage
data(bn1_data)
Format
A data frame of ratings of close interpersonal attachments
poor: individuals in poor health fair: individuals in fair health excellent: individuals in excellenthealth

4 chisq_data
References
Nolan and Heizen Statistics for the Behavioral Sciences (Book Link)
bn2_data Between Subjects Two-way ANOVA Example Data
Description
Dataset for use in omega.partial.SS.bn, eta.partial.SS, and other between-subject’s ANOVAdesigns. This data includes (fake) atheletic budgets for baseball, basketball, football, soccer, andvolleyball teams with new and old coaches to determine if there are differences in spending acrosscoaches and sports.
Usage
data(bn2_data)
Format
A data frame of ratings of close interpersonal attachments
coach: an old or new coach type: varying sports - baseball, basketball, football, soccer, volleyballmoney: athletic spending (in thousands of dollars)
chisq_data Chi-Square Example Data
Description
Dataset for use in v.chi.sq, Individuals were polled and asked to report their number of friends(low, medium, high) and number of kids (1, 2, 3+) to determine if there was a relationship betweenfriend groups and number of children. It was hypothesized that those with more children may haveless time for friendship maintaining activities.
Usage
data(chisq_data)
Format
A data frame of number of friends and number of children
friends: number of reported friends kids: number of children
References
Nolan and Heizen Statistics for the Behavioral Sciences (Book Link)

d.dep.t.avg 5
d.dep.t.avg d for Dependent t with Average SD Denominator
Description
This function displays d and the non-central confidence interval for repeated measures data, usingthe average standard deviation of each level as the denominator.
Usage
d.dep.t.avg(m1, m2, sd1, sd2, n, a = 0.05)
Arguments
m1 mean from first levelm2 mean from second levelsd1 standard deviation from first levelsd2 standard deviation from second leveln sample sizea significance level
Details
To calculate d, mean two is subtracted from mean one, which is then divided by the average standarddeviation.
d_av = (m1 - m2) / ((sd1 + sd2) / 2)
Learn more on our example page.
Value
The effect size (Cohen’s d) with associated confidence intervals, the confidence intervals associatedwith the means of each group, standard deviations of the means for each group.
d effect sizedlow lower level confidence interval d valuedhigh upper level confidence interval d valueM1/M2 mean one and twoM1low/M2low lower level confidence interval of mean one or twoM1high/M2high upper level confidence interval of mean one or twosd1/sd2 standard deviation of mean one and twose1/se2 standard error of mean one and twon sample sizedf degrees of freedom (sample size - 1)estimate the d statistic and confidence interval in APA style for markdown printing

6 d.dep.t.diff
Examples
#The following example is derived from the "dept_data" dataset included#in the MOTE library.
#In a study to test the effects of science fiction movies on people's#belief in the supernatural, seven people completed a measure of belief#in the supernatural before and after watching a popular science fiction#movie. Higher scores indicated higher levels of belief.
t.test(dept_data$before, dept_data$after, paired = TRUE)
#You can type in the numbers directly, or refer to the dataset,#as shown below.
d.dep.t.avg(m1 = 5.57, m2 = 4.43, sd1 = 1.99,sd2 = 2.88, n = 7, a = .05)
d.dep.t.avg(5.57, 4.43, 1.99, 2.88, 7, .05)
d.dep.t.avg(mean(dept_data$before), mean(dept_data$after),sd(dept_data$before), sd(dept_data$after),length(dept_data$before), .05)
#The mean measure of belief on the pretest was 5.57, with a standard#deviation of 1.99. The posttest scores appeared lower (M = 4.43, SD = 2.88)#but the dependent t-test was not significant using alpha = .05,#t(7) = 1.43, p = .203, d_av = 0.47. The effect size was a medium effect suggesting#that the movie may have influenced belief in the supernatural.
d.dep.t.diff d for Dependent t with SD Difference Scores Denominator
Description
This function displays d and the non-central confidence interval for repeated measures data, usingthe standard deviation of the difference score as the denominator.
Usage
d.dep.t.diff(mdiff, sddiff, n, a = 0.05)
Arguments
mdiff mean difference score
sddiff standard deviation of the difference scores
n sample size
a significance level
d.dep.t.diff 7
Details
To calculate d, the mean difference score is divided by divided by the standard deviation of thedifference scores.
d_z = mdiff / sddiff
Learn more on our example page.
Value
The effect size (Cohen’s d) with associated confidence intervals, mean differences with associatedconfidence intervals, standard deviation of the differences, standard error, sample size, degrees offreedom, the t-statistic, and the p-value.
d effect size
dlow lower level confidence interval d value
dhigh upper level confidence interval d value
mdiff mean difference score
Mlow lower level of confidence interval of the mean
Mhigh upper level of confidence interval of the mean
sddiff standard deviation of the difference scores
n sample size
df degrees of freedom (sample size - 1)
t t-statistic
p p-value
estimate the d statistic and confidence interval in APA style for markdown printing
statistic the t-statistic in APA style for markdown printing
Examples
#The following example is derived from the "dept_data" dataset included#in the MOTE library.
#In a study to test the effects of science fiction movies on people's#belief in the supernatural, seven people completed a measure of belief#in the supernatural before and after watching a popular science fiction movie.#Higher scores indicated higher levels of belief. The mean difference score was 1.14,#while the standard deviation of the difference scores was 2.12.
#You can type in the numbers directly as shown below,#or refer to your dataset within the function.
d.dep.t.diff(mdiff = 1.14, sddiff = 2.12, n = 7, a = .05)
d.dep.t.diff(1.14, 2.12, 7, .05)
d.dep.t.diff(mdiff = mean(dept_data$before - dept_data$after),

8 d.dep.t.diff.t
sddiff = sd(dept_data$before - dept_data$after),n = length(dept_data$before),a = .05)
#The mean measure of belief on the pretest was 5.57, with a standard#deviation of 1.99. The posttest scores appeared lower (M = 4.43, SD = 2.88)#but the dependent t-test was not significant using alpha = .05,#t(7) = 1.43, p = .203, d_z = 0.54. The effect size was a medium#effect suggesting that the movie may have influenced belief#in the supernatural.
d.dep.t.diff.t d from t for Repeated Measures with SD Difference Scores Denomina-tor
Description
This function displays d for repeated measures data and the non-central confidence interval usingthe standard deviation of the differences as the denominator estimating from the t-statistic.
Usage
d.dep.t.diff.t(t, n, a = 0.05)
Arguments
t t-test valuen sample sizea significance level
Details
To calculate d, the t-statistic is divided by the square root of the sample size.
d_z = t / sqrt(n)
Learn more on our example page.
Value
d effect sizedlow lower level confidence interval d valuedhigh upper level confidence interval d valuen sample sizedf degrees of freedom (sample size - 1)p p-valueestimate the d statistic and confidence interval in APA style for markdown printingstatistic the t-statistic in APA style for markdown printing

d.dep.t.rm 9
Examples
#The following example is derived from the "dept_data" dataset included#in the MOTE library.
#In a study to test the effects of science fiction movies on people’s belief#in the supernatural, seven people completed a measure of belief in#the supernatural before and after watching a popular science#fiction movie. Higher scores indicated higher levels of belief.
scifi = t.test(dept_data$before, dept_data$after, paired = TRUE)
#The t-test value was 1.43. You can type in the numbers directly,#or refer to the dataset, as shown below.
d.dep.t.diff.t(t = 1.43, n = 7, a = .05)
d.dep.t.diff.t(1.43, 7, .05)
d.dep.t.diff.t(scifi$statistic, length(dept_data$before), .05)
#The mean measure of belief on the pretest was 5.57, with a standard#deviation of 1.99. The posttest scores appeared lower (M = 4.43, SD = 2.88)#but the dependent t-test was not significant using alpha = .05,#t(7) = 1.43, p = .203, d_z = 0.54. The effect size was a medium effect suggesting#that the movie may have influenced belief in the supernatural.
d.dep.t.rm d for Repeated Measures with Average SD Denominator
Description
This function displays d and the non-central confidence interval for repeated measures data, usingthe average standard deviation of each level as the denominator, but controlling for r.
Usage
d.dep.t.rm(m1, m2, sd1, sd2, r, n, a = 0.05)
Arguments
m1 mean from first levelm2 mean from second levelsd1 standard deviation from first levelsd2 standard deviation from second levelr correlation between first and second leveln sample sizea significance level

10 d.dep.t.rm
Details
To calculate d, mean two is subtracted from mean one, which is divided by the average standarddeviation, while mathematically controlling for the correlation coefficient (r).
d_rm = ((m1 - m2) / sqrt(( sd1^2 + sd2^2 ) - (2 x r x sd1 x sd2))) x sqrt(2 x (1-r))
Learn more on our example page.
Value
Controls for correlation and provides the effect size (Cohen’s d) with associated confidence inter-vals,m the confidence intervals associated with the means of each group,mstandard deviations andstandard errors of the means for each group.
d effect size
dlow lower level confidence interval d value
dhigh upper level confidence interval d value
M1 mean one
sd1 standard deviation of mean one
se1 standard error of mean one
M1low lower level confidence interval of mean one
M1high upper level confidence interval of mean one
M2 mean two
sd2 standard deviation of mean two
se2 standard error of mean two
M2low lower level confidence interval of mean two
M2high upper level confidence interval of mean two
r correlation
n sample size
df degrees of freedom (sample size - 1)
estimate the d statistic and confidence interval in APA style for markdown printing
Examples
#The following example is derived from the "dept_data" dataset included#in the MOTE library.
#In a study to test the effects of science fiction movies on people's#belief in the supernatural, seven people completed a measure of belief#in the supernatural before and after watching a popular science fiction#movie. Higher scores indicated higher levels of belief.
t.test(dept_data$before, dept_data$after, paired = TRUE)
scifi_cor = cor(dept_data$before, dept_data$after, method = "pearson",

d.ind.t 11
use = "pairwise.complete.obs")
#You can type in the numbers directly, or refer to the dataset,#as shown below.
d.dep.t.rm(m1 = 5.57, m2 = 4.43, sd1 = 1.99,sd2 = 2.88, r = .68, n = 7, a = .05)
d.dep.t.rm(5.57, 4.43, 1.99, 2.88, .68, 7, .05)
d.dep.t.rm(mean(dept_data$before), mean(dept_data$after),sd(dept_data$before), sd(dept_data$after),scifi_cor, length(dept_data$before), .05)
#The mean measure of belief on the pretest was 5.57, with a standard#deviation of 1.99. The posttest scores appeared lower (M = 4.43, SD = 2.88)#but the dependent t-test was not significant using alpha = .05,#t(7) = 1.43, p = .203, d_rm = 0.43. The effect size was a medium effect suggesting#that the movie may have influenced belief in the supernatural.
d.ind.t d for Between Subjects with Pooled SD Denominator
Description
This function displays d for between subjects data and the non-central confidence interval using thepooled standard deviation as the denominator.
Usage
d.ind.t(m1, m2, sd1, sd2, n1, n2, a = 0.05)
Arguments
m1 mean group onem2 mean group twosd1 standard deviation group onesd2 standard deviation group twon1 sample size group onen2 sample size group twoa significance level
Details
To calculate d, mean two is subtracted from mean one and divided by the pooled standard deviation.
d_s = (m1 - m2) / spooled
Learn more on our example page.

12 d.ind.t
Value
Provides the effect size (Cohen’s d) with associated confidence intervals, the t-statistic, the con-fidence intervals associated with the means of each group, as well as the standard deviations andstandard errors of the means for each group.
d effect size
dlow lower level confidence interval of d value
dhigh upper level confidence interval of d value
M1 mean of group one
sd1 standard deviation of group one mean
se1 standard error of group one mean
M1low lower level confidence interval of group one mean
M1high upper level confidence interval of group one mean
M2 mean of group two
sd2 standard deviation of group two mean
se2 standard error of group two mean
M2low lower level confidence interval of group two mean
M2high upper level confidence interval of group two mean
spooled pooled standard deviation
sepooled pooled standard error
n1 sample size of group one
n2 sample size of group two
df degrees of freedom (n1 - 1 + n2 - 1)
t t-statistic
p p-value
estimate the d statistic and confidence interval in APA style for markdown printing
statistic the t-statistic in APA style for markdown printing
Examples
#The following example is derived from the "indt_data" dataset, included#in the MOTE library.
#A forensic psychologist conducted a study to examine whether#being hypnotized during recall affects how well a witness#can remember facts about an event. Eight participants#watched a short film of a mock robbery, after which#each participant was questioned about what he or she had#seen. The four participants in the experimental group#were questioned while they were hypnotized. The four#participants in the control group recieved the same#questioning without hypnosis.

d.ind.t.t 13
t.test(correctq ~ group, data = indt_data)
#You can type in the numbers directly, or refer to the dataset,#as shown below.
d.ind.t(m1 = 17.75, m2 = 23, sd1 = 3.30,sd2 = 2.16, n1 = 4, n2 = 4, a = .05)
d.ind.t(17.75, 23, 3.30, 2.16, 4, 4, .05)
d.ind.t(mean(indt_data$correctq[indt_data$group == 1]),mean(indt_data$correctq[indt_data$group == 2]),sd(indt_data$correctq[indt_data$group == 1]),sd(indt_data$correctq[indt_data$group == 2]),length(indt_data$correctq[indt_data$group == 1]),length(indt_data$correctq[indt_data$group == 2]),.05)
#Contrary to the hypothesized result, the group that underwent hypnosis were#significantly less accurate while reporting facts than the control group#with a large effect size, t(6) = -2.66, p = .038, d_s = 1.88.
d.ind.t.t d from t for Between Subjects
Description
This function displays d for between subjects data and the non-central confidence interval estimatingfrom the t-statistic.
Usage
d.ind.t.t(t, n1, n2, a = 0.05)
Arguments
t t-test valuen1 sample size group onen2 sample size group twoa significance level
Details
To calculate d, the t-statistic is multiplied by two then divided by the square root of the degrees offreedom.
d_s = 2 * t / sqrt(n1 + n2 - 2)
Learn more on our example page.

14 d.ind.t.t
Value
Provides the effect size (Cohen’s d) with associated confidence intervals, degrees of freedom, t-statistic, and p-value.
d effect sizedlow lower level confidence interval of d valuedhigh upper level confidence interval of d valuen1 sample sizen2 sample sizedf degrees of freedom (n1 - 1 + n2 - 1)t t-statisticp p-valueestimate the d statistic and confidence interval in APA style for markdown printingstatistic the t-statistic in APA for the t-test
Examples
#The following example is derived from the "indt_data" dataset, included#in the MOTE library.
#A forensic psychologist conducted a study to examine whether#being hypnotized during recall affects how well a witness#can remember facts about an event. Eight participants#watched a short film of a mock robbery, after which#each participant was questioned about what he or she had#seen. The four participants in the experimental group#were questioned while they were hypnotized. The four#participants in the control group recieved the same#questioning without hypnosis.
hyp = t.test(correctq ~ group, data = indt_data)
#You can type in the numbers directly, or refer to the dataset,#as shown below.
d.ind.t.t(t = -2.6599, n1 = 4, n2 = 4, a = .05)
d.ind.t.t(-2.6599, 4, 4, .05)
d.ind.t.t(hyp$statistic,length(indt_data$group[indt_data$group == 1]),length(indt_data$group[indt_data$group == 2]),.05)
#Contrary to the hypothesized result, the group that underwent hypnosis were#significantly less accurate while reporting facts than the control group#with a large effect size, t(6) = -2.66, p = .038, d_s = 2.17.

d.prop 15
d.prop d for Independent Proportions
Description
This function displays d and central confidence interval calculated from differences in indepen-dent proportions. Independent proportions are two percentages that are from different groups ofparticipants.
Usage
d.prop(p1, p2, n1, n2, a = 0.05)
Arguments
p1 proportion for group one
p2 proportion for group two
n1 sample size group one
n2 sample size group two
a significance level
Details
To calculate z, the proportion of group two is substracted from group one, which is then divided bythe standard error.
z = (p1 - p2) / se
To calculate d, the proportion of group two is divided by the standard error of group two which isthen subtracted from the proportion of group one divided by the standard error of group one.
z1 = p1 / se1
z2 = p2 / se2
d = z1 - z2
Learn more on our example page.
Value
d effect size
dlow lower level confidence interval d value
dhigh upper level confidence interval d value
p1 proportion of group one
se1 standard error of the proportion of group one
z1 z-statistic group one
z1low lower level confidence interval of z

16 d.single.t
z1high upper level confidence interval of z
p2 proportion of group two
se2 standard error of the proportion of group two
z2 z-statistic of group two
z2low lower level confidence interval of z
z2high upper level confidence interval of z
n1 sample size group one
n2 sample size group two
z z-statistic for the differences
ppooled pooled proportion to calculate standard error
se standard error
p p-value for the differences
estimate the d statistic and confidence interval in APA style for markdown printing
statistic the t-statistic in APA style for markdown printing
Examples
#Several researchers were examining the data on the number#of students who retake a course after they receive a D, F,#or withdraw from the course. They randomly sampled form#a large university two groups of students: traditional#(less than 25 years old) and non-traditional (25 and older).#Each group included 100 participants. About 25% of students#of the traditional group reported they would retake a course,#while the non-traditional group showed about 35% would#retake the course.
#You can type in the numbers directly as shown below,#or refer to your dataset within the function.
d.prop(p1 = .25, p2 = .35, n1 = 100, n2 = 100, a = .05)
d.prop(.25, .35, 100, 100, .05)
d.single.t d for Single t from Means
Description
This function displays d and non-central confidence interval for single t from means.
Usage
d.single.t(m, u, sd, n, a = 0.05)

d.single.t 17
Arguments
m sample mean
u population mean
sd sample standard deviation
n sample size
a significance level
Details
To calculate d, the population is subtracted from the sample mean, which is then divided by thestandard deviation.
d = (m - u) / sd
Learn more on our example page.
Value
d effect size
dlow lower level confidence interval d value
dhigh upper level confidence interval d value
m sample mean
sd standard deviation of the sample
se standard error of the sample
Mlow lower level confidence interval of the sample mean
Mhigh upper level confidence interval of the sample mean
u population mean
n sample size
df degrees of freedom (n - 1)
t t-statistic
p p-value
estimate the d statistic and confidence interval in APA style for markdown printing
statistic the t-statistic in APA style for markdown printing
Examples
#The following example is derived from the "singt_data" dataset included#in the MOTE library.
#A school has a gifted/honors program that they claim is#significantly better than others in the country. The gifted/honors#students in this school scored an average of 1370 on the SAT,#with a standard deviation of 112.7, while the national average#for gifted programs is a SAT score of 1080.

18 d.single.t.t
gift = t.test(singt_data, mu = 1080, alternative = "two.sided")
#You can type in the numbers directly as shown below,#or refer to your dataset within the function.
d.single.t(m = 1370, u = 1080, sd = 112.7, n = 14, a = .05)
d.single.t(1370, 1080, 112.7, 100, .05)
d.single.t(gift$estimate, gift$null.value,sd(singt_data$SATscore),
length(singt_data$SATscore), .05)
d.single.t.t d for Single t from t
Description
This function displays d and non-central confidence interval for single t estimated from the t-statistic.
Usage
d.single.t.t(t, n, a = 0.05)
Arguments
t t-test value
n sample size
a significance level
Details
To calculate d, the t-statistic is divided by the square root of the sample size.
d = t / sqrt(n)
Learn more on our example page.
Value
The effect size (Cohen’s d) with associated confidence intervals and relevant statistics.
d effect size
dlow lower level confidence interval d value
dhigh upper level confidence interval d value
n sample size

d.to.r 19
df degrees of freedom (sample size - 1)
t sig stats
p p-value
estimate the d statistic and confidence interval in APA style for markdown printing
statistic the t-statistic in APA style for markdown printing
Examples
#A school has a gifted/honors program that they claim is#significantly better than others in the country. The gifted/honors#students in this school scored an average of 1370 on the SAT,#with a standard deviation of 112.7, while the national average#for gifted programs is a SAT score of 1080.
gift = t.test(singt_data, mu = 1080, alternative = "two.sided")
#According to a single-sample t-test, the scores of the students#from the program were significantly higher than the national#average, t(14) = 9.97, p < .001.
#You can type in the numbers directly as shown below, or refer#to your dataset within the function.
d.single.t.t(t = 9.968, n = 15, a = .05)
d.single.t.t(9.968, 15, .05)
d.single.t.t(gift$statistic, length(singt_data$SATscore), .05)
d.to.r r and Coefficient of Determination (R2) from d
Description
Calculates r from d and then translates r to r2 to calculate the non-central confidence interval for r2using the F distribution.
Usage
d.to.r(d, n1, n2, a = 0.05)
Arguments
d effect size statistic
n1 sample size group one
n2 sample size group two
a significance level

20 d.to.r
Details
The correlation coefficient (r) is calculated by dividing Cohen’s d by the square root of the totalsample size squared - divided by the product of the sample sizes of group one and group two.
r = d / sqrt(d^2 + (n1 + n2)^2 / (n1*n2))
Learn more on our example page.
Value
Provides the effect size (correlation coefficient) with associated confidence intervals, the t-statistic,F-statistic, and other estimates appropriate for d to r translation. Note this CI is not based on thetraditional r-to-z transformation but rather non-central F using the ci.R function from MBESS.
r correlation coefficient
rlow lower level confidence interval r
rhigh upper level confidence interval r
R2 coefficient of determination
R2low lower level confidence interval of R2
R2high upper level confidence interval of R2
se standard error
n sample size
dfm degrees of freedom of mean
dfe degrees of freedom error
t t-statistic
F F-statistic
p p-value
estimate the r statistic and confidence interval in APA style for markdown printing
estimateR2 the R^2 statistic and confidence interval in APA style for markdown printing
statistic the t-statistic in APA style for markdown printing
Examples
#The following example is derived from the "indt_data" dataset, included#in the MOTE library.
#A forensic psychologist conducted a study to examine whether#being hypnotized during recall affects how well a witness#can remember facts about an event. Eight participants#watched a short film of a mock robbery, after which#each participant was questioned about what he or she had#seen. The four participants in the experimental group#were questioned while they were hypnotized. The four#participants in the control group recieved the same#questioning without hypnosis.
d.z.mean 21
t.test(correctq ~ group, data = indt_data)
#You can type in the numbers directly, or refer to the dataset,#as shown below.
d.ind.t(m1 = 17.75, m2 = 23, sd1 = 3.30,sd2 = 2.16, n1 = 4, n2 = 4, a = .05)
d.ind.t(17.75, 23, 3.30, 2.16, 4, 4, .05)
d.ind.t(mean(indt_data$correctq[indt_data$group == 1]),mean(indt_data$correctq[indt_data$group == 2]),sd(indt_data$correctq[indt_data$group == 1]),sd(indt_data$correctq[indt_data$group == 2]),length(indt_data$correctq[indt_data$group == 1]),length(indt_data$correctq[indt_data$group == 2]),.05)
#Contrary to the hypothesized result, the group that underwent#hypnosis were significantly less accurate while reporting#facts than the control group with a large effect size, t(6) = -2.66,#p = .038, d_s = 1.88.
d.to.r(d = -1.88, n1 = 4, n2 = 4, a = .05)
d.z.mean d for Z-test from Population Mean and SD
Description
This function displays d for Z-test with the population mean and standard deviation. The normalconfidence interval is also provided.
Usage
d.z.mean(mu, m1, sig, sd1, n, a = 0.05)
Arguments
mu population mean
m1 sample study mean
sig population standard deviation
sd1 standard deviation from the study
n sample size
a significance level

22 d.z.mean
Details
d is calculated by deducting the population mean from the sample study mean and dividing by thealpha level.
d = (m1 - mu) / sig
Learn more on our example page.
Value
The effect size (Cohen’s d) with associated confidence intervals and relevant statistics.
d effect size
dlow lower level confidence interval d value
dhigh upper level confidence interval d value
M1 mean of sample
sd1 standard deviation of sample
se1 standard error of sample
M1low lower level confidence interval of the mean
M1high upper level confidence interval of the mean
Mu population mean
Sigma standard deviation of population
se2 standard error of population
z z-statistic
p p-value
n sample size
estimate the d statistic and confidence interval in APA style for markdown printing
statistic the Z-statistic in APA style for markdown printing
Examples
#The average quiz test taking time for a 10 item test is 22.5#minutes, with a standard deviation of 10 minutes. My class of#25 students took 19 minutes on the test with a standard deviation of 5.
d.z.mean(mu = 22.5, m1 = 19, sig = 10, sd1 = 5, n = 25, a = .05)

d.z.z 23
d.z.z d from z-statistic for Z-test
Description
This function displays d for Z-tests when all you have is the z-statistic. The normal confidenceinterval is also provided if you have sigma. If sigma is left blank, then you will not see a confidenceinterval.
Usage
d.z.z(z, sig = NA, n, a = 0.05)
Arguments
z z statistic
sig population standard deviation
n sample size
a significance level
Details
To calculate d, z is divided by the square root of N.
d = z / sqrt(N)
Learn more on our example page.
Value
The effect size (Cohen’s d) with associated confidence intervals and relevant statistics.
d effect size
dlow lower level confidence interval d value
dhigh upper level confidence interval d value
sigma sample size
z sig stats
p p-value
n sample size
estimate the d statistic and confidence interval in APA style for markdown printing
statistic the Z-statistic in APA style for markdown printing

24 delta.ind.t
Examples
#A recent study suggested that students (N = 100) learning#statistics improved their test scores with the use of#visual aids (Z = 2.5). The population standard deviation is 4.
#You can type in the numbers directly as shown below,#or refer to your dataset within the function.
d.z.z(z = 2.5, sig = 4, n = 100, a = .05)
d.z.z(z = 2.5, n = 100, a = .05)
d.z.z(2.5, 4, 100, .05)
delta.ind.t d-delta for Between Subjects with Control Group SD Denominator
Description
This function displays d-delta for between subjects data and the non-central confidence intervalusing the control group standard deviation as the denominator.
Usage
delta.ind.t(m1, m2, sd1, sd2, n1, n2, a = 0.05)
Arguments
m1 mean from control group
m2 mean from experimental group
sd1 standard deviation from control group
sd2 standard deviation from experimental group
n1 sample size from control group
n2 sample size from experimental group
a significance level
Details
To calculate d-delta, the mean of the experimental group is subtracted from the mean of the controlgroup, which is divided by the standard deviation of the control group.
d_delta = (m1 - m2) / sd1
Learn more on our example page.

delta.ind.t 25
Value
Provides the effect size (Cohen’s d) with associated confidence intervals, the t-statistic, the con-fidence intervals associated with the means of each group, as well as the standard deviations andstandard errors of the means for each group.
d d-delta effect size
dlow lower level confidence interval of d-delta value
dhigh upper level confidence interval of d-delta value
M1 mean of group one
sd1 standard deviation of group one mean
se1 standard error of group one mean
M1low lower level confidence interval of group one mean
M1high upper level confidence interval of group one mean
M2 mean of group two
sd2 standard deviation of group two mean
se2 standard error of group two mean
M2low lower level confidence interval of group two mean
M2high upper level confidence interval of group two mean
spooled pooled standard deviation
sepooled pooled standard error
n1 sample size of group one
n2 sample size of group two
df degrees of freedom (n1 - 1 + n2 - 1)
t t-statistic
p p-value
estimate the d statistic and confidence interval in APA style for markdown printing
statistic the t-statistic in APA style for markdown printing
Examples
#The following example is derived from the "indt_data" dataset, included#in the MOTE library.
#A forensic psychologist conducted a study to examine whether#being hypnotized during recall affects how well a witness#can remember facts about an event. Eight participants#watched a short film of a mock robbery, after which#each participant was questioned about what he or she had#seen. The four participants in the experimental group#were questioned while they were hypnotized. The four#participants in the control group recieved the same#questioning without hypnosis.

26 dept_data
hyp = t.test(correctq ~ group, data = indt_data)
#You can type in the numbers directly, or refer to the dataset,#as shown below.
delta.ind.t(m1 = 17.75, m2 = 23,sd1 = 3.30, sd2 = 2.16,n1 = 4, n2 = 4, a = .05)
delta.ind.t(17.75, 23, 3.30, 2.16, 4, 4, .05)
delta.ind.t(mean(indt_data$correctq[indt_data$group == 1]),mean(indt_data$correctq[indt_data$group == 2]),sd(indt_data$correctq[indt_data$group == 1]),sd(indt_data$correctq[indt_data$group == 2]),length(indt_data$correctq[indt_data$group == 1]),length(indt_data$correctq[indt_data$group == 2]),.05)
#Contrary to the hypothesized result, the group that underwent hypnosis were#significantly less accurate while reporting facts than the control group#with a large effect size, t(6) = -2.66, p = .038, d_delta = 1.59.
dept_data Dependent t Example Data
Description
Dataset for use in d.dep.t.diff, d.dep.t.diff.t, d.dep.t.avg, and d.dep.t.rm exploring thebefore and after effects of scifi movies on supernatural beliefs.
Usage
data(dept_data)
Format
A data frame of before and after scores for rating supernatural beliefs.
before: scores rated before watching a scifi movie after: scores rated after watching a scifi movie
References
Nolan and Heizen Statistics for the Behavioral Sciences (Book Link)

epsilon.full.SS 27
epsilon.full.SS Epsilon for ANOVA from F and Sum of Squares
Description
This function displays epsilon squared from ANOVA analyses and its non-central confidence inter-val based on the F distribution. This formula works for one way and multi way designs with carefulfocus on the sum of squares total calculation.
Usage
epsilon.full.SS(dfm, dfe, msm, mse, sst, a = 0.05)
Arguments
dfm degrees of freedom for the model/IV/between
dfe degrees of freedom for the error/residual/within
msm mean square for the model/IV/between
mse mean square for the error/residual/within
sst sum of squares total
a significance level
Details
To calculate epsilon, first, the mean square for the error is substracted from the mean square forthe model. The difference is multiplied by the degrees of freedom for the model. The product isdivided by the sum of squares total.
epsilon^2 = (dfm * (msm - mse)) / (sst)
Learn more on our example page.
Value
Provides the effect size (epsilon) with associated confidence intervals from the F-statistic.
epsilon effect size
epsilonlow lower level confidence interval of epsilon
epsilonhigh upper level confidence interval of epsilon
dfm degrees of freedom for the model/IV/between
dfe degrees of freedom for the error/residual/within
F F-statistic
p p-value
estimate the epsilon statistic and confidence interval in APA style for markdown printing
statistic the F-statistic in APA style for markdown printing

28 eta.F
Examples
#The following example is derived from the "bn1_data" dataset, included#in the MOTE library.
#A health psychologist recorded the number of close inter-personal#attachments of 45-year-olds who were in excellent, fair, or poor#health. People in the Excellent Health group had 4, 3, 2, and 3#close attachments; people in the Fair Health group had 3, 5,#and 8 close attachments; and people in the Poor Health group#had 3, 1, 0, and 2 close attachments.
anova_model = lm(formula = friends ~ group, data = bn1_data)summary.aov(anova_model)
epsilon.full.SS(dfm = 2, dfe = 8, msm = 12.621,mse = 2.458, sst = (25.24+19.67), a = .05)
eta.F Eta and Coefficient of Determination (R2) for ANOVA from F
Description
This function displays eta squared from ANOVA analyses and their non-central confidence intervalbased on the F distribution. These values are calculated directly from F statistics and can be usedfor between subjects and repeated measures designs. Remember if you have two or more IVs, thesevalues are partial eta squared.
Usage
eta.F(dfm, dfe, Fvalue, a = 0.05)
Arguments
dfm degrees of freedom for the model/IV/between
dfe degrees of freedom for the error/residual/within
Fvalue F statistic
a significance level
Details
Eta is calculated by multiplying the degrees of freedom of the model by the F-statistic. This isdivided by the product of degrees of freedom of the model, the F-statistic, and the degrees offreedom for the error or residual.
eta^2 = (dfm * Fvalue) / (dfm * Fvalue + dfe)
Learn more on our example page.

eta.full.SS 29
Value
Provides eta with associated confidence intervals and relevant statistics.
eta effect size
etalow lower level confidence interval of eta
etahigh upper level confidence interval of eta
dfm degrees of freedom for the model/IV/between
dfe degrees of freedom for the error/resisual/within
F F-statistic
p p-value
estimate the eta squared statistic and confidence interval in APA style for markdownprinting
statistic the F-statistic in APA style for markdown printing
Examples
#The following example is derived from the "bn1_data" dataset, included#in the MOTE library.
#A health psychologist recorded the number of close inter-personal#attachments of 45-year-olds who were in excellent, fair, or poor#health. People in the Excellent Health group had 4, 3, 2, and 3#close attachments; people in the Fair Health group had 3, 5,#and 8 close attachments; and people in the Poor Health group#had 3, 1, 0, and 2 close attachments.
anova_model = lm(formula = friends ~ group, data = bn1_data)summary.aov(anova_model)
eta.F(dfm = 2, dfe = 8,Fvalue = 5.134, a = .05)
eta.full.SS Eta for ANOVA from F and Sum of Squares
Description
This function displays eta squared from ANOVA analyses and its non-central confidence intervalbased on the F distribution. This formula works for one way and multi way designs with carefulfocus on the sum of squares total.
Usage
eta.full.SS(dfm, dfe, ssm, sst, Fvalue, a = 0.05)
30 eta.full.SS
Arguments
dfm degrees of freedom for the model/IV/betweendfe degrees of freedom for the error/residual/withinssm sum of squares for the model/IV/betweensst sum of squares totalFvalue F statistica significance level
Details
Eta squared is calculated by dividing the sum of squares for the model by the sum of squares total.
eta^2 = ssm / sst
Learn more on our example page.
Value
Provides eta with associated confidence intervals and relevant statistics.
eta effect sizeetalow lower level confidence interval of etaetahigh upper level confidence interval of etadfm degrees of freedom for the model/IV/betweendfe degrees of freedom for the error/resisual/withinF F-statisticp p-valueestimate the eta squared statistic and confidence interval in APA style for markdown
printingstatistic the F-statistic in APA style for markdown printing
Examples
#The following example is derived from the "bn1_data" dataset, included#in the MOTE library.
#A health psychologist recorded the number of close inter-personal#attachments of 45-year-olds who were in excellent, fair, or poor#health. People in the Excellent Health group had 4, 3, 2, and 3#close attachments; people in the Fair Health group had 3, 5,#and 8 close attachments; and people in the Poor Health group#had 3, 1, 0, and 2 close attachments.
anova_model = lm(formula = friends ~ group, data = bn1_data)summary.aov(anova_model)
eta.full.SS(dfm = 2, dfe = 8, ssm = 25.24,sst = (25.24+19.67), Fvalue = 5.134, a = .05)

eta.partial.SS 31
eta.partial.SS Partial Eta Squared for ANOVA from F and Sum of Squares
Description
This function displays partial eta squared from ANOVA analyses and its non-central confidenceinterval based on the F distribution. This formula works for one way and multi way designs.
Usage
eta.partial.SS(dfm, dfe, ssm, sse, Fvalue, a = 0.05)
Arguments
dfm degrees of freedom for the model/IV/between
dfe degrees of freedom for the error/residual/within
ssm sum of squares for the model/IV/between
sse sum of squares for the error/residual/within
Fvalue F statistic
a significance level
Details
Partial eta squared is calculated by dividing the sum of squares of the model by the sum of the sumof squares of the model and sum of squares of the error.
partial eta^2 = ssm / (ssm + sse)
Learn more on our example page.
Value
Provides partial eta squared with associated confidence intervals and relevant statistics.
eta partial eta squared effect size
etalow lower level confidence interval of partial eta squared
etahigh upper level confidence interval of partial eta squared
dfm degrees of freedom for the model/IV/between
dfe degrees of freedom for the error/resisual/within
F F-statistic
p p-value
estimate the eta squared statistic and confidence interval in APA style for markdownprinting
statistic the F-statistic in APA style for markdown printing
32 g.ind.t
Examples
#The following example is derived from the "bn2_data" dataset, included#in the MOTE library.
#Is there a difference in atheletic spending budget for different sports?#Does that spending interact with the change in coaching staff? This data includes#(fake) atheletic budgets for baseball, basketball, football, soccer, and volleyball teams#with new and old coaches to determine if there are differences in#spending across coaches and sports.
library(ez)bn2_data$partno = 1:nrow(bn2_data)anova_model = ezANOVA(data = bn2_data,
dv = money,wid = partno,between = .(coach, type),detailed = TRUE,type = 3)
#You would calculate one eta for each F-statistic.#Here's an example for the interaction with typing in numbers.eta.partial.SS(dfm = 4, dfe = 990,
ssm = 338057.9, sse = 32833499,Fvalue = 2.548, a = .05)
#Here's an example for the interaction with code.eta.partial.SS(dfm = anova_model$ANOVA$DFn[4],
dfe = anova_model$ANOVA$DFd[4],ssm = anova_model$ANOVA$SSn[4],sse = anova_model$ANOVA$SSd[4],Fvalue = anova_model$ANOVA$F[4],a = .05)
g.ind.t d-g Corrected for Independent t
Description
This function displays d-g corrected and the non-central confidence interval for independent t.
Usage
g.ind.t(m1, m2, sd1, sd2, n1, n2, a = 0.05)
Arguments
m1 mean group one
m2 mean group two

g.ind.t 33
sd1 standard deviation group onesd2 standard deviation group twon1 sample size group onen2 sample size group twoa significance level
Details
The correction is calculated by dividing three by the sum of both sample sizes after multiplying byfour and subtracting nine. This amount is deducted from one.
correction = 1 - (3 / (4 * (n1 + n2) - 9))
D-g corrected is calculated by substracting mean two from mean one, dividing by the pooled stan-dard deviation which is multiplied by the correction above.
d_g corrected = ((m1 - m2) / spooled) * correction
Learn more on our example page.
Value
D-g corrected with associated confidence intervals, the confidence intervals associated with themeans of each group, standard deviations of the means for each group, relevant statistics.
d d-g corrected effect sizedlow lower level confidence interval d-g correcteddhigh upper level confidence interval d-g correctedM1 mean group onesd1 standard deviation of group onese1 standard error of group oneM1low lower level confidence interval of mean oneM1high upper level confidence interval of mean oneM2 mean twosd2 standard deviation of mean twose1 standard error of mean twoM2low lower level confidence interval of mean twoM2high upper level confidence interval of mean twospooled pooled standard deviationsepooled pooled standard errorcorrection g correctedn1 size of sample onen2 size of sample twodf degrees of freedomt t-statisticp p-valueestimate the d statistic and confidence interval in APA style for markdown printingstatistic the t-statistic in APA style for markdown printing

34 ges.partial.SS.mix
Examples
#The following example is derived from the "indt_data" dataset, included#in the MOTE library.
#A forensic psychologist conducted a study to examine whether#being hypnotized during recall affects how well a witness#can remember facts about an event. Eight participants#watched a short film of a mock robbery, after which#each participant was questioned about what he or she had#seen. The four participants in the experimental group#were questioned while they were hypnotized. The four#participants in the control group recieved the same#questioning without hypnosis.
t.test(correctq ~ group, data = indt_data)
#You can type in the numbers directly, or refer to the dataset,#as shown below.
g.ind.t(m1 = 17.75, m2 = 23, sd1 = 3.30,sd2 = 2.16, n1 = 4, n2 = 4, a = .05)
g.ind.t(17.75, 23, 3.30, 2.16, 4, 4, .05)
g.ind.t(mean(indt_data$correctq[indt_data$group == 1]),mean(indt_data$correctq[indt_data$group == 2]),sd(indt_data$correctq[indt_data$group == 1]),sd(indt_data$correctq[indt_data$group == 2]),length(indt_data$correctq[indt_data$group == 1]),length(indt_data$correctq[indt_data$group == 2]),.05)
#Contrary to the hypothesized result, the group that underwent hypnosis were#significantly less accurate while reporting facts than the control group#with a large effect size, t(6) = -2.66, p = .038, d_g = 1.64.
ges.partial.SS.mix Partial Generalized Eta-Squared for Mixed Design ANOVA from F
Description
This function displays partial generalized eta-squared (GES) from ANOVA analyses and its non-central confidence interval based on the F distribution. This formula works for mixed designs.
Usage
ges.partial.SS.mix(dfm, dfe, ssm, sss, sse, Fvalue, a = 0.05)

ges.partial.SS.mix 35
Arguments
dfm degrees of freedom for the model/IV/between
dfe degrees of freedom for the error/residual/within
ssm sum of squares for the model/IV/between
sss sum of squares subject variance
sse sum of squares for the error/residual/within
Fvalue F statistic
a significance level
Details
To calculate partial generalized eta squared, first, the sum of squares of the model, sum of squaresof the subject variance, sum of squares for the subject variance, and the sum of squares for theerror/residual/within are added together. The sum of squares of the model is divided by this value.
partial ges = ssm / (ssm + sss + sse)
Learn more on our example page.
Value
Partial generalized eta-squared (GES) with associated confidence intervals and relevant statistics.
ges effect size
geslow lower level confidence interval for ges
geshigh upper level confidence interval for ges
dfm degrees of freedom for the model/IV/between
dfe degrees of freedom for the error/residual/within
F F-statistic
p p-value
estimate the generalized eta squared statistic and confidence interval in APA style formarkdown printing
statistic the F-statistic in APA style for markdown printing
Examples
#The following example is derived from the "mix2_data" dataset, included#in the MOTE library.
#Given previous research, we know that backward strength in free#association tends to increase the ratings participants give when#you ask them how many people out of 100 would say a word in#response to a target word (like Family Feud). This result is#tied to people’s overestimation of how well they think they know#something, which is bad for studying. So, we gave people instructions#on how to ignore the BSG. Did it help? Is there an interaction

36 ges.partial.SS.rm
#between BSG and instructions given?
library(ez)mix2_data$partno = 1:nrow(mix2_data)
library(reshape)long_mix = melt(mix2_data, id = c("partno", "group"))
anova_model = ezANOVA(data = long_mix,dv = value,wid = partno,between = group,within = variable,detailed = TRUE,type = 3)
#You would calculate one partial GES value for each F-statistic.#Here's an example for the interaction with typing in numbers.ges.partial.SS.mix(dfm = 1, dfe = 156,
ssm = 71.07608,sss = 30936.498,sse = 8657.094,Fvalue = 1.280784, a = .05)
#Here's an example for the interaction with code.ges.partial.SS.mix(dfm = anova_model$ANOVA$DFn[4],
dfe = anova_model$ANOVA$DFd[4],ssm = anova_model$ANOVA$SSn[4],sss = anova_model$ANOVA$SSd[1],sse = anova_model$ANOVA$SSd[4],Fvalue = anova_model$ANOVA$F[4],a = .05)
ges.partial.SS.rm Partial Generalized Eta-Squared for ANOVA from F
Description
This function displays partial ges squared from ANOVA analyses and its non-central confidenceinterval based on the F distribution. This formula works for multi-way repeated measures designs.
Usage
ges.partial.SS.rm(dfm, dfe, ssm, sss, sse1, sse2, sse3, Fvalue, a = 0.05)
Arguments
dfm degrees of freedom for the model/IV/between
dfe degrees of freedom for the error/residual/within
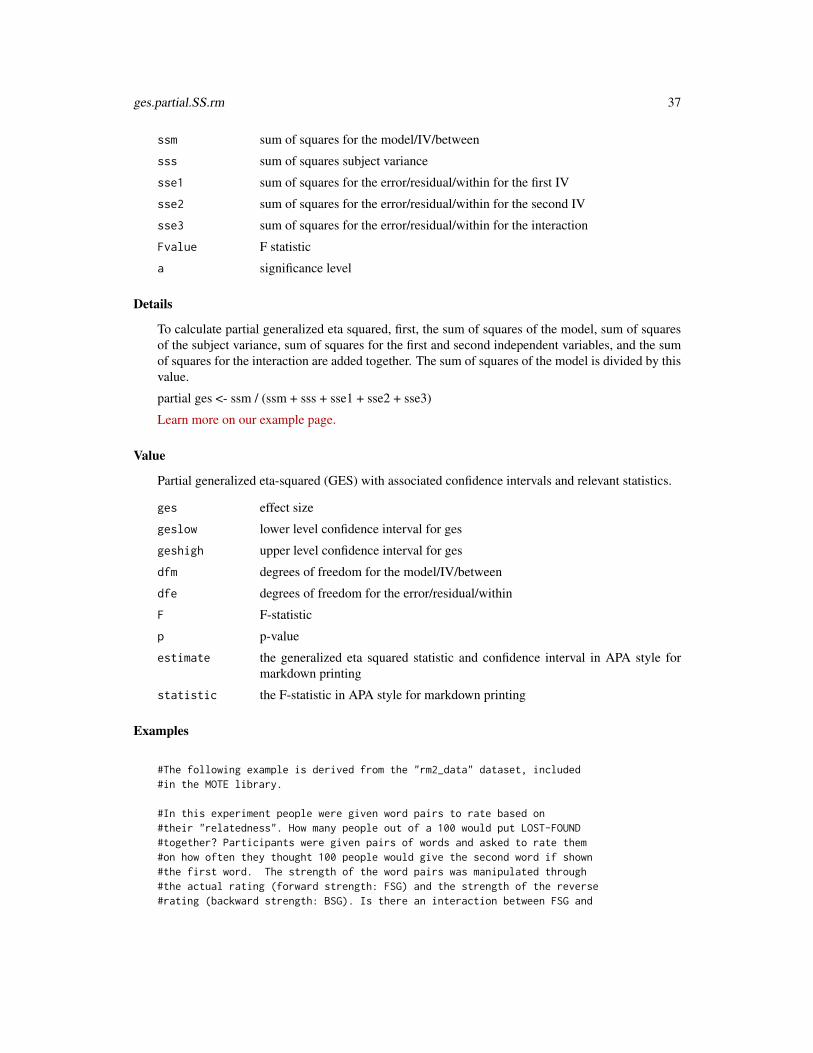
ges.partial.SS.rm 37
ssm sum of squares for the model/IV/between
sss sum of squares subject variance
sse1 sum of squares for the error/residual/within for the first IV
sse2 sum of squares for the error/residual/within for the second IV
sse3 sum of squares for the error/residual/within for the interaction
Fvalue F statistic
a significance level
Details
To calculate partial generalized eta squared, first, the sum of squares of the model, sum of squaresof the subject variance, sum of squares for the first and second independent variables, and the sumof squares for the interaction are added together. The sum of squares of the model is divided by thisvalue.
partial ges <- ssm / (ssm + sss + sse1 + sse2 + sse3)
Learn more on our example page.
Value
Partial generalized eta-squared (GES) with associated confidence intervals and relevant statistics.
ges effect size
geslow lower level confidence interval for ges
geshigh upper level confidence interval for ges
dfm degrees of freedom for the model/IV/between
dfe degrees of freedom for the error/residual/within
F F-statistic
p p-value
estimate the generalized eta squared statistic and confidence interval in APA style formarkdown printing
statistic the F-statistic in APA style for markdown printing
Examples
#The following example is derived from the "rm2_data" dataset, included#in the MOTE library.
#In this experiment people were given word pairs to rate based on#their "relatedness". How many people out of a 100 would put LOST-FOUND#together? Participants were given pairs of words and asked to rate them#on how often they thought 100 people would give the second word if shown#the first word. The strength of the word pairs was manipulated through#the actual rating (forward strength: FSG) and the strength of the reverse#rating (backward strength: BSG). Is there an interaction between FSG and

38 indt_data
#BSG when participants are estimating the relation between word pairs?
library(ez)library(reshape)long_mix = melt(rm2_data, id = c("subject", "group"))long_mix$FSG = c(rep("Low-FSG", nrow(rm2_data)),
rep("High-FSG", nrow(rm2_data)),rep("Low-FSG", nrow(rm2_data)),rep("High-FSG", nrow(rm2_data)))
long_mix$BSG = c(rep("Low-BSG", nrow(rm2_data)*2),rep("High-BSG", nrow(rm2_data)*2))
anova_model = ezANOVA(data = long_mix,dv = value,wid = subject,within = .(FSG, BSG),detailed = TRUE,type = 3)
#You would calculate one partial GES value for each F-statistic.#Here's an example for the interaction with typing in numbers.ges.partial.SS.rm(dfm = 1, dfe = 157,
ssm = 2442.948, sss = 76988.13,sse1 = 5402.567, sse2 = 8318.75, sse3 = 6074.417,Fvalue = 70.9927, a = .05)
#Here's an example for the interaction with code.ges.partial.SS.rm(dfm = anova_model$ANOVA$DFn[4],
dfe = anova_model$ANOVA$DFd[4],ssm = anova_model$ANOVA$SSn[4],sss = anova_model$ANOVA$SSd[1],sse1 = anova_model$ANOVA$SSd[4],sse2 = anova_model$ANOVA$SSd[2],sse3 = anova_model$ANOVA$SSd[3],Fvalue = anova_model$ANOVA$F[4],a = .05)
indt_data Independent t Example Data
Description
Dataset for use in d.ind.t, d.ind.t.t, delta.ind.t exploring the effects of hypnotism on theeffects of recall after witnessing a crime.
Usage
data(indt_data)

mix2_data 39
Format
A data frame including two groups, one recieving a hypnotism intervention, and one control group,to determine how hypnotism effects recall after witnessing a crime.
mix2_data Mixed Two-way ANOVA Example Data
Description
Dataset for use in ges.partial.SS.mix. Given previous research, we know that backward strengthin free association tends to increase the ratings participants give when you ask them how manypeople out of 100 would say a word in response to a target word (like Family Feud). This resultis tied to people’s overestimation of how well they think they know something, which is bad forstudying. So, we gave people instructions on how to ignore the BSG. Did it help? Is there aninteraction between BSG and instructions given?
Usage
data(mix2_data)
Format
A data frame including group type and backward strength rating.
group: Regular JAM Task or Debiasing JAM task bsglo: estimate of response to target word in aLow BSG condition bsghi: estimate of response to target word in a High BSG condition
odds Chi-Square Odds Ratios
Description
This function displays odds ratios and their normal confidence intervals.
Usage
odds(n11, n12, n21, n22, a = 0.05)
Arguments
n11 sample size for level 1.1
n12 sample size for level 1.2
n21 sample size for level 2.1
n22 sample size for level 2.2
a significance level

40 omega.F
Details
This statistic is the ratio between level 1.1 divided by level 1.2, and level 2.1 divided by 2.2. In otherwords, these are the odds of level 1.1 given level 1 overall versus level 2.1 given level 2 overall.
To calculate odds ratios, First, the sample size for level 1.1 is divided by the sample size for level1.2. This value is divided by the sample size for level 2.1, after dividing by the sample size of level2.2.
odds <- (n11 / n12) / (n21 / n22)
Learn more on our example page.
Value
Provides odds ratios with associated confidence intervals and relevant statistics.
odds odds statistic
olow lower level confidence interval of odds statistic
ohigh upper level confidence interval of odds statistic
se standard error
estimate the oods statistic and confidence interval in APA style for markdown printing
Examples
#A health psychologist was interested in the rates of anxiety in#first generation and regular college students. They polled campus#and found the following data:
#| | First Generation | Regular |#|--------------|------------------|---------|#| Low Anxiety | 10 | 50 |#| High Anxiety | 20 | 15 |
#What are the odds for the first generation students to have anxiety?
odds(n11 = 10, n12 = 50, n21 = 20, n22 = 15, a = .05)
omega.F Omega Squared for ANOVA from F
Description
This function displays omega squared from ANOVA analyses and its non-central confidence intervalbased on the F distribution. These values are calculated directly from F statistics and can be usedfor between subjects and repeated measures designs. Remember if you have two or more IVs, thesevalues are partial omega squared.

omega.F 41
Usage
omega.F(dfm, dfe, Fvalue, n, a = 0.05)
Arguments
dfm degrees of freedom for the model/IV/between
dfe degrees of freedom for the error/residual/within
Fvalue F statistic
n full sample size
a significance level
Details
Omega squared or partial omega squared is calculated by subtracting one from the F-statistic andmultiplying it by degrees of freedom of the model. This is divided by the same value after addingthe number of valid responses. This value will be omega squared for one-way ANOVA designs, andwill be partial omega squared for multi-way ANOVA designs (i.e. with more than one IV).
omega^2 = (dfm * (Fvalue-1)) / ((dfm * (Fvalue-1)) + n)
Learn more on our example page.
Value
The effect size (Cohen’s d) with associated confidence intervals and relevant statistics.
omega omega statistic
omegalow lower level confidence interval d value
omegahigh upper level confidence interval d value
dfm degrees of freedom for the model/IV/between
dfe degrees of freedom for the error/residual/within
F F-statistic
p p-value
estimate the omega squared statistic and confidence interval in APA style for markdownprinting
statistic the F-statistic in APA style for markdown printing
Examples
#The following example is derived from the "bn1_data" dataset, included#in the MOTE library.
#A health psychologist recorded the number of close inter-personal#attachments of 45-year-olds who were in excellent, fair, or poor#health. People in the Excellent Health group had 4, 3, 2, and 3#close attachments; people in the Fair Health group had 3, 5,

42 omega.full.SS
#and 8 close attachments; and people in the Poor Health group#had 3, 1, 0, and 2 close attachments.
anova_model = lm(formula = friends ~ group, data = bn1_data)summary.aov(anova_model)
omega.F(dfm = 2, dfe = 8,Fvalue = 5.134, n = 11, a = .05)
omega.full.SS Omega Squared for One-Way and Multi-Way ANOVA from F
Description
This function displays omega squared from ANOVA analyses and its non-central confidence intervalbased on the F distribution. This formula works for one way and multi way designs with carefulfocus on which error term you are using for the calculation.
Usage
omega.full.SS(dfm, dfe, msm, mse, sst, a = 0.05)
Arguments
dfm degrees of freedom for the model/IV/between
dfe degrees of freedom for the error/residual/within
msm mean square for the model/IV/between
mse mean square for the error/residual/within
sst sum of squares total
a significance level
Details
Omega squared is calculated by deducting the mean square of the error from the mean square of themodel and multiplying by the degrees of freedom for the model. This is divided by the sum of thesum of squares total and the mean square of the error.
omega = (dfm * (msm - mse)) / (sst + mse)
Learn more on our example page.
Value
Provides omega squared with associated confidence intervals and relevant statistics.
omega omega squared
omegalow lower level confidence interval of omega
omegahigh upper level confidence interval of omega

omega.gen.SS.rm 43
dfm degrees of freedom for the model/IV/between
dfe degrees of freedom for the error/resisual/within
F F-statistic
p p-value
estimate the omega squared statistic and confidence interval in APA style for markdownprinting
statistic the F-statistic in APA style for markdown printing
Examples
#The following example is derived from the "bn1_data" dataset, included#in the MOTE library.
#A health psychologist recorded the number of close inter-personal#attachments of 45-year-olds who were in excellent, fair, or poor#health. People in the Excellent Health group had 4, 3, 2, and 3#close attachments; people in the Fair Health group had 3, 5,#and 8 close attachments; and people in the Poor Health group#had 3, 1, 0, and 2 close attachments.
anova_model = lm(formula = friends ~ group, data = bn1_data)summary.aov(anova_model)
omega.full.SS(dfm = 2, dfe = 8,msm = 12.621, mse = 2.548,sst = (25.54+19.67), a = .05)
omega.gen.SS.rm Generalized Omega Squared for Multi-Way and Mixed ANOVA fromF
Description
This function displays generalized omega squared from ANOVA analyses and its non-central con-fidence interval based on the F distribution. This formula is appropriate for multi-way repeatedmeasures designs and mix level designs.
Usage
omega.gen.SS.rm(dfm, dfe, ssm, ssm2, sst, mss, j, Fvalue, a = 0.05)
Arguments
dfm degrees of freedom for the model/IV/between
dfe degrees of freedom for the error/residual/within
ssm sum of squares for the MAIN model/IV/between

44 omega.gen.SS.rm
ssm2 sum of squares for the OTHER model/IV/between
sst sum of squares total across the whole ANOVA
mss mean square for the subject variance
j number of levels in the OTHER IV
Fvalue F statistic from the output for your IV
a significance level
Details
Omega squared is calculated by subtracting the product of the degrees of freedom of the model andthe mean square of the subject variance from the sum of squares for the model.
This is divided by the value obtained after combining the sum of squares total, sum of squaresfor the other independent variable, and the mean square of the subject variance multiplied by thenumber of levels in the other model/IV/between.
generalized omega^2 = (ssm - (dfm * mss)) / (sst + ssm2 + j*mss)
Learn more on our example page.
Value
Provides omega squared with associated confidence intervals and relevant statistics.
omega omega squared
omegalow lower level confidence interval of omega
omegahigh upper level confidence interval of omega
dfm degrees of freedom for the model/IV/between
dfe degrees of freedom for the error/resisual/within
F F-statistic
p p-value
estimate the omega squared statistic and confidence interval in APA style for markdownprinting
statistic the F-statistic in APA style for markdown printing
Examples
#The following example is derived from the "mix2_data" dataset, included#in the MOTE library.
#Given previous research, we know that backward strength in free#association tends to increase the ratings participants give when#you ask them how many people out of 100 would say a word in#response to a target word (like Family Feud). This result is#tied to people’s overestimation of how well they think they know#something, which is bad for studying. So, we gave people instructions#on how to ignore the BSG. Did it help? Is there an interaction

omega.partial.SS.bn 45
#between BSG and instructions given?
library(ez)mix2_data$partno = 1:nrow(mix2_data)
library(reshape)long_mix = melt(mix2_data, id = c("partno", "group"))
anova_model = ezANOVA(data = long_mix,dv = value,wid = partno,between = group,within = variable,detailed = TRUE,type = 3)
#You would calculate one partial GOS value for each F-statistic.#Here's an example for the main effect 1 with typing in numbers.omega.gen.SS.rm(dfm = 1, dfe = 156,
ssm = 6842.46829,ssm2 = 14336.07886,sst = sum(c(30936.498, 6842.46829,14336.07886, 8657.094, 71.07608)),mss = 30936.498 / 156,j = 2, Fvalue = 34.503746, a = .05)
#Here's an example for the main effect 1 with code.omega.gen.SS.rm(dfm = anova_model$ANOVA$DFn[2],
dfe = anova_model$ANOVA$DFd[2],ssm = anova_model$ANOVA$SSn[2],ssm2 = anova_model$ANOVA$SSn[3],sst = sum(c(anova_model$ANOVA$SSn[-1], anova_model$ANOVA$SSd[c(1,3)])),mss = anova_model$ANOVA$SSd[1]/anova_model$ANOVA$DFd[1],j = anova_model$ANOVA$DFn[3]+1,Fvalue = anova_model$ANOVA$F[2], a = .05)
omega.partial.SS.bn Partial Omega Squared for Between Subjects ANOVA from F
Description
This function displays omega squared from ANOVA analyses and its non-central confidence intervalbased on the F distribution. This formula is appropriate for multi-way between subjects designs.
Usage
omega.partial.SS.bn(dfm, dfe, msm, mse, ssm, n, a = 0.05)

46 omega.partial.SS.bn
Arguments
dfm degrees of freedom for the model/IV/between
dfe degrees of freedom for the error/residual/within
msm mean square for the model/IV/between
mse mean square for the error/residual/within
ssm sum of squares for the model/IV/between
n total sample size
a significance level
Details
Partial omega squared is calculated by subtracting the mean square for the error from the meansquare of the model, which is multiplied by degrees of freedom of the model. This is divided by theproduct of the degrees of freedom for the model are deducted from the sample size, multiplied bythe mean square of the error, plus the sum of squares for the model.
omega^2 <- (dfm * (msm - mse)) / (ssm + (n-dfm)*mse)
Learn more on our example page.
Value
Provides omega squared with associated confidence intervals and relevant statistics.
omega omega squared
omegalow lower level confidence interval of omega
omegahigh upper level confidence interval of omega
dfm degrees of freedom for the model/IV/between
dfe degrees of freedom for the error/resisual/within
F F-statistic
p p-value
estimate the omega squared statistic and confidence interval in APA style for markdownprinting
statistic the F-statistic in APA style for markdown printing
Examples
#The following example is derived from the "bn2_data" dataset, included#in the MOTE library.
#Is there a difference in atheletic spending budget for different sports?#Does that spending interact with the change in coaching staff? This data includes#(fake) atheletic budgets for baseball, basketball, football, soccer, and volleyball teams#with new and old coaches to determine if there are differences in#spending across coaches and sports.

omega.partial.SS.rm 47
library(ez)bn2_data$partno = 1:nrow(bn2_data)anova_model = ezANOVA(data = bn2_data,
dv = money,wid = partno,between = .(coach, type),detailed = TRUE,type = 3)
#You would calculate one eta for each F-statistic.#Here's an example for the interaction with typing in numbers.omega.partial.SS.bn(dfm = 4, dfe = 990,
msm = 338057.9 / 4,mse = 32833499 / 990,ssm = 338057.9,n = 1000, a = .05)
#Here's an example for the interaction with code.omega.partial.SS.bn(dfm = anova_model$ANOVA$DFn[4],
dfe = anova_model$ANOVA$DFd[4],msm = anova_model$ANOVA$SSn[4] / anova_model$ANOVA$DFn[4],mse = anova_model$ANOVA$SSd[4] / anova_model$ANOVA$DFd[4],ssm = anova_model$ANOVA$SSn[4],n = nrow(bn2_data),a = .05)
omega.partial.SS.rm Partial Omega Squared for Repeated Measures ANOVA from F
Description
This function displays omega squared from ANOVA analyses and its non-central confidence intervalbased on the F distribution. This formula is appropriate for multi-way repeated measures designsand mix level designs.
Usage
omega.partial.SS.rm(dfm, dfe, msm, mse, mss, ssm, sse, sss, a = 0.05)
Arguments
dfm degrees of freedom for the model/IV/between
dfe degrees of freedom for the error/residual/within
msm mean square for the model/IV/between
mse mean square for the error/residual/within
mss mean square for the subject variance
ssm sum of squares for the model/IV/between

48 omega.partial.SS.rm
sse sum of squares for the error/residual/within
sss sum of squares for the subject variance
a significance level
Details
Partial omega squared is calculated by subtracting the mean square for the error from the meansquare of the model, which is multiplied by degrees of freedom of the model. This is divided bythe sum of the sum of squares for the model, sum of squares for the error, sum of squares for thesubject, and the mean square of the subject.
omega_p^2 = (dfm x (msm - mse)) / (ssm + sse + sss + mss)
The F-statistic is calculated by dividing the mean square of the model by the mean square of theerror.
F = msm / mse
Learn more on our example page.
Value
Provides omega squared with associated confidence intervals and relevant statistics.
omega omega squared
omegalow lower level confidence interval of omega
omegahigh upper level confidence interval of omega
dfm degrees of freedom for the model/IV/between
dfe degrees of freedom for the error/resisual/within
F F-statistic
p p-value
estimate the omega squared statistic and confidence interval in APA style for markdownprinting
statistic the F-statistic in APA style for markdown printing
Examples
#The following example is derived from the "rm2_data" dataset, included#in the MOTE library.
#In this experiment people were given word pairs to rate based on#their "relatedness". How many people out of a 100 would put LOST-FOUND#together? Participants were given pairs of words and asked to rate them#on how often they thought 100 people would give the second word if shown#the first word. The strength of the word pairs was manipulated through#the actual rating (forward strength: FSG) and the strength of the reverse#rating (backward strength: BSG). Is there an interaction between FSG and#BSG when participants are estimating the relation between word pairs?

r.correl 49
library(ez)library(reshape)long_mix = melt(rm2_data, id = c("subject", "group"))long_mix$FSG = c(rep("Low-FSG", nrow(rm2_data)),
rep("High-FSG", nrow(rm2_data)),rep("Low-FSG", nrow(rm2_data)),rep("High-FSG", nrow(rm2_data)))
long_mix$BSG = c(rep("Low-BSG", nrow(rm2_data)*2),rep("High-BSG", nrow(rm2_data)*2))
anova_model = ezANOVA(data = long_mix,dv = value,wid = subject,within = .(FSG, BSG),detailed = TRUE,type = 3)
#You would calculate one partial GOS value for each F-statistic.#You can leave out the MS options if you include all the SS options.#Here's an example for the interaction with typing in numbers.omega.partial.SS.rm(dfm = 1, dfe = 157,
msm = 2442.948 / 1,mse = 5402.567 / 157,mss = 76988.130 / 157,ssm = 2442.948, sss = 76988.13,sse = 5402.567, a = .05)
#Here's an example for the interaction with code.omega.partial.SS.rm(dfm = anova_model$ANOVA$DFn[4],
dfe = anova_model$ANOVA$DFd[4],msm = anova_model$ANOVA$SSn[4] / anova_model$ANOVA$DFn[4],mse = anova_model$ANOVA$SSd[4] / anova_model$ANOVA$DFd[4],mss = anova_model$ANOVA$SSd[1] / anova_model$ANOVA$DFd[1],ssm = anova_model$ANOVA$SSn[4],sse = anova_model$ANOVA$SSd[4],sss = anova_model$ANOVA$SSd[1],a = .05)
r.correl r to Coefficient of Determination (R2) from F
Description
This function displays transformation from r to r2 to calculate the non-central confidence intervalfor r2 using the F distribution.
Usage
r.correl(r, n, a = 0.05)

50 r.correl
Arguments
r correlation coefficient
n sample size
a significance level
Details
The t-statistic is calculated by first dividing one minus the square root of r squared by degrees offreedom of the error. r is divided by this value.
t = r / sqrt((1 - rsq) / (n - 2))
The F-statistic is the t-statistic squared.
Fvalue = t ^ 2
Learn more on our example page.
Value
Provides correlation coefficient and coefficient of determination with associated confidence inter-vals and relevant statistics.
r correlation coefficient
rlow lower level confidence interval r
rhigh upper level confidence interval r
R2 coefficient of determination
R2low lower level confidence interval of R2
R2high upper level confidence interval of R2
se standard error
n sample size
dfm degrees of freedom of mean
dfe degrees of freedom of error
t t-statistic
F F-statistic
p p-value
estimate the r statistic and confidence interval in APA style for markdown printing
estimateR2 the R^2 statistic and confidence interval in APA style for markdown printing
statistic the t-statistic in APA style for markdown printing

rm1_data 51
Examples
#This example is derived from the mtcars dataset provided in R.
#What is the correlation between miles per gallon and car weight?
cor.test(mtcars$mpg, mtcars$wt)
r.correl(r = -0.8676594, n = 32, a = .05)
rm1_data Repeated Measures Oneway ANOVA Example Data
Description
Dataset for use in omega.F. Participants were tested over several days to measure variations in theirpulse given different types of stimuli. One stimulus was a neutral picture (like a toaster), while otherstimuli were cute/happy pictures (puppies, babies), and negative stimuli (mutilated faces, picturesof war). Were there differences in pulse for each participant across the stimuli?
Usage
data(rm1_data)
Format
A data frame including ratings toward pictures.
neutral: pulse during exposure to neutral stimuli positive: pulse during exposure to positive stimulinegative: pulse during exposure to negative stimuli
rm2_data Repeated Measures Two-way ANOVA Example Data
Description
Dataset for use in omega.partial.SS.rm and other repeated measures ANOVA designs. Thisdataset includes a group variable used for mixed repeated measures designs, a subject number,and two repeated measures variables. These variables include FSG (forward strength) which is ameasure of the relation between two words like cheddar to cheese. The second variable is BSG(backward strength), which is the opposite relation (cheese to cheddar). Participants rated thoseword pairs in and the strength of FSG and BSG was manipulated to measure overestimation ofstrength.
Usage
data(rm2_data)

52 v.chi.sq
Format
A data frame of ratings of word pair relation
group: A between-subjects variable indicating the type of instructions subject: A subject numberfsglobsglo: A repeated measures condition of low FSG-BSG fsghihbsglo: A repeated measurescondition of high FSG, low BSG fsglobsghi: A repeated measures condition of low FSG, high BSGfsghibsghi: A repeated measures condition of high FSG-BSG
singt_data Single Sample t Example Data
Description
A simulated dataset for use in d.single.t and d.single.t.t, including gifted/honors student SATscores from a specific school to use for comparison with the national average SAT score (1080) ofgifted/honors students nationwide.
Usage
data(singt_data)
Format
A data frame including a single sample consisting of SAT scores of students from a gifted/honorsprogram at a specific school.
v.chi.sq V for Chi-Square
Description
This function displays V and non-central confidence interval for the specified chi-square statistic.
Usage
v.chi.sq(x2, n, r, c, a = 0.05)
Arguments
x2 chi-square statistic
n sample size
r number of rows in the contingency table
c number of columns in the contingency table
a significance level
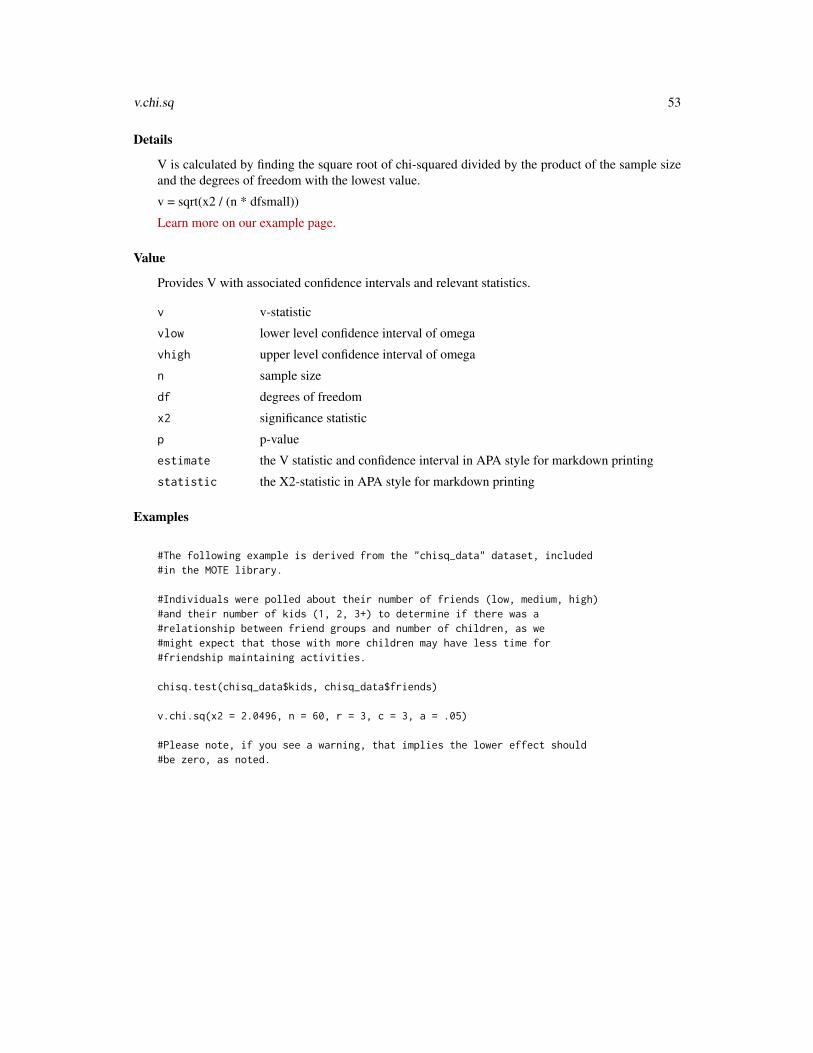
v.chi.sq 53
Details
V is calculated by finding the square root of chi-squared divided by the product of the sample sizeand the degrees of freedom with the lowest value.
v = sqrt(x2 / (n * dfsmall))
Learn more on our example page.
Value
Provides V with associated confidence intervals and relevant statistics.
v v-statistic
vlow lower level confidence interval of omega
vhigh upper level confidence interval of omega
n sample size
df degrees of freedom
x2 significance statistic
p p-value
estimate the V statistic and confidence interval in APA style for markdown printing
statistic the X2-statistic in APA style for markdown printing
Examples
#The following example is derived from the "chisq_data" dataset, included#in the MOTE library.
#Individuals were polled about their number of friends (low, medium, high)#and their number of kids (1, 2, 3+) to determine if there was a#relationship between friend groups and number of children, as we#might expect that those with more children may have less time for#friendship maintaining activities.
chisq.test(chisq_data$kids, chisq_data$friends)
v.chi.sq(x2 = 2.0496, n = 60, r = 3, c = 3, a = .05)
#Please note, if you see a warning, that implies the lower effect should#be zero, as noted.

Index
∗Topic ANOVAepsilon.full.SS, 27eta.F, 28eta.full.SS, 29eta.partial.SS, 31ges.partial.SS.mix, 34ges.partial.SS.rm, 36omega.F, 40omega.full.SS, 42omega.gen.SS.rm, 43omega.partial.SS.bn, 45omega.partial.SS.rm, 47
∗Topic APA,apa, 3
∗Topic average,d.dep.t.avg, 5
∗Topic between-subjects,d.ind.t, 11
∗Topic chi-squarev.chi.sq, 52
∗Topic cohen’sd.dep.t.avg, 5d.dep.t.rm, 9
∗Topic correctiong.ind.t, 32
∗Topic correlationd.dep.t.rm, 9d.to.r, 19r.correl, 49
∗Topic d,d.dep.t.avg, 5d.dep.t.rm, 9
∗Topic datasetsbn1_data, 3bn2_data, 4chisq_data, 4dept_data, 26indt_data, 38mix2_data, 39
rm1_data, 51rm2_data, 51singt_data, 52
∗Topic decimals,apa, 3
∗Topic delta,delta.ind.t, 24
∗Topic dependentd.dep.t.avg, 5d.dep.t.diff, 6d.dep.t.diff.t, 8d.dep.t.rm, 9
∗Topic deviation,d.ind.t, 11
∗Topic dd.dep.t.avg, 5
∗Topic effectd.dep.t.avg, 5d.dep.t.diff, 6d.dep.t.diff.t, 8d.dep.t.rm, 9d.ind.t, 11d.ind.t.t, 13d.prop, 15d.single.t, 16d.single.t.t, 18d.to.r, 19d.z.mean, 21d.z.z, 23delta.ind.t, 24epsilon.full.SS, 27eta.F, 28eta.full.SS, 29eta.partial.SS, 31g.ind.t, 32ges.partial.SS.mix, 34ges.partial.SS.rm, 36odds, 39omega.F, 40
54

INDEX 55
omega.full.SS, 42omega.gen.SS.rm, 43omega.partial.SS.bn, 45omega.partial.SS.rm, 47r.correl, 49v.chi.sq, 52
∗Topic epsilon,epsilon.full.SS, 27
∗Topic eta,eta.F, 28eta.full.SS, 29eta.partial.SS, 31
∗Topic formattingapa, 3
∗Topic ges,ges.partial.SS.mix, 34ges.partial.SS.rm, 36
∗Topic independentd.ind.t, 11d.ind.t.t, 13d.prop, 15delta.ind.t, 24g.ind.t, 32
∗Topic mean,d.single.t, 16
∗Topic meand.single.t, 16
∗Topic measures,d.dep.t.diff.t, 8d.dep.t.rm, 9
∗Topic measuresd.dep.t.avg, 5
∗Topic mu,d.single.t, 16
∗Topic oddsodds, 39
∗Topic omega,omega.F, 40omega.full.SS, 42omega.gen.SS.rm, 43omega.partial.SS.bn, 45omega.partial.SS.rm, 47
∗Topic paired-sample,d.dep.t.avg, 5d.dep.t.rm, 9
∗Topic pairedd.dep.t.diff.t, 8
∗Topic pooled
d.ind.t, 11∗Topic population
d.single.t, 16∗Topic proportions,
d.prop, 15∗Topic proportions
d.prop, 15∗Topic prop
d.prop, 15∗Topic ratios
odds, 39∗Topic repeated
d.dep.t.avg, 5d.dep.t.diff.t, 8d.dep.t.rm, 9
∗Topic sample,d.dep.t.diff.t, 8
∗Topic sampled.single.t, 16
∗Topic sdd.ind.t, 11
∗Topic single-sample,d.single.t, 16
∗Topic singled.single.t, 16d.single.t.t, 18
∗Topic size,d.dep.t.avg, 5d.dep.t.diff, 6d.dep.t.diff.t, 8d.dep.t.rm, 9d.ind.t, 11d.ind.t.t, 13d.prop, 15d.single.t, 16d.single.t.t, 18d.to.r, 19d.z.mean, 21d.z.z, 23delta.ind.t, 24epsilon.full.SS, 27eta.F, 28eta.full.SS, 29eta.partial.SS, 31g.ind.t, 32ges.partial.SS.mix, 34ges.partial.SS.rm, 36odds, 39

56 INDEX
omega.F, 40omega.full.SS, 42omega.gen.SS.rm, 43omega.partial.SS.bn, 45omega.partial.SS.rm, 47r.correl, 49v.chi.sq, 52
∗Topic standardd.ind.t, 11
∗Topic t,d.ind.t, 11d.single.t, 16g.ind.t, 32
∗Topic t-test,d.dep.t.avg, 5d.dep.t.diff.t, 8d.dep.t.rm, 9
∗Topic t-testd.dep.t.diff, 6d.dep.t.diff.t, 8
∗Topic test,d.prop, 15
∗Topic td.ind.t.t, 13d.single.t.t, 18delta.ind.t, 24
∗Topic u,d.single.t, 16
∗Topic z-testd.z.mean, 21d.z.z, 23
apa, 3
bn1_data, 3bn2_data, 4
chisq_data, 4
d.dep.t.avg, 5, 26d.dep.t.diff, 6, 26d.dep.t.diff.t, 8, 26d.dep.t.rm, 9, 26d.ind.t, 11, 38d.ind.t.t, 13, 38d.prop, 15d.single.t, 16, 52d.single.t.t, 18, 52d.to.r, 19
d.z.mean, 21d.z.z, 23delta.ind.t, 24, 38dept_data, 26
epsilon.full.SS, 3, 27eta.F, 3, 28eta.full.SS, 3, 29eta.partial.SS, 4, 31
g.ind.t, 32ges.partial.SS.mix, 34, 39ges.partial.SS.rm, 36
indt_data, 38
mix2_data, 39
odds, 39omega.F, 3, 40, 51omega.full.SS, 3, 42omega.gen.SS.rm, 43omega.partial.SS.bn, 4, 45omega.partial.SS.rm, 47, 51
r.correl, 49rm1_data, 51rm2_data, 51
singt_data, 52
v.chi.sq, 4, 52