Embed Size (px)
Citation preview
Pacific Northwest Salmon Habitat IndicatorsPilot Project
Snohomish River Basin
January 1999Publication No. 99-301
The Department of Ecology is an equal opportunity agencyand does not discriminate on the basis of race, creed,
color, disability, age, religion, national origin,sex, marital status, disabled veteran's status,
Vietnam Era veteran's status, or sexual orientation.
If you have special accommodation needsor require this document in alternative format,
please contact theEnvironmental Assessment Program,
Shirley Rollins at (360) 407-6696 (voice).Ecology’s telecommunications device for the deaf
(TDD) number is (360) 407-6006.
For additional copies of this publication,please contact:
Department of EcologyPublications Distribution Office
PO Box 47600Olympia, WA 98504-7600
(360) 407-7472
Refer to Publication No. 99-301
Pacific Northwest Salmon Habitat Indicators
Pilot ProjectSnohomish River Basin
byWilliam J. Ward
Washington State Department of EcologyEnvironmental Assessment Program
Watershed Ecology SectionPO Box 47600
Olympia, WA 98504-7600
Water Body Nos. 07-1010 through 07-2000
January 1999Publication No. 99-301
Pacific NW Salmon Habitat Indicators Page i
Abstract.......................................................................................................................... iiiAcknowledgments ........................................................................................................... vIntroduction .................................................................................................................... 1Methods .......................................................................................................................... 3Results and Discussion .................................................................................................... 5
Fish Abundance ......................................................................................................... 6Water Quantity .......................................................................................................... 8Water Quality .......................................................................................................... 14Land Use/Land Cover.............................................................................................. 22Physical Habitat ....................................................................................................... 28Combined Indicators................................................................................................ 34Combined Indicators................................................................................................ 36
Conclusions................................................................................................................... 39Recommendations ......................................................................................................... 39References..................................................................................................................... 41
Pacific NW Salmon Habitat Indicators Page iii
AbstractRepresentatives from Northwest environmental management agencies recommended15 salmon habitat indicators be used to evaluate Northwest streams. The Washington StateDepartment of Ecology tested these indicators during a three-month study using existing datafrom the Snohomish River Basin near Seattle. The results of this study show that many ofthe indicators can be useful tools in evaluating Northwest streams. However, there were anumber of challenges which prevented or hindered the analyses. These challenges includeddata availability, documentation, and formats. Recommendations for data standards areprovided to promote information sharing among groups monitoring salmon habitat.
Pacific NW Salmon Habitat Indicators Page v
AcknowledgmentsWe wish to thank the following for their help on the project.
• Mike Woodall, Joy Denkers, John Tooley, Dan Saul, and Carlie Reese of the EcologyGeographic Information System (GIS) Technical Services Group for their assistance inusing GIS to show indicator results.
• Greg Pelletier of the Ecology Environmental Assessment Program for his help inobtaining and evaluating USGS flow records.
• Kathy Thornburg of Snohomish County, Kurt Nelson of Tulalip Tribe, and CatieMains of the Washington Department of Fish and Wildlife for their efforts inobtaining data from previous water quality studies.
• Will Kendra, Lynn Singleton, Joy Denkers, and Glenn Merritt of Ecology forreviewing this study and providing valuable comments and suggestions.
• Randy McIntosh and the Northwest Indian Fisheries Commission for providingaccess to the Salmon and Steelhead Habitat Inventory Assessment Project (SSHIAP)database.
• Lynn Singleton and the Ecology Information Integration Project for providing fundingto assist with development of the indicators.
• Shirley Rollins for formatting the final report.
Pacific NW Salmon Habitat Indicators Page 1
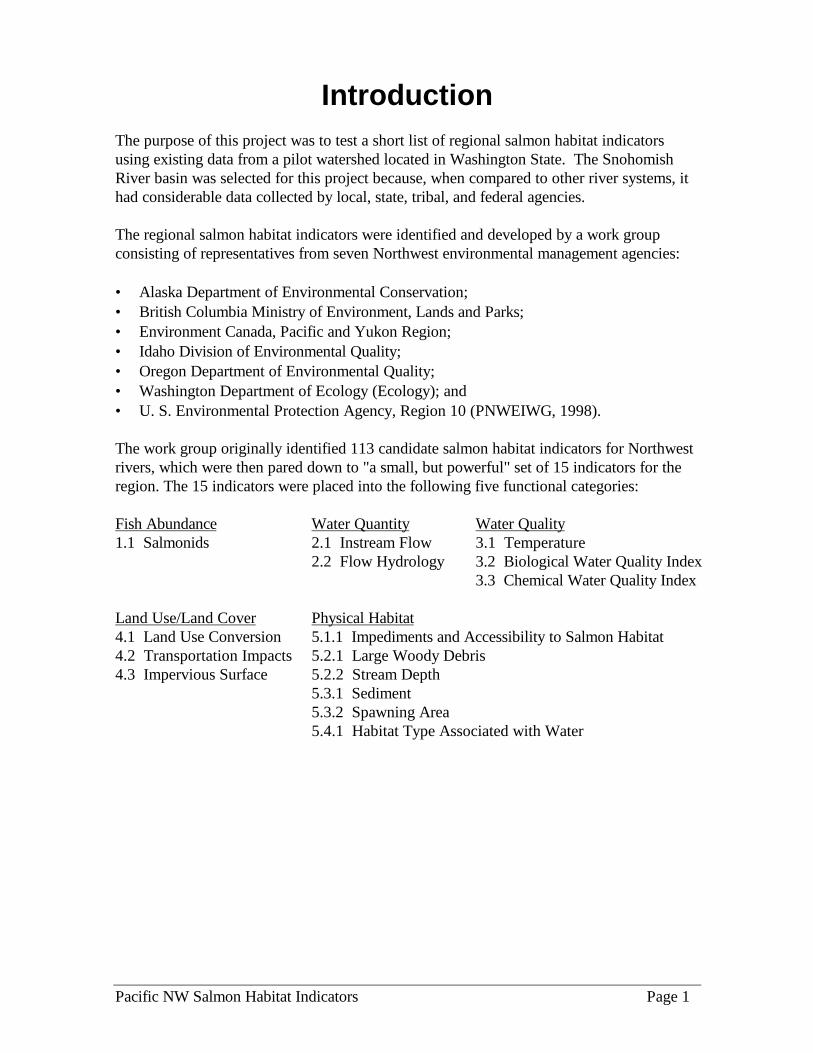
IntroductionThe purpose of this project was to test a short list of regional salmon habitat indicatorsusing existing data from a pilot watershed located in Washington State. The SnohomishRiver basin was selected for this project because, when compared to other river systems, ithad considerable data collected by local, state, tribal, and federal agencies.
The regional salmon habitat indicators were identified and developed by a work groupconsisting of representatives from seven Northwest environmental management agencies:
• Alaska Department of Environmental Conservation;• British Columbia Ministry of Environment, Lands and Parks;• Environment Canada, Pacific and Yukon Region;• Idaho Division of Environmental Quality;• Oregon Department of Environmental Quality;• Washington Department of Ecology (Ecology); and• U. S. Environmental Protection Agency, Region 10 (PNWEIWG, 1998).
The work group originally identified 113 candidate salmon habitat indicators for Northwestrivers, which were then pared down to "a small, but powerful" set of 15 indicators for theregion. The 15 indicators were placed into the following five functional categories:
Fish Abundance Water Quantity Water Quality1.1 Salmonids 2.1 Instream Flow 3.1 Temperature
2.2 Flow Hydrology 3.2 Biological Water Quality Index3.3 Chemical Water Quality Index
Land Use/Land Cover Physical Habitat4.1 Land Use Conversion 5.1.1 Impediments and Accessibility to Salmon Habitat4.2 Transportation Impacts 5.2.1 Large Woody Debris4.3 Impervious Surface 5.2.2 Stream Depth
5.3.1 Sediment5.3.2 Spawning Area5.4.1 Habitat Type Associated with Water
Pacific NW Salmon Habitat Indicators Page 3
MethodsSeveral federal, state, local and tribal sources of indicator data were identified. The mostsignificant source of indicator data was the Ecology GIS spatial database, which containedland use/land cover, transportation, hydrography, and salmon spawner information fromseveral state and federal agencies. Other significant data sources included the United StatesGeological Survey (USGS) stream flow database, the Ecology Ambient Monitoring Sectiondatabase on streams, the Ecology Watershed Assessment Section water quality studies,Snohomish County water quality studies, Tulalip Tribe water quality studies, andWashington Department of Fish and Wildlife (WDFW) ambient water temperature data.Some indicator data were also available from the Northwest Indian Fisheries Commission –Salmon and Steelhead Habitat Inventory and Assessment Project (SSHIAP).
Collected data were analyzed to determine their potential usefulness in addressing a specificindicator or a combination of indicators. This analysis included an evaluation of where andwhen the data were collected, the types of data collection and characterization methods, andwhether the data were available in an electronic form for analysis. The analysis alsoincluded the development of figures, tables, and maps generated from GIS software.
Arlington
Marysville
Lake Stevens
Snohomish
Monroe SultanGold Bar
Index
Duvall
Skykomish
Carnation
Snoqualmie
North Bend
Everett
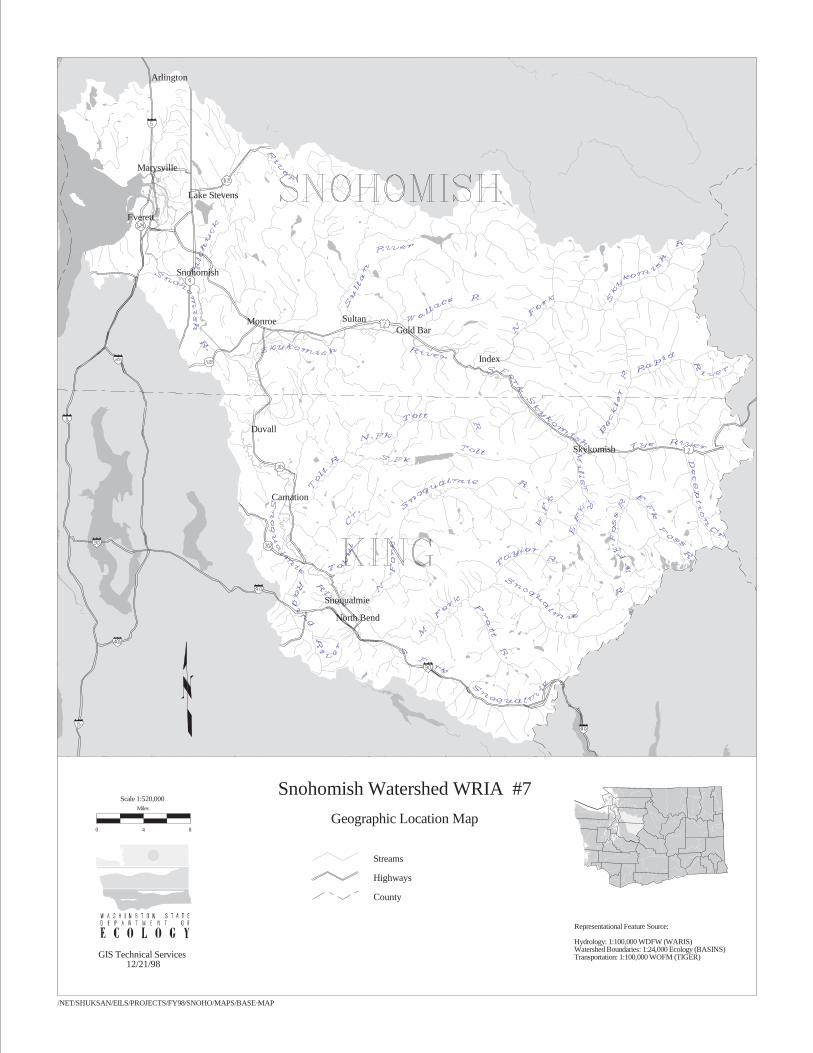
Snohomish Watershed WRIA #7
GIS Technical Services12/21/98
Geographic Location Map
Streams
Highways
County
Representational Feature Source:
Hydrology: 1:100,000 WDFW (WARIS)Watershed Boundaries: 1:24,000 Ecology (BASINS)Transportation: 1:100,000 WOFM (TIGER)
/NET/SHUKSAN/EILS/PROJECTS/FY98/SNOHO/MAPS/BASE−MAP
0 4 8
Miles
Scale 1:520,000
Pacific NW Salmon Habitat Indicators Page 5
Results and DiscussionThis section provides a brief description of the information available on each indicator,followed by either a figure showing the indicator on a basin map, or by tables or graphsshowing indicator data. In some cases indicators could not be developed due to dataavailability or data comparability issues. At the end of this section, several indicators arecombined on basin maps to explore potential relationships among them.
Page 6 Pacific NW Salmon Habitat Indicators
Fish Abundance
1.1 Salmonids
change in # of fish by life stage, by species
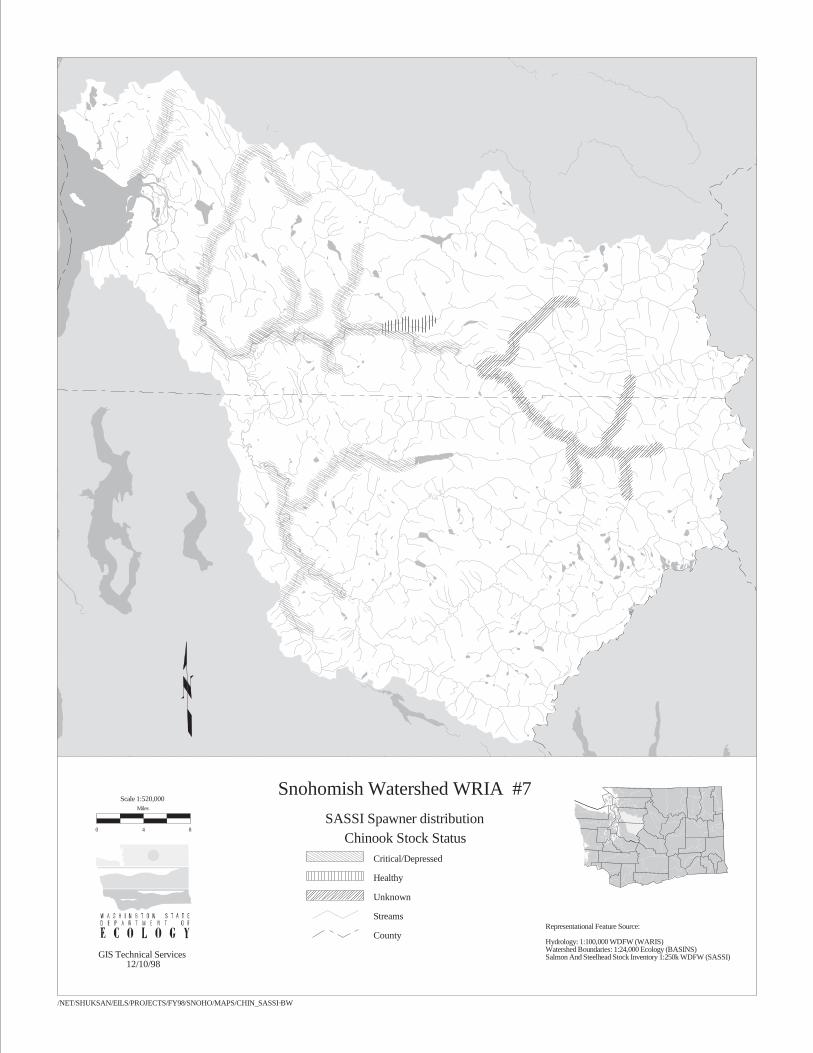
The Salmon and Steelhead Stock Inventory (SASSI) database maintained by theWashington Department of Fish and Wildlife (WDFW) was identified as the most usefulinformation source for characterizing this indicator. The focus of the database is tocharacterize naturally spawning anadromous salmon stock trends (chinook, chum, coho,pink, sockeye, and steelhead). The SASSI data were last summarized into a statewidereport in 1993 (WDF et al., 1993).
The SASSI spawner distribution GIS coverage for all chinook stocks was depicted on theSnohomish River Basin map (facing page). The data includes critical/depressed, healthy,and unknown stock status categories. The indicator depicts the potential range for naturallyspawning chinook salmon stocks in the Snohomish River Basin and also shows areas withinthe range where the chinook stocks are in trouble. This analyses has the potential tocharacterize trends in the status of salmon stocks in the basin when compared to futureSASSI statewide reports.
Snohomish Watershed WRIA #7
GIS Technical Services12/10/98
SASSI Spawner distributionChinook Stock Status
Critical/Depressed
Healthy
Unknown
Streams
CountyRepresentational Feature Source:
Hydrology: 1:100,000 WDFW (WARIS)Watershed Boundaries: 1:24,000 Ecology (BASINS)Salmon And Steelhead Stock Inventory 1:250k WDFW (SASSI)
/NET/SHUKSAN/EILS/PROJECTS/FY98/SNOHO/MAPS/CHIN_SASSI−BW
0 4 8
Miles
Scale 1:520,000
Page 8 Pacific NW Salmon Habitat Indicators
Water Quantity
2.1 Instream Flow
% of stream miles with instream flow meeting instream water rights, seasonal flowrequirements for salmonids, and/or sufficient to allow salmon access
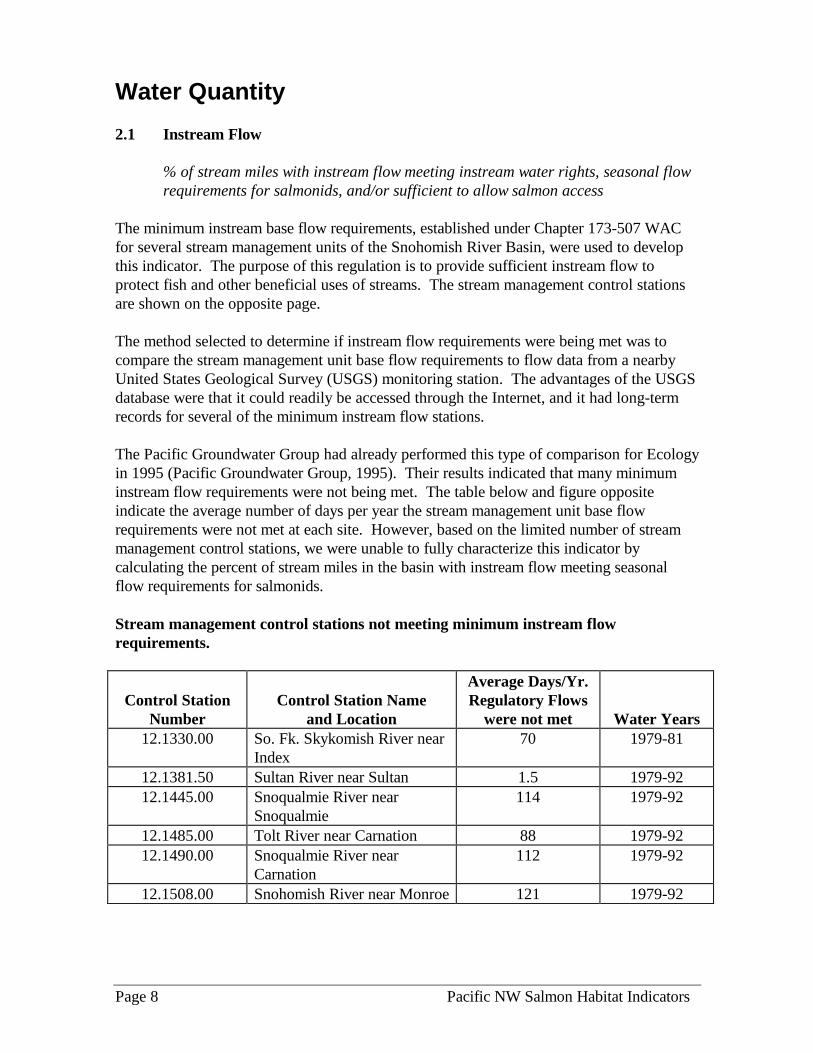
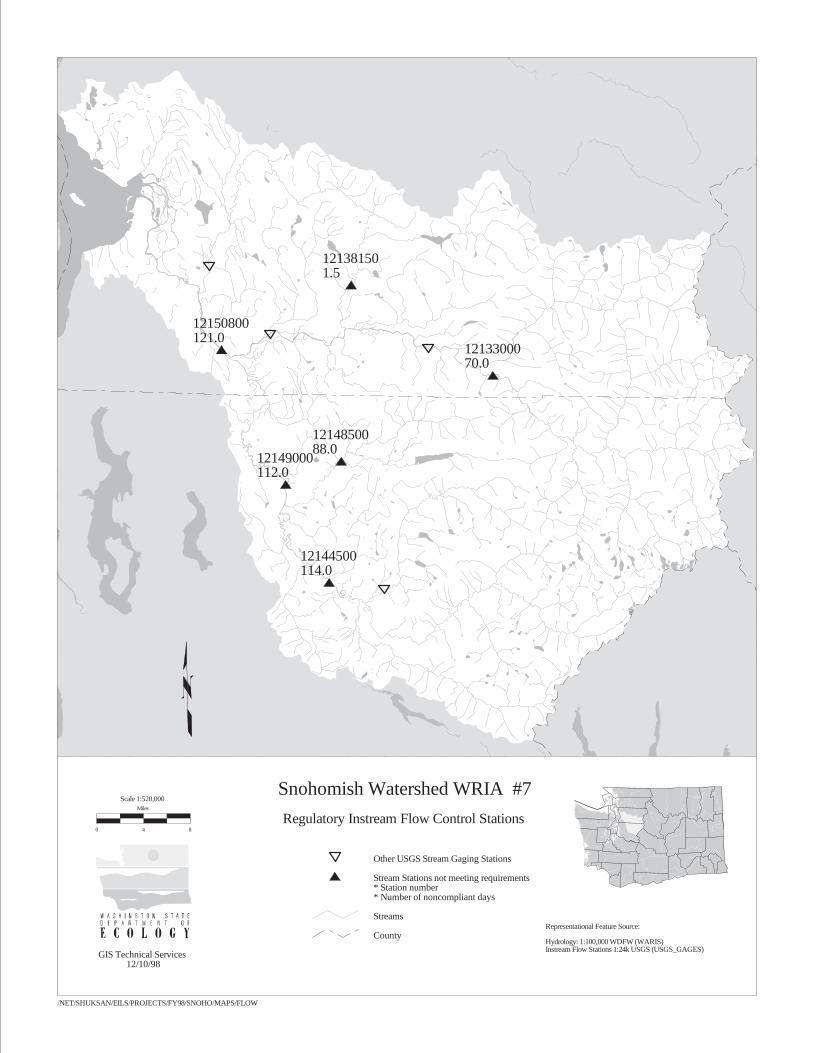
The minimum instream base flow requirements, established under Chapter 173-507 WACfor several stream management units of the Snohomish River Basin, were used to developthis indicator. The purpose of this regulation is to provide sufficient instream flow toprotect fish and other beneficial uses of streams. The stream management control stationsare shown on the opposite page.
The method selected to determine if instream flow requirements were being met was tocompare the stream management unit base flow requirements to flow data from a nearbyUnited States Geological Survey (USGS) monitoring station. The advantages of the USGSdatabase were that it could readily be accessed through the Internet, and it had long-termrecords for several of the minimum instream flow stations.
The Pacific Groundwater Group had already performed this type of comparison for Ecologyin 1995 (Pacific Groundwater Group, 1995). Their results indicated that many minimuminstream flow requirements were not being met. The table below and figure oppositeindicate the average number of days per year the stream management unit base flowrequirements were not met at each site. However, based on the limited number of streammanagement control stations, we were unable to fully characterize this indicator bycalculating the percent of stream miles in the basin with instream flow meeting seasonalflow requirements for salmonids.
Stream management control stations not meeting minimum instream flowrequirements.
Control StationNumber
Control Station Nameand Location
Average Days/Yr.Regulatory Flows
were not met Water Years12.1330.00 So. Fk. Skykomish River near
Index70 1979-81
12.1381.50 Sultan River near Sultan 1.5 1979-9212.1445.00 Snoqualmie River near
Snoqualmie114 1979-92
12.1485.00 Tolt River near Carnation 88 1979-9212.1490.00 Snoqualmie River near
Carnation112 1979-92
12.1508.00 Snohomish River near Monroe 121 1979-92
1213300070.0
121381501.5
1214850088.0
12144500114.0
12149000112.0
12150800121.0
Snohomish Watershed WRIA #7
GIS Technical Services12/10/98
Regulatory Instream Flow Control Stations
Other USGS Stream Gaging Stations
Stream Stations not meeting requirements* Station number* Number of noncompliant days
Streams
CountyRepresentational Feature Source:
Hydrology: 1:100,000 WDFW (WARIS)Instream Flow Stations 1:24k USGS (USGS_GAGES)
/NET/SHUKSAN/EILS/PROJECTS/FY98/SNOHO/MAPS/FLOW
0 4 8
Miles
Scale 1:520,000
Page 10 Pacific NW Salmon Habitat Indicators
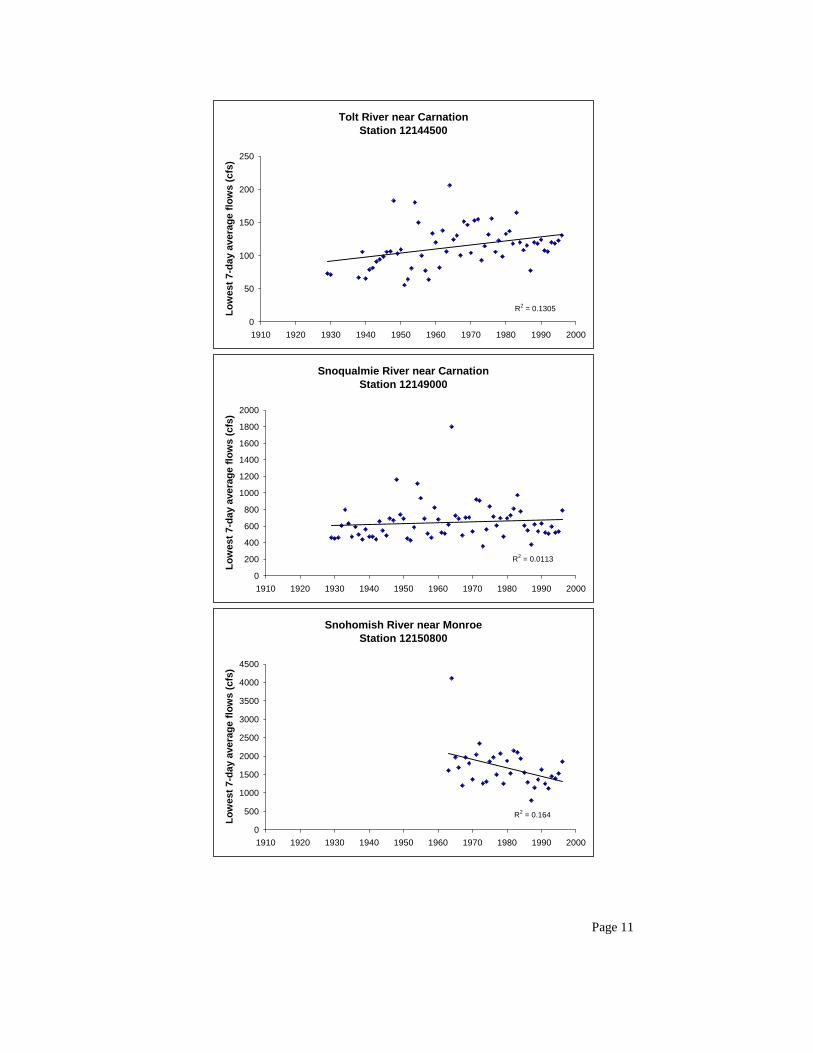
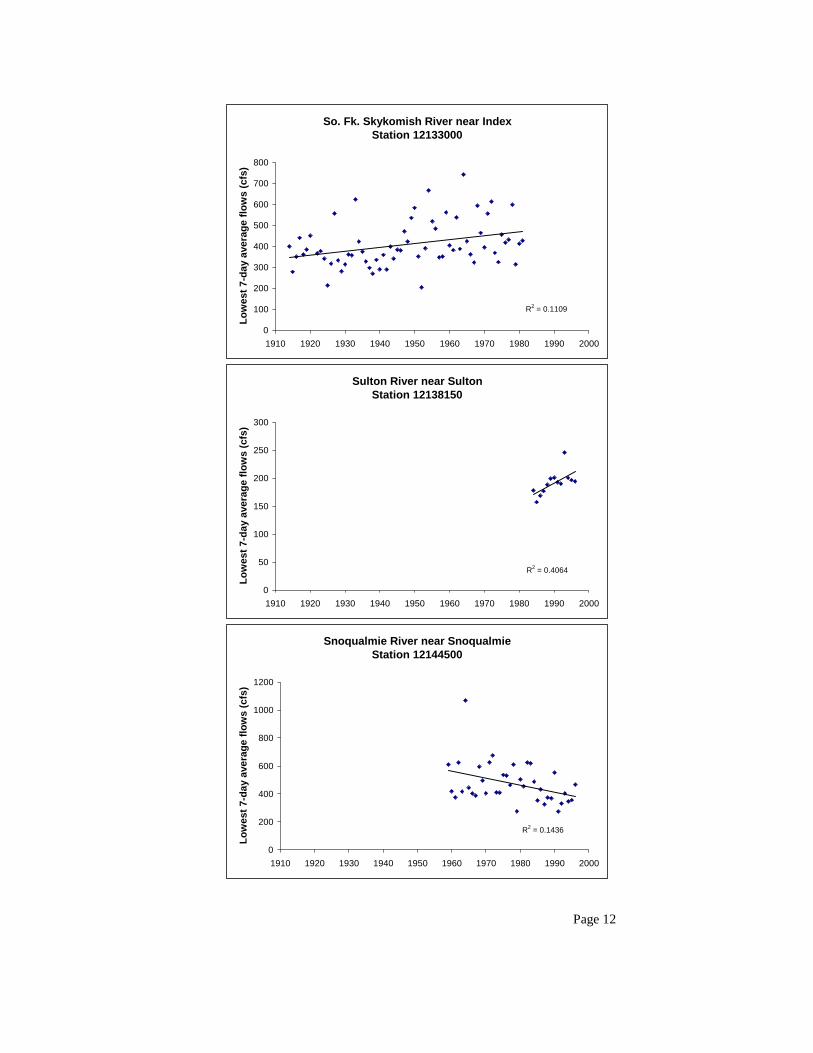
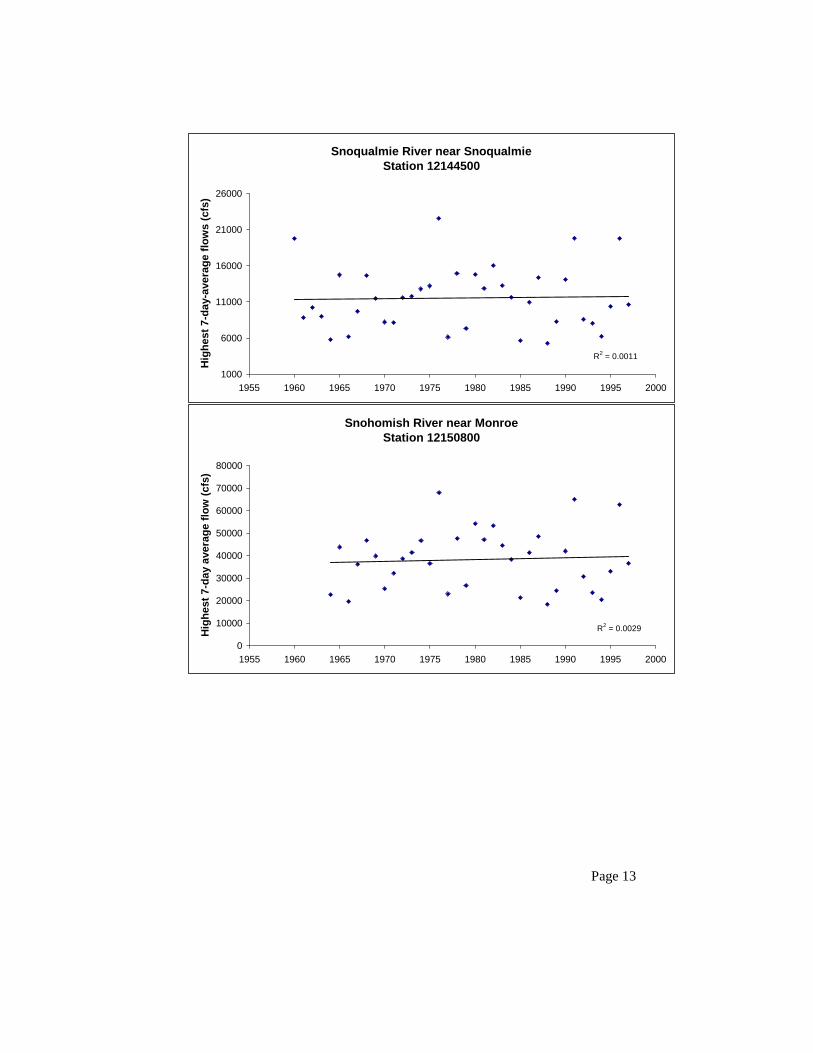
2.2 Flow Hydrology
% of waterbodies with minimal, moderate, extreme changes in hydrology fromhistorical patterns (captures low and high flow extremes–deviation)
The USGS flow monitoring database was used to determine if a pattern of extremehydrological changes might be occurring in the Snohomish River Basin. The data wereanalyzed to identify annual average seven-day low and high flows. The results of thisanalysis were plotted as trend graphs, which follow. In some instances there is evidence ofan increasing or decreasing flow trend, but further analysis would be needed to determine ifthese were related to climatic factors, land cover changes, trends in consumptive water use,or other factors.
Tolt River near CarnationStation 12144500
R2 = 0.1305
0
50
100
150
200
250
1910 1920 1930 1940 1950 1960 1970 1980 1990 2000
Low
est 7
-day
ave
rage
flow
s (c
fs)
Snoqualmie River near CarnationStation 12149000
R2 = 0.0113
0
200
400
600
800
1000
1200
1400
1600
1800
2000
1910 1920 1930 1940 1950 1960 1970 1980 1990 2000
Low
est 7
-day
ave
rage
flow
s (c
fs)
Snohomish River near MonroeStation 12150800
R2 = 0.164
0
500
1000
1500
2000
2500
3000
3500
4000
4500
1910 1920 1930 1940 1950 1960 1970 1980 1990 2000
Low
est 7
-day
ave
rage
flow
s (c
fs)
Page 11
So. Fk. Skykomish River near IndexStation 12133000
R2 = 0.1109
0
100
200
300
400
500
600
700
800
1910 1920 1930 1940 1950 1960 1970 1980 1990 2000
Low
est 7
-day
ave
rage
flow
s (c
fs)
Sulton River near SultonStation 12138150
R2 = 0.4064
0
50
100
150
200
250
300
1910 1920 1930 1940 1950 1960 1970 1980 1990 2000
Low
est 7
-day
ave
rage
flow
s (c
fs)
Snoqualmie River near SnoqualmieStation 12144500
R2 = 0.1436
0
200
400
600
800
1000
1200
1910 1920 1930 1940 1950 1960 1970 1980 1990 2000
Low
est 7
-day
ave
rage
flow
s (c
fs)
Page 12
Snoqualmie River near SnoqualmieStation 12144500
R2 = 0.0011
1000
6000
11000
16000
21000
26000
1955 1960 1965 1970 1975 1980 1985 1990 1995 2000
Hig
hest
7-d
ay-a
vera
ge fl
ows
(cfs
)
Snohomish River near MonroeStation 12150800
R2 = 0.0029
0
10000
20000
30000
40000
50000
60000
70000
80000
1955 1960 1965 1970 1975 1980 1985 1990 1995 2000
Hig
hest
7-d
ay a
vera
ge fl
ow (c
fs)
Page 13
Page 14 Pacific NW Salmon Habitat Indicators
Water Quality
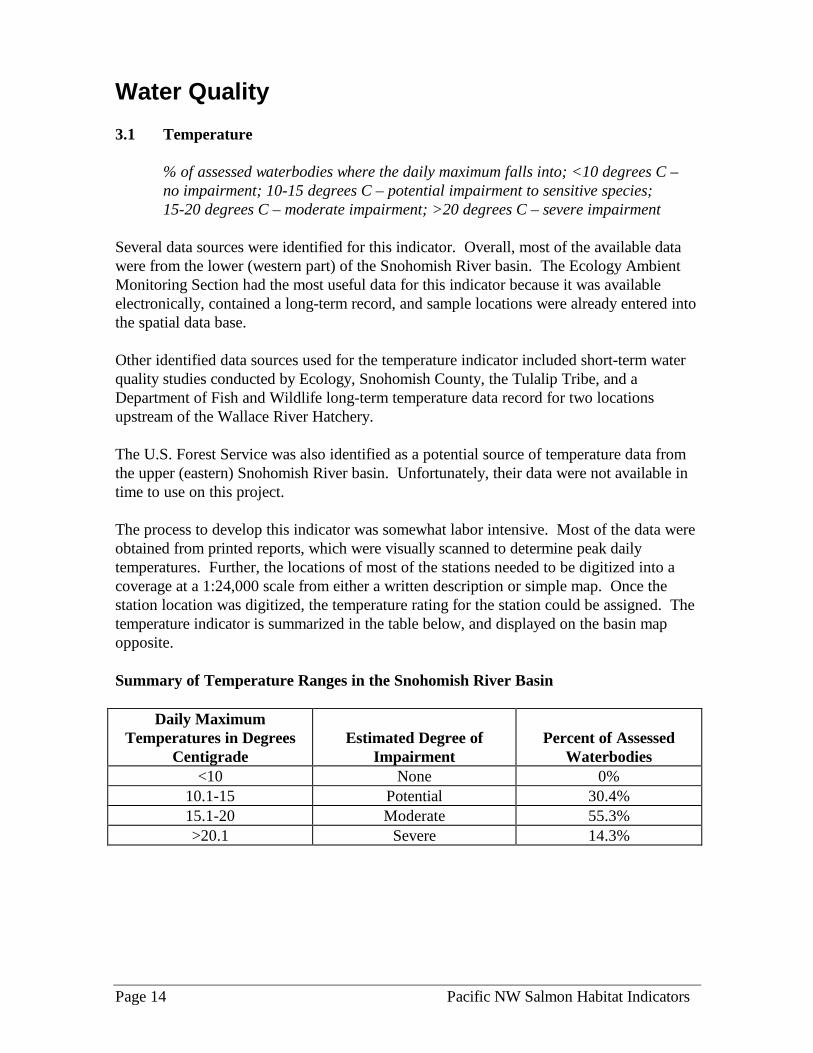
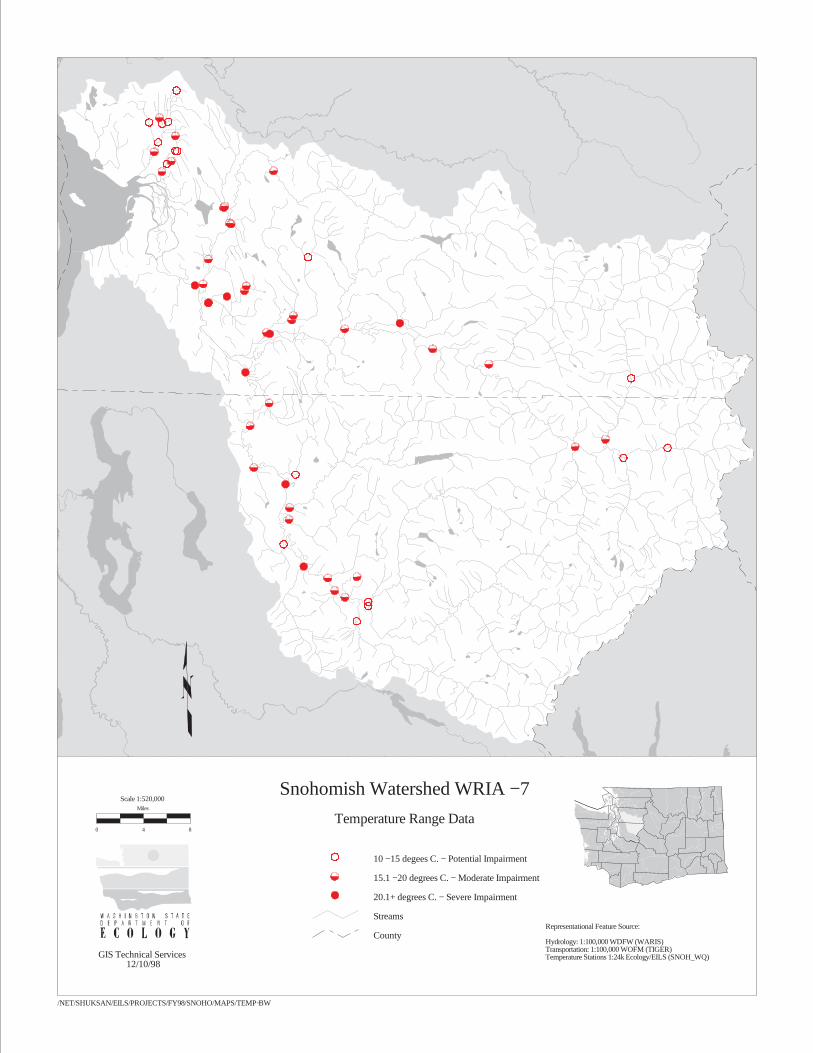
3.1 Temperature
% of assessed waterbodies where the daily maximum falls into; <10 degrees C –no impairment; 10-15 degrees C – potential impairment to sensitive species;15-20 degrees C – moderate impairment; >20 degrees C – severe impairment
Several data sources were identified for this indicator. Overall, most of the available datawere from the lower (western part) of the Snohomish River basin. The Ecology AmbientMonitoring Section had the most useful data for this indicator because it was availableelectronically, contained a long-term record, and sample locations were already entered intothe spatial data base.
Other identified data sources used for the temperature indicator included short-term waterquality studies conducted by Ecology, Snohomish County, the Tulalip Tribe, and aDepartment of Fish and Wildlife long-term temperature data record for two locationsupstream of the Wallace River Hatchery.
The U.S. Forest Service was also identified as a potential source of temperature data fromthe upper (eastern) Snohomish River basin. Unfortunately, their data were not available intime to use on this project.
The process to develop this indicator was somewhat labor intensive. Most of the data wereobtained from printed reports, which were visually scanned to determine peak dailytemperatures. Further, the locations of most of the stations needed to be digitized into acoverage at a 1:24,000 scale from either a written description or simple map. Once thestation location was digitized, the temperature rating for the station could be assigned. Thetemperature indicator is summarized in the table below, and displayed on the basin mapopposite.
Summary of Temperature Ranges in the Snohomish River Basin
Daily MaximumTemperatures in Degrees
CentigradeEstimated Degree of
ImpairmentPercent of Assessed
Waterbodies<10 None 0%
10.1-15 Potential 30.4%15.1-20 Moderate 55.3%>20.1 Severe 14.3%
Snohomish Watershed WRIA − 7
GIS Technical Services12/10/98
Temperature Range Data
10 − 15 degees C. − Potential Impairment
15.1 − 20 degrees C. − Moderate Impairment
20.1+ degrees C. − Severe Impairment
Streams
CountyRepresentational Feature Source:
Hydrology: 1:100,000 WDFW (WARIS)Transportation: 1:100,000 WOFM (TIGER)Temperature Stations 1:24k Ecology/EILS (SNOH_WQ)
/NET/SHUKSAN/EILS/PROJECTS/FY98/SNOHO/MAPS/TEMP−BW
0 4 8
Miles
Scale 1:520,000
Page 16 Pacific NW Salmon Habitat Indicators
3.2 Biological Water Quality Index
% of water rated excellent, good, fair, poor (possible parameters would includefish community and benthic macroinvertebrate species or taxa composition andrichness using similar bioassessment protocols)
There were two benthic macroinvertebrate studies that were conducted in the SnohomishRiver basin at the time of this report. The earliest study was conducted by Ecology as partof a water quality - low flow assessment of the lower Snoqualmie River during the summerof 1989. Snohomish County conducted the second study in 1997 in three lower basintributaries. These studies were limited in scope, represent only a small portion of thewatershed, and used different bioassessment protocols. Consequently, no further analysiswas conducted.
Pacific NW Salmon Habitat Indicators Page 17
Insufficient Data
Precluded Indicator Development
Page 18 Pacific NW Salmon Habitat Indicators
3.3 Chemical Water Quality Index
% of waters rated excellent, good, fair, poor (possible parameters would includetemperature, dissolved oxygen, biological oxygen demand, pH, ammonia + nitratenitrogen, total phosphorus, total suspended solids, and bacteria to produce a singlenumber)
There were few data sources for this indicator, and these were mainly focused on the lower(western part) of the Snohomish River basin. Ecology’s Ambient Monitoring Section hadthe most useful data for this indicator because it was available electronically, contained along term monitoring record, and the sample locations were already entered into the GISdatabase.
The other identified data sources for the indicator included short-term water quality studiesconducted by Ecology, Snohomish County, and the Tulalip Tribe. These data sourceswere not used for characterizing this indicator because the data record was limited to only afew months or years.
There are several possible methods for developing chemical water quality indices. Due tothe limited scope of this project, a simple index was used to test the available data. Theindex consists of two of the recommended water quality parameters, temperature anddissolved oxygen. These parameters were selected because numeric criteria exist for themunder State Water Quality Standards (WAC 173-201A), data were available, and theseparameters directly affect salmon health. The criteria were applied during the hightemperature/low dissolved oxygen period of June-September. The results of this analysisare plotted on the following pages as the percent compliance at each monitoring station forboth parameters. However, due to the low number of assessed waters, this indicator wasnot converted into a rating of excellent, good, fair, or poor.
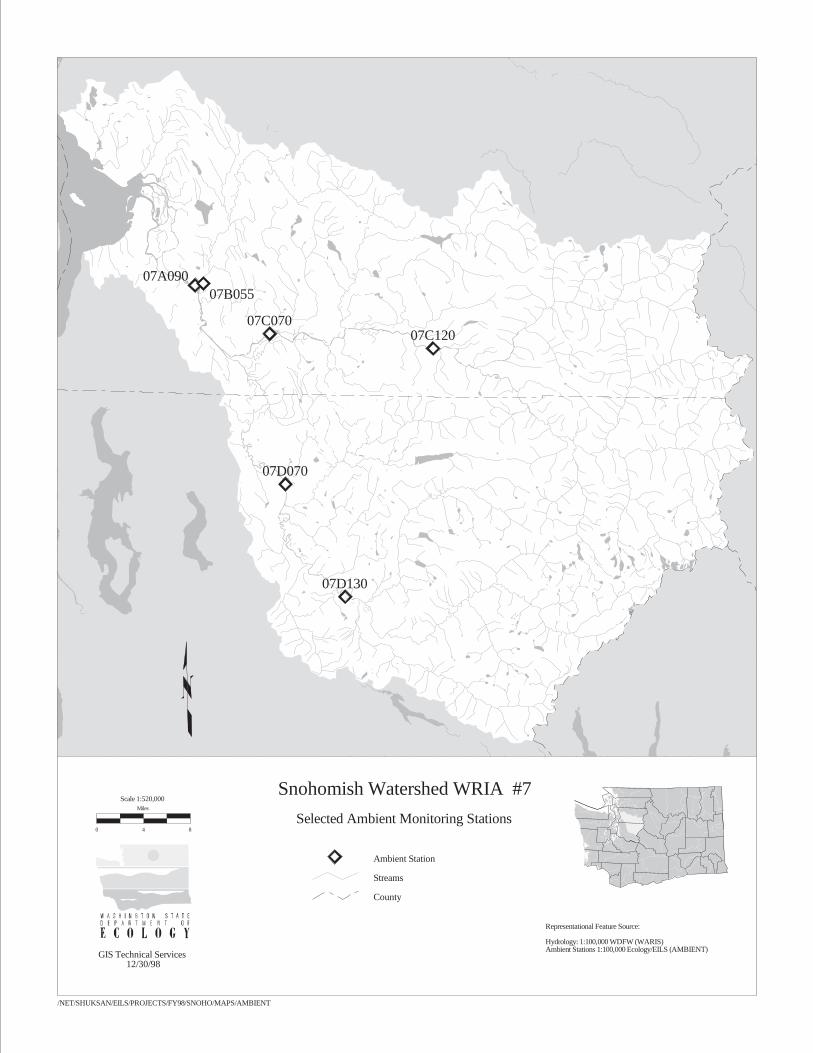
07C07007C120
07D070
07D130
07A09007B055
Snohomish Watershed WRIA #7
GIS Technical Services12/30/98
Selected Ambient Monitoring Stations
Ambient Station
Streams
County
Representational Feature Source:
Hydrology: 1:100,000 WDFW (WARIS)Ambient Stations 1:100,000 Ecology/EILS (AMBIENT)
/NET/SHUKSAN/EILS/PROJECTS/FY98/SNOHO/MAPS/AMBIENT
0 4 8
Miles
Scale 1:520,000
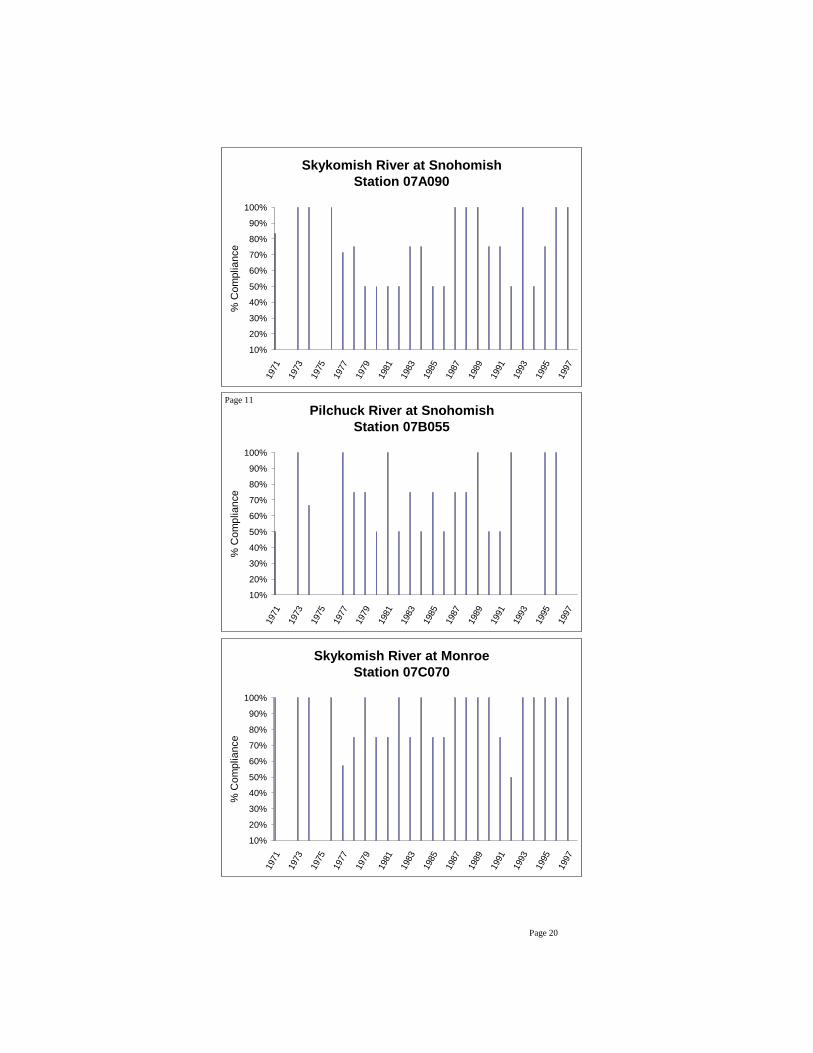
Skykomish River at SnohomishStation 07A090
10%
20%
30%
40%
50%
60%
70%
80%
90%
100%
1971
1973
1975
1977
1979
1981
1983
1985
1987
1989
1991
1993
1995
1997
% C
ompl
ianc
e
Pilchuck River at SnohomishStation 07B055
10%
20%
30%
40%
50%
60%
70%
80%
90%
100%
1971
1973
1975
1977
1979
1981
1983
1985
1987
1989
1991
1993
1995
1997
% C
ompl
ianc
e
Page 11
Skykomish River at MonroeStation 07C070
10%
20%
30%
40%
50%
60%
70%
80%
90%
100%
1971
1973
1975
1977
1979
1981
1983
1985
1987
1989
1991
1993
1995
1997
% C
ompl
ianc
e
Page 20
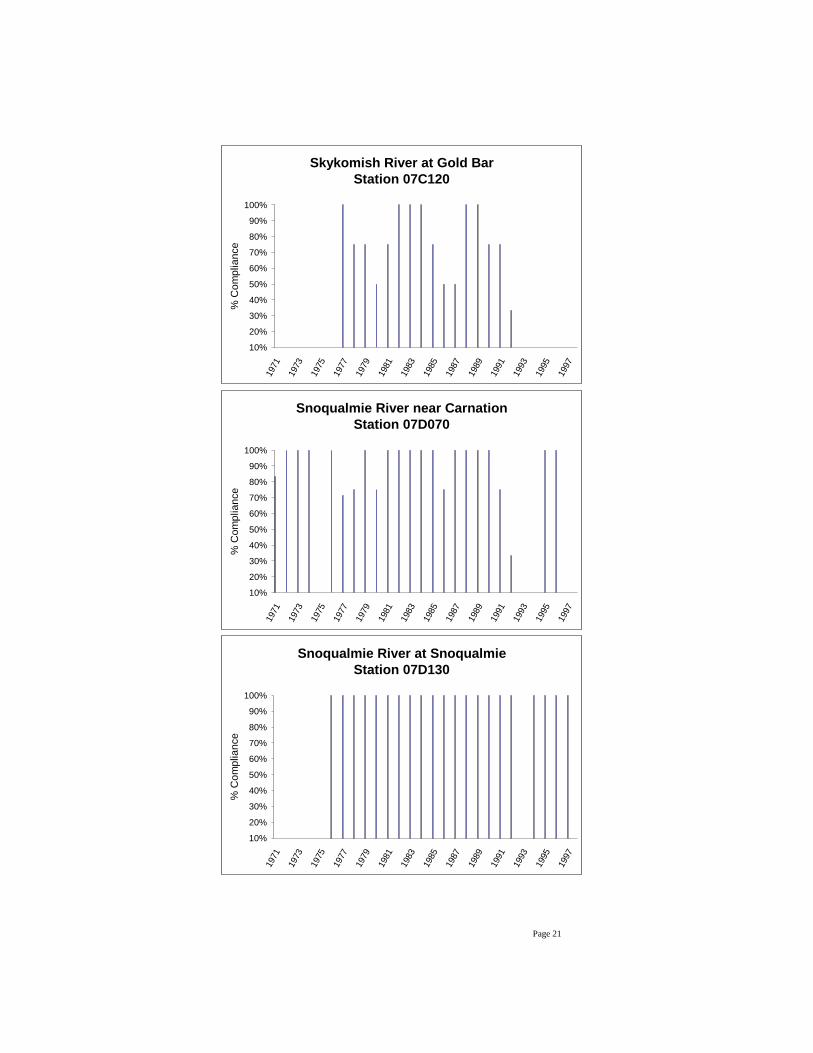
Skykomish River at Gold BarStation 07C120
10%
20%
30%
40%
50%
60%
70%
80%
90%
100%
1971
1973
1975
1977
1979
1981
1983
1985
1987
1989
1991
1993
1995
1997
% C
ompl
ianc
e
Snoqualmie River near CarnationStation 07D070
10%
20%
30%
40%
50%
60%
70%
80%
90%
100%
1971
1973
1975
1977
1979
1981
1983
1985
1987
1989
1991
1993
1995
1997
% C
ompl
ianc
e
Snoqualmie River at SnoqualmieStation 07D130
10%
20%
30%
40%
50%
60%
70%
80%
90%
100%
1971
1973
1975
1977
1979
1981
1983
1985
1987
1989
1991
1993
1995
1997
% C
ompl
ianc
e
Page 21
Page 22 Pacific NW Salmon Habitat Indicators
Land Use/Land Cover
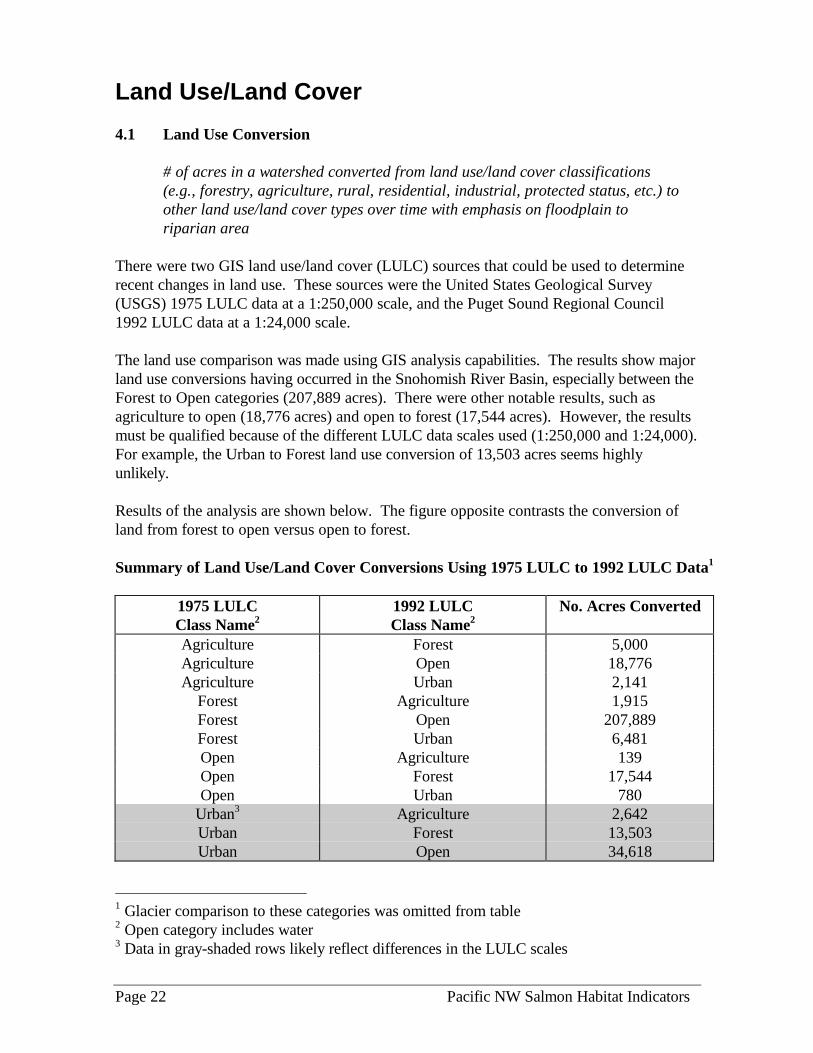
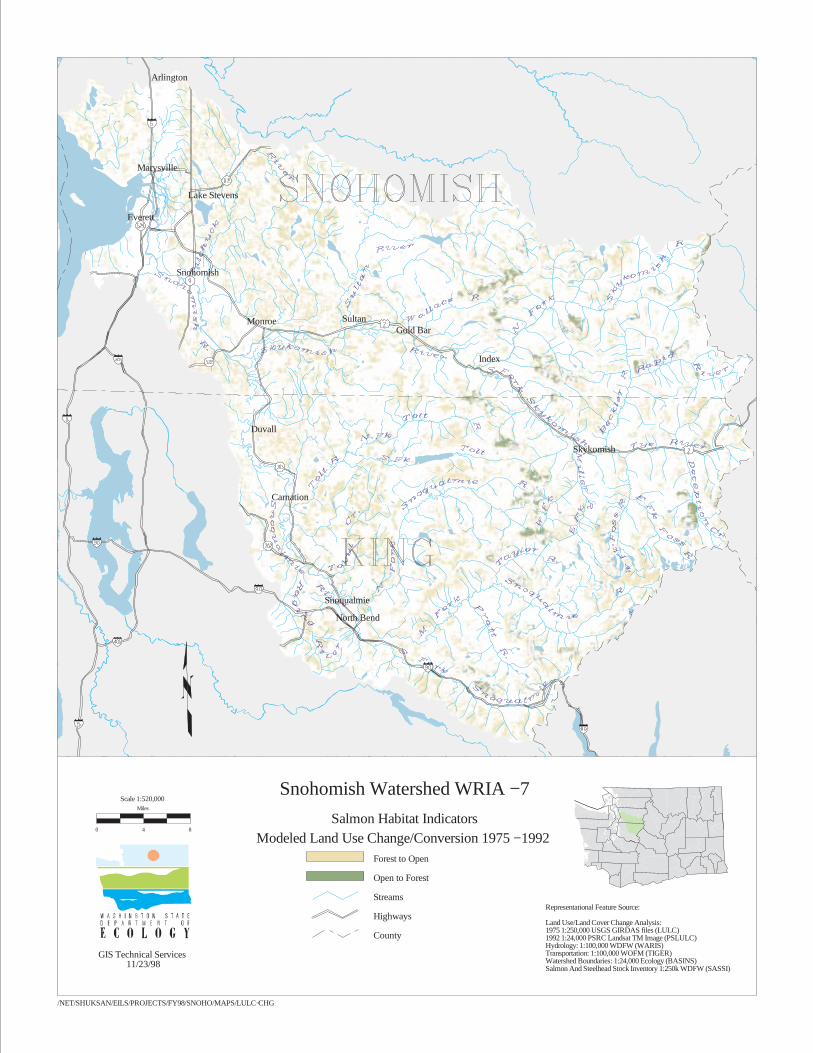
4.1 Land Use Conversion
# of acres in a watershed converted from land use/land cover classifications(e.g., forestry, agriculture, rural, residential, industrial, protected status, etc.) toother land use/land cover types over time with emphasis on floodplain toriparian area
There were two GIS land use/land cover (LULC) sources that could be used to determinerecent changes in land use. These sources were the United States Geological Survey(USGS) 1975 LULC data at a 1:250,000 scale, and the Puget Sound Regional Council1992 LULC data at a 1:24,000 scale.
The land use comparison was made using GIS analysis capabilities. The results show majorland use conversions having occurred in the Snohomish River Basin, especially between theForest to Open categories (207,889 acres). There were other notable results, such asagriculture to open (18,776 acres) and open to forest (17,544 acres). However, the resultsmust be qualified because of the different LULC data scales used (1:250,000 and 1:24,000).For example, the Urban to Forest land use conversion of 13,503 acres seems highlyunlikely.
Results of the analysis are shown below. The figure opposite contrasts the conversion ofland from forest to open versus open to forest.
Summary of Land Use/Land Cover Conversions Using 1975 LULC to 1992 LULC Data1
1975 LULCClass Name2
1992 LULCClass Name2
No. Acres Converted
Agriculture Forest 5,000Agriculture Open 18,776Agriculture Urban 2,141
Forest Agriculture 1,915Forest Open 207,889Forest Urban 6,481Open Agriculture 139Open Forest 17,544Open Urban 780
Urban3 Agriculture 2,642Urban Forest 13,503Urban Open 34,618
1 Glacier comparison to these categories was omitted from table2 Open category includes water3 Data in gray-shaded rows likely reflect differences in the LULC scales
Arlington
Marysville
Lake Stevens
Snohomish
Monroe SultanGold Bar
Index
Duvall
Skykomish
Carnation
Snoqualmie
North Bend
Everett
Snohomish Watershed WRIA − 7
GIS Technical Services11/23/98
Salmon Habitat IndicatorsModeled Land Use Change/Conversion 1975 − 1992
Forest to Open
Open to Forest
Streams
Highways
County
Representational Feature Source:
Land Use/Land Cover Change Analysis:1975 1:250,000 USGS GIRDAS files (LULC)1992 1:24,000 PSRC Landsat TM Image (PSLULC)Hydrology: 1:100,000 WDFW (WARIS)Transportation: 1:100,000 WOFM (TIGER)Watershed Boundaries: 1:24,000 Ecology (BASINS)Salmon And Steelhead Stock Inventory 1:250k WDFW (SASSI)
/NET/SHUKSAN/EILS/PROJECTS/FY98/SNOHO/MAPS/LULC−CHG
0 4 8
Miles
Scale 1:520,000
Page 24 Pacific NW Salmon Habitat Indicators
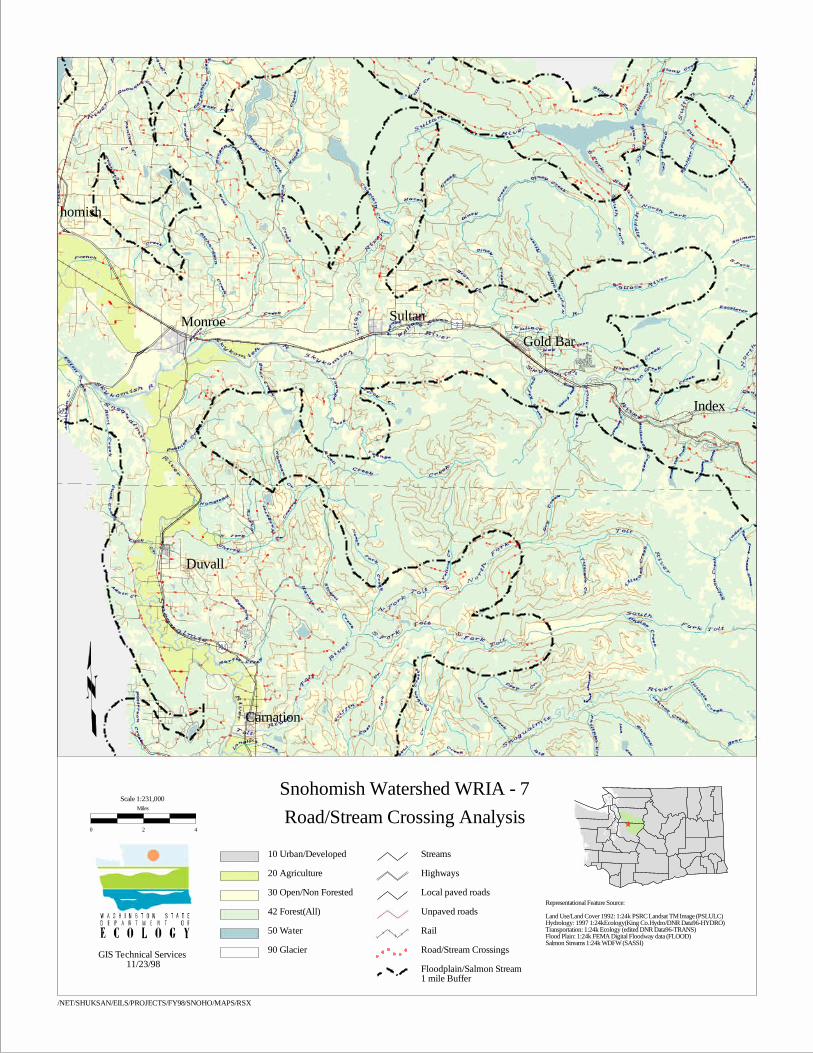
4.2 Transportation Impacts
Miles of road by type and road crossings within one mile of historicallyanadromous salmon streams, floodplains, and marine shorelines
The Washington Department of Natural Resources (DNR) 1996 digital transportationcoverage (1:24,000 scale) was edited by Ecology GIS staff to obtain the roads by classtype. The results were as follows:
Road Class MilesInterstate Highway 185.4State Highway 121.8Paved Road 1,045.1Unpaved Road 2,851.9Total 4,204.2
The calculation of the number of road crossings required the use of several GIS digital datasets: the DNR 1996 Hydrography (1:24,000), the WDFW 1992 SASSI (1:100,000), andthe Federal Emergency Management Agency – Floodway (1:24,000). The DNR 1996transportation layer was then added to identify the number of road crossings within one mileof historically anadromous salmon habitat. The geographic analysis calculated that therewere 2,821 road crossings of salmon streams, floodplains, and marine shorelines in theSnohomish River Basin.
The map on the opposite page depicts the one-mile overlay and associated road crossings ina small part of the lower basin.
homish
Monroe Sultan
Gold Bar
Index
Duvall
Carnation
Snohomish Watershed WRIA - 7
Road/Stream Crossing Analysis
10 Urban/Developed
20 Agriculture
30 Open/Non Forested
42 Forest(All)
50 Water
90 Glacier
Streams
Highways
Local paved roads
Unpaved roads
Rail
Road/Stream Crossings
Floodplain/Salmon Stream1 mile Buffer
Representational Feature Source:
Land Use/Land Cover 1992: 1:24k PSRC Landsat TM Image (PSLULC)Hydrology: 1997 1:24kEcology(King Co.Hydro/DNR Data96-HYDRO)Transportation: 1:24k Ecology (edited DNR Data96-TRANS)Flood Plain: 1:24k FEMA Digital Floodway data (FLOOD)Salmon Streams 1:24k WDFW (SASSI)
GIS Technical Services11/23/98
/NET/SHUKSAN/EILS/PROJECTS/FY98/SNOHO/MAPS/RSX
0 2 4
Miles
Scale 1:231,000
Page 26 Pacific NW Salmon Habitat Indicators
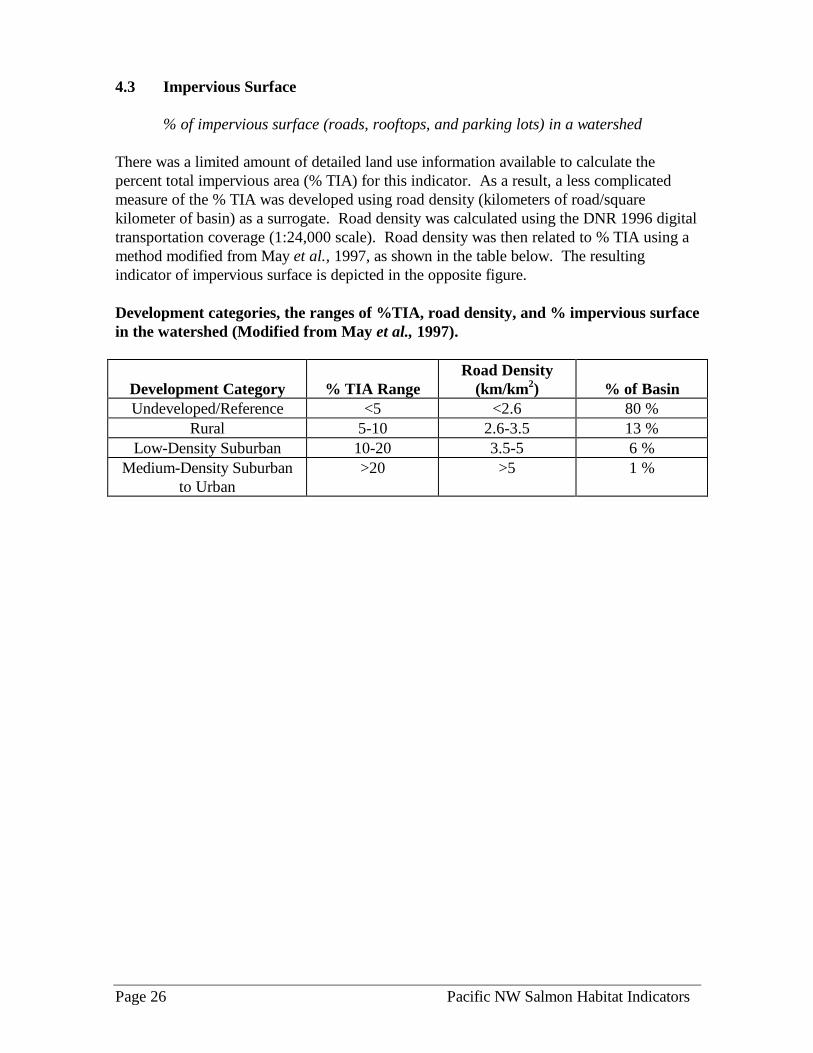
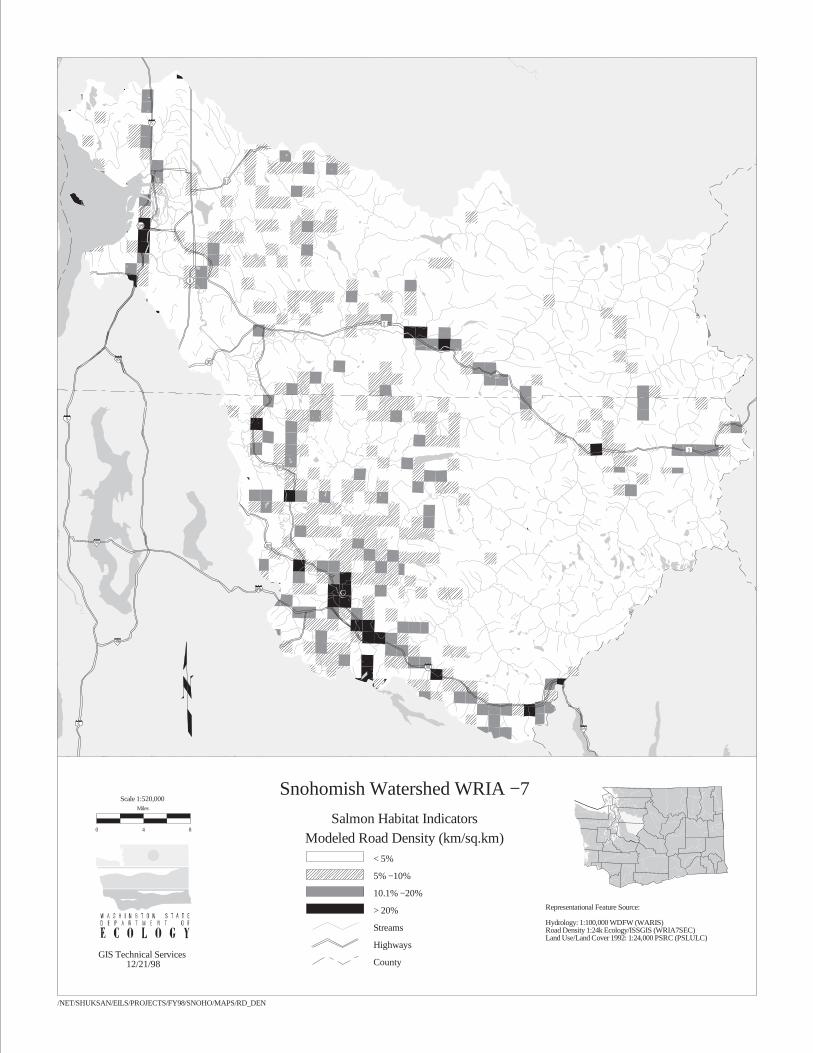
4.3 Impervious Surface
% of impervious surface (roads, rooftops, and parking lots) in a watershed
There was a limited amount of detailed land use information available to calculate thepercent total impervious area (% TIA) for this indicator. As a result, a less complicatedmeasure of the % TIA was developed using road density (kilometers of road/squarekilometer of basin) as a surrogate. Road density was calculated using the DNR 1996 digitaltransportation coverage (1:24,000 scale). Road density was then related to % TIA using amethod modified from May et al., 1997, as shown in the table below. The resultingindicator of impervious surface is depicted in the opposite figure.
Development categories, the ranges of %TIA, road density, and % impervious surfacein the watershed (Modified from May et al., 1997).
Development Category % TIA RangeRoad Density
(km/km2) % of BasinUndeveloped/Reference <5 <2.6 80 %
Rural 5-10 2.6-3.5 13 %Low-Density Suburban 10-20 3.5-5 6 %
Medium-Density Suburbanto Urban
>20 >5 1 %
Snohomish Watershed WRIA − 7
GIS Technical Services12/21/98
Salmon Habitat IndicatorsModeled Road Density (km/sq.km)
< 5%
5% − 10%
10.1% − 20%
> 20%
Streams
Highways
County
Representational Feature Source:
Hydrology: 1:100,000 WDFW (WARIS)Road Density 1:24k Ecology/ISSGIS (WRIA7SEC)Land Use/Land Cover 1992: 1:24,000 PSRC (PSLULC)
/NET/SHUKSAN/EILS/PROJECTS/FY98/SNOHO/MAPS/RD_DEN
0 4 8
Miles
Scale 1:520,000
Page 28 Pacific NW Salmon Habitat Indicators
Physical Habitat
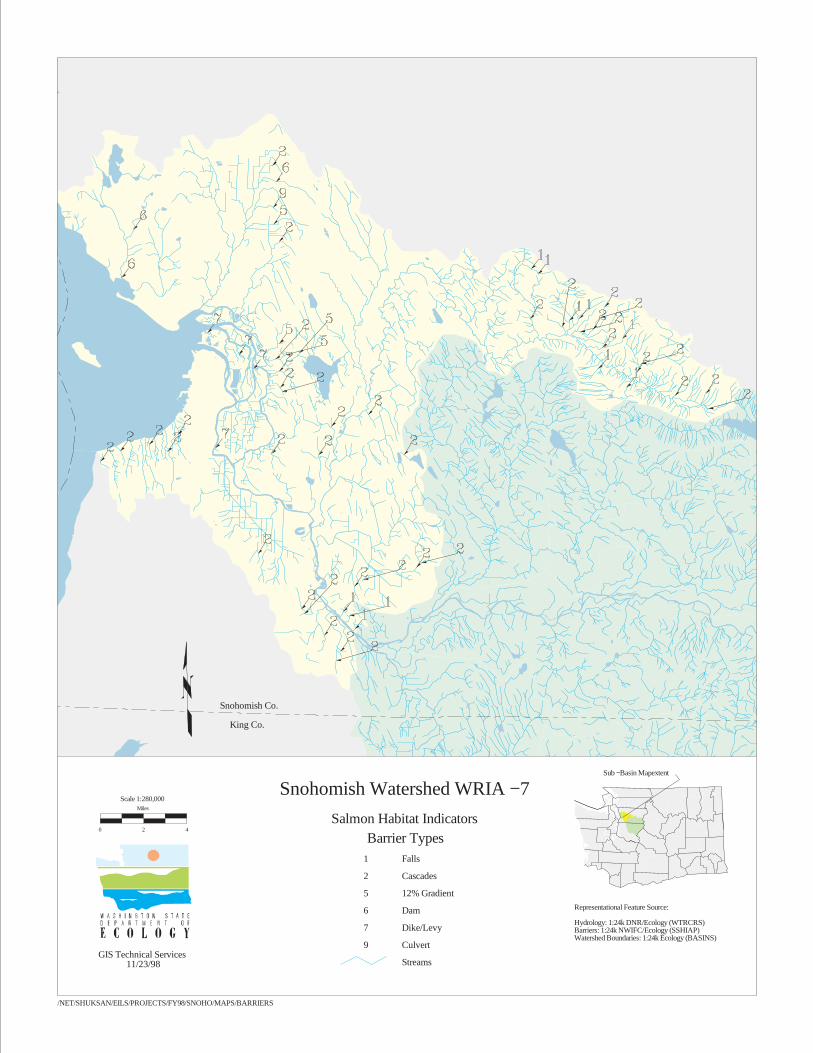
5.1.1 Impediments and Accessibility to Salmon Habitat
# of locations where salmon are impeded, by type, and the amount by type, ofhistorically anadromous salmon habitat rendered inaccessible by theseimpediments
This indicator was developed using Northwest Indian Fisheries Commission (NWIFC)Salmon and Steelhead Habitat Inventory and Assessment Project (SSHIAP) data. Thefigure opposite depicts types of salmon habitat barriers in river segments of the lowerSnohomish River Basin and nearby tributaries to Possession Sound. In this limitedgeographic area, the most common barrier types were cascades and falls, as opposed toconstructed barriers like dams, dikes, and culverts. At the time of this report, SSHIAP datawere not available in a GIS coverage for upper portions of the Snohomish basin,consequently the number of locations where salmon are impeded basinwide was not tallied,as required for this indicator.
Snohomish Watershed WRIA − 7
GIS Technical Services11/23/98
Snohomish Co.
King Co.
Salmon Habitat IndicatorsBarrier Types
Falls
Cascades
12% Gradient
Dam
Dike/Levy
Culvert
Streams
1
2
5
6
7
9
Representational Feature Source:
Hydrology: 1:24k DNR/Ecology (WTRCRS)Barriers: 1:24k NWIFC/Ecology (SSHIAP)Watershed Boundaries: 1:24k Ecology (BASINS)
Sub − Basin Mapextent
/NET/SHUKSAN/EILS/PROJECTS/FY98/SNOHO/MAPS/BARRIERS
0 2 4
Miles
Scale 1:280,000
Page 30 Pacific NW Salmon Habitat Indicators
5.2.1 Large Woody Debris
Counts of debris pieces with lengths equal or greater than channel widths, notingpresence/absence of root wads, per historically anadromous salmonid stream mile
5.2.2 Stream Depth
variance of thalweg depths (flow path of the deepest water in a stream)
5.3.1 Sediment
change in sediment loading rates
5.3.2 Spawning Area
% change in spawning areas
Data sources were located for some of these parameters in the Snohomish River basin.However, data availability or comparability issues precluded indicator development.
Pacific NW Salmon Habitat Indicators Page 31
Insufficient Data
Precluded Indicator Development
Page 32 Pacific NW Salmon Habitat Indicators
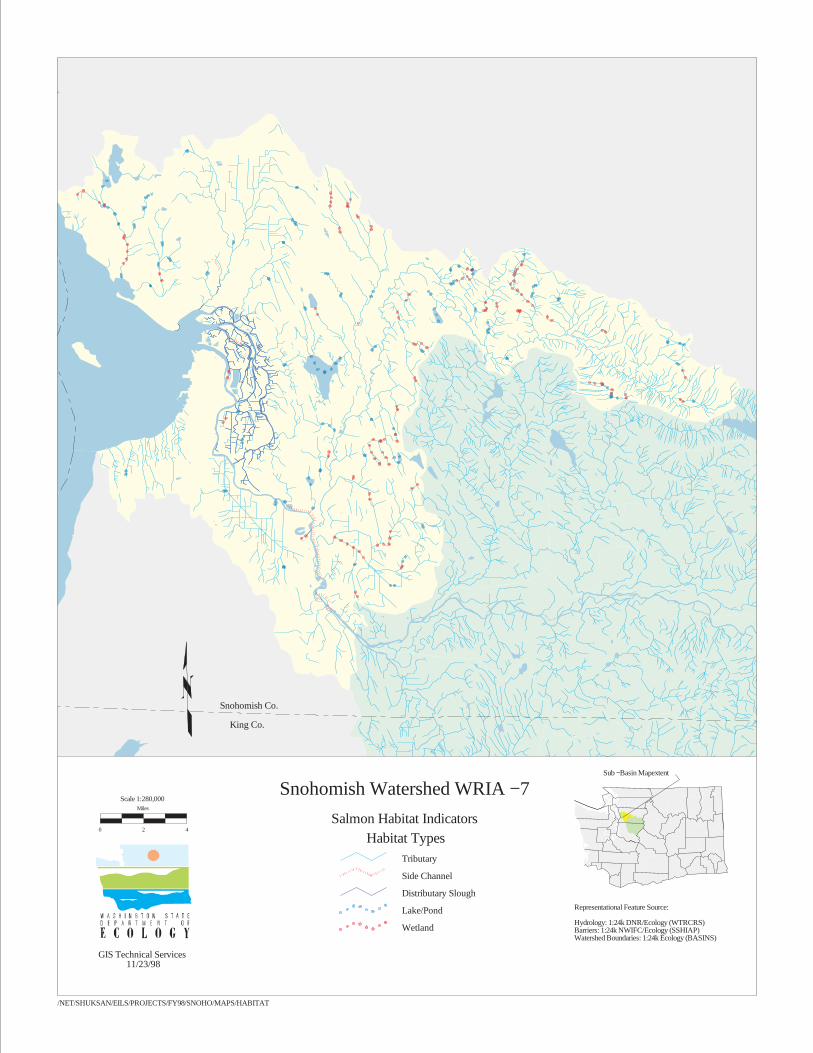
5.4.1 Habitat Type Associated with Water
the amount of habitat, by category (e.g., riparian forest, off-channel, wetland, andestuary) associated with the water margins of the water course in a watershed andthe value of the habitat to the salmonid life-cycle
This indicator was developed using Northwest Indian Fisheries Commission (NWIFC)Salmon and Steelhead Habitat Inventory and Assessment Project (SSHIAP) data. Resultsare depicted on the opposite page for the lower portion of the Snohomish Basin, as well asfor other nearby drainages to Possession Sound. At the time of this report, SSHIAP datawere not available in GIS coverage for the upper portions of the basin, consequently theamount of habitat basinwide by category was not calculated, as required for this indicator.
Snohomish Watershed WRIA − 7
GIS Technical Services11/23/98
Snohomish Co.
King Co.
Salmon Habitat IndicatorsHabitat Types
Tributary
Side Channel
Distributary Slough
Lake/Pond
Wetland
Representational Feature Source:
Hydrology: 1:24k DNR/Ecology (WTRCRS)Barriers: 1:24k NWIFC/Ecology (SSHIAP)Watershed Boundaries: 1:24k Ecology (BASINS)
Sub − Basin Mapextent
/NET/SHUKSAN/EILS/PROJECTS/FY98/SNOHO/MAPS/HABITAT
0 2 4
Miles
Scale 1:280,000
Page 34 Pacific NW Salmon Habitat Indicators
Combined Indicators
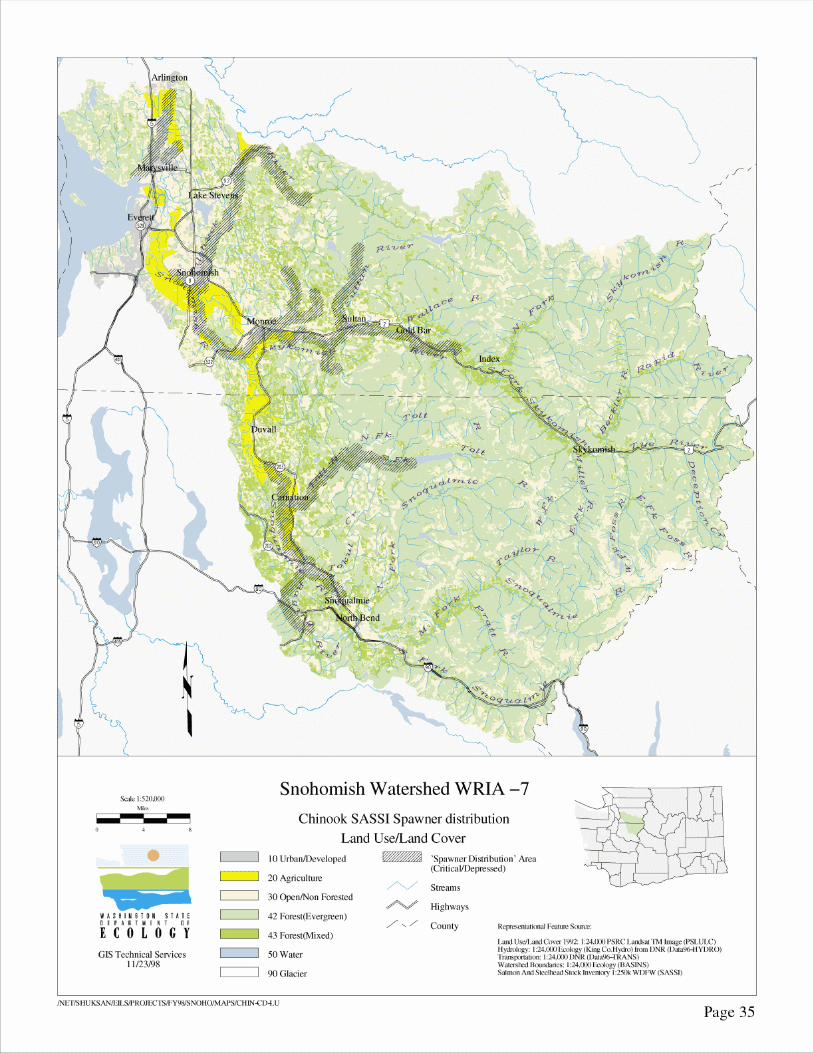
1.1 Salmonids
Summer and Fall Chinook (1993 SASSI Spawner Distribution)
4.1 Land Use
1992 Land use/land cover (Puget Sound Regional Council)
The intent of this indicator comparison was to explore how land uses may relate to thedistribution of critical/depressed chinook salmon stocks in the basin. This comparison,shown in the figure opposite, indicates that chinook stocks are critical/depressed in nearlyall of the land use types, including agricultural, urban, and forest.
Page 36 Pacific NW Salmon Habitat Indicators
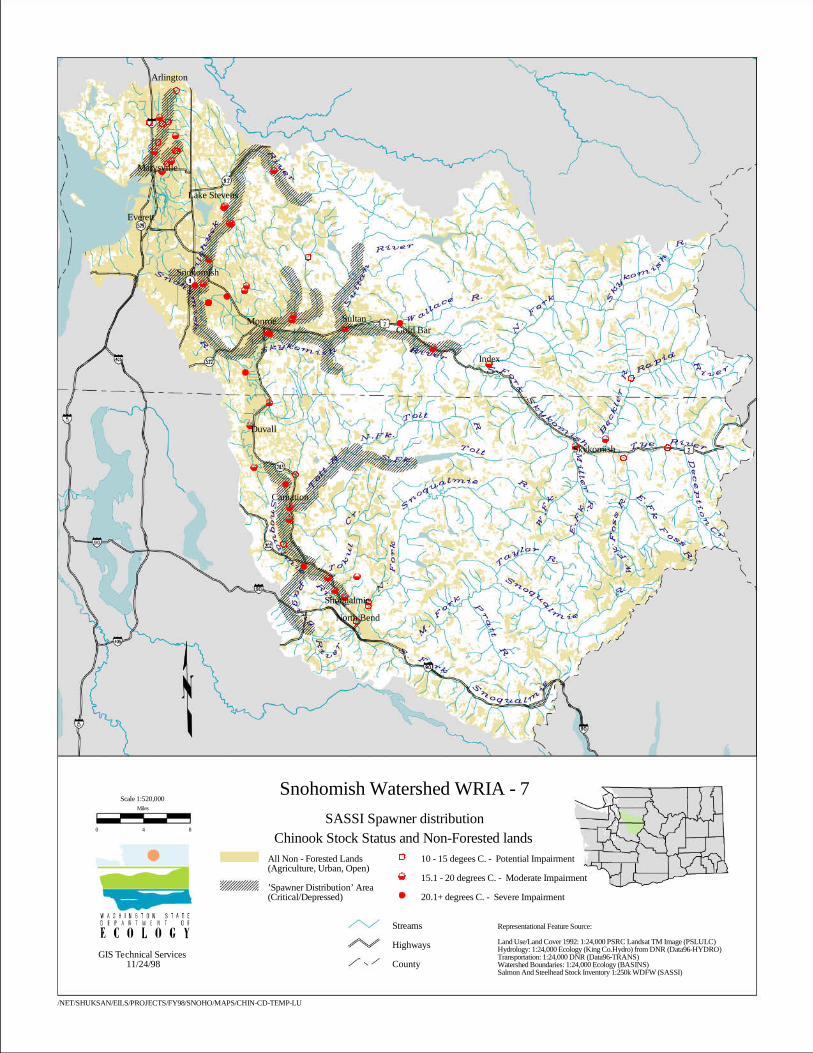
Combined Indicators
1.1 Salmonids
Summer and Fall Chinook (1993 SASSI Spawner Distribution)
3.1 Temperature
Ecology, Snohomish County, Tulalip Tribe, and WDFW studies
4.1 Land Use Conversion
1992 Land use/land cover (Puget Sound Regional Council)Non-Forested Lands (Agriculture – Urban – Open)
This indicator comparison was designed to explore how land use may relate to streamtemperatures and to the distribution of critical/depressed chinook salmon stocks in thebasin. In this case, a special non-forested land category was created by combiningagriculture, urban, and open land use/land cover categories.
The comparison shown on the opposite page indicates that critical/depressed chinookstocks seem to be located more so in non-forested areas, and that these same areas tend tohave water temperatures with the potential for moderate to severe impairment for salmon.
Arlington
Marysville
Lake Stevens
Snohomish
Monroe SultanGold Bar
Index
Duvall
Skykomish
Carnation
Snoqualmie
North Bend
Everett
Snohomish Watershed WRIA - 7
GIS Technical Services11/24/98
SASSI Spawner distributionChinook Stock Status and Non-Forested lands
All Non - Forested Lands(Agriculture, Urban, Open)
’Spawner Distribution’ Area(Critical/Depressed)
Streams
Highways
County
10 - 15 degees C. - Potential Impairment
15.1 - 20 degrees C. - Moderate Impairment
20.1+ degrees C. - Severe Impairment
Representational Feature Source:
Land Use/Land Cover 1992: 1:24,000 PSRC Landsat TM Image (PSLULC)Hydrology: 1:24,000 Ecology (King Co.Hydro) from DNR (Data96-HYDRO)Transportation: 1:24,000 DNR (Data96-TRANS)Watershed Boundaries: 1:24,000 Ecology (BASINS)Salmon And Steelhead Stock Inventory 1:250k WDFW (SASSI)
/NET/SHUKSAN/EILS/PROJECTS/FY98/SNOHO/MAPS/CHIN-CD-TEMP-LU
0 4 8
Miles
Scale 1:520,000
Pacific NW Salmon Habitat Indicators Page 39
ConclusionsThe suite of 15 salmon habitat indicators has the potential to be a useful tool forcharacterizing salmon habitat changes within or between river basins. However, althoughthe Snohomish River basin was considered to be relatively data-rich, only about half of theindicators could be characterized, and many of those only to a limited extent.
This pilot project was three months in duration. Most of the effort was devoted toacquiring data from diverse sources and converting the data to an electronic format tofacilitate comparisons. Data quality and documentation were variable, and data weredifficult to represent in a geo-spatial framework. Monitoring for habitat indicators will beintegral to salmon recovery efforts and will require improved information data gathering,automation, and management to facilitate sharing among various agencies andorganizations.
RecommendationsLocal, regional, and state salmon recovery plans should include an effectiveness monitoringcomponent with a variety of habitat indicators (fish abundance, water quality and quantity,land use, and physical features).
Information management needs to be an integral part of future indicator monitoringprograms. Information should be managed near the point of origin, by the group having theprimary interest, and made readily available in electronic formats. Data should bedocumented such that secondary users can determine why, how, and where the data werecollected.
Monitoring entities should support efforts to agree on standards for the collection of salmonhabitat indicator data. Data collection methods will probably never be the same acrossagencies, but data documentation and transmittal standards should be consistent to facilitateinformation sharing.
Pacific NW Salmon Habitat Indicators Page 41
ReferencesMay, C. W., E. B. Welch, R. R. Horner, J. R. Karr, and B.W. Mar. 1997. Quality Indices for
Urbanization Effects in Puget Sound Lowland Streams. Water Resources SeriesTechnical Report No. 154, University of Washington. Ecology Publication No. 98-04.
Pacific Groundwater Group, 1995. Draft - Initial Watershed Assessment Water ResourcesInventory Area 7 Snohomish River Watershed. Ecology Publication No. 95-06.Prepared for Ecology by the Pacific Groundwater Group, Seattle, Washington.Washington State Department of Ecology, Olympia WA.
PNWSHIWG, 1998. Toward “A Small, but Powerful” Set of Regional Salmon HabitatIndicators for the Pacific Northwest. Prepared by Green Mountain Institute forEnvironmental Democracy, Montpelier, VT.
Washington Department of Fisheries, Washington Department of Fish and Wildlife, andWestern Washington Treaty Indian Tribes, 1993. 1992 Washington State Salmonand Steelhead Stock Inventory. Olympia, WA.