Embed Size (px)
Citation preview

TESC 332: CONSERVATION BIOLOGY IN PRACTICE UNIVERSITY OF WASHINGTON TACOMA
Commencement Bay (Tacoma, WA) Nearshore Salmon Habitat Assessment
Final Report to be Submitted to Pierce County
Bonnie Becker, Jamie Gruber, Canyon Little, Shawn Buck, Mitchell Crawford, Zachary Griswold, Travis Irving, Staci Johnson, Katherine Patterson,
Shristi Prakash, and Bridget Mason University of Washington Tacoma
July 2009

1
Introduction The goal of this study, conducted in spring 2009 by the nine students of the Conservation Biology in Practice class at University of Washington Tacoma, was to use an existing habitat model to assess the quality of the nearshore salmon habitat in Commencement Bay, located within the Puget Sound. The reason for assessing the salmon habitat quality is to provide prioritization information for future restoration proposals and land use decisions. By using a common model for our assessment that has been applied elsewhere in Pierce County, our results are comparable with previous work. Since this method generates simple scores for different areas, the study should be assessable to managers and the general public. This assessment is one of many pieces that will be used to help aid restoration efforts for the Chinook salmon of Commencement Bay. Chinook Salmon are one of the most valued and vulnerable species in Commencement Bay. Salmon fisheries provide not only leisure activities and a sense of history, but also add tremendously to the industrial and food markets. In 2006, commercial and recreational fishing carried out in Washington fisheries provided a projected 16,374 jobs and $540 million in personal income. Salmon fishing in only state waters, not including tribal or distant-water harvesting, produced revenue of $9.5 million (TCW Economics 2008). Since salmon are such an important resource in the Pacific Northwest, they must be protected, if not for economic reasons, then for moral ones. This is the case even more so now since West Coast Chinook salmon have been listed as threatened or endangered under the Endangered Species Act (USFWS 2009). Their habitats should be monitored regularly to verify that appropriate conditions are present for salmonid survival and growth. The Tidal Habitat Model (THM) is a method by which a salmon habitat can be assessed with a limited amount of time for field research (Houghton et al. 2003). Indicators are identified and inventoried using yes or no questions, based on existing research and information. Various indicators and stressors, which include water quality and pH, geomorphology and hydrology of shoreline, biological features such as riparian vegetation, marsh habitat, and forage fish spawning habitat, and large woody debris (LWD), were inventoried. Both existing data and data collected in the field are used to assign values to each of the indicators. A total score was then assigned to each of six areas within the Bay. Setting The Puget Sound is the second largest estuary in the United States, fed by fourteen major rivers. It encompasses 2,500 miles of shoreline where almost four million people take their residence (PSP 2008). Its vast biodiversity provides the Pacific Northwest with seemingly unlimited recreational and industrial resources.

2
One bay within the Puget Sound, Commencement Bay, is particularly valuable but also very threatened. The Bay is located within the city of Tacoma and is home to one of the largest ports in the nation, the Port of Tacoma. This port has been at the heart of the economic success for the city of Tacoma. The Bay is part of the Puyallup River watershed, and the mouth of the river is located within the Bay. In addition, a number of smaller creeks (Mason Creek, Puget Creek, and Hylebos Creek) empty into the Bay (Figures 1 and 2). Since the 19th Century, the Bay has been steadily industrialized and expanded, resulting in extensive and negative impacts on the environment. The natural historical shoreline of the Bay has all but disappeared and been replaced by docks, restaurants, factories, industrial plants, and garbage dumps. This has resulted in a diminished and polluted environment for a wide variety of native plant and animal species, including the Chinook salmon. All of Commencement Bay was at one point designated a Superfund site because of the toxic legacy that was left over from the industrial exploits that were utilized in this region (DOE 2009a). Major site cleanups have occurred over the last couple of decades and will continue to be cleaned up into the future. A large pollution site, the Tacoma ASARCO smelter, was just recently removed from the list of cleanup areas. There is now a movement to restore and rehabilitate the aquatic ecosystem so that endangered salmon species can once again thrive in this unique estuarine habitat (Duker et al. 1989). It is important to note that although Commencement Bay is highly degraded, significant numbers of salmon, including Chinook, are currently using this habitat (Olson et al. 2008, Ridolfi 2009). Therefore, restoration of native vegetation and lower levels of the food chain, is crucial so Commencement Bay can once again flourish as a natural setting for aquatic life (Lantor and Qlark 1999). This assessment was designed to aid in these restoration efforts. For a more detailed description of the study area see Simenstad (2000) and Olson et al. (2008). Methods The Tidal Habitat Model We used the Tidal Habitat Model (THM or “the model”), as described by Houghton et al. (2003), to assess the value of the habitat in Commencement Bay for Chinook salmon. The THM is a tool that gives researchers the means to evaluate and prioritize goals related to restoration, with little field work. The ecological functions that the model focuses on are salmon feeding, migration, predator avoidance, and saltwater adaptation. Previously, the THM was applied by Pentec Environmental to the nearshore zone in western Pierce County, including the Key Peninsula, Gig Harbor, and Islands region (Figure 1) (Houghton et al. 2003). This model was therefore ideal for our class, since it allowed us to quickly assess our area, while producing scores that could be compared across the region. This model is designed to be used in estuarine and nearshore environments to study Coho salmon, Chinook salmon, and bull trout, but we focused on Chinook salmon.

3
We used this model to examine salmon habitat along nearshore area around Commencement Bay, which is our defined Ecological Management Unit (EMU) for our assessment. An EMU is delineated based on similar geographic and hydrographic characteristics. The EMU is further subdivided into assessment units (AU), relatively homogenous stretches of shoreline. By focusing at the AU level, we were able to assign single scores for the various indicators across discrete shoreline segments. The model consists of a series of 34 “yes/no” questions for each AU which have a point value system attached to them. Each question is an “indicator”, since each gauges the ability of the AU to support a healthy salmonid population. Some indicators have a negative effect on populations, and are therefore called “stressors”. The number of points assigned is dependent on how important the indicator is to aiding and promoting salmonid development. Those that are strongly linked to their growth and health are given 3 points; those that are reasonably linked, are given 2 points; those that are weakly linked, are given 1 point. In addition, some of the specific indicators are particularly important to salmonid health, so they are allotted multipliers that greatly affect the final score. The stressors are scored by multiplying the total score by a value less than one, thus lowering the total. LWD and riparian vegetation are examples of features that aid in a healthy habitat, whereas overwater structures and sediment contamination result in a lower overall score. The majority of the AU must answer the question with a “yes” in order to obtain the point values. All of the questions do not need to be answered if data are unavailable. The total number distinguishes which habitat is best suited for supporting a vigorous population, with the highest number indicating the most sustainable environment. Determination of Assessment Units Since every indicator is giving a single score for each AU, it is important, that AUs are sufficiently uniform to easily assign a single value for the whole area. AUs could be selected by finding stretches of shoreline with homogeneous traits such as substrate type or quality of riparian vegetation, or by using man-made structures that function as shoreline breaks as AU borders. In addition, much of the available existing data was collected by the Washington State ShoreZone Inventory program (WA Department of Natural Resources) that was organized using short shoreline stretches of a similar scale to this study. These ShoreZone endpoints were used as a starting point for our AU selection. Due to our limited resources, we decided to focus on part of Commencement Bay. These AUs were chosen using a collaborative process and existing GIS data. Students worked in teams of two to choose six AUs based on attributes they felt were important, such as presence of eelgrass or amount of riparian vegetation. Ultimately, we focused on substrate type and manmade structures to choose homogenous areas that were easily accessible by foot without special permission. We chose three AUs on each side of the Bay: three on the east side along Marine View Drive (from north to south, AUE1, AUE2, AUE3), and three on the west side along Ruston Way (from north to south, AUW1, AUW2, AUW3). The original border between AUE1 and AUE2 was changed in the field after we observed that the distribution of substrates was different than expected from the existing data (Figure 2).
4
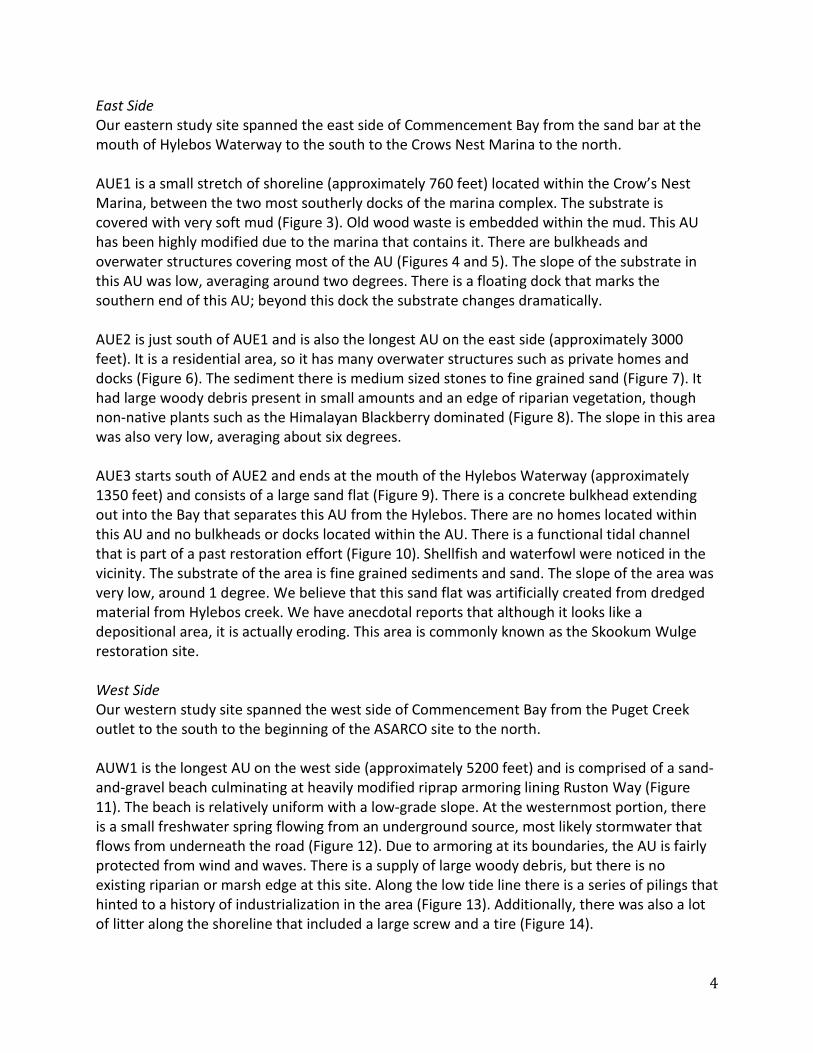
East Side Our eastern study site spanned the east side of Commencement Bay from the sand bar at the mouth of Hylebos Waterway to the south to the Crows Nest Marina to the north. AUE1 is a small stretch of shoreline (approximately 760 feet) located within the Crow’s Nest Marina, between the two most southerly docks of the marina complex. The substrate is covered with very soft mud (Figure 3). Old wood waste is embedded within the mud. This AU has been highly modified due to the marina that contains it. There are bulkheads and overwater structures covering most of the AU (Figures 4 and 5). The slope of the substrate in this AU was low, averaging around two degrees. There is a floating dock that marks the southern end of this AU; beyond this dock the substrate changes dramatically. AUE2 is just south of AUE1 and is also the longest AU on the east side (approximately 3000 feet). It is a residential area, so it has many overwater structures such as private homes and docks (Figure 6). The sediment there is medium sized stones to fine grained sand (Figure 7). It had large woody debris present in small amounts and an edge of riparian vegetation, though non-native plants such as the Himalayan Blackberry dominated (Figure 8). The slope in this area was also very low, averaging about six degrees. AUE3 starts south of AUE2 and ends at the mouth of the Hylebos Waterway (approximately 1350 feet) and consists of a large sand flat (Figure 9). There is a concrete bulkhead extending out into the Bay that separates this AU from the Hylebos. There are no homes located within this AU and no bulkheads or docks located within the AU. There is a functional tidal channel that is part of a past restoration effort (Figure 10). Shellfish and waterfowl were noticed in the vicinity. The substrate of the area is fine grained sediments and sand. The slope of the area was very low, around 1 degree. We believe that this sand flat was artificially created from dredged material from Hylebos creek. We have anecdotal reports that although it looks like a depositional area, it is actually eroding. This area is commonly known as the Skookum Wulge restoration site. West Side Our western study site spanned the west side of Commencement Bay from the Puget Creek outlet to the south to the beginning of the ASARCO site to the north. AUW1 is the longest AU on the west side (approximately 5200 feet) and is comprised of a sand-and-gravel beach culminating at heavily modified riprap armoring lining Ruston Way (Figure 11). The beach is relatively uniform with a low-grade slope. At the westernmost portion, there is a small freshwater spring flowing from an underground source, most likely stormwater that flows from underneath the road (Figure 12). Due to armoring at its boundaries, the AU is fairly protected from wind and waves. There is a supply of large woody debris, but there is no existing riparian or marsh edge at this site. Along the low tide line there is a series of pilings that hinted to a history of industrialization in the area (Figure 13). Additionally, there was also a lot of litter along the shoreline that included a large screw and a tire (Figure 14).
5
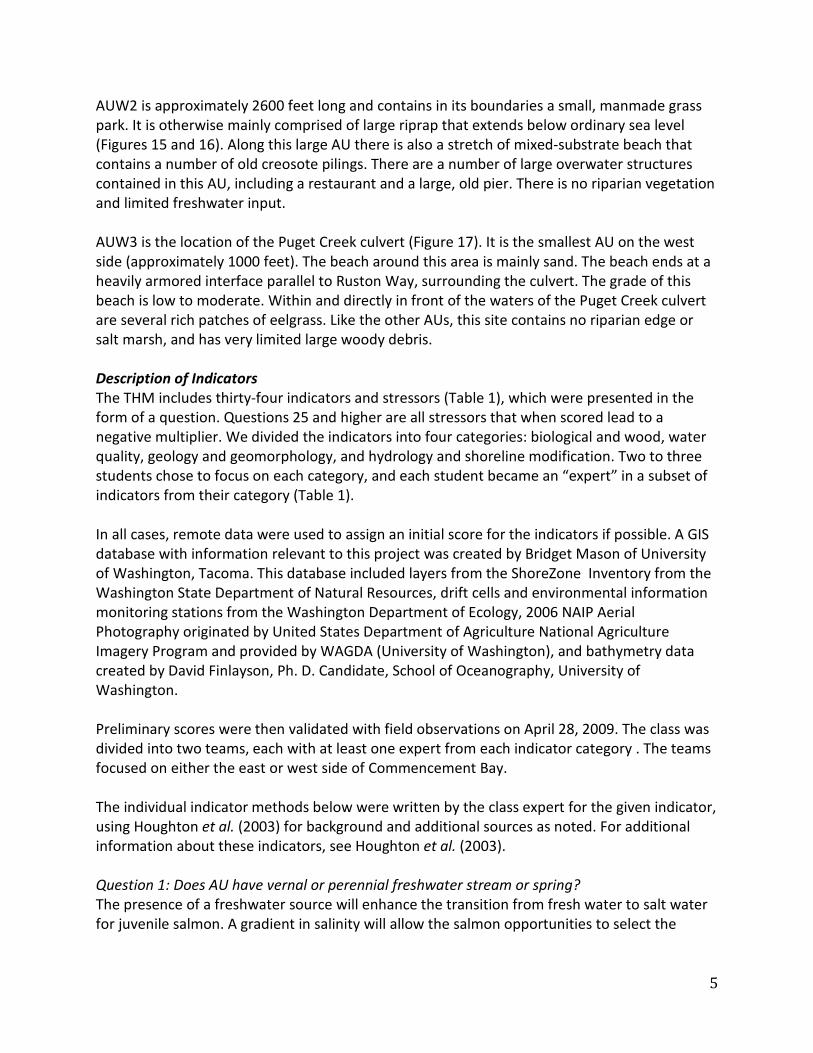
AUW2 is approximately 2600 feet long and contains in its boundaries a small, manmade grass park. It is otherwise mainly comprised of large riprap that extends below ordinary sea level (Figures 15 and 16). Along this large AU there is also a stretch of mixed-substrate beach that contains a number of old creosote pilings. There are a number of large overwater structures contained in this AU, including a restaurant and a large, old pier. There is no riparian vegetation and limited freshwater input. AUW3 is the location of the Puget Creek culvert (Figure 17). It is the smallest AU on the west side (approximately 1000 feet). The beach around this area is mainly sand. The beach ends at a heavily armored interface parallel to Ruston Way, surrounding the culvert. The grade of this beach is low to moderate. Within and directly in front of the waters of the Puget Creek culvert are several rich patches of eelgrass. Like the other AUs, this site contains no riparian edge or salt marsh, and has very limited large woody debris. Description of Indicators The THM includes thirty-four indicators and stressors (Table 1), which were presented in the form of a question. Questions 25 and higher are all stressors that when scored lead to a negative multiplier. We divided the indicators into four categories: biological and wood, water quality, geology and geomorphology, and hydrology and shoreline modification. Two to three students chose to focus on each category, and each student became an “expert” in a subset of indicators from their category (Table 1). In all cases, remote data were used to assign an initial score for the indicators if possible. A GIS database with information relevant to this project was created by Bridget Mason of University of Washington, Tacoma. This database included layers from the ShoreZone Inventory from the Washington State Department of Natural Resources, drift cells and environmental information monitoring stations from the Washington Department of Ecology, 2006 NAIP Aerial Photography originated by United States Department of Agriculture National Agriculture Imagery Program and provided by WAGDA (University of Washington), and bathymetry data created by David Finlayson, Ph. D. Candidate, School of Oceanography, University of Washington. Preliminary scores were then validated with field observations on April 28, 2009. The class was divided into two teams, each with at least one expert from each indicator category . The teams focused on either the east or west side of Commencement Bay. The individual indicator methods below were written by the class expert for the given indicator, using Houghton et al. (2003) for background and additional sources as noted. For additional information about these indicators, see Houghton et al. (2003). Question 1: Does AU have vernal or perennial freshwater stream or spring? The presence of a freshwater source will enhance the transition from fresh water to salt water for juvenile salmon. A gradient in salinity will allow the salmon opportunities to select the

6
conditions appropriate to its stage. In addition, freshwater provides extra niches for a diverse prey community. A score was given for this indicator if there was a sufficient amount of fresh water flow from any pipes or springs in the AU. This was done visually in the field. We were careful to determine if a water source was actually freshwater, or seawater draining at low tide. The AU received a positive score if a freshwater source was present. If no streams or springs were available then the AU does not receive any score for this particular question. Question 2: Is littoral area of AU depositional (slow currents, low wave action)? This question focused on whether the sediment was depositional, or muddy and fine grain sediments or rocky and gravely. Locations with fine grain sediment tend to contain more prey for juvenile salmon. This score is based off how much of the littoral area was depositional. The more of an area that was depositional, the better the score. This was done visually, by looking for areas with fine-grained sediment or marsh vegetation. In addition, a local resident on the east side, David Adams, provided anecdotal information about erosion and deposition for eastern AUs.
Question 3: Does AU have refuge from high velocities (e.g., during maximum ebb tide)? This question applies to estuarine areas, and therefore was not scored for this study. A refuge from fast moving water allows salmon to avoid being swept away from fast currents. Question 4: Does AU contain a tidal channel? Tidal channels provide a safe place for juvenile salmon to hide from predators, allow them to remain in the AU during low tide, and provide more feeding ground. Due to the importance of tidal channels for juvenile Chinook salmon, the presence of a tidal channel that remains flooded during mean lower low water (MLLW) yields a multiplier of 1.5. A shallower channel that is flooded during mean sea level (MSL) scored 2 additive points. If there was not a tidal channel for this score the AU simply earned a 0. The presence of a channel was determined visually in the field. Question 5: Is tidal channel dendritc or highly sinuous? Dendritic channels have multiple branches and are most commonly found in mudflat areas. A sinuous tidal channel has one channel with many turns and bends. Increased size of the channel helps for feeding and protection of salmon. If the tidal channel is either one of these then it will receive a score but if it is neither than it will not receive anything. This was determined visually in the field. Question 6: What range of salinity is present in the AU? Salinity is the amount of dissolved substances, which may include organic molecules, minerals, salts, nutrients and gases. Exposure to a range of salinities positively affects the juvenile salmonids because it provides additional niches for their prey. It is also essential for returning salmon to physiologically adjust to a range of salinities in an estuarine environment as they
7
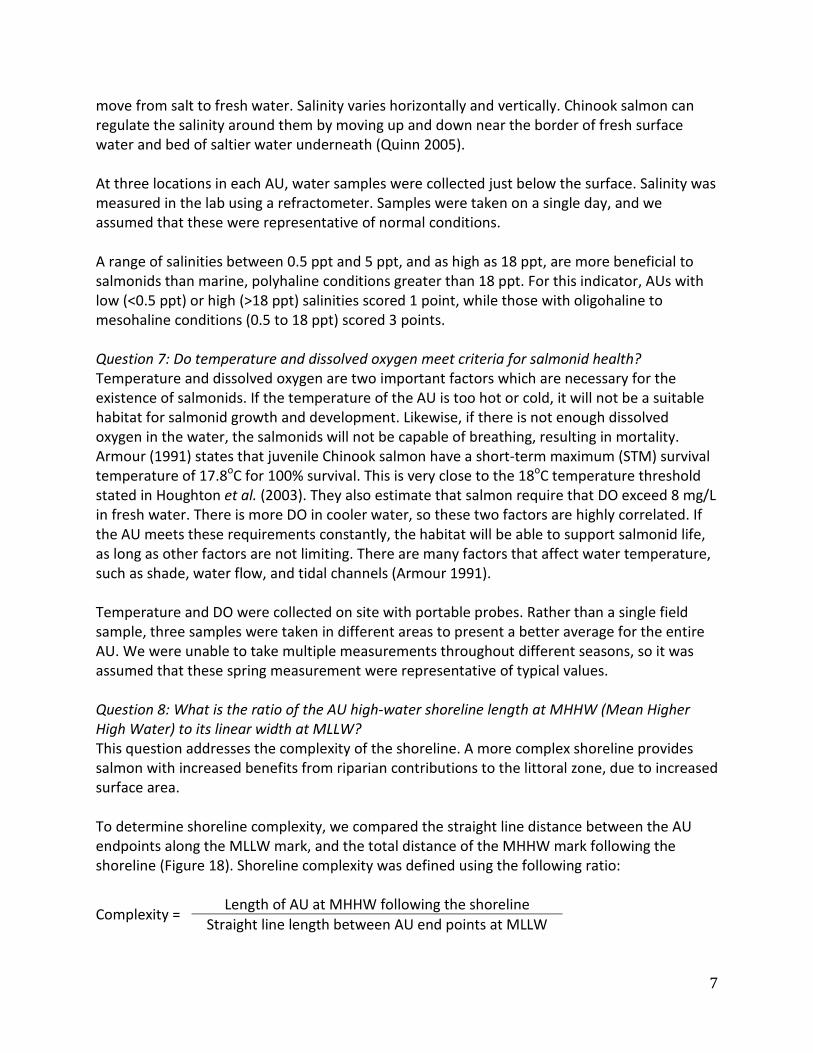
move from salt to fresh water. Salinity varies horizontally and vertically. Chinook salmon can regulate the salinity around them by moving up and down near the border of fresh surface water and bed of saltier water underneath (Quinn 2005). At three locations in each AU, water samples were collected just below the surface. Salinity was measured in the lab using a refractometer. Samples were taken on a single day, and we assumed that these were representative of normal conditions. A range of salinities between 0.5 ppt and 5 ppt, and as high as 18 ppt, are more beneficial to salmonids than marine, polyhaline conditions greater than 18 ppt. For this indicator, AUs with low (<0.5 ppt) or high (>18 ppt) salinities scored 1 point, while those with oligohaline to mesohaline conditions (0.5 to 18 ppt) scored 3 points. Question 7: Do temperature and dissolved oxygen meet criteria for salmonid health? Temperature and dissolved oxygen are two important factors which are necessary for the existence of salmonids. If the temperature of the AU is too hot or cold, it will not be a suitable habitat for salmonid growth and development. Likewise, if there is not enough dissolved oxygen in the water, the salmonids will not be capable of breathing, resulting in mortality. Armour (1991) states that juvenile Chinook salmon have a short-term maximum (STM) survival temperature of 17.8oC for 100% survival. This is very close to the 18oC temperature threshold stated in Houghton et al. (2003). They also estimate that salmon require that DO exceed 8 mg/L in fresh water. There is more DO in cooler water, so these two factors are highly correlated. If the AU meets these requirements constantly, the habitat will be able to support salmonid life, as long as other factors are not limiting. There are many factors that affect water temperature, such as shade, water flow, and tidal channels (Armour 1991). Temperature and DO were collected on site with portable probes. Rather than a single field sample, three samples were taken in different areas to present a better average for the entire AU. We were unable to take multiple measurements throughout different seasons, so it was assumed that these spring measurement were representative of typical values. Question 8: What is the ratio of the AU high-water shoreline length at MHHW (Mean Higher High Water) to its linear width at MLLW? This question addresses the complexity of the shoreline. A more complex shoreline provides salmon with increased benefits from riparian contributions to the littoral zone, due to increased surface area. To determine shoreline complexity, we compared the straight line distance between the AU endpoints along the MLLW mark, and the total distance of the MHHW mark following the shoreline (Figure 18). Shoreline complexity was defined using the following ratio:
Complexity = Length of AU at MHHW following the shoreline
Straight line length between AU end points at MLLW
8
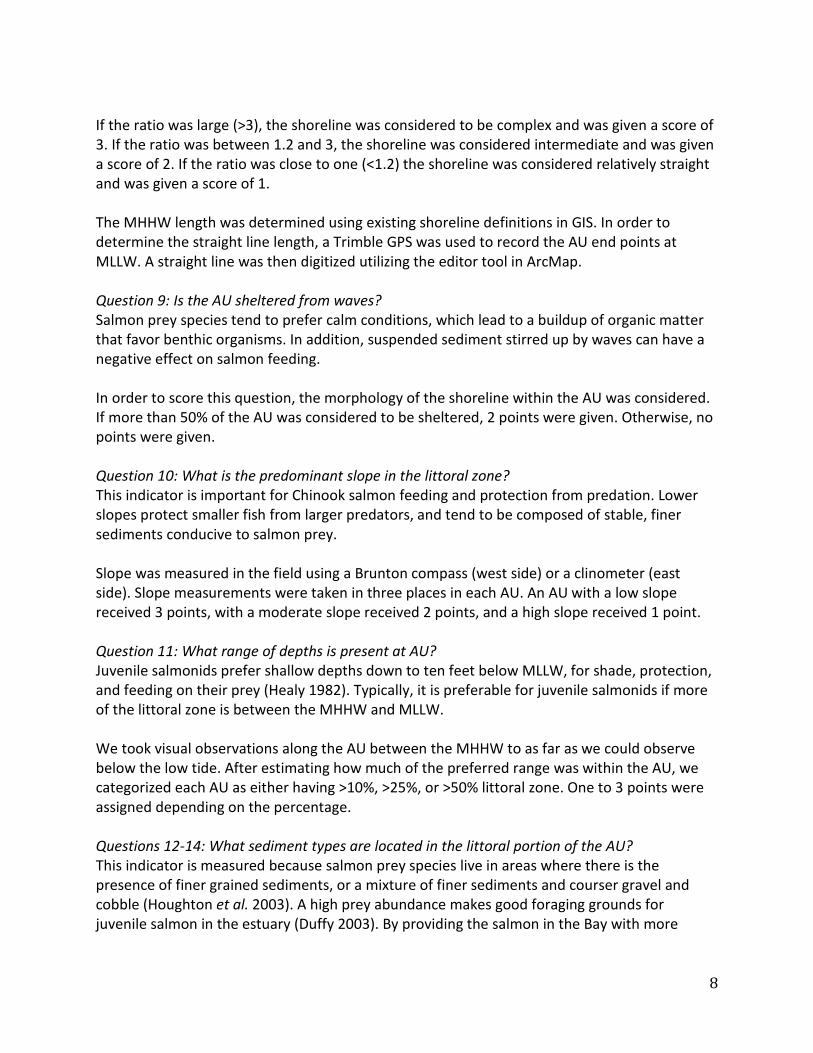
If the ratio was large (>3), the shoreline was considered to be complex and was given a score of 3. If the ratio was between 1.2 and 3, the shoreline was considered intermediate and was given a score of 2. If the ratio was close to one (<1.2) the shoreline was considered relatively straight and was given a score of 1. The MHHW length was determined using existing shoreline definitions in GIS. In order to determine the straight line length, a Trimble GPS was used to record the AU end points at MLLW. A straight line was then digitized utilizing the editor tool in ArcMap. Question 9: Is the AU sheltered from waves? Salmon prey species tend to prefer calm conditions, which lead to a buildup of organic matter that favor benthic organisms. In addition, suspended sediment stirred up by waves can have a negative effect on salmon feeding. In order to score this question, the morphology of the shoreline within the AU was considered. If more than 50% of the AU was considered to be sheltered, 2 points were given. Otherwise, no points were given. Question 10: What is the predominant slope in the littoral zone? This indicator is important for Chinook salmon feeding and protection from predation. Lower slopes protect smaller fish from larger predators, and tend to be composed of stable, finer sediments conducive to salmon prey. Slope was measured in the field using a Brunton compass (west side) or a clinometer (east side). Slope measurements were taken in three places in each AU. An AU with a low slope received 3 points, with a moderate slope received 2 points, and a high slope received 1 point. Question 11: What range of depths is present at AU? Juvenile salmonids prefer shallow depths down to ten feet below MLLW, for shade, protection, and feeding on their prey (Healy 1982). Typically, it is preferable for juvenile salmonids if more of the littoral zone is between the MHHW and MLLW. We took visual observations along the AU between the MHHW to as far as we could observe below the low tide. After estimating how much of the preferred range was within the AU, we categorized each AU as either having >10%, >25%, or >50% littoral zone. One to 3 points were assigned depending on the percentage. Questions 12-14: What sediment types are located in the littoral portion of the AU? This indicator is measured because salmon prey species live in areas where there is the presence of finer grained sediments, or a mixture of finer sediments and courser gravel and cobble (Houghton et al. 2003). A high prey abundance makes good foraging grounds for juvenile salmon in the estuary (Duffy 2003). By providing the salmon in the Bay with more
9
forage grounds it becomes another area of habitat the salmon can feed on their way to open waters. These questions categorize the sediment using a series of questions: Question 12: The littoral zone of the AU has more than 25% of its bottom covered with silty sand (1 point) Question 13: The littoral zone of the AU has 25 to 50% of its bottom covered with mud or mixed fine grain sediments (2 points) Question 14: The littoral zone of the AU has more than 50% of its bottom covered with mud or mixed fine grain sediments (3 points) Note that questions 12-14 can be added together if the percentage falls between two of the questions (Houghton et al. 2003). This means that if the bottom was covered with 80% mud or mixed fine grains that it would score a “yes” under question 13 and question 14 for a total score of 5. Likewise if a substrate has 30% cover in silty sand, 30% cobble and 40% mud and mixed fine grains then it would score a “yes” under question 12 and 13 for 3 points. The substrate types along the shore of Commencement Bay were mapped using ShoreZone data (Washington State Department of Natural Resources). This dataset described the percentage of sand, gravel, mud or other substrates in the area. However, the data were found to be outdated during our field visit. For example, the east side of Commencement Bay was described as uniformly sand and gravel, although we observed that AUE1 was muddy, AUE2 was mixed sand and gravel, and AUE3 was sandy (Figure 19). Due to this inaccuracy, we used only field observations to answer this question. The field examination was during the lowest tide of the spring quarter which provided adequate visibility of the upper littoral zone. This made it possible to view the substrate type which was then examined and scored. Question 15: Is there potential forage fish spawning habitat in the AU? Forage fish are important food sources for juvenile and adult salmon as well as many different species of birds and mammals. Forage fish species include herring, anchovy, sand lance, surf smelt, and Pacific sardine (Bargmann 1998). Many of the nearshore habitats and spawning locations of these species have begun to disappear. This has resulted in a decrease in food sources for both salmon as well as other large fish, which, in turn, has resulted in a decrease in food sources for birds and mammals such as murrelets and seals. Chinook salmon depend on forage fish for nourishment: as much as 65% of their early marine diet is comprised of fish, especially herring (Bargmann 1998). The secondary production of these fish is needed to support the growth of juvenile salmon so that they are better suited for a more demanding marine environment (Simenstad 2000). Forage fish depend on a nearshore habitat for spawning, and spawn high on the beach; which means that they need overhanging vegetation to provide shelter and shade to their eggs.

10
According to a report prepared by the San Juan County Marine Resources Committee (Moulton and Penttila 2000), there are several different spawning times and substrates associated with various species of forage fish. Surf smelt spawn throughout the year, and deposit their eggs on mixed sand and gravel beaches, which comprise a large portion of the shoreline at one of our AUs. Pacific sand lance spawn in the winter, and their spawning sites are marked by characteristic shallow pits in which they deposit their eggs. In addition to sand and gravel beaches, sand lance also spawn on beaches that are purely sand, and surf smelt do not. Herring spawn primarily in the months of January through April, and almost always lay eggs in eelgrass beds or similar substrates. Eelgrass beds, although patchy, are also included in several of our AUs. In order to identify forage fish spawning habitat, remote data interpretation and field visual surveys were conducted. In our available ShoreZone GIS data, although there were not specific locations of forage fish spawning habitat outlined, we were able to look for clues as to their possible locations in the shoreline characteristics that were provided. These data included areas where there was patchy eelgrass, and areas that were sand or sand-and-gravel beaches. Another important characteristic we looked for was shoreline modification, which directly correlates with another feature, riparian vegetation. Where there was extensive shoreline modification, it was likely that nearshore and overhanging vegetation was scarce. These locations were ruled out as viable forage fish spawning habitats. Where there were eelgrass beds, sand and gravel beaches with riparian vegetation, and limited shoreline modification, it was considered likely that the location could be either currently used or restored to be used by forage fish species. Visual surveys of the beach were also conducted. Characteristics of forage fish habitat that we looked for included shallow spawning pits and overhanging riparian vegetation close to the high tide line, as well as eggs themselves (Moulton and Penttila 2000). It was difficult to identify sand lance spawning locations, as the species is not currently laying eggs (they generally spawn in the winter). However, it was still possible to identify whether or not the various AUs could facilitate their spawning, using the signs and characteristics laid out here. Question 16-18: Is there a native vegetative edge below or above ordinary high water? At the interface between brackish marshland and mudflats and the ocean is the intertidal, estuarine zone in which salmon make the sensitive osmoregulatory transition from a freshwater habitat to a saltwater one (Simenstad 2000). Because of the nature of this transition, the quality and characteristics of the interface in which it occurs are important to salmon health. According to Houghton et al. (2003), marshes are a source of food, shelter, and foraging habitat for salmon. If these marshes are narrow or non-existent, riparian shrubs and forests can then provide many significant attributes, such as shade, detritus, and large woody debris, to the water organisms and their habitat. Both areas also house important riparian vegetation. Although any vegetation is beneficial to supplying the water with shade and nutrients, native species are ideal in order to upkeep a more natural marine and terrestrial biodiversity in the local environment.

11
Even though salmon specifically use the salt marsh more so than the inner riparian forest, both play an important role in their health and habitat. According to Simenstad (2000), emergent marsh once united the intertidal and river systems of the Puget Sound. In the past, the biota of marsh in Commencement Bay included primarily sedge, spikerush, and cattail. The floodplain of the marsh also created interconnected tidal channels that salmon would have been able to utilize when overwintering or spending seasons within the transition zone. Another characteristic of these shorelines was the influx of large woody debris due to riparian forests that supplemented the nutrients and created habitat. Small salmon most likely used these marshes, the shelter of the accompanying riparian forest, and eelgrass beds to mature enough to enter the waters outside the Bay, past Brown’s Point. In the ShoreZone GIS files, relevant information for these indicators included the identification of riparian vegetation itself, as well as shoreline characteristics such as salt marsh, sand flats, and sand-and-gravel beach that are useful to salmonids and forage fish. GIS data alone was unable to provide an accurate indication of the width of salt marsh and riparian forest, but it was used to narrow down features and allow for easier identification of indicators in the THM. Field work for this feature involved measuring width of possible salt marsh and riparian scrub-shrub habitats, identifying species of riparian vegetation, and confirming the presence of sources of LWD. It is assumed that salmon would only use the water side edge of emergent marsh, and so in this study only a ten-foot-wide swath of marsh over 50% of the AU was required to receive an answer “yes” to a vegetated edge in question 16. Likewise, a riparian scrub-shrub or forest with a width of over twenty-five feet for 50% or more of the shoreline gained points for the AU in question 17. Another important characteristic to determine was whether the riparian vegetation includes native or non-native species. In order for an AU to receive full functional value for question 16, at least 25% of its available marsh edge must contain native plant species. However, 50% or more of the riparian vegetation must be native to acquire any points for question 18. Question 19: Does the riparian zone of the AU provide a significant source of LWD? This indictor relates to the functions that LWD provides for fish, such as protection from predators, feeding opportunities, and nearshore habitat. Bigger and more mature the LWD is better for salmon because its coverage is greater and more permanent. To be classified as a mature LWD the trees needed to have a diameter at breast height of more than 0.3 m. This question was answered in the field using visual observation. Question 20: Is AU connected to adjacent AU by low-to-moderate-gradient littoral habitat? This question is related to Question 11. The importance of this indicator is that juvenile salmonids need safe and shallow migration pathways for travelling alongshore. A low slope transition between AUs will allow for unhindered movement and not force salmon into deeper waters where they are vulnerable to predation.

12
This indicator was determined in the field. The AU boundaries were examined for armoring, steep dropoffs, or other barriers to along-shore movement along adjacent AUs. In addition, we used the slope measurement we took for Question 11 to objectively determine if a steep slope hindered movement between AUs. Question 21: Does the AU contain significant densities of LWD? LWD in significant densities is an essential part of not just salmon habitat but of the entire nearshore ecosystem. In coastal areas where older more mature forests are present, LWD provides sources of organic material that defines the rivers, compared to younger forests that struggle to provide the necessary habitat for salmon and other marine life (Balian and Naiman 2005). LWD helps protect salmon from predators and enhances feeding. Providing significant densities of LWD in areas for Chinook salmon will provide safe areas where the salmon can feed and use for cover or protection. This question was answered using visual surveys of the beach. According to the THM, a log is considered LWD if it is longer than 10 m with diameter greater than 6 m. We based our answer on the wood present during our field sampling day and were unable to integrate our answer over time. The score was determined by estimating the number of pieces per area of shoreline. Question 22: Does the AU support macroalgal coverage over more than 10% of the littoral area during the spring outmigration period? Algae are an important part of the estuarine and coastal environment, providing the basis of the food chain. Seaweeds serve as habitat for salmon prey. As well, some species of macroalgae can provide safety for young salmon from predators. We found limited existing data on algae distribution in the area, with the exception of kelp and Sargassum, and thus visual observations of the sites in question were made to determine algal presence or absence. During our field visit, we estimated if there was more than 10% algal coverage; this was during the spring when salmon migrate to the ocean. Ephemeral algae, such as Ulva, were included in this estimation. Question 23: Does the AU support eelgrass along the lower intertidal edge? Eelgrass is a type of undersea vegetation that grows in estuaries and shallow bays. It is not seaweed, but a perennial flowering plant capable of growing either by seed or vegetative growth (SSNERR 2009). In the Pacific Northwest, there are two types, a native variety (Zostera marina, which grows in the lower ranges of the intertidal zone) and an exotic variety (Zostera japonica, which prefers the upper reaches) (SSNERR 2009). The abundance of eelgrass acts as a kind of measuring device for the quality of the water, as its presence is influenced by many factors, including but not limited to: physical and chemical disturbance, nutrient availability, turbidity (eelgrass is sensitive to the availability of light) and salinity of the water (SSNERR 2009).

13
The importance of eelgrass to the marine ecosystems in which they are found cannot be overstated. They provide stability for silt and sand, a habitat for many species of invertebrates, diatoms, and algae, are primary producers of the food chain, and feed still more species when they die. Eelgrass beds are considered essential habitat for juvenile salmonids (SSNERR 2009). There is local GIS data on the extent of eelgrass in Commencement Bay as surveyed by the Washington Department of Natural Resources. Results of remote analysis were validated in the field by observing using an Aqua Scope along the lower intertidal. Question 24: Do functioning feeder bluffs provide a significant source of sediment to the AU? A feeder bluff is a cliff wall or bluff outcropping which is eroding and providing fresh sediment due to wave action or other erosion forms (Shaffer et al. 2005). Salmon habitat benefits from local feeder bluffs because they provide a source of sediment to the body of water (Houghton et al. 2003). Feeder bluffs also help facilitate sediment migration from one area to another through tidal action (Shaffer et al. 2005). This is valuable to not only the AU that the feeder bluff is located in, but also surrounding AUs because of the sediment can be transported. Salmon prey species thrive in areas with the right mix of sediment, mud and mixed fine grains, which can be provided from the bluffs. Many of the shorelines along Commencement Bay have been hardened or modified removing the feeder bluffs from functional operation. Arial photographs were examined to find possible feeder bluff locations, which were then observed in person. Feeder bluff information was collected by walking the AU during the field visit to determine if they were present. Since Commencement Bay has been highly modified the potential for functional feeder bluffs was not likely. Question 25: Is the access to the AU by anadromous fish limited? Salmon need access to their habitat a majority of the time to consider it useful. According to the THM, salmon need to be able to utilize the AU at least 50-75% of the time for it to be effective (Houghton et al. 2003). Structures that could reduce access include dikes, culverts, and tide gates. Possible removal of these structures would create access to the AU and would increase its habitable value (Houghton and Roberts 2001). This question is answered based on the percentage of time the area is inaccessible. A high percentage of inaccessibility results in a negative multiplier, ranging from 0.8 to 0.3, which can have large effects on the final score. Accessibility was determined during the field visit. This included visually scanning the low tide area for any obstruction that would make accessibility difficult for the salmonids. This also included looking for dikes, culverts and tide gates. Question 26: Does the AU contain accumulations of wood debris (e.g., bark) over the bottom? The accumulation of wood debris and bark over a river base and the inner coastal floor can have a devastating impact on salmon habitat. The denser the wood matter is on the floor the

14
more of a struggle the salmon will have with feeding, growing and spawning. Specifically, small wood debris can smother salmon prey. We determined the degree of wood accumulation visually, using an Aqua Scope to include the lowest intertidal zone. A negative multiplier was applied if wood debris covered 25-75% of the bottom (x 0.7), and greater than 75% of the bottom (x 0.5). Question 27: Does intertidal log raft storage occur in the AU? Log rafting is where logs are floated together to form a cohesive body. This can have an impact on salmon habitat. At low tide, logs that are grounded can smother the benthic community and compact the sediments. This indicator was scored through aerial photos and visual observation. According to the THM, presence of log rafting over only the last three months should be considered. If log rating affected 10-50% of the area over this time period, a multiplier of 0.7 was applied. If log rafting affected more than half of the area, a multiplier of 0.5 was applied. Question 28: Do water column contaminant concentrations exceed salmonid thresholds for health or survival? Water column contamination affects salmonid health. Toxic water contaminants can injure, kill, and prevent the occurrence and growth of many species, including Chinook salmon. Unfortunately, Johnson et al. (2007) states that estuarine and coastal habitats are among of the most heavily influenced environments by anthropogenic pollutants. They found high concentrations of polychlorinated biphenyls (PCBs), dichlorodiphenyltrichloroethanes (DDTs), and polycyclic aromatic hydrocarbons (PAHs) in the tissues and stomachs of Chinook salmon from all sampling sites in the Pacific Northwest, even those in hatcheries. This being the case, if the contaminant levels exceed the threshold for salmonid survival, mortality is very possible and probable. The THM asks whether the water column contaminant levels exceed this threshold during high and low abundance periods. Logically, if the contaminant level is too high when large quantities of salmonids are present, such as during spawning season, the influence will be great. The effect will not be as significant to the salmonids when their abundance is lower. The scoring in the THM illustrates this difference with multipliers of 0.3 when these exceedances occur with high salmonid abundance and 0.7, with low salmonid abundance. Water samples were collected from the AUs but have not been tested to determine if toxins are present in significant quantities. In addition, we found no existing water column contaminant data in our AUs. Due to the lack of data, we assumed that all of our AUs did not exceed contaminant standards for salmonids. In the future, water quality monitoring should be initiated in this area to properly answer this question.
15
Question 29: Do AU sediments contain contamination at levels that may affect salmonid health or affect their prey base? Toxic contaminants in sediment can lead to severe health risks for salmonids and their prey. Acceptable levels of sediment contamination in the State of Washington are defined by the Department of Ecology in sediment quality standards (SQS) and cleanup screening levels (CSLs). These standards are based on responses of benthic infauna that are not part of the salmonid food web. We did not collect or analyze sediment samples. We therefore assumed that the sediments in our AUs were not contaminated. This assumption should be tested in the near term to more fully assess these habitats. There is some evidence that Commencement Bay in general is becoming less polluted, according to the Washington State Department of Ecology (DOE 2009a). In November of 2000, they found that soil and groundwater contamination levels at Taylor Way Properties (Figure 20a) were low enough to no longer affect human health, Commencement Bay, or the environment. This is a big improvement since Taylor Way Properties was one of sites that made up the Commencement Bay Superfund site (DOE 2009). Questions 30-31: Does AU shoreline include riprap or vertical bulkheads extending below MHHW? Do riprap or bulkheads extend below mean sea level over the majority of the hardened AU shoreline? Riprap and other bulkhead have negative impacts on the shoreline. Shoreline armory increases predation on young salmon while migrating along the shore and replaces natural littoral habitats that salmon rely upon. The bulkhead also affects erosion at their location. This question was answered with visual observations. If shoreline armoring that extends below MHHW for 10-50% of the shoreline, a multiplier of 0.8 was applied; if it was greater than 50%, a multiplier of 0.7 was applied. In addition, if the majority of the armored shoreline extends below mean sea level (approximately +6 feet above MLLW), an additional multiplier of 0.8 was applied. Question 32: Does the AU have one or more finger pier or marginal wharfs? Piers and docks might interfere with salmon migration along the shore, either by slowing or stopping their migration, or pushing them out into deeper waters where they are more vulnerable to predation. This effect is not well studied, however. The number and size of piers and wharfs was determined using the GIS database. This information was validated in the field. The presence of a single pier or dock (greater than eight feed wide) was given a multiplier of 0.9, while multiple docks or at least one large pier or dock (greater than 25 feet wide) was given a multiplier of 0.8. Question 33: Is more than 10% of the AU littoral area covered with over water structures more than 8 feet wide?

16
Like question 32, overwater structures can affect salmon migratory patterns and feeding. These overwater structures can disturb and disrupt fish migratory patterns by pushing them into deeper water or slowing their migration. Many salmon prey species live on the bottom of the seafloor and feed on autotrophs that require sunlight to grow. Overwater structures can inhibit their growth. This question was scored along with Question 32. This question also produces negative multiplier depending upon how much of the littoral zone is covered with overwater structures, categorized by percentage (10-30%, x 0.8; 30-50%, x 0.7; 50-75%, x 0.6; >75%, x 0.5). Question 34: Is the AU’s littoral zone regularly disturbed by propeller scour, oil spills, or dredging? These disturbances affect salmon health and feeding in many ways. Regular use of propellers in the littoral zone can be harmful to marsh vegetation and the benthic environment. Vegetation that is routinely being severed or detached by propellers and their wash will not be able to grow to its full potential, nor will it be able to support the habitat. Propellers can also stir up fine-grained sediment, making it more difficult for benthic organisms to settle or perform daily functions. Oil spills not only affect the benthic layer, but all organisms in or around the water through contamination of water, sediment, and food. Dredging distresses the environment similarly to propeller scouring; however, not only is the habitat being disturbed, it and some of the species living in it are being removed. Disturbing or removing the natural sediment and the benthic organisms changes the habitat’s ability to function properly, especially in terms of the food web. All three of these disturbances can limit the amount of benthic organisms, and therefore food for salmonids. This question was answered in the field by determining if there was evidence of frequent boat use, oil sheens, or dredging of the AU. If the AU was shallow enough to be disturbed by propeller wash or has oil sheens on the shoreline water affecting 25% or more of the AU on a regular basis, or if dredging occurred at least once every six years, this question was answered with a “yes”. Results A summary of the final AU scores can be found in Table 2. For a more complete table of scores for each indicator, see Appendix A. East Side Results Geology/Geomorphology The shoreline is very straight along AUE1, so the ratio that we found indicated a shoreline complexity of <1.2, which scores a 1 on the report. The slope is on average 3 degrees in this AU making it low gradient, scoring a 3. More than 50% of this AU is considered to be in the littoral zone, which scores a 3 on the report. A score of 3 was given since the substrate in this AU was mud or mixed fine grain sediments on over 50% of the AU. This AU was very muddy which

17
made walking into the littoral zone difficult. Although we did not measure the north adjacent side to this AU it still would have connected to it by a low to moderate gradient in the littoral zone. This gave it a score of 3 on connectivity. We did not find any feeder bluffs along the AU boundary. There are many piers and docks in this AU, but they do not interfere with the immigration and emigration. AUE2 was similar to AUE1 in that the shoreline was straight (complexity <1.2, score of 1), the slope was gradual (average of 6 degrees, score of 3), and the majority was within the littoral zone (> 50%, score of 3). This area of the shoreline had around 25-50% cover in mud or mixed fine grain sediments, only granting 2 points to the report. It was difficult to determine the distribution of substrates in this AU since it stretched for a large distance of shoreline. However, the substrate was relatively homogeneous along the shoreline, making estimation possible. The AU is able to connect to other AUs on both sides giving it 3 points towards the final report. In this AU there were very small bluffs, but they were not providing a significant amount of sediment to the habitat. Therefore we determined that there were not any feeder bluffs in this location. The access to this AU is not hampered by anything along the shoreline. The shoreline complexity and range of depths was similar in AUE3 as the rest of the east side. The slope within this AU was very low with an average of 1.5 degrees across the littoral zone, which also yielded 3 points. In this AU there was silty sand and mud or mixed fine grained sediments covering more than 50% of the area, leading to a combined score of 3. On the south side of this AU is the beginning of the Hylebos Waterway. It is blocked by a concrete wall which means that the AU can only be connected to other AUs on one side. This scores a 1 in the THM. In this AU there were also very small bluffs, but they were not providing a significant amount of sediment to the habitat. Therefore no feeder bluffs were scored in this location. There is nothing along the shoreline of the AU to block access to anadromous fish. Hydrology/Shoreline Modification In AUE1 there was one perennial water source that is submerged at high tide. The sediment in the first AU was highly depositional, extremely muddy in the littoral zone. There was a small amount of bulkheading in this AU, which lead to a negative multiplier of 0.8. Another stressor that led to a negative multiplier was the presence of overwater structures in this AU, most notably the floating docks in the marina. In AUE2 there were multiple perennial springs and pipes with flowing freshwater. The second AU was much more gravely and not depositional. There was some bulkheading in this AU, which scored a negative multiplier of 0.8. There were several houses with docks that were considered overwater structures, leading to another negative multiplier. In AUE3 there were only two perennial water sources. The third AU was not depositional either and was highly erosive. There was no bulkheading or overwater structures found in this AU. This was the only AU in our study that had a tidal channel. This was an important indicator because AUE3 received a multiplier of 1.5 which raised its score compared to the other units significantly. This tidal channel was considered to be “sinuous”.

18
All of the AUs were sheltered from wave action. Commencement Bay works as a cove protecting the entire region from high velocity waves coming in from the ocean. Only high wind speeds and tidal forces lead to higher wave discharge. In many of the AUs there was additional shelter from waves. For instance, AUE1 had a marina to catch the impact of waves. AUE2 had log rafting that could absorb some impact from the waves. Lastly AUE3 was slightly protected by the mouth of the Hylebos waterway. All three AUs received a score of 0 for this question. We did not answer Question 3 (refuge from high velocities), since this indicator is to be used in estuaries and we did not have the proper habitat to evaluate this. All of the AUs for this question received a score of 0. Biology/Wood In AUE1, there was no significant potential for fish spawning habitat. We felt that the lack of clean gravel and sand, the woody debris and other garbage, and the dominance of muddy terrain precluded the possibility of fish spawning here. There was neither marsh present nor any species typical to wetlands. The shoreline possessed no riparian vegetation but was mainly artificial bulkheads, docks, and buildings. We were not able to survey the deeper reaches of the AU due to the rising tide and being encumbered by the mud, but there was no eelgrass that was visible and it is doubtful that any was present due to the debris and the terrain. Algae was present, but had well under 10% coverage, being confined to a small patch of gravel in the upper part of the AU. We did not find any significant sources of large woody debris within this AU, although there was a thick layer of smaller wood litter on the bottom. In AUE2, there were locations that seemed suitable for fish spawning habitat. It was not certain how clean the beach was, but the physical terrain type was within the typical profile of spawning sites. As in the previous AU, there were no marshes and no wetland flora. However, we did observe a swath of riparian vegetation, mostly scrub-shrub but some trees, that occupied between 25 and 50% of the shoreline. A significant portion of the plants were non-native, with Himalayan blackberry, Scotch broom, and English ivy all present. There was a fair amount of seaweed, mostly green algae, both above and below the water. Due to the size of the AU, it was difficult to decide if it occupied more than 10% of the littoral area, but the most experienced researchers judged that it did. There was no eelgrass sighted. There was a significant amount of large woody debris in the area. There was some wood litter on the bottom, but not covering more than a quarter of the area. This AU had some log rafting, but the logs are being removed from the area. In AUE3, there was a great deal of sand but too little gravel to provide a good site for fish spawning. A large number of shellfish occupied the lower regions of the AU. There were neither marshes nor marsh plants, as in the previous 2 AUs. We did observe a riparian boundary that occupied the greatest portion of the shoreline of the three AUs surveyed, covering over 50% of the landward edge. It was not dominated by natives, as we expected. The water was clearer than at the other two AUs, but there still was not any eelgrass visible and in this case no algae as well, there being little gravel or other rocks for it to grow on. There was a significant amount
19
of large woody debris in the area, including parts of some large cedar trees that had been cut up and removed as salvage. Water Quality The water temperature in all three East side AUs was well below the salmonid threshold of 18˚C, with an average of 12.1, 11.6, and 12.5oC for AUE1, AUE2, and AUE3 (Table 3). With this, the DO was considerably higher than the 8 mg/L minimum. All three AUs were mesohaline (Table 4), averaging 15, 14, and 17 ppt for AUE1, AUE2, and AUE3, respectively. The pH data can be found in Table 5. We did not collect water contamination data for our AUs, so they were given a score as if there were no significant levels of current contamination. Ridolfi Inc. has been monitoring Commencement Bay, including recent water quality testing at Squally Beach, just south of our East Side study areas (Figure 20b). In their 2008 report (Ridolfi 2009), they document that surface water at this site exceeded standards in copper, nitrogen, phosphorus, and fecal coliform. Like water pollution levels, we did not collect sediment contamination data for our study area. Ridolfi Inc. monitoring in 2006 at nearby Squally Beach indicated that only one sediment contaminant at Squally Beach exceeded guidelines, butylbenzylphthalate, which is a semi-volatile organic compound (Ridolfi and Adolfson 2006). Total Scores AUE1 received a low total score of 7.5 (Figure 21). The AU was littered with wood debris, completely armored with a sea wall, and constantly affected by a marina. There was little algal cover, no eelgrass, no riparian habitat and not spawning habitat. The sediment was fine grained, but it was embedded with debris made mostly from small pieces of wood from an old mill that was once located near this site. AUE2 obtained a higher but still low score of 12.2.This site had some riparian vegetation, algal cover, and large woody debris and its ability to sustain forage fish spawning. The beach was gravely but had some patchy spots of sand which could prove useful for sand smelt and other feeder fish. Although there are some positive characteristics of this AU, there were also some notable stressors. The immediate and most noticeable feature of this area is log rafting, although there was anecdotal evidence that this feature is in the process of being removed. This site had many pipes of unknown sources. There was a pipe in the middle of the AU with a diameter of about three to four feet which could be the source of some contamination. There were houses along the beach that were supported by pillars that held them over the water. AUE3 had the highest score in our study, 45.9. This area is a decades-old mitigation site (commonly known as Skookum Wulge), and had a notable tidal channel across the shoreward boundary. In addition to the tidal channel, silty sediment, larger riparian shrub area, and a lack of pilings, docks, overwater structures, and log rafting resulted in its elevated score. However,

20
we were unable to measure contaminants in this area, and therefore these possible stressors were not included in our score. West Side Results Geology/Geomorphology In AUW1, it was found that the ratio of length of the MHHW boundary to width at MLLW was <1.2, which scored a 1 in the THM. The slope of the substrate in the littoral zone was greater than 10h:1v, a low gradient, scoring a 3 on the grading scale. The AU had >25% within the littoral zone, which scored a 2. For questions 12-14 there was no score, because there were no substantial levels of silty sand or mud/mixed fine grains. Because the continuity with adjacent sites consisted of high gradient intertidal, no score was given. There were no current functioning feeder bluffs in AUW1, yielding no score. Immigration/emigration is restricted 10%-15% of the time, less than the threshold for this stressor, yielding no score. AUW2 was also relatively straight, scoring a 1 for shoreline complexity. The slope of the substrate in the littoral zone was high, > 5h: 1v, but > 2h: 1v, scoring a 1. Due to the sharp drop off, around 10% of AU was littoral, scoring only 1 for this indicator. Because there were no substantial levels of silty sand or mud/mixed fine grains, no score was given for substrate. AUW2 had low to moderate gradient intertidal continuity with adjacent AU on one side but not the other, which scored a 1 on the grading scale for the indicator. There were no current functioning feeder bluffs found in AUW2. AUW2 is also not restricted from immigration/emigration more than 25% of the time, yielding no score for this stressor. Like the other western AUs, AUW3 was relatively straight, scoring a 1 for complexity. The slope of substrate in littoral zone was moderate, which scored a 2 on the grading scale. More than 50% of the AU was littoral, which scored a 3 in the THM for the range of depths indicator. There was mud or mixed fine grained sediment in 25-50% of the area, yielding 2 points. There was continuity along the intertidal on the AUW2 side, but the other side was restricted with concrete. The AU scored 1 point for this indicator. Immigration and emigration were not restricted more than 25% of the time, yielding no score for this stressor. Hydrology/Shoreline Modification AUW1 has experienced quite a bit of shoreline modification, as the upper shoreline is backed onto Ruston Way, and is bulkheaded with riprap revetments along its length. The shoreline is armored along more than 50% of the shoreline, with the majority of the riprap dipping below MSL. This led to two negative multipliers, of 0.7 and 0.8 for questions 30 and 31. There is also a pier and overwater structures in this area that led to two additional negative multipliers of 0.9 and 0.7 for questions 32 and 33. There is a non-navigable freshwater spring flowing from the rocks, as shown in Figure 12; however, it provides no migration route for young salmon, as it flows out from a small source that goes under Ruston Way. AUW2 has the most modified shoreline of any of the AUs, and is primarily riprap revetment along its length, extending all the way into the sea. This AU also received two negative multipliers for armoring along the majority of the shore with most below MSL. There was one

21
pier that contained many pilings and occupied a large area over the water (Figure 16), leading to additional negative multipliers. Mason Creek empties into this AU through a smaller culvert that flows under Ruston Way. This AU is also sheltered due to its angle in the Bay. AUW3 is the site adjacent to the Puget Creek culvert, shown in Figure 17. There was fairly heavy bulkheading above and around the culvert, leading to two negative multipliers. There was a small overwater structure (Figure 22) that led to a negative multiplier. Due to the presence of fine-grained sediments, we felt that the area was depositional over 25% of the area, adding 2 points to the score. This area was also considered sheltered like the other western AUs. None of the western AUs contained a tidal channel, and all were considered to have a refuge from high velocities and waves by Commencement Bay itself. Biology/Wood Unfortunately, the western AUs contained virtually no native marsh edge, as well as very limited riparian vegetation, due to a large area of heavily armored and manmade shoreline. In the first section of AUW1, shown in Figure 11, the slope of the shore is slight, but there is no riparian or marsh edge and the substrate is silty or comprised of large, human-placed rocks. There is a possibility that sand lance or surf smelt might spawn here, but the AU offers little in the way of protection aside from a limited amount of large woody debris. It is unlikely that forage fish currently use this site for spawning. Algal growth is present but very limited here, and there is no eelgrass in the area. There were no sources of LWD from a riparian zone. There was approximately 0.5 piece of LWD present every thirty meters of shoreline on average. Small wood debris had a presence at this site, but not enough to cover 25% or more of the area. Log rafting did not have significant presence at this site. AUW2 offers little opportunity for either salmonid habitat or forage fish spawning habitat, as the steep drop off does not contain much intertidal area and the high, sheer bank does not contain any feeder bluffs. Eelgrass is not present, though there is limited algal growth. It also did not contain a riparian or marsh edge. There were no sources of LWD from a riparian zone. There was approximately 0.2 piece of LWD present every thirty meters of shoreline on average. Small wood debris had a presence at this site, but not enough to cover 25% or more of the area. Log rafting did not have significant presence at this site. Visible on the rocks in AUW3 are mussels and heavy patches of rockweed. Within and around the Puget Creek culvert opening we could see patches of eelgrass. This site, according to Sherrie Duncan, a scientist who monitors fish in the area for Ridolfi Inc., is a confirmed forage fish spawning habitat, especially for sand lance (Figure 23). Riparian forest and marsh edge are absent, and there is limited large woody debris with no current source or feeder bluff to supply additional logs. This site is the most promising for restoring forage fish spawning habitat, and potentially juvenile salmon habitat. There were no sources of LWD from a riparian zone. There was approximately 0.2 piece of LWD present every thirty meters of shoreline on average. Wood

22
debris had a presence at this site, but not enough to cover 25% or more. Log rafting did not have significant presence at this site. Water Quality Salinity measurements taken from AU1W, AU2W, AU3W indicated that all three western AUs were polyhaline, with salinity between 18-30 ppt (Table 4). Sediment and water column contaminant testing was not done, although water samples were taken. The temperature measurements taken at each AU met criteria for salmonid health (Table 3). The dissolved oxygen was relatively high as well, since the readings were above the range for our probe. Total Scores The total score for AUW1 was 7.8, which is relatively low in comparison to several of our other AUs. A lack of forested edge, eelgrass, tidal channels, and continuity with adjacent habitat, as well as the presence of overwater structures, contributed to this low score. The total score that AUW2 garnered was the lowest of all the studied AUs at 7.2, due in large part to its entirely manmade shoreline. There is a freshwater source here, but there was not intertidal area, and immigration or migration would be restricted if the site were used by salmonids. Compared to the other western AUs, AUW3’s score of 16.1 was relatively high due largely to confirmed eelgrass beds in the vicinity, forage fish spawning habitat, relative shelter from wind and waves, and the littoral area being depositional. The score is still low, overall, because of the heavy shoreline modification and lack of feeder bluffs, tidal channels, and riparian vegetation. Because of the existing restoration being conducted on upper Puget Creek, this site would be a possible restoration opportunity in conjunction with the existing work being done. Discussion Comparison with Other Sites in Pierce County Although the THM scores are meant to be used to compare relatively similar sites, it is illustrative to compare our scores to those found by Houghton et al. (2003) in the Key Peninsula, Gig Harbor, Islands Watershed (Figure 1). In that report, the average score of the 413 AUs was 51.0, with a standard deviation of 36.4. The minimum score found was 6.8 and the maximum was 193.5. Our six AUs scored quite low compared to these sites (Figure 24). Our best AU, E3, ranked 191 out of 413. Our three worst-scoring AUs, W1, E1, and W2, ranked 413, 416, and 417. It is clear that Commencement Bay habitat is highly modified and has a number of stressors that degrade the habitat quality for Chinook salmon, most notably armoring and overwater structures. However, it is known that these salmon use the Puyallup River as spawning ground, and local juveniles need suitable marine habitat for their first year. There is ample evidence that juvenile fish spend a significant amount of time in Commencement Bay (Olson et al. 2008, Ridolfi 2009).
23
Therefore, this analysis allows managers to determine which of the areas in Commencement Bay has the most potential to support these fish. Suggested Restoration or Conservation Actions The scores that have been acquired in this study have a number of uses. They will inform the managers and policy makers of areas where restoration and conservation projects can improve the habitat for salmon. Alternatively it could indicate to them that the area is too degraded and attention would be better spent elsewhere. In most cases, improving the habitat for salmon will also increase other important marine species and biodiversity in general. The eastside is a relatively undeveloped area, compared to the rest of Commencement Bay and has the most potential for providing quality salmon habitat. Because of its limited shoreline modification, riparian edge, dendritic tidal channel, low gradient, perennial freshwater, and large woody debris, AUE3 is our best salmon habitat in the Bay. It is documented that young salmon utilize this area (Olson et al. 2008, Ridolfi 2009). We recommend that this area be considered for additional restoration activities. Eelgrass could be planted in this area, and the riparian zone could be restored with native plants. We heard reports that the tidal channel, which was created as part of an earlier restoration project, is not functioning well. A high resolution tidal height map and study of channel usage by salmon would elucidate whether this is an issue that needs action. We are concerned about the possibility of sediment and water contamination at this site, due to its history and proximity to industrial activity. We recommend that a contamination study be conducted here and action taken to remediate any pollution issues. In addition, trash removal and protection from damage from boating activities would be easy ways improve the site. Although AUE2 had a relatively low THM score, it is just north of AUE3 and there is possible connectivity between the two sites. Conservation of site AUE3 and restoration of site AUE2 would provide a larger littoral habitat for juvenile salmon in Commencement Bay. We therefore recommend some actions AUE2. Although removal of overwater structures is recommended, most of these are part of private homes that are unlikely to be removed in the near future. We believe that some less drastic improvements would go a long way in providing salmon habitat without causing serious economic and social conflict. Removal of log rafting, old pilings, and wood chips in this area would help restore this habitat. There is some riparian habitat in this AU, but it is dominated by non-native species. Restoration with native plants would help improve habitat quality and would also be an aesthetically pleasing change in the area. According to our results, AUW3 has the best conditions for salmon habitat of the AUs on west side of Commencement Bay. It is recommended that the remaining pilings and concrete blocks along the beach be removed, as they pose degradation to the habitats of AUW3. In addition, the creek culvert and the area around it could be improved with soft shore armoring and a more natural transition from creek to sound. The activities of the Puget Creek Restoration Society, plus the existing eelgrass beds in this area, make it a good candidate for restoration. Removal of riprap and the establishment of native riparian vegetation would be a large
24
undertaking, but worth the cost because of the work that is already being done on the upper creek habitat; this as a project would have far-reaching benefits for the health of the Bay. Lower priority restoration areas include AUW1, which could be restored by removing the small wood debris, pilings, and the concrete blocks still left on the beach. This site may not be as easy to restore as other AUs mentioned above, but with work it could become a useful beach habitat. AUW2 and AUE1 are our most impacted AUs and the least likely to benefit from restoration activities. The former is the site of some well-established restaurants that are built on pilings above the water, and the latter is an active marina. However, both of these sites have value because they are adjacent to higher quality habitat, and could be improved if not restored with some small actions. In AUE1, the wood debris should be removed and native vegetation should be planted to encourage salmon habitat in the area. The active feeder bluff that is north of the marina provides a mix of sediments for salmon prey species. There are some general actions that if taken throughout Commencement Bay would improve the quality of the habitat. Eelgrass restoration in the Bay would be very helpful for improving the quality of the habitat for salmon. Most of the AUs had a number of abandoned creosote pilings that are likely leaching toxins into the environment and serve little purpose ecologically or economically. These should be removed wherever possible, starting with those in the highest quality AUs. The existing riprap revetments should be replaced with soft shore armoring, and native riparian communities should be planted along the water’s edge wherever possible. In addition to existing trash that could be removed with citizen beach cleanups, many of our AUs were plagued with small wood debris that was deposited decades ago from past lumber activities. Removal of this unnecessary debris would have ecological and aesthetic benefits. We also recommend actions that reduce the total contaminant load throughout Commencement Bay to improve water and sediment available to salmon. Most of these recommendations are large projects that would take serious commitment from the citizens of Tacoma, but we think they are worthwhile endeavors that should be encouraged. Future Studies This assessment was completed during a ten-week quarter, and much work remains to be done. We were only able to take basic water quality measurements, such as temperature, salinity, dissolved oxygen, and pH, one time during the spring. Establishing stations with constant data collection for these parameters would be useful for all researchers in Commencement Bay. A less ideal but cheaper alternative is to manually monitor these parameters monthly. Water temperature and DO could be measured in warmer months, since if temperature and DO measurements are under critical thresholds for salmonid health in warmer months, the cooler months should not present any problems since the temperature will be lower, thus the DO, higher (Houghton et al. 2003). It was outside the scope of this conservation biology class to analyze water and sediment samples for contaminants. We believe that contamination monitoring, especially in our highest

25
quality AUs, should be done. The lack of chemical data was the biggest weakness of the current study and could potentially affect our results. More extensive surveys of eelgrass beds and fish use of these habitats should be conducted. Eventually, bulk samplings of sediments that reflect an accurate representation of forage fish egg survival and numbers should be done. Our class assessed a small part of the Bay, and future classes should complete the assessment for the rest of the EMU. Habitat assessments should also be implemented multiple times to better understand trends over time of this continually changing area. A cost-benefit analysis of the restoration activities recommended here compared to the expected improvements to salmonid habitat would need to be conducted. If restoration is undertaken in the area, monitoring will be necessary to ensure that these efforts are successful. The studies should be conducted in biology and chemistry related courses at the University of Washington Tacoma under the guidance of the faculty and staff. Conclusion The habitat in Commencement Bay has improved significantly since being declared a Superfund site, decades ago. This assessment is an objective evaluation of the quality of this area for Chinook salmon that are currently returning to the Puyallup River. We feel that it is important not to give up on this area, and hope that this study will help to target specific areas and stressors to focus restoration efforts. Once contaminants are removed and the land and water is clean once again, the hope is that the region will be able to support more wildlife, and that the Puget Sound’s native species of plant and animal life, such as the Chinook salmon, will start to restore their depleted numbers. But the true scope of the damage is so extensive that the work to restore the Bay to a pristine ecological condition is just beginning. With continued legislation and cleanup efforts, perhaps someday Commencement Bay can be restored to the beauty and vitality it once had, before human hands poisoned its land and water. Acknowledgements We would like to thank everyone who helped us with this assessment and participated in our class: Tom Kantz (Pierce County), David Adams, Leslie Ann Rose (Citizens for a Healthy Bay), Sherrie Duncan (Ridolfi Inc.), Rick Fuller (City of Tacoma), Stephen Atkinson (City of Tacoma), Anita Fichthorn (Port of Tacoma), Sue Mauermann (Port of Tacoma), Joel Baker (UW Tacoma and Puget Sound Partnership), Carrie Little (Mother Earth Farms), Peter Selkin (UW Tacoma), Shandra.O'Haleck (NMFS), and Scott Hanson (Puget Creek Restoration Society). Course development was supported with a Curriculum Enhancement Grant from the UWT Center for

26
Leadership and Social Responsibility. We acknowledge Sherrie Duncan and Tom Kantz for their review of this document. GIS Data Sources: ShoreZone Inventory provided by Washington State Department of Natural Resources, Aquatics Division. Drift Cells and Environmental Information Monitoring Stations provided by Washington Department of Ecology. 2006 NAIP Aerial Photography originated by United States Department of Agriculture National Agriculture Imagery Program and provided by WAGDA, University of Washington, Seattle, WA. Bathymetry data created by David Finlayson, Ph. D. Candidate, School of Oceanography, University of Washington, Seattle, WA. Bare Earth Digital Elevation Model of the Puget Sound Lowlands provided by the Puget Sound Lidar Consortium, 2002. Ridolfi Inc. provided unpublished water quality data, including analytical results for metals, pesticides, SVOCs, VOCs, tributyltin and conventional parameters (2006) and surface water analytical results for detected constituents at the Commencement Bay restoration sites (2008). References Cited Armour, C.L. 1991. Guidance for evaluating and recommending temperature regimes to protect fish.
Biological Report 90(22): 1-13.
Balian, E.V. and R.J. Naiman. 2005. Abundance and production of riparian trees in the lowland floodplain of the Queets River, Washington. Ecosystems. 8(7): 841-861.
Bargmann, G. 1998. Forage fish management plan: A plan for managing the forage fish resources and fisheries of Washington. Prepared for Washington Fish and Wildlife Commission: Olympia WA. Available from: http://wdfw.wa.gov/fish/forage/manage/foragman.pdf
[DOE] Washington State Department of Ecology. Accessed June 2009. Taylor Way Properties. Available from: http://www.ecy.wa.gov/programs/tcp/sites/taylor/taylor.html
[DOE] Washington State Department of Ecology. Accessed June 2009a. Toxics Cleanup in Commencement Bay: History. Available from: http://www.ecy.wa.gov/programs/tcp/sites/commBay/commBayHist.html
Duffy, E.J. 2003. Early marine distribution and trophic interactions of juvenile salmon in Puget Sound [PhD dissertation]. Seattle WA, University of Washington.
Duker, G., Whitmus, C., Salo, E.O., Grette, G.B., and Schuh, W.M. 1989. Distribution of juvenile salmonids in Commencement Bay, 1983. Prepared for Port of Tacoma: Seattle WA. FRI-UW-8909. Available from: https://digital.lib.washington.edu/xmlui/bitstream/handle/1773/4111/8908.pdf?sequence=1
Healy, M.C.1982. Juvenile Pacific salmon in Estuaries: the Life Support System. In V.S. Kennedy (ed.), Estuarine Comparisons. Academic Press: New York NY.

27
Houghton J. and P. Roberts. 2001. The Snohomish salmon overlay–a tool for regional habitat restoration planning. Prepared by the City of Everett and Pentec Environmental, Inc.: Edmonds WA. Available from: http://whatcomsalmon.whatcomcounty.org/documents/psat/3c_hough.pdf
Houghton, J., J.E. Hagen, J. Fabbri, C. Ruedebusch, and A. MacLennan. 2003. Key Peninsula, Gig Harbor, and Islands Watershed Nearshore Salmon Habitat Assessment. Prepared for Pierce County Public Works and Utilities. 12570-01.
Johnson, L.L., Ylitalo, G.M., Arkoosh, M.R., Kagley, A.N., Stafford, C., Bolton, J.L., Buzitis, J., Anulacion, B.F., and T.K. Collier. 2007. Contaminant exposure in outmigrant juvenile salmon from Pacific Northwest estuaries of the United States. Environmental Monitoring and Assessment 124(1-3):167–194.
Lantor, J.K., and R.C. Qlark, Jr. 1999. Restoration case study: Commencement Bay natural resource damage assessment restoration actions. In OCEANS '99 MTS/IEEE: Riding the Crest into the 21st Century. 2:822-826. DOI: 10.1109/OCEANS.1999.804931
Moulton, L.L. and D.E. Penttila. 2000. Forage fish spawning distribution in San Juan County and protocols for sampling intertidal and nearshore regions. Prepared for the San Juan County Forage Fish Assessment Project: Friday Harbor WA. Available from: http://www.sjcmrc.org/reports/sjc_forage_protocols.pdf
Olson, O.P., L. Johnson, G. Ylitalo, C. Rice, J. Cordell, T.K. Collier, and J. Steger. 2008. Fish habitat use and chemical contaminant exposure at restoration sites in Commencement Bay, Washington. U.S. Prepared for National Oceanographic and Atmospheric Administration. NOAA Tech. Memo. NMFS-NWFSC-88. Available from: http://www.nwfsc.noaa.gov/assets/25/6761_04162008_152110_CommencementBayTM88Final.pdf
[PSP] Puget Sound Partnership. c2008, accessed June 2009. Puget Sound Facts. Available from: http://www.psparchives.com/puget_sound/psfacts.htm
Quinn. 2005. The Behavior and Ecology of Pacific Salmon and Trout. University of Washington Press: Seattle WA. 378 pp.
[Ridolfi and Adolfson] Ridolfi Inc. and Adolfson Associates, Inc. 2006. Year 5 (2006) Monitoring Report for Commencement Bay Habitat Restoration Sites. Prepared for the Commencement Bay Natural Resource Damage Assessment and Restoration Trustees.
[Ridolfi] Ridolfi Inc. 2009. Year 7 (2008) Monitoring Report for Commencement Bay Habitat Restoration Sites. Prepared for the Commencement Bay Natural Resource Damage Assessment and Restoration Trustees.
Shaffer, J.A., L. Ward, P. Crain, B. Winter, K. Fresh, and C. Lear. 2005. Elwha and Glines Canyon dam removals: nearshore restoration and salmon recovery of the central Strait of Juan de Fuca. Proceedings of the 2005 Puget Sound Georgia Basin Research Conference. Available from: http://www.engr.washington.edu/epp/psgb/2005psgb/2005proceedings/papers/C4_SHAFF.pdf
Simenstad, C.A. 2000. Commencement Bay aquatic ecosystem assessment: ecosystem-scale restoration for juvenile salmon recovery. Prepared for City of Tacoma, Washington Department of Natural

28
Resources, and US Environmental Protection Agency. SoF-UW-2003. Available from: https://digital.lib.washington.edu/xmlui/handle/1773/4558
[SSNERR] South Slough National Estuarine Research Reserve. Accessed June 2009. TIDES Eelgrass Fact Sheet. Available from: www.oregon.gov/DSL/SSNERR/tides/tidesA13_eelgrassfacts.pdf
TCW Economics. 2008. Economic analysis of the non-treaty commercial and recreational fisheries in Washington State. Prepared for Washington Department of Fish and Wildlife: Olympia WA. Available from: http://wdfw.wa.gov/commission/econ_analysis.html
[USFWS] U.S. Fish and Wildlife Service. Accessed June 2009. Threatened and Endangered Species System. Available from: http://ecos.fws.gov/tess_public/TESSBoxscore
[WDFW] Washington Department of Fish and Wildlife. 1997. Policy of Washington Department of Fish and Wildlife and Western Washington Treaty Tribes Concerning Wild Salmonids. WDFW: Olympia WA. Available from: http://wdfw.wa.gov/fish/wsp/joint/final/finalwsp.pdf

29
Table 1. Questions that describe the indicators and stressors that make up the Tidal Habitat Model (Houghton et al. 2003). Each member of the class became an “expert” on a set of questions, that were broken into categories.
# Question Score Experts Category
1 AU has vernal or perennial
freshwater stream or spring 3 Staci/Travis
Hydrology/Shoreline Modification
2a AU is depositional (slow currents,
low wave action) over 25% of littoral area
2 Staci/Travis Hydrology/Shoreline
Modification
2b AU is depositional (slow currents,
low wave action) over 50% of littoral area
3 Staci/Travis Hydrology/Shoreline
Modification
3 AU has refuge from high velocities
(e.g., during max. ebb) 3 Staci/Travis
Hydrology/Shoreline Modification
4a AU contains a natural tidal channel
wetted at MLLW X1.5 Staci/Travis
Hydrology/Shoreline Modification
4b AU contains tidal channel wetted at
MSL (i.e., shallow drainage) 2 Staci/Travis
Hydrology/Shoreline Modification
5 Tidal channel is dendritic or highly
sinuous 3 Staci/Travis
Hydrology/Shoreline Modification
6a Fresh water only (salinity < 0.5 ppt) 1 Jamie/Shristi Water Quality
6b Oligohaline to Mesohaline (sal.
variable: often 0.5 to 5 ppt, but can range to 18 ppt)
3 Jamie/Shristi Water Quality
6c Polyhaline (sal. typically 18 to 30
ppt) 1 Jamie/Shristi Water Quality
7a Temp/DO meet criteria for salmonid
health during major use periods 2 Jamie/Shristi Water Quality
7b Temp/DO meet criteria for salmonid
health at all times 3 Jamie/Shristi Water Quality
8a Ratio of length of MHHW boundary
to width at MLLW > 3 (include islands)
3 Shawn/Mitchell Geology/Geomorphology
8b Ratio of length of MHHW boundary to width at MLLW 1.2 to 3 (include
islands) 2 Shawn/Mitchell Geology/Geomorphology
8c Ratio of length of MHHW boundary
to width at MLLW < 1.2 (include islands)
1 Shawn/Mitchell Geology/Geomorphology
9 AU is sheltered from waves 2 Staci/Travis Hydrology/Shoreline
Modification
10a Slope of substrate in littoral zone >
10h:1v (i.e., low gradient) 3 Shawn/Mitchell Geology/Geomorphology
10b Slope of substrate in littoral zone
<10h:1v but >5h:1v (i.e., moderate) 2 Shawn/Mitchell Geology/Geomorphology
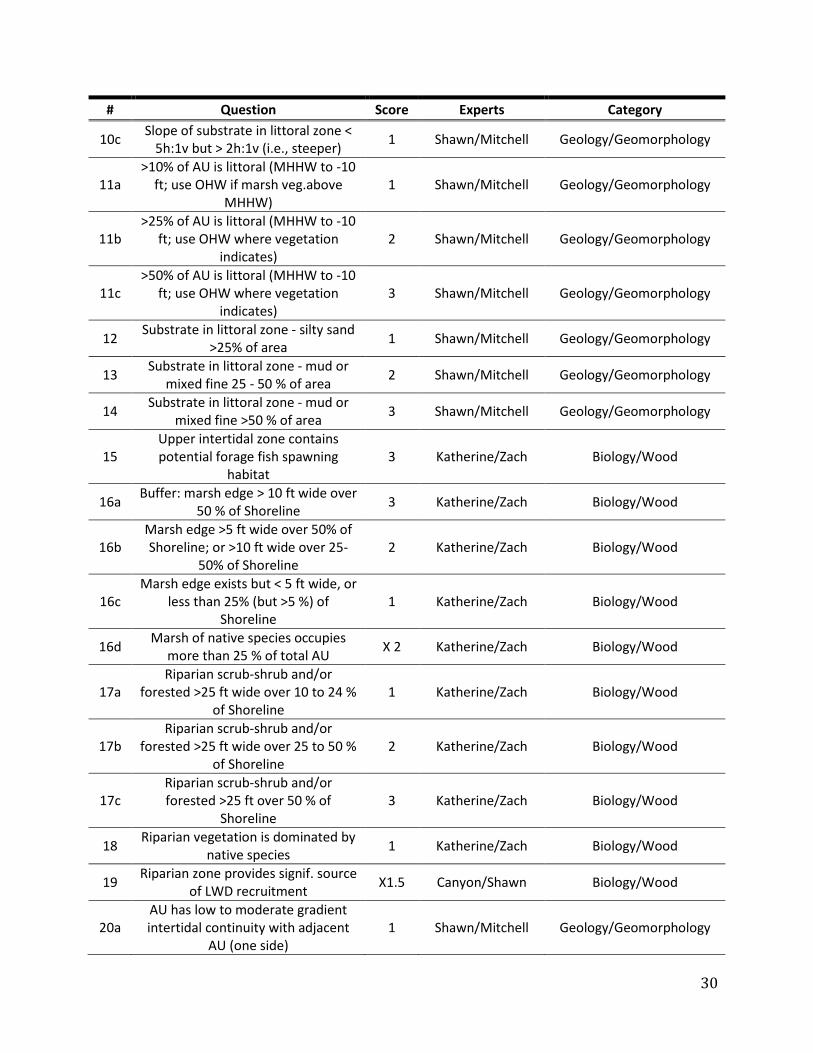
30
# Question Score Experts Category
10c Slope of substrate in littoral zone <
5h:1v but > 2h:1v (i.e., steeper) 1 Shawn/Mitchell Geology/Geomorphology
11a >10% of AU is littoral (MHHW to -10
ft; use OHW if marsh veg.above MHHW)
1 Shawn/Mitchell Geology/Geomorphology
11b >25% of AU is littoral (MHHW to -10
ft; use OHW where vegetation indicates)
2 Shawn/Mitchell Geology/Geomorphology
11c >50% of AU is littoral (MHHW to -10
ft; use OHW where vegetation indicates)
3 Shawn/Mitchell Geology/Geomorphology
12 Substrate in littoral zone - silty sand
>25% of area 1 Shawn/Mitchell Geology/Geomorphology
13 Substrate in littoral zone - mud or
mixed fine 25 - 50 % of area 2 Shawn/Mitchell Geology/Geomorphology
14 Substrate in littoral zone - mud or
mixed fine >50 % of area 3 Shawn/Mitchell Geology/Geomorphology
15 Upper intertidal zone contains potential forage fish spawning
habitat 3 Katherine/Zach Biology/Wood
16a Buffer: marsh edge > 10 ft wide over
50 % of Shoreline 3 Katherine/Zach Biology/Wood
16b Marsh edge >5 ft wide over 50% of Shoreline; or >10 ft wide over 25-
50% of Shoreline 2 Katherine/Zach Biology/Wood
16c Marsh edge exists but < 5 ft wide, or
less than 25% (but >5 %) of Shoreline
1 Katherine/Zach Biology/Wood
16d Marsh of native species occupies
more than 25 % of total AU X 2 Katherine/Zach Biology/Wood
17a Riparian scrub-shrub and/or
forested >25 ft wide over 10 to 24 % of Shoreline
1 Katherine/Zach Biology/Wood
17b Riparian scrub-shrub and/or
forested >25 ft wide over 25 to 50 % of Shoreline
2 Katherine/Zach Biology/Wood
17c Riparian scrub-shrub and/or forested >25 ft over 50 % of
Shoreline 3 Katherine/Zach Biology/Wood
18 Riparian vegetation is dominated by
native species 1 Katherine/Zach Biology/Wood
19 Riparian zone provides signif. source
of LWD recruitment X1.5 Canyon/Shawn Biology/Wood
20a AU has low to moderate gradient intertidal continuity with adjacent
AU (one side) 1 Shawn/Mitchell Geology/Geomorphology
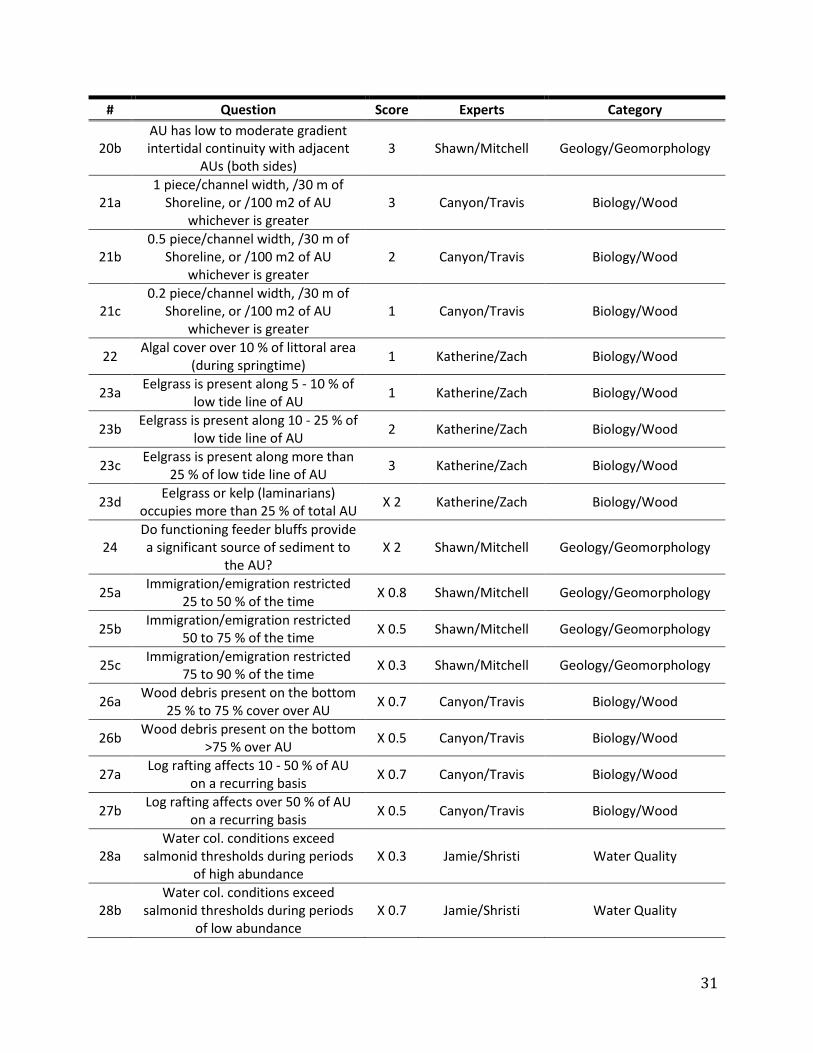
31
# Question Score Experts Category
20b AU has low to moderate gradient intertidal continuity with adjacent
AUs (both sides) 3 Shawn/Mitchell Geology/Geomorphology
21a 1 piece/channel width, /30 m of
Shoreline, or /100 m2 of AU whichever is greater
3 Canyon/Travis Biology/Wood
21b 0.5 piece/channel width, /30 m of
Shoreline, or /100 m2 of AU whichever is greater
2 Canyon/Travis Biology/Wood
21c 0.2 piece/channel width, /30 m of
Shoreline, or /100 m2 of AU whichever is greater
1 Canyon/Travis Biology/Wood
22 Algal cover over 10 % of littoral area
(during springtime) 1 Katherine/Zach Biology/Wood
23a Eelgrass is present along 5 - 10 % of
low tide line of AU 1 Katherine/Zach Biology/Wood
23b Eelgrass is present along 10 - 25 % of
low tide line of AU 2 Katherine/Zach Biology/Wood
23c Eelgrass is present along more than
25 % of low tide line of AU 3 Katherine/Zach Biology/Wood
23d Eelgrass or kelp (laminarians)
occupies more than 25 % of total AU X 2 Katherine/Zach Biology/Wood
24 Do functioning feeder bluffs provide a significant source of sediment to
the AU? X 2 Shawn/Mitchell Geology/Geomorphology
25a Immigration/emigration restricted
25 to 50 % of the time X 0.8 Shawn/Mitchell Geology/Geomorphology
25b Immigration/emigration restricted
50 to 75 % of the time X 0.5 Shawn/Mitchell Geology/Geomorphology
25c Immigration/emigration restricted
75 to 90 % of the time X 0.3 Shawn/Mitchell Geology/Geomorphology
26a Wood debris present on the bottom
25 % to 75 % cover over AU X 0.7 Canyon/Travis Biology/Wood
26b Wood debris present on the bottom
>75 % over AU X 0.5 Canyon/Travis Biology/Wood
27a Log rafting affects 10 - 50 % of AU
on a recurring basis X 0.7 Canyon/Travis Biology/Wood
27b Log rafting affects over 50 % of AU
on a recurring basis X 0.5 Canyon/Travis Biology/Wood
28a Water col. conditions exceed
salmonid thresholds during periods of high abundance
X 0.3 Jamie/Shristi Water Quality
28b Water col. conditions exceed
salmonid thresholds during periods of low abundance
X 0.7 Jamie/Shristi Water Quality

32
# Question Score Experts Category
29a Sediment chemical contam. present (> SQS over more than 25% of AU)
X 0.8 Jamie/Shristi Water Quality
29b Sediment chemical contam. present
(>CSL over more than 25% of AU) X 0.6 Jamie/Shristi Water Quality
30a Riprap or vertical bulkheads extend below MHHW for 10 - 50 % of shore
X 0.8 Staci/Travis Hydrology/Shoreline
Modification
30b Riprap or vertical bulkheads extend below MHHW along >50 % of shore
X 0.7 Staci/Travis Hydrology/Shoreline
Modification
31 Majority of riprapped or bulkheaded Shoreline extends below MSL (+6 ft
MLLW) X 0.8 Staci/Travis
Hydrology/Shoreline Modification
32a Finger pier or dock >8 ft wide X 0.9 Staci/Travis Hydrology/Shoreline
Modification
32b Two or more finger piers or docks >8 ft wide; or single pier or dock >25 ft
wide X 0.8 Staci/Travis
Hydrology/Shoreline Modification
33a Overwater structures cover 10 to 30
% of littoral area in AU X 0.8 Staci/Travis
Hydrology/Shoreline Modification
33b Overwater structures cover 30 to 50
% of littoral area in AU X 0.7 Staci/Travis
Hydrology/Shoreline Modification
33c Overwater structures cover 50 to 75
% of littoral area in AU X 0.6 Staci/Travis
Hydrology/Shoreline Modification
33d Overwater structures cover > 75 %
of littoral area in AU X 0.5 Staci/Travis
Hydrology/Shoreline Modification
34 Littoral benthic habitat routinely
disturbed by prop wash, chronic oil spills, or dredging
X 0.9 All Hydrology/Shoreline
Modification

33
Table 2. Summary of total scores as determined by the Tidal Habitat Model in Commencement Bay. Detailed scores can be found in Appendix A.
AU Total Score
E1 7.5 E2 12.2 E3 45.9 W1 7.8 W2 7.2 W3 16.1
Table 3. Average of three replicate temperature samples collected in each AU in Commencement Bay on April 28, 2009.
AU Temperature
(oC)
E1 12.1 E2 11.6 E3 12.6 W1 11.1 W2 11.9 W3 12.3

34
Table 4. Average of three replicate salinity samples collected in each AU in Commencement Bay on April 28, 2009.
AU Salinity
(ppt)
E1 15 E2 14 E3 17 W1 25 W2 28 W3 23
Table 5. Average of three replicate pH samples collected in each AU in Commencement Bay on April 28, 2009.
AU pH
E1 7.8 E2 8.1 E3 8.1 W1 8.0 W2 8.3 W3 8.3

35
Figure 1. Map of Western Washington showing location of Commencement Bay. The KGI region studied in Houghton et al. (2003) is highlighted.
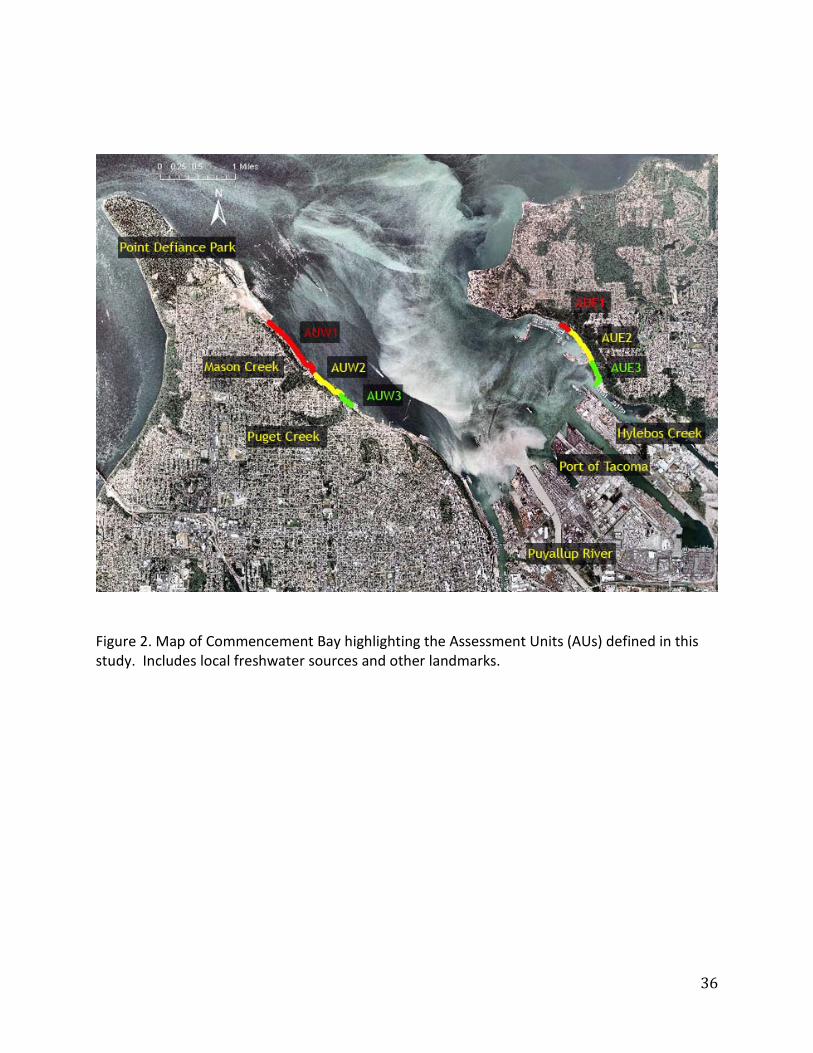
36
Figure 2. Map of Commencement Bay highlighting the Assessment Units (AUs) defined in this study. Includes local freshwater sources and other landmarks.
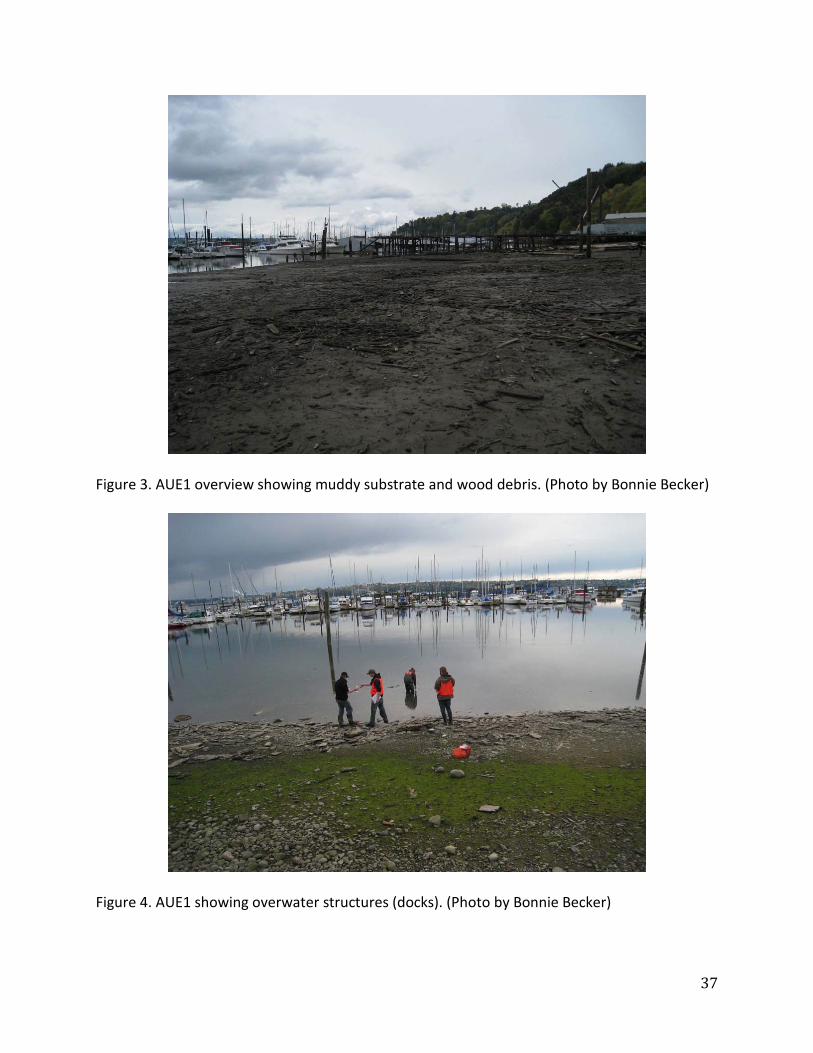
37
Figure 3. AUE1 overview showing muddy substrate and wood debris. (Photo by Bonnie Becker)
Figure 4. AUE1 showing overwater structures (docks). (Photo by Bonnie Becker)
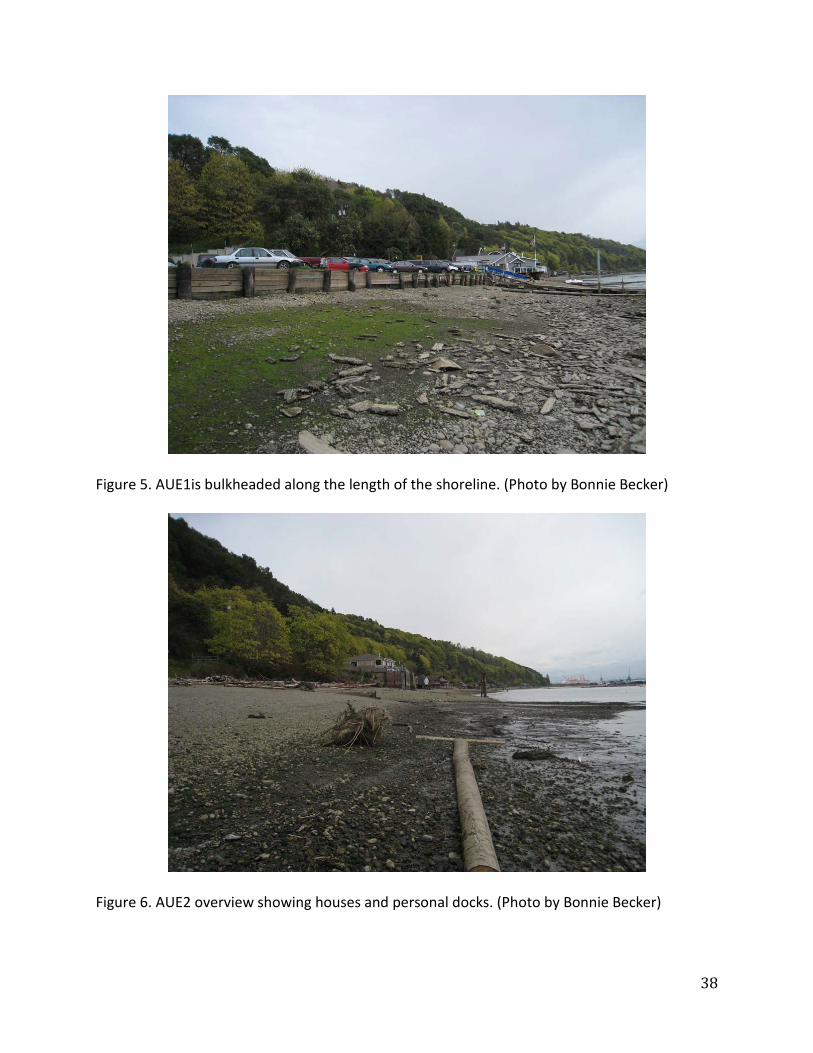
38
Figure 5. AUE1is bulkheaded along the length of the shoreline. (Photo by Bonnie Becker)
Figure 6. AUE2 overview showing houses and personal docks. (Photo by Bonnie Becker)

39
Figure 7. AUE2 substrate ranges from medium cobble to fine mud. (Photo by Bonnie Becker)
Figure 8. Riparian habitat in AUE2 is dominated by invasive species. (Photo by Bonnie Becker)
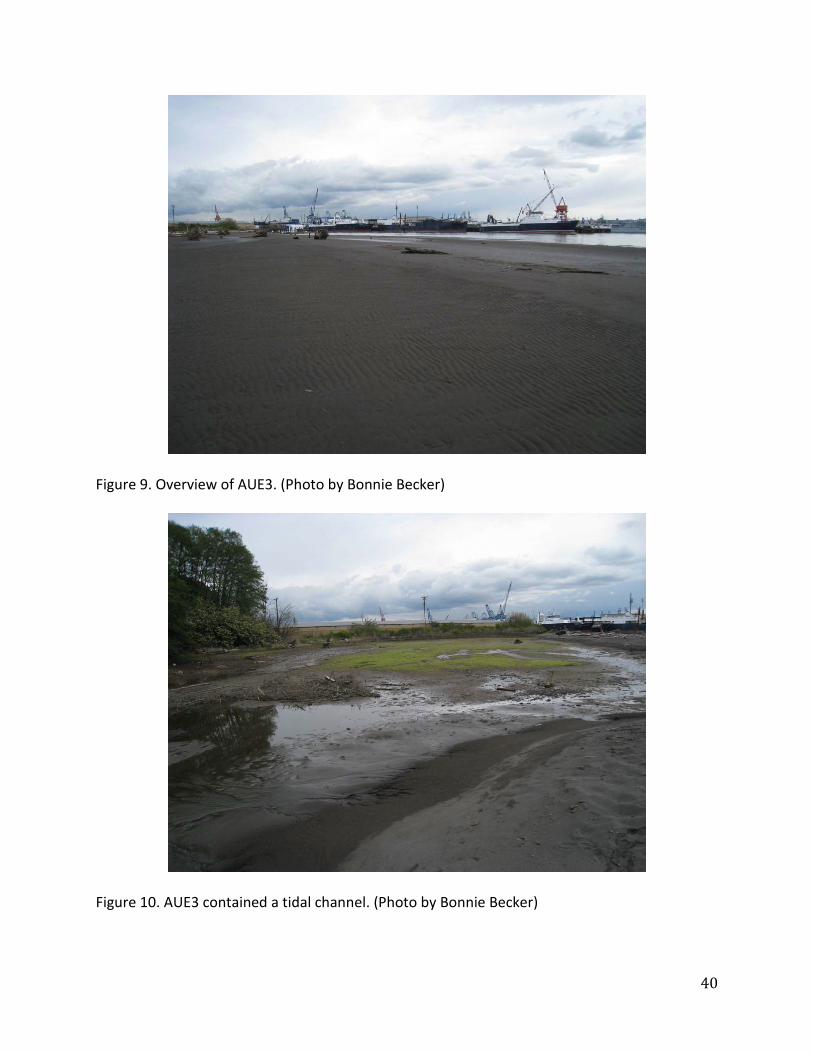
40
Figure 9. Overview of AUE3. (Photo by Bonnie Becker)
Figure 10. AUE3 contained a tidal channel. (Photo by Bonnie Becker)

41
Figure 11. AUW1 overview. (Photo by Canyon Little)
Figure 12. Small freshwater springs in AUW1. (Photo by Canyon Little)

42
Figure 13. Old pilings and wood debris in AUW1. (Photo by Canyon Little)
Figure 14. Trash found in AUW1. (Photo by Canyon Little)
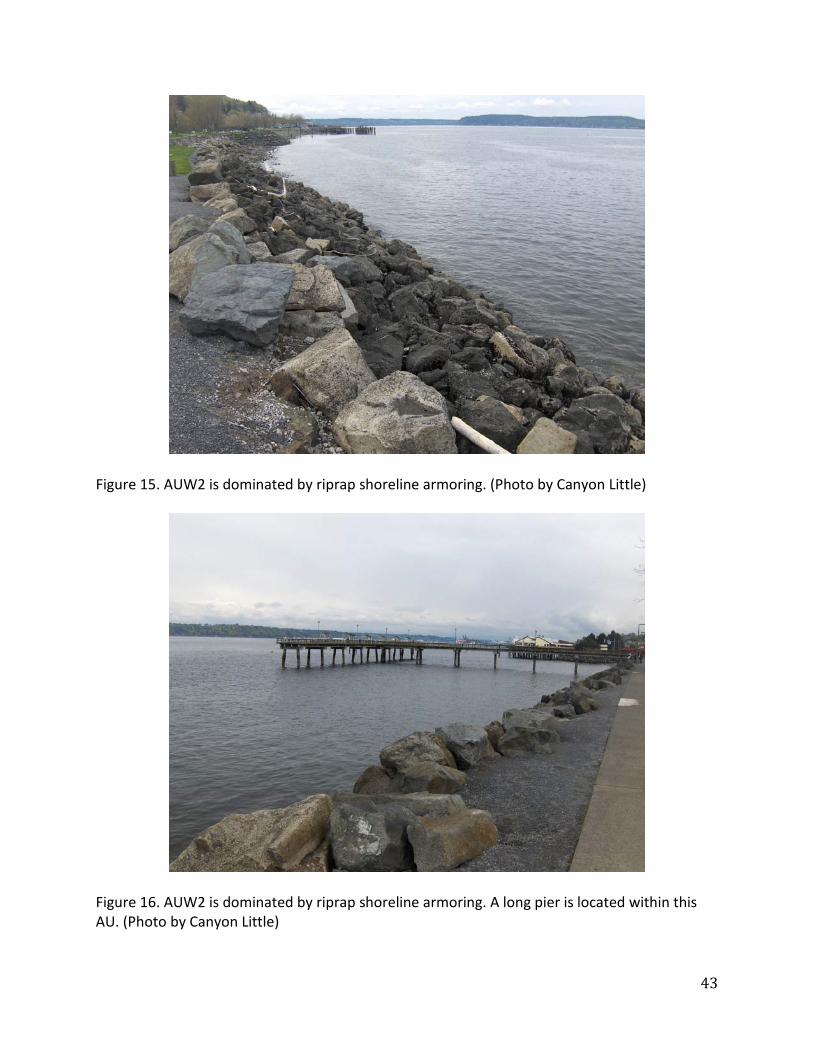
43
Figure 15. AUW2 is dominated by riprap shoreline armoring. (Photo by Canyon Little)
Figure 16. AUW2 is dominated by riprap shoreline armoring. A long pier is located within this AU. (Photo by Canyon Little)
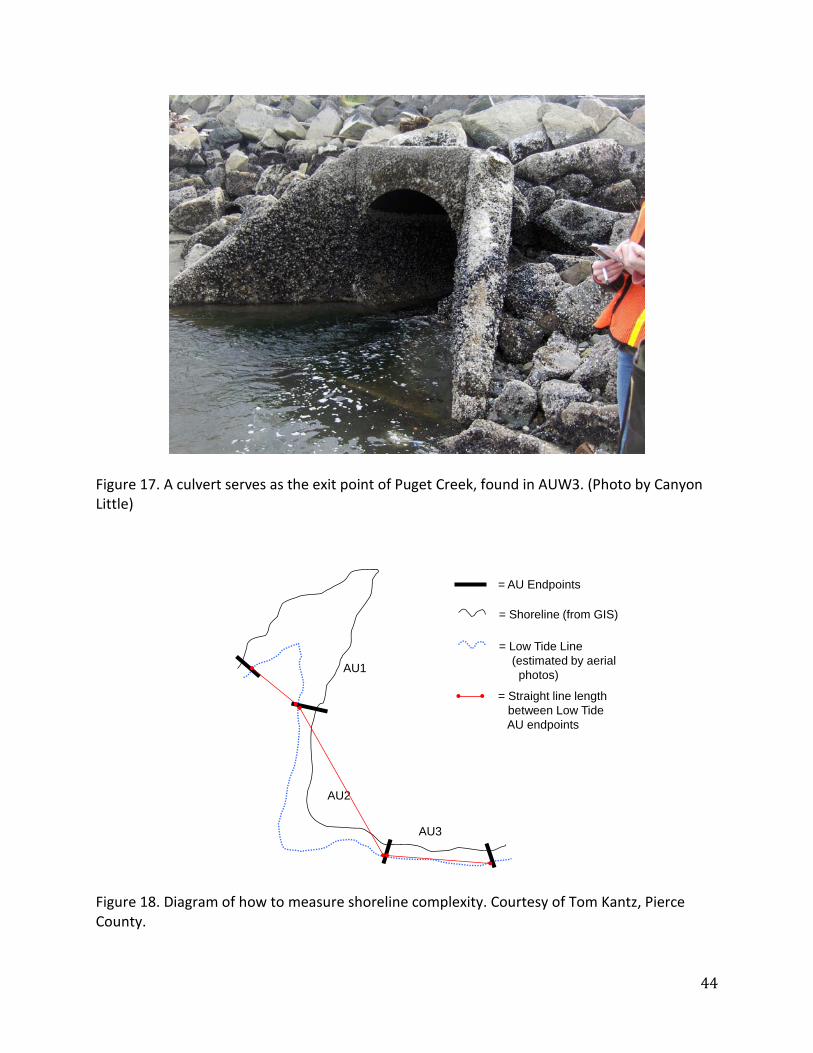
44
Figure 17. A culvert serves as the exit point of Puget Creek, found in AUW3. (Photo by Canyon Little)
= AU Endpoints
= Shoreline (from GIS)
= Low Tide Line(estimated by aerial
photos)AU1
AU2
AU3
= Straight line lengthbetween Low TideAU endpoints
Figure 18. Diagram of how to measure shoreline complexity. Courtesy of Tom Kantz, Pierce County.

45
Figure 19. Difference between existing substrate data from the ShoreZone Inventory (Washington Department of Natural Resources) and observed substrate types in Commencement Bay.
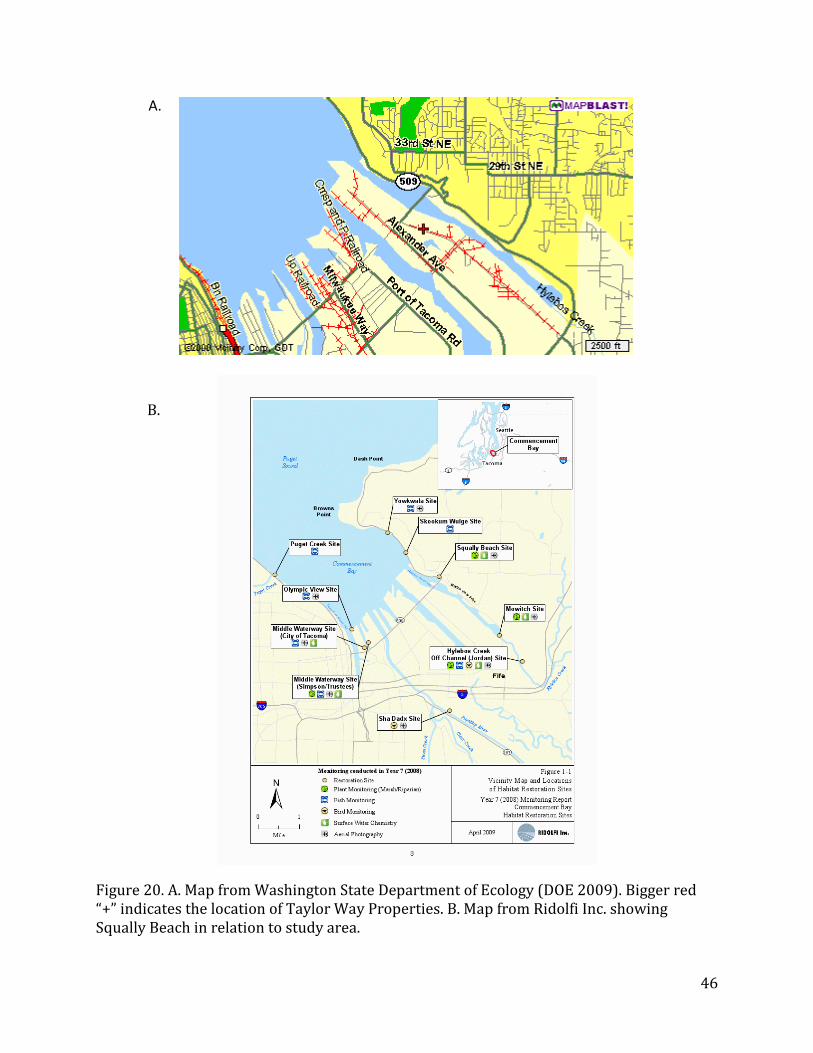
46
A.
B.
Figure 20. A. Map from Washington State Department of Ecology (DOE 2009). Bigger red “+” indicates the location of Taylor Way Properties. B. Map from Ridolfi Inc. showing Squally Beach in relation to study area.
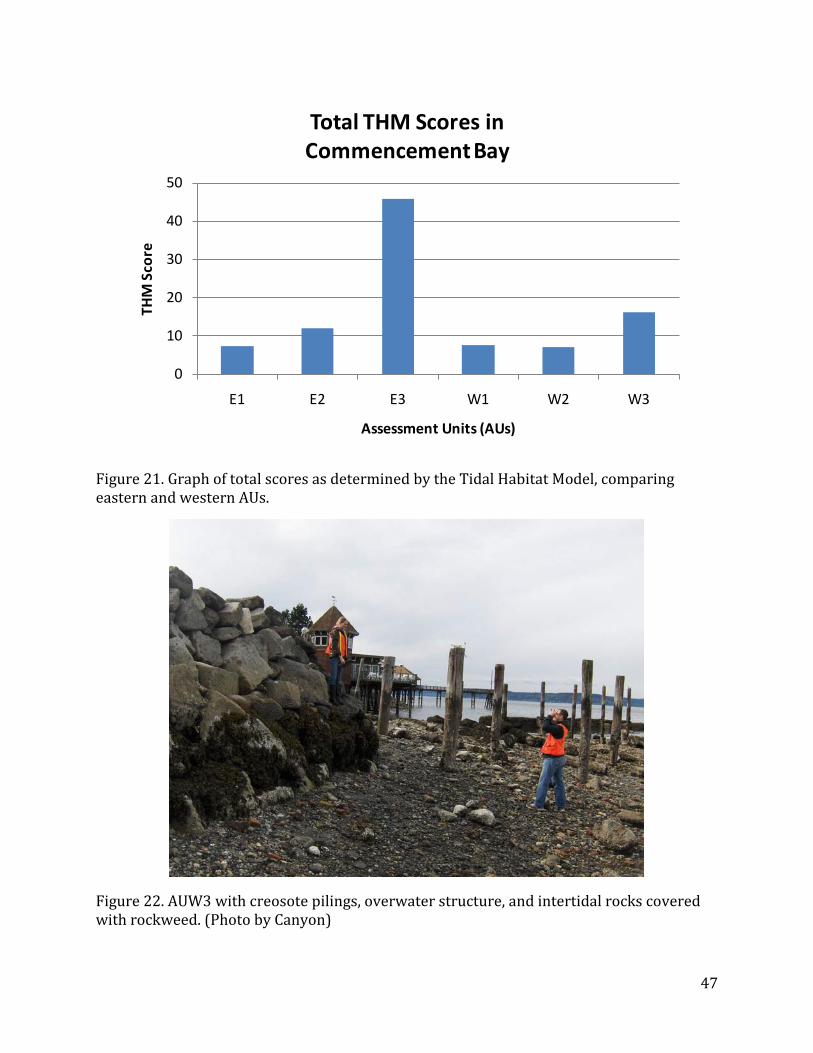
47
0
10
20
30
40
50
E1 E2 E3 W1 W2 W3
THM
Sco
re
Assessment Units (AUs)
Total THM Scores in Commencement Bay
Figure 21. Graph of total scores as determined by the Tidal Habitat Model, comparing eastern and western AUs.
Figure 22. AUW3 with creosote pilings, overwater structure, and intertidal rocks covered with rockweed. (Photo by Canyon)
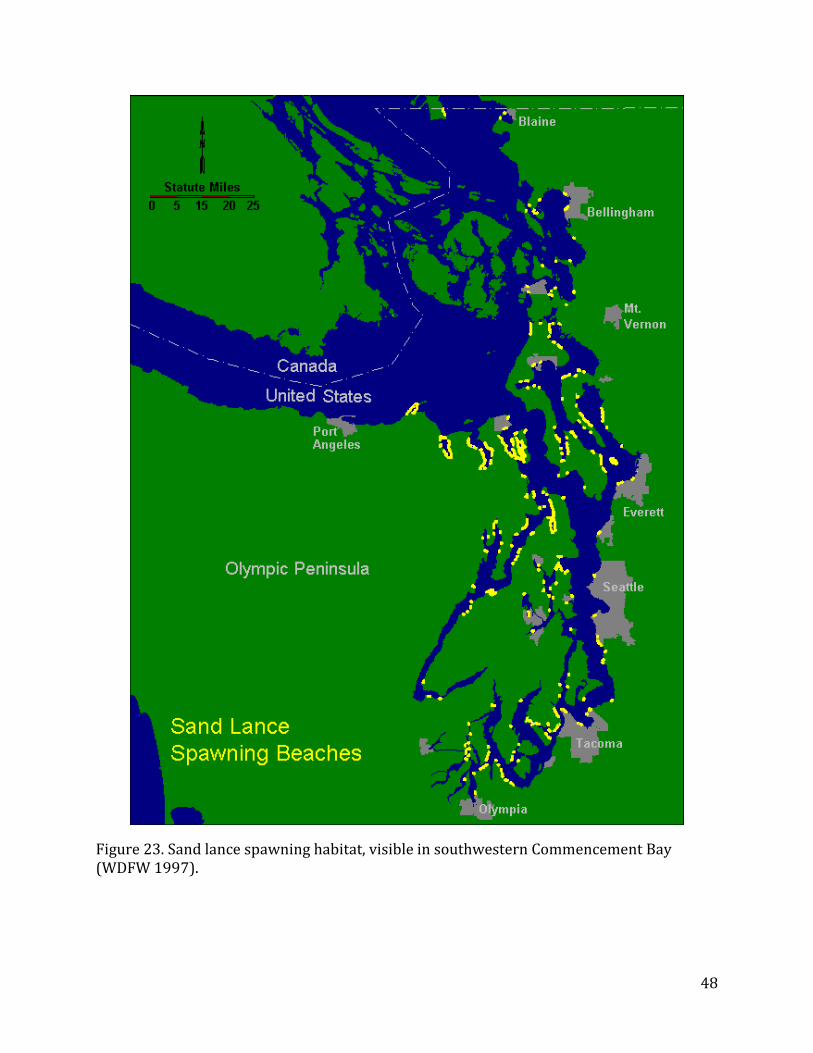
48
Figure 23. Sand lance spawning habitat, visible in southwestern Commencement Bay (WDFW 1997).

49
0
50
100
150
200
250
THM
Sco
re
Rank of Score (High to Low)
Comparison Between Commencement Bay and KGI Habitat Assessments
KGI Commencement Bay
Figure 24. Comparison of scores from the current study to scores from Houghton et al. (2003) in the Key Peninsula, Gig Harbor, and Islands (KGI) region (Figure 1). All scores were ranked from high to low. KGI AUs are shown in grey, while Commencement Bay sites are in red.

50
Appendix A: Complete scores for each AU. AUW1 # Question Points Yes/No Score
1 AU has vernal or perennial freshwater stream or spring 3 Yes 3
2a AU is depositional (slow currents, low wave action) over 25% of littoral area 2 No
2b AU is depositional (slow currents, low wave action) over 50% of littoral area 3 No
3 AU has refuge from high velocities (e.g., during max. ebb) 3 Yes 3
4a AU contains a natural tidal channel wetted at MLLW X1.5 No
4b AU contains tidal channel wetted at MSL (i.e., shallow drainage) 2 No
5 Tidal channel is dendritic or highly sinuous 3 No
6a Fresh water only (salinity < 0.5 ppt) 1 No
6b Oligohaline to Mesohaline (sal. variable: often 0.5 to 5 ppt, but can range to 18
ppt) 3 No
6c Polyhaline (sal. typically 18 to 30 ppt) 1 Yes 1
7a Temp/DO meet criteria for salmonid health during major use periods 2 Yes 2
7b Temp/DO meet criteria for salmonid health at all times 3 Yes 3
8a Ratio of length of MHHW boundary to width at MLLW > 3 (include islands) 3 No
8b Ratio of length of MHHW boundary to width at MLLW 1.2 to 3 (include islands) 2 No
8c Ratio of length of MHHW boundary to width at MLLW < 1.2 (include islands) 1 Yes 1
9 AU is sheltered from waves 2 Yes 2
10a Slope of substrate in littoral zone > 10h:1v (i.e., low gradient) 3 Yes 3
10b Slope of substrate in littoral zone <10h:1v but >5h:1v (i.e., moderate) 2 No
10c Slope of substrate in littoral zone < 5h:1v but > 2h:1v (i.e., steeper) 1 No
11a >10% of AU is littoral (MHHW to -10 ft; use OHW if marsh veg.above MHHW) 1 No
11b >25% of AU is littoral (MHHW to -10 ft; use OHW where vegetation indicates) 2 Yes 1
11c >50% of AU is littoral (MHHW to -10 ft; use OHW where vegetation indicates) 3 No
12 Substrate in littoral zone - silty sand >25% of area 1 No
13 Substrate in littoral zone - mud or mixed fine 25 - 50 % of area 2 No
14 Substrate in littoral zone - mud or mixed fine >50 % of area 3 No
15 Upper intertidal zone contains potential forage fish spawning habitat 3 No
16a Buffer: marsh edge > 10 ft wide over 50 % of Shoreline 3 No
16b Marsh edge >5 ft wide over 50% of Shoreline; or >10 ft wide over 25-50% of
Shoreline 2 No
16c Marsh edge exists but < 5 ft wide, or less than 25% (but >5 %) of Shoreline 1 No
16d Marsh of native species occupies more than 25 % of total AU X 2 No
17a Riparian scrub-shrub and/or forested >25 ft wide over 10 to 24 % of Shoreline 1 No
17b Riparian scrub-shrub and/or forested >25 ft wide over 25 to 50 % of Shoreline 2 No
17c Riparian scrub-shrub and/or forested >25 ft over 50 % of Shoreline 3 No
18 Riparian vegetation is dominated by native species 1 No
19 Riparian zone provides signif. source of LWD recruitment X1.5 No

51
# Question Points Yes/No Score
20a AU has low to moderate gradient intertidal continuity with adjacent AU (one
side) 1 No
20b AU has low to moderate gradient intertidal continuity with adjacent AUs (both
sides) 3 No
21a 1 piece/channel width, /30 m of Shoreline, or /100 m2 of AU whichever is greater 3 No
21b
0.5 piece/channel width, /30 m of Shoreline, or /100 m2 of AU whichever is greater
2 Yes 2
21c 0.2 piece/channel width, /30 m of Shoreline, or /100 m2 of AU whichever is
greater 1 No
22 Algal cover over 10 % of littoral area (during springtime) 1 Yes 1
23a Eelgrass is present along 5 - 10 % of low tide line of AU 1 No
23b Eelgrass is present along 10 - 25 % of low tide line of AU 2 No
23c Eelgrass is present along more than 25 % of low tide line of AU 3 No
23d Eelgrass or kelp (laminarians) occupies more than 25 % of total AU X 2 No
24 Do functioning feeder bluffs provide a significant source of sediment to the AU? X 2 No
25a Immigration/emigration restricted 25 to 50 % of the time X 0.8 No
25b Immigration/emigration restricted 50 to 75 % of the time X 0.5 No
25c Immigration/emigration restricted 75 to 90 % of the time X 0.3 No
26a Wood debris present on the bottom 25 % to 75 % cover over AU X 0.7 No
26b Wood debris present on the bottom >75 % over AU X 0.5 No
27a Log rafting affects 10 - 50 % of AU on a recurring basis X 0.7 No
27b Log rafting affects over 50 % of AU on a recurring basis X 0.5 No
28a Water col. conditions exceed salmonid thresholds during periods of high
abundance X 0.3 No
28b Water col. conditions exceed salmonid thresholds during periods of low
abundance X 0.7 No
29a Sediment chemical contam. present (> SQS over more than 25% of AU) X 0.8 No
29b Sediment chemical contam. present (>CSL over more than 25% of AU) X 0.6 No
30a Riprap or vertical bulkheads extend below MHHW for 10 - 50 % of shore X 0.8 No
30b Riprap or vertical bulkheads extend below MHHW along >50 % of shore X 0.7 Yes x0.7
31 Majority of riprapped or bulkheaded Shoreline extends below MSL (+6 ft MLLW) X 0.8 Yes x0.8
32a Finger pier or dock >8 ft wide X 0.9 Yes x0.9
32b Two or more finger piers or docks >8 ft wide; or single pier or dock >25 ft wide X 0.8 No
33a Overwater structures cover 10 to 30 % of littoral area in AU X 0.8 No
33b Overwater structures cover 30 to 50 % of littoral area in AU X 0.7 Yes x0.7
33c Overwater structures cover 50 to 75 % of littoral area in AU X 0.6 No
33d Overwater structures cover > 75 % of littoral area in AU X 0.5 No
34 Littoral benthic habitat routinely disturbed by prop wash, chronic oil spills, or
dredging X 0.9 No
Additive
22
Positive Multipliers
0.0
Negative Multipliers
0.4
Additive x positive x negative
7.8
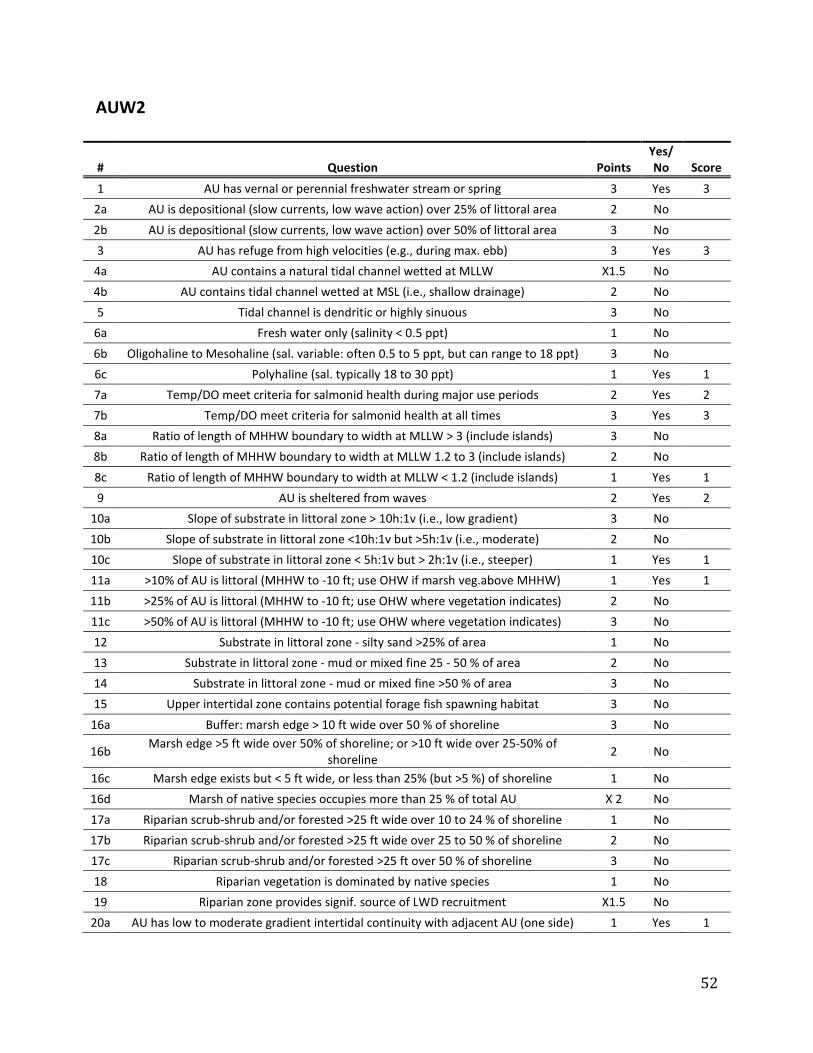
52
AUW2
# Question Points Yes/No Score
1 AU has vernal or perennial freshwater stream or spring 3 Yes 3
2a AU is depositional (slow currents, low wave action) over 25% of littoral area 2 No
2b AU is depositional (slow currents, low wave action) over 50% of littoral area 3 No
3 AU has refuge from high velocities (e.g., during max. ebb) 3 Yes 3
4a AU contains a natural tidal channel wetted at MLLW X1.5 No
4b AU contains tidal channel wetted at MSL (i.e., shallow drainage) 2 No
5 Tidal channel is dendritic or highly sinuous 3 No
6a Fresh water only (salinity < 0.5 ppt) 1 No
6b Oligohaline to Mesohaline (sal. variable: often 0.5 to 5 ppt, but can range to 18 ppt) 3 No
6c Polyhaline (sal. typically 18 to 30 ppt) 1 Yes 1
7a Temp/DO meet criteria for salmonid health during major use periods 2 Yes 2
7b Temp/DO meet criteria for salmonid health at all times 3 Yes 3
8a Ratio of length of MHHW boundary to width at MLLW > 3 (include islands) 3 No
8b Ratio of length of MHHW boundary to width at MLLW 1.2 to 3 (include islands) 2 No
8c Ratio of length of MHHW boundary to width at MLLW < 1.2 (include islands) 1 Yes 1
9 AU is sheltered from waves 2 Yes 2
10a Slope of substrate in littoral zone > 10h:1v (i.e., low gradient) 3 No
10b Slope of substrate in littoral zone <10h:1v but >5h:1v (i.e., moderate) 2 No
10c Slope of substrate in littoral zone < 5h:1v but > 2h:1v (i.e., steeper) 1 Yes 1
11a >10% of AU is littoral (MHHW to -10 ft; use OHW if marsh veg.above MHHW) 1 Yes 1
11b >25% of AU is littoral (MHHW to -10 ft; use OHW where vegetation indicates) 2 No
11c >50% of AU is littoral (MHHW to -10 ft; use OHW where vegetation indicates) 3 No
12 Substrate in littoral zone - silty sand >25% of area 1 No
13 Substrate in littoral zone - mud or mixed fine 25 - 50 % of area 2 No
14 Substrate in littoral zone - mud or mixed fine >50 % of area 3 No
15 Upper intertidal zone contains potential forage fish spawning habitat 3 No
16a Buffer: marsh edge > 10 ft wide over 50 % of shoreline 3 No
16b Marsh edge >5 ft wide over 50% of shoreline; or >10 ft wide over 25-50% of
shoreline 2 No
16c Marsh edge exists but < 5 ft wide, or less than 25% (but >5 %) of shoreline 1 No
16d Marsh of native species occupies more than 25 % of total AU X 2 No
17a Riparian scrub-shrub and/or forested >25 ft wide over 10 to 24 % of shoreline 1 No
17b Riparian scrub-shrub and/or forested >25 ft wide over 25 to 50 % of shoreline 2 No
17c Riparian scrub-shrub and/or forested >25 ft over 50 % of shoreline 3 No
18 Riparian vegetation is dominated by native species 1 No
19 Riparian zone provides signif. source of LWD recruitment X1.5 No
20a AU has low to moderate gradient intertidal continuity with adjacent AU (one side) 1 Yes 1
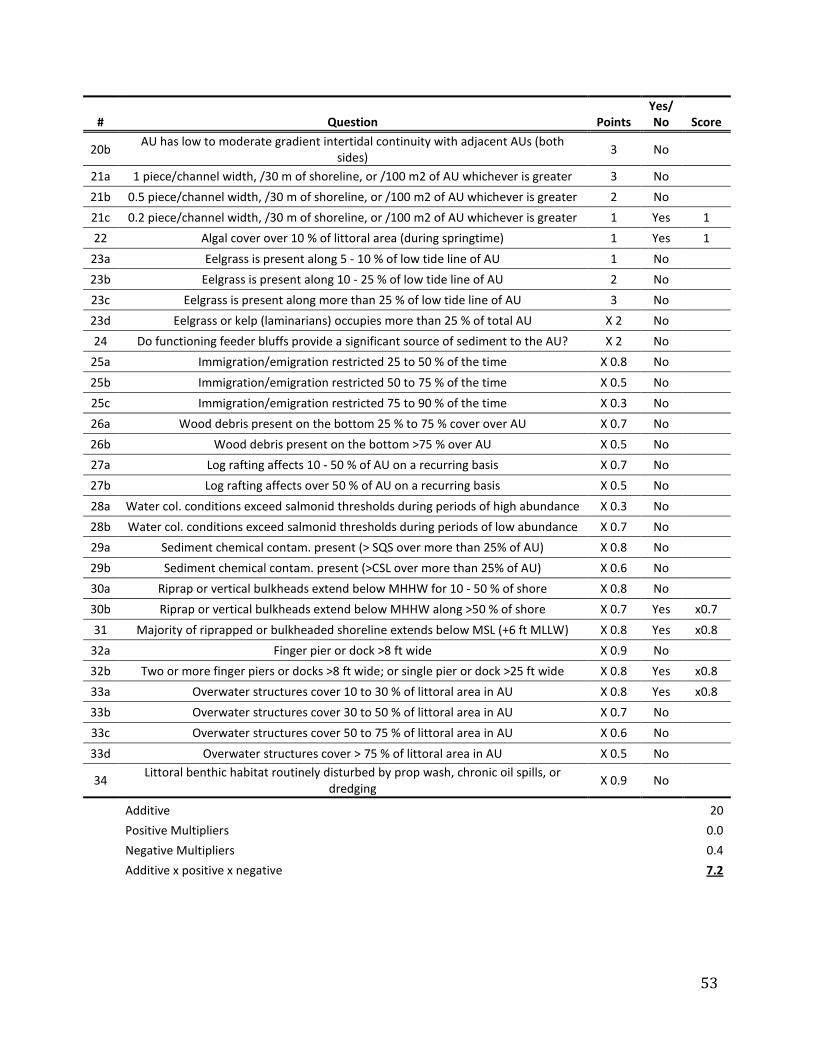
53
# Question Points Yes/No Score
20b AU has low to moderate gradient intertidal continuity with adjacent AUs (both
sides) 3 No
21a 1 piece/channel width, /30 m of shoreline, or /100 m2 of AU whichever is greater 3 No
21b 0.5 piece/channel width, /30 m of shoreline, or /100 m2 of AU whichever is greater 2 No
21c 0.2 piece/channel width, /30 m of shoreline, or /100 m2 of AU whichever is greater 1 Yes 1
22 Algal cover over 10 % of littoral area (during springtime) 1 Yes 1
23a Eelgrass is present along 5 - 10 % of low tide line of AU 1 No
23b Eelgrass is present along 10 - 25 % of low tide line of AU 2 No
23c Eelgrass is present along more than 25 % of low tide line of AU 3 No
23d Eelgrass or kelp (laminarians) occupies more than 25 % of total AU X 2 No
24 Do functioning feeder bluffs provide a significant source of sediment to the AU? X 2 No
25a Immigration/emigration restricted 25 to 50 % of the time X 0.8 No
25b Immigration/emigration restricted 50 to 75 % of the time X 0.5 No
25c Immigration/emigration restricted 75 to 90 % of the time X 0.3 No
26a Wood debris present on the bottom 25 % to 75 % cover over AU X 0.7 No
26b Wood debris present on the bottom >75 % over AU X 0.5 No
27a Log rafting affects 10 - 50 % of AU on a recurring basis X 0.7 No
27b Log rafting affects over 50 % of AU on a recurring basis X 0.5 No
28a Water col. conditions exceed salmonid thresholds during periods of high abundance X 0.3 No
28b Water col. conditions exceed salmonid thresholds during periods of low abundance X 0.7 No
29a Sediment chemical contam. present (> SQS over more than 25% of AU) X 0.8 No
29b Sediment chemical contam. present (>CSL over more than 25% of AU) X 0.6 No
30a Riprap or vertical bulkheads extend below MHHW for 10 - 50 % of shore X 0.8 No
30b Riprap or vertical bulkheads extend below MHHW along >50 % of shore X 0.7 Yes x0.7
31 Majority of riprapped or bulkheaded shoreline extends below MSL (+6 ft MLLW) X 0.8 Yes x0.8
32a Finger pier or dock >8 ft wide X 0.9 No
32b Two or more finger piers or docks >8 ft wide; or single pier or dock >25 ft wide X 0.8 Yes x0.8
33a Overwater structures cover 10 to 30 % of littoral area in AU X 0.8 Yes x0.8
33b Overwater structures cover 30 to 50 % of littoral area in AU X 0.7 No
33c Overwater structures cover 50 to 75 % of littoral area in AU X 0.6 No
33d Overwater structures cover > 75 % of littoral area in AU X 0.5 No
34 Littoral benthic habitat routinely disturbed by prop wash, chronic oil spills, or
dredging X 0.9 No
Additive
20
Positive Multipliers
0.0
Negative Multipliers
0.4
Additive x positive x negative
7.2

54
AUW3
# Question Points Yes/No Score
1 AU has vernal or perennial freshwater stream or spring 3 Yes 3
2a AU is depositional (slow currents, low wave action) over 25% of littoral area 2 Yes 2
2b AU is depositional (slow currents, low wave action) over 50% of littoral area 3 No
3 AU has refuge from high velocities (e.g., during max. ebb) 3 Yes 3
4a AU contains a natural tidal channel wetted at MLLW X1.5 No
4b AU contains tidal channel wetted at MSL (i.e., shallow drainage) 2 No
5 Tidal channel is dendritic or highly sinuous 3 No
6a Fresh water only (salinity < 0.5 ppt) 1 No
6b Oligohaline to Mesohaline (sal. variable: often 0.5 to 5 ppt, but can range to 18
ppt) 3 No
6c Polyhaline (sal. typically 18 to 30 ppt) 1 Yes 1
7a Temp/DO meet criteria for salmonid health during major use periods 2 Yes 2
7b Temp/DO meet criteria for salmonid health at all times 3 Yes 3
8a Ratio of length of MHHW boundary to width at MLLW > 3 (include islands) 3 No
8b Ratio of length of MHHW boundary to width at MLLW 1.2 to 3 (include islands) 2 No
8c Ratio of length of MHHW boundary to width at MLLW < 1.2 (include islands) 1 Yes 1
9 AU is sheltered from waves 2 Yes 2
10a Slope of substrate in littoral zone > 10h:1v (i.e., low gradient) 3 No
10b Slope of substrate in littoral zone <10h:1v but >5h:1v (i.e., moderate) 2 Yes 2
10c Slope of substrate in littoral zone < 5h:1v but > 2h:1v (i.e., steeper) 1 No
11a >10% of AU is littoral (MHHW to -10 ft; use OHW if marsh veg.above MHHW) 1 No
11b >25% of AU is littoral (MHHW to -10 ft; use OHW where vegetation indicates) 2 No
11c >50% of AU is littoral (MHHW to -10 ft; use OHW where vegetation indicates) 3 Yes 3
12 Substrate in littoral zone - silty sand >25% of area 1 No
13 Substrate in littoral zone - mud or mixed fine 25 - 50 % of area 2 Yes 2
14 Substrate in littoral zone - mud or mixed fine >50 % of area 3 No
15 Upper intertidal zone contains potential forage fish spawning habitat 3 Yes 3
16a Buffer: marsh edge > 10 ft wide over 50 % of shoreline 3 No
16b Marsh edge >5 ft wide over 50% of shoreline; or >10 ft wide over 25-50% of
shoreline 2 No
16c Marsh edge exists but < 5 ft wide, or less than 25% (but >5 %) of shoreline 1 No
16d Marsh of native species occupies more than 25 % of total AU X 2 No
17a Riparian scrub-shrub and/or forested >25 ft wide over 10 to 24 % of shoreline 1 No
17b Riparian scrub-shrub and/or forested >25 ft wide over 25 to 50 % of shoreline 2 No
17c Riparian scrub-shrub and/or forested >25 ft over 50 % of shoreline 3 No
18 Riparian vegetation is dominated by native species 1 No
19 Riparian zone provides signif. source of LWD recruitment X1.5 No
20a AU has low to moderate gradient intertidal continuity with adjacent AU (one side) 1 Yes 1
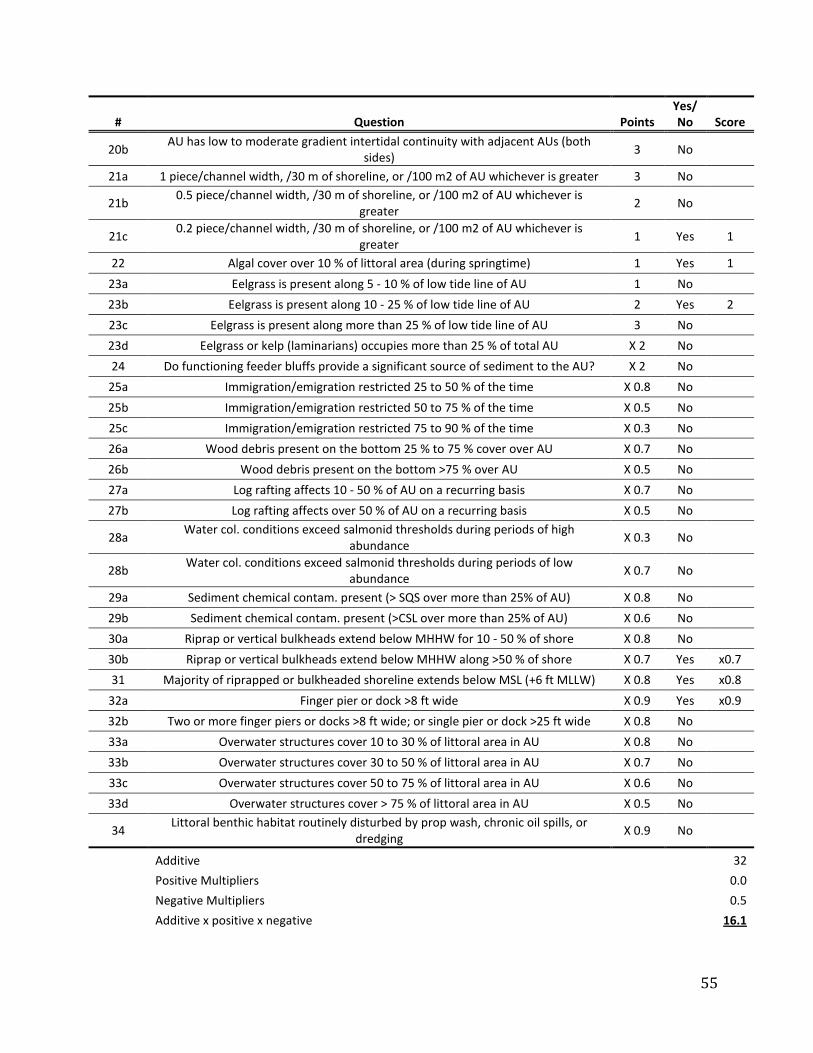
55
# Question Points Yes/No Score
20b AU has low to moderate gradient intertidal continuity with adjacent AUs (both
sides) 3 No
21a 1 piece/channel width, /30 m of shoreline, or /100 m2 of AU whichever is greater 3 No
21b
0.5 piece/channel width, /30 m of shoreline, or /100 m2 of AU whichever is greater
2 No
21c 0.2 piece/channel width, /30 m of shoreline, or /100 m2 of AU whichever is
greater 1 Yes 1
22 Algal cover over 10 % of littoral area (during springtime) 1 Yes 1
23a Eelgrass is present along 5 - 10 % of low tide line of AU 1 No
23b Eelgrass is present along 10 - 25 % of low tide line of AU 2 Yes 2
23c Eelgrass is present along more than 25 % of low tide line of AU 3 No
23d Eelgrass or kelp (laminarians) occupies more than 25 % of total AU X 2 No
24 Do functioning feeder bluffs provide a significant source of sediment to the AU? X 2 No
25a Immigration/emigration restricted 25 to 50 % of the time X 0.8 No
25b Immigration/emigration restricted 50 to 75 % of the time X 0.5 No
25c Immigration/emigration restricted 75 to 90 % of the time X 0.3 No
26a Wood debris present on the bottom 25 % to 75 % cover over AU X 0.7 No
26b Wood debris present on the bottom >75 % over AU X 0.5 No
27a Log rafting affects 10 - 50 % of AU on a recurring basis X 0.7 No
27b Log rafting affects over 50 % of AU on a recurring basis X 0.5 No
28a Water col. conditions exceed salmonid thresholds during periods of high
abundance X 0.3 No
28b Water col. conditions exceed salmonid thresholds during periods of low
abundance X 0.7 No
29a Sediment chemical contam. present (> SQS over more than 25% of AU) X 0.8 No
29b Sediment chemical contam. present (>CSL over more than 25% of AU) X 0.6 No
30a Riprap or vertical bulkheads extend below MHHW for 10 - 50 % of shore X 0.8 No
30b Riprap or vertical bulkheads extend below MHHW along >50 % of shore X 0.7 Yes x0.7
31 Majority of riprapped or bulkheaded shoreline extends below MSL (+6 ft MLLW) X 0.8 Yes x0.8
32a Finger pier or dock >8 ft wide X 0.9 Yes x0.9
32b Two or more finger piers or docks >8 ft wide; or single pier or dock >25 ft wide X 0.8 No
33a Overwater structures cover 10 to 30 % of littoral area in AU X 0.8 No
33b Overwater structures cover 30 to 50 % of littoral area in AU X 0.7 No
33c Overwater structures cover 50 to 75 % of littoral area in AU X 0.6 No
33d Overwater structures cover > 75 % of littoral area in AU X 0.5 No
34 Littoral benthic habitat routinely disturbed by prop wash, chronic oil spills, or
dredging X 0.9 No
Additive
32
Positive Multipliers
0.0
Negative Multipliers
0.5
Additive x positive x negative
16.1

56
AUE1
# Question Points Yes/No Score
1 AU has vernal or perennial freshwater stream or spring 3 Yes 3
2a AU is depositional (slow currents, low wave action) over 25% of littoral area 2 No
2b AU is depositional (slow currents, low wave action) over 50% of littoral area 3 Yes 3
3 AU has refuge from high velocities (e.g., during max. ebb) 3 No
4a AU contains a natural tidal channel wetted at MLLW X1.5 No
4b AU contains tidal channel wetted at MSL (i.e., shallow drainage) 2 No
5 Tidal channel is dendritic or highly sinuous 3 No
6a Fresh water only (salinity < 0.5 ppt) 1 No
6b Oligohaline to Mesohaline (sal. variable: often 0.5 to 5 ppt, but can range to 18 ppt) 3 Yes 3
6c Polyhaline (sal. typically 18 to 30 ppt) 1 No
7a Temp/DO meet criteria for salmonid health during major use periods 2 Yes 2
7b Temp/DO meet criteria for salmonid health at all times 3 Yes 3
8a Ratio of length of MHHW boundary to width at MLLW > 3 (include islands) 3 No
8b Ratio of length of MHHW boundary to width at MLLW 1.2 to 3 (include islands) 2 No
8c Ratio of length of MHHW boundary to width at MLLW < 1.2 (include islands) 1 Yes 1
9 AU is sheltered from waves 2 Yes 2
10a Slope of substrate in littoral zone > 10h:1v (i.e., low gradient) 3 Yes 3
10b Slope of substrate in littoral zone <10h:1v but >5h:1v (i.e., moderate) 2 No
10c Slope of substrate in littoral zone < 5h:1v but > 2h:1v (i.e., steeper) 1 No
11a >10% of AU is littoral (MHHW to -10 ft; use OHW if marsh veg.above MHHW) 1 No
11b >25% of AU is littoral (MHHW to -10 ft; use OHW where vegetation indicates) 2 No
11c >50% of AU is littoral (MHHW to -10 ft; use OHW where vegetation indicates) 3 Yes 3
12 Substrate in littoral zone - silty sand >25% of area 1 No
13 Substrate in littoral zone - mud or mixed fine 25 - 50 % of area 2 No
14 Substrate in littoral zone - mud or mixed fine >50 % of area 3 Yes 3
15 Upper intertidal zone contains potential forage fish spawning habitat 3 No
16a Buffer: marsh edge > 10 ft wide over 50 % of shoreline 3 No
16b Marsh edge >5 ft wide over 50% of shoreline; or >10 ft wide over 25-50% of shoreline 2 No
16c Marsh edge exists but < 5 ft wide, or less than 25% (but >5 %) of shoreline 1 No
16d Marsh of native species occupies more than 25 % of total AU X 2 No
17a Riparian scrub-shrub and/or forested >25 ft wide over 10 to 24 % of shoreline 1 No
17b Riparian scrub-shrub and/or forested >25 ft wide over 25 to 50 % of shoreline 2 No
17c Riparian scrub-shrub and/or forested >25 ft over 50 % of shoreline 3 No
18 Riparian vegetation is dominated by native species 1 No
19 Riparian zone provides signif. source of LWD recruitment X1.5 No
20a AU has low to moderate gradient intertidal continuity with adjacent AU (one side) 1 No
20b AU has low to moderate gradient intertidal continuity with adjacent AUs (both sides) 3 Yes 3
21a 1 piece/channel width, /30 m of shoreline, or /100 m2 of AU whichever is greater 3 No
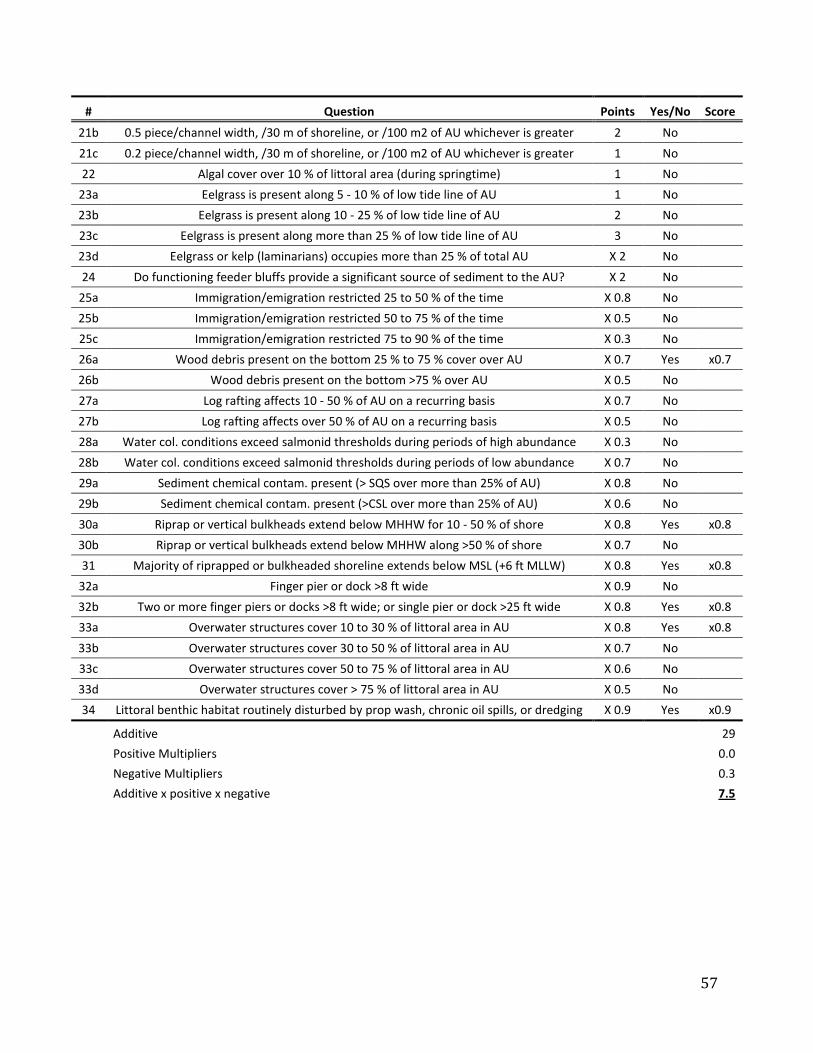
57
# Question Points Yes/No Score
21b 0.5 piece/channel width, /30 m of shoreline, or /100 m2 of AU whichever is greater 2 No
21c 0.2 piece/channel width, /30 m of shoreline, or /100 m2 of AU whichever is greater 1 No
22 Algal cover over 10 % of littoral area (during springtime) 1 No
23a Eelgrass is present along 5 - 10 % of low tide line of AU 1 No
23b Eelgrass is present along 10 - 25 % of low tide line of AU 2 No
23c Eelgrass is present along more than 25 % of low tide line of AU 3 No
23d Eelgrass or kelp (laminarians) occupies more than 25 % of total AU X 2 No
24 Do functioning feeder bluffs provide a significant source of sediment to the AU? X 2 No
25a Immigration/emigration restricted 25 to 50 % of the time X 0.8 No
25b Immigration/emigration restricted 50 to 75 % of the time X 0.5 No
25c Immigration/emigration restricted 75 to 90 % of the time X 0.3 No
26a Wood debris present on the bottom 25 % to 75 % cover over AU X 0.7 Yes x0.7
26b Wood debris present on the bottom >75 % over AU X 0.5 No
27a Log rafting affects 10 - 50 % of AU on a recurring basis X 0.7 No
27b Log rafting affects over 50 % of AU on a recurring basis X 0.5 No
28a Water col. conditions exceed salmonid thresholds during periods of high abundance X 0.3 No
28b Water col. conditions exceed salmonid thresholds during periods of low abundance X 0.7 No
29a Sediment chemical contam. present (> SQS over more than 25% of AU) X 0.8 No
29b Sediment chemical contam. present (>CSL over more than 25% of AU) X 0.6 No
30a Riprap or vertical bulkheads extend below MHHW for 10 - 50 % of shore X 0.8 Yes x0.8
30b Riprap or vertical bulkheads extend below MHHW along >50 % of shore X 0.7 No
31 Majority of riprapped or bulkheaded shoreline extends below MSL (+6 ft MLLW) X 0.8 Yes x0.8
32a Finger pier or dock >8 ft wide X 0.9 No
32b Two or more finger piers or docks >8 ft wide; or single pier or dock >25 ft wide X 0.8 Yes x0.8
33a Overwater structures cover 10 to 30 % of littoral area in AU X 0.8 Yes x0.8
33b Overwater structures cover 30 to 50 % of littoral area in AU X 0.7 No
33c Overwater structures cover 50 to 75 % of littoral area in AU X 0.6 No
33d Overwater structures cover > 75 % of littoral area in AU X 0.5 No
34 Littoral benthic habitat routinely disturbed by prop wash, chronic oil spills, or dredging X 0.9 Yes x0.9
Additive
29
Positive Multipliers
0.0
Negative Multipliers
0.3
Additive x positive x negative
7.5

58
AUE2
# Question Points Yes/No Score
1 AU has vernal or perennial freshwater stream or spring 3 Yes 3
2a AU is depositional (slow currents, low wave action) over 25% of littoral area 2 No
2b AU is depositional (slow currents, low wave action) over 50% of littoral area 3 No
3 AU has refuge from high velocities (e.g., during max. ebb) 3 No
4a AU contains a natural tidal channel wetted at MLLW X1.5 No
4b AU contains tidal channel wetted at MSL (i.e., shallow drainage) 2 No
5 Tidal channel is dendritic or highly sinuous 3 No
6a Fresh water only (salinity < 0.5 ppt) 1 No
6b Oligohaline to Mesohaline (sal. variable: often 0.5 to 5 ppt, but can range to 18 ppt) 3 Yes 3
6c Polyhaline (sal. typically 18 to 30 ppt) 1 No
7a Temp/DO meet criteria for salmonid health during major use periods 2 Yes 2
7b Temp/DO meet criteria for salmonid health at all times 3 Yes 3
8a Ratio of length of MHHW boundary to width at MLLW > 3 (include islands) 3 No
8b Ratio of length of MHHW boundary to width at MLLW 1.2 to 3 (include islands) 2 No
8c Ratio of length of MHHW boundary to width at MLLW < 1.2 (include islands) 1 Yes 1
9 AU is sheltered from waves 2 Yes 2
10a Slope of substrate in littoral zone > 10h:1v (i.e., low gradient) 3 Yes 3
10b Slope of substrate in littoral zone <10h:1v but >5h:1v (i.e., moderate) 2 No
10c Slope of substrate in littoral zone < 5h:1v but > 2h:1v (i.e., steeper) 1 No
11a >10% of AU is littoral (MHHW to -10 ft; use OHW if marsh veg.above MHHW) 1 No
11b >25% of AU is littoral (MHHW to -10 ft; use OHW where vegetation indicates) 2 No
11c >50% of AU is littoral (MHHW to -10 ft; use OHW where vegetation indicates) 3 Yes 3
12 Substrate in littoral zone - silty sand >25% of area 1 No
13 Substrate in littoral zone - mud or mixed fine 25 - 50 % of area 2 Yes 2
14 Substrate in littoral zone - mud or mixed fine >50 % of area 3 No
15 Upper intertidal zone contains potential forage fish spawning habitat 3 Yes 3
16a Buffer: marsh edge > 10 ft wide over 50 % of shoreline 3 No
16b Marsh edge >5 ft wide over 50% of shoreline; or >10 ft wide over 25-50% of shoreline 2 No
16c Marsh edge exists but < 5 ft wide, or less than 25% (but >5 %) of shoreline 1 No
16d Marsh of native species occupies more than 25 % of total AU X 2 No
17a Riparian scrub-shrub and/or forested >25 ft wide over 10 to 24 % of shoreline 1 No
17b Riparian scrub-shrub and/or forested >25 ft wide over 25 to 50 % of shoreline 2 Yes 2
17c Riparian scrub-shrub and/or forested >25 ft over 50 % of shoreline 3 No
18 Riparian vegetation is dominated by native species 1 No
19 Riparian zone provides signif. source of LWD recruitment X1.5 No
20a AU has low to moderate gradient intertidal continuity with adjacent AU (one side) 1 No
20b AU has low to moderate gradient intertidal continuity with adjacent AUs (both sides) 3 Yes 3
21a 1 piece/channel width, /30 m of shoreline, or /100 m2 of AU whichever is greater 3 Yes 3

59
# Question Points Yes/No Score
21b 0.5 piece/channel width, /30 m of shoreline, or /100 m2 of AU whichever is greater 2 No
21c 0.2 piece/channel width, /30 m of shoreline, or /100 m2 of AU whichever is greater 1 No
22 Algal cover over 10 % of littoral area (during springtime) 1 Yes 1
23a Eelgrass is present along 5 - 10 % of low tide line of AU 1 No
23b Eelgrass is present along 10 - 25 % of low tide line of AU 2 No
23c Eelgrass is present along more than 25 % of low tide line of AU 3 No
23d Eelgrass or kelp (laminarians) occupies more than 25 % of total AU X 2 No
24 Do functioning feeder bluffs provide a significant source of sediment to the AU? X 2 No
25a Immigration/emigration restricted 25 to 50 % of the time X 0.8 No
25b Immigration/emigration restricted 50 to 75 % of the time X 0.5 No
25c Immigration/emigration restricted 75 to 90 % of the time X 0.3 No
26a Wood debris present on the bottom 25 % to 75 % cover over AU X 0.7 No
26b Wood debris present on the bottom >75 % over AU X 0.5 No
27a Log rafting affects 10 - 50 % of AU on a recurring basis X 0.7 Yes x0.7
27b Log rafting affects over 50 % of AU on a recurring basis X 0.5 No
28a Water col. conditions exceed salmonid thresholds during periods of high abundance X 0.3 No
28b Water col. conditions exceed salmonid thresholds during periods of low abundance X 0.7 No
29a Sediment chemical contam. present (> SQS over more than 25% of AU) X 0.8 No
29b Sediment chemical contam. present (>CSL over more than 25% of AU) X 0.6 No
30a Riprap or vertical bulkheads extend below MHHW for 10 - 50 % of shore X 0.8 Yes x0.8
30b Riprap or vertical bulkheads extend below MHHW along >50 % of shore X 0.7 No
31 Majority of riprapped or bulkheaded shoreline extends below MSL (+6 ft MLLW) X 0.8 No
32a Finger pier or dock >8 ft wide X 0.9 No
32b Two or more finger piers or docks >8 ft wide; or single pier or dock >25 ft wide X 0.8 Yes x0.8
33a Overwater structures cover 10 to 30 % of littoral area in AU X 0.8 Yes x0.8
33b Overwater structures cover 30 to 50 % of littoral area in AU X 0.7 No
33c Overwater structures cover 50 to 75 % of littoral area in AU X 0.6 No
33d Overwater structures cover > 75 % of littoral area in AU X 0.5 No
34 Littoral benthic habitat routinely disturbed by prop wash, chronic oil spills, or
dredging X 0.9 No
Additive
34
Positive Multipliers
0.0
Negative Multipliers
0.4
Additive x positive x negative
12.2

60
AUE3
# Question Points Yes/No Score
1 AU has vernal or perennial freshwater stream or spring 3 Yes 3
2a AU is depositional (slow currents, low wave action) over 25% of littoral area 2 No
2b AU is depositional (slow currents, low wave action) over 50% of littoral area 3 No
3 AU has refuge from high velocities (e.g., during max. ebb) 3 No
4a AU contains a natural tidal channel wetted at MLLW X1.5 Yes x1.5
4b AU contains tidal channel wetted at MSL (i.e., shallow drainage) 2 No
5 Tidal channel is dendritic or highly sinuous 3 Yes 3
6a Fresh water only (salinity < 0.5 ppt) 1 No
6b Oligohaline to Mesohaline (sal. variable: often 0.5 to 5 ppt, but can range to 18 ppt) 3 Yes 3
6c Polyhaline (sal. typically 18 to 30 ppt) 1 No
7a Temp/DO meet criteria for salmonid health during major use periods 2 Yes 2
7b Temp/DO meet criteria for salmonid health at all times 3 Yes 3
8a Ratio of length of MHHW boundary to width at MLLW > 3 (include islands) 3 No
8b Ratio of length of MHHW boundary to width at MLLW 1.2 to 3 (include islands) 2 No
8c Ratio of length of MHHW boundary to width at MLLW < 1.2 (include islands) 1 Yes 1
9 AU is sheltered from waves 2 Yes 2
10a Slope of substrate in littoral zone > 10h:1v (i.e., low gradient) 3 Yes 3
10b Slope of substrate in littoral zone <10h:1v but >5h:1v (i.e., moderate) 2 No
10c Slope of substrate in littoral zone < 5h:1v but > 2h:1v (i.e., steeper) 1 No
11a >10% of AU is littoral (MHHW to -10 ft; use OHW if marsh veg.above MHHW) 1 No
11b >25% of AU is littoral (MHHW to -10 ft; use OHW where vegetation indicates) 2 No
11c >50% of AU is littoral (MHHW to -10 ft; use OHW where vegetation indicates) 3 Yes 3
12 Substrate in littoral zone - silty sand >25% of area 1 Yes 1
13 Substrate in littoral zone - mud or mixed fine 25 - 50 % of area 2 Yes 2
14 Substrate in littoral zone - mud or mixed fine >50 % of area 3 No
15 Upper intertidal zone contains potential forage fish spawning habitat 3 No
16a Buffer: marsh edge > 10 ft wide over 50 % of shoreline 3 No
16b Marsh edge >5 ft wide over 50% of shoreline; or >10 ft wide over 25-50% of shoreline 2 No
16c Marsh edge exists but < 5 ft wide, or less than 25% (but >5 %) of shoreline 1 No
16d Marsh of native species occupies more than 25 % of total AU X 2 No
17a Riparian scrub-shrub and/or forested >25 ft wide over 10 to 24 % of shoreline 1 No
17b Riparian scrub-shrub and/or forested >25 ft wide over 25 to 50 % of shoreline 2 No
17c Riparian scrub-shrub and/or forested >25 ft over 50 % of shoreline 3 Yes 3
18 Riparian vegetation is dominated by native species 1 No
19 Riparian zone provides signif. source of LWD recruitment X1.5 No
20a AU has low to moderate gradient intertidal continuity with adjacent AU (one side) 1 Yes 1
20b AU has low to moderate gradient intertidal continuity with adjacent AUs (both sides) 3 No
21a 1 piece/channel width, /30 m of shoreline, or /100 m2 of AU whichever is greater 3 Yes 3

61
# Question Points Yes/No Score
21b 0.5 piece/channel width, /30 m of shoreline, or /100 m2 of AU whichever is greater 2 No
21c 0.2 piece/channel width, /30 m of shoreline, or /100 m2 of AU whichever is greater 1 No
22 Algal cover over 10 % of littoral area (during springtime) 1 Yes 1
23a Eelgrass is present along 5 - 10 % of low tide line of AU 1 No
23b Eelgrass is present along 10 - 25 % of low tide line of AU 2 No
23c Eelgrass is present along more than 25 % of low tide line of AU 3 No
23d Eelgrass or kelp (laminarians) occupies more than 25 % of total AU X 2 No
24 Do functioning feeder bluffs provide a significant source of sediment to the AU? X 2 No
25a Immigration/emigration restricted 25 to 50 % of the time X 0.8 No
25b Immigration/emigration restricted 50 to 75 % of the time X 0.5 No
25c Immigration/emigration restricted 75 to 90 % of the time X 0.3 No
26a Wood debris present on the bottom 25 % to 75 % cover over AU X 0.7 No
26b Wood debris present on the bottom >75 % over AU X 0.5 No
27a Log rafting affects 10 - 50 % of AU on a recurring basis X 0.7 No
27b Log rafting affects over 50 % of AU on a recurring basis X 0.5 No
28a Water col. conditions exceed salmonid thresholds during periods of high abundance X 0.3 No
28b Water col. conditions exceed salmonid thresholds during periods of low abundance X 0.7 No
29a Sediment chemical contam. present (> SQS over more than 25% of AU) X 0.8 No
29b Sediment chemical contam. present (>CSL over more than 25% of AU) X 0.6 No
30a Riprap or vertical bulkheads extend below MHHW for 10 - 50 % of shore X 0.8 No
30b Riprap or vertical bulkheads extend below MHHW along >50 % of shore X 0.7 No
31 Majority of riprapped or bulkheaded shoreline extends below MSL (+6 ft MLLW) X 0.8 No
32a Finger pier or dock >8 ft wide X 0.9 No
32b Two or more finger piers or docks >8 ft wide; or single pier or dock >25 ft wide X 0.8 No
33a Overwater structures cover 10 to 30 % of littoral area in AU X 0.8 No
33b Overwater structures cover 30 to 50 % of littoral area in AU X 0.7 No
33c Overwater structures cover 50 to 75 % of littoral area in AU X 0.6 No
33d Overwater structures cover > 75 % of littoral area in AU X 0.5 No
34 Littoral benthic habitat routinely disturbed by prop wash, chronic oil spills, or
dredging X 0.9 Yes x0.9
Additive
34
Positive Multipliers
1.5
Negative Multipliers
0.9
Additive x positive x negative
45.9