Embed Size (px)
Citation preview
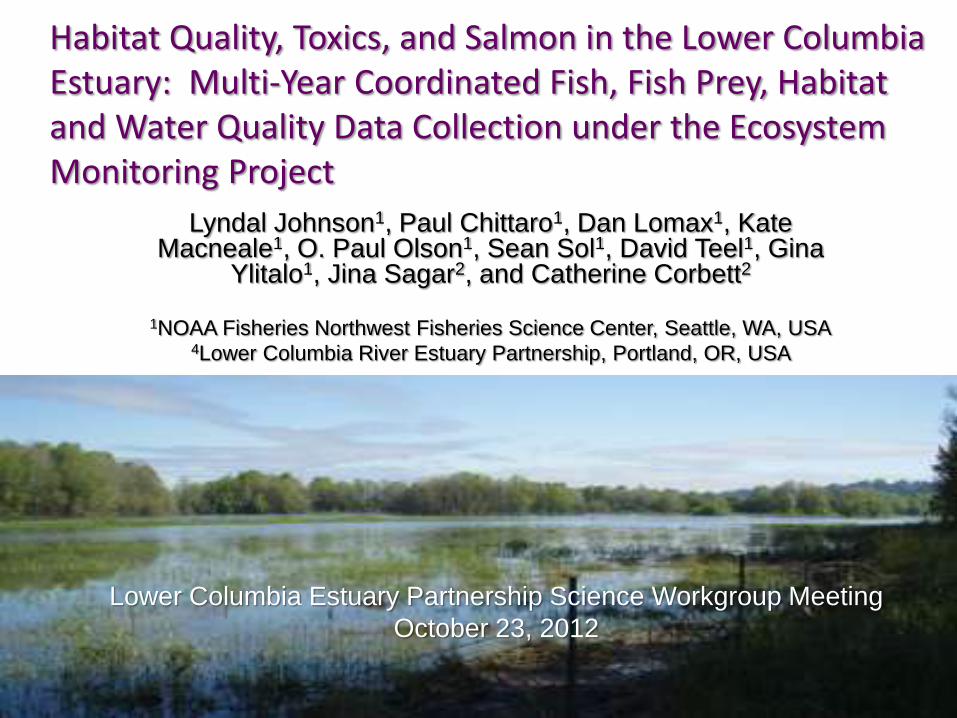
Habitat Quality, Toxics, and Salmon in the Lower Columbia Estuary: Multi-Year Coordinated Fish, Fish Prey, Habitat and Water Quality Data Collection under the Ecosystem Monitoring Project
Lyndal Johnson1, Paul Chittaro1, Dan Lomax1, Kate Macneale1, O. Paul Olson1, Sean Sol1, David Teel1, Gina
Ylitalo1, Jina Sagar2, and Catherine Corbett2
1NOAA Fisheries Northwest Fisheries Science Center, Seattle, WA, USA
4Lower Columbia River Estuary Partnership, Portland, OR, USA
Lower Columbia Estuary Partnership Science Workgroup Meeting
October 23, 2012
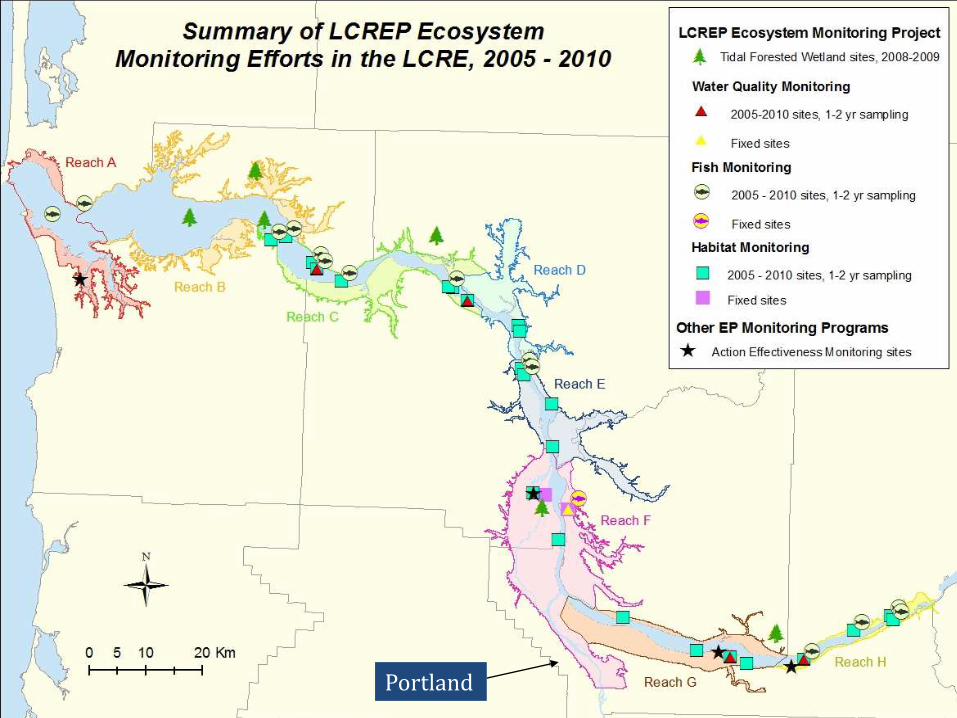
Portland

Portland
Ilwaco
Deer Island
Goat Island Burke Island
Secret River
Welch Island
Washougal Lemon Island
Reed Island

Estuary Partnership’s Ecosystem Monitoring Program
Major Program components:
Water Quality (USGS) Vegetation Monitoring (PNNL)
Invertebrate prey (NOAA Fisheries)
Fish (NOAA Fisheries)

emergent
vegetation
tows

open water tows
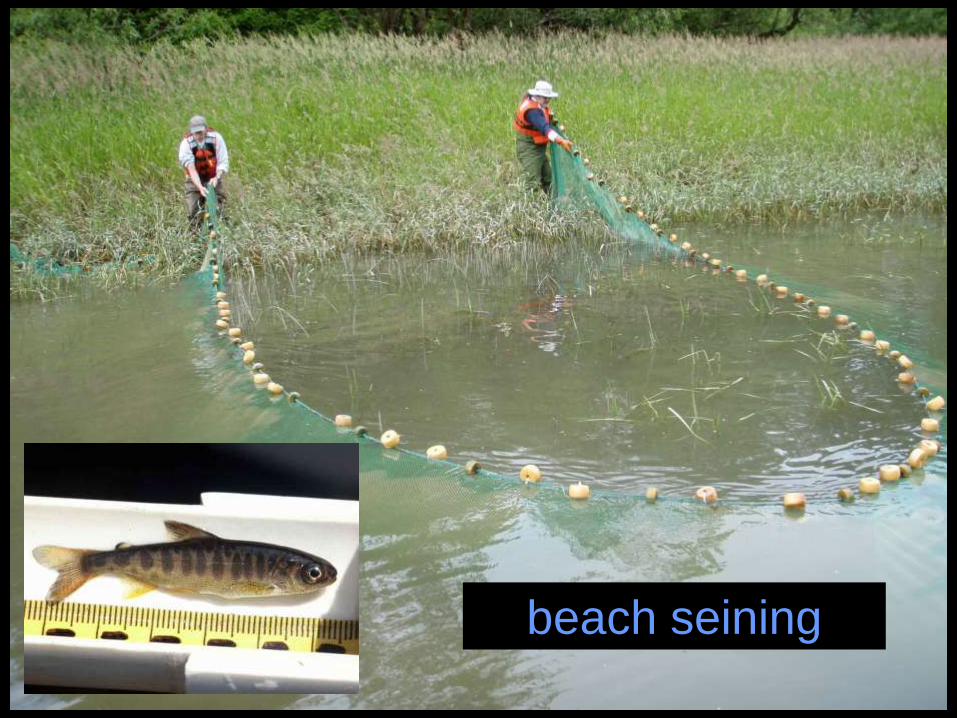
beach seining

Ecosystem Monitoring Results
• Distinctive fish communities by reach

Fish Community Composition
0%
10%
20%
30%
40%
50%
60%
70%
80%
90%
100%weatherfish, oriental
sucker, largescale
surf smelt
sturgeon, Whites
stickleback
starry flounder
shiner perch
shad
sculpin sp.
sandlance
pumpkinseed
pike, walleye
yellow perch
peamouth
pikeminnow
mosquitofish
killifish
goby
crappie
chub sp.
chiselmouth
catfish sp.
carp sp.
yellow bullhead
brown bullhead
bluegill
smallmouth bass
largemouth bass
salmonids
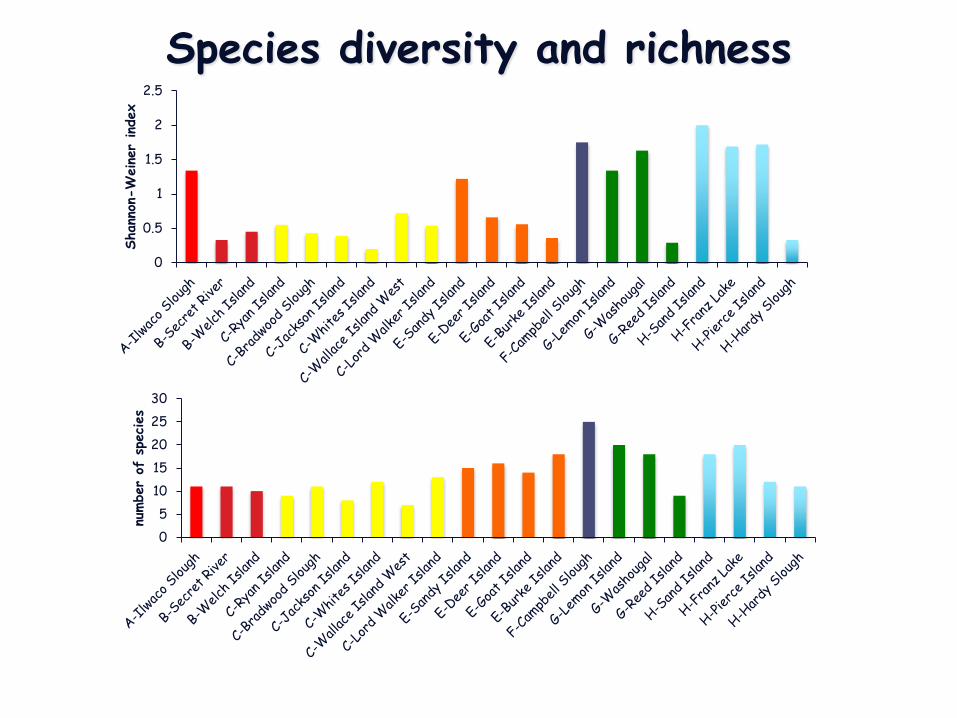
Species diversity and richness
0
0.5
1
1.5
2
2.5
Shann
on-W
einer
index
0
5
10
15
20
25
30
number
of s
pecies

Fish Community Composition over the Sampling Season
0%
10%
20%
30%
40%
50%
60%
70%
80%
90%
100% other
sucker, largescale
surf smelt
stickleback
starry flounder
shiner perch
shad
sculpin sp.
sandlance
pumpkinseed
yellow perch
peamouth
pikeminnow
killifish
crappie
chub sp.
chiselmouth
carp sp.
bullhead sp.
bluegill
smallmouth bass
salmonids

Ecosystem Monitoring Results
• Distinctive fish communities by reach
• Multiple salmon species and stocks with distinctive patterns of occurrence by reach

Salmonid Catch Composition
0%
10%
20%
30%
40%
50%
60%
70%
80%
90%
100%
steelhead
chum
coho
chinook

Unmarked Chinook density by site and month
0
50
100
150
200
250
300
350
400
450
fis
h p
er
10
00
m2
April
May
June
July
August

Lower Columbia/Willamette Stocks:
• West Cascade Range Falls
• West Cascade Range Springs
• Spring Creek Group Falls
• Upper Willamette Springs
Interior Columbia Stocks:
• Upper and Middle Columbia Springs
• Snake River Spring/Summers
• Snake River Falls
• Deschutes River Summer/Falls
Chinook Salmon Genetic Groups

Genetic Stocks
0%
20%
40%
60%
80%
100%
unmarked chinook
Rogue River
West Cascades Spr
Willamette River Spr
Deschutes fall
Snake Fall
Upper Columbia SuF
Spring Creek Fall
West Cascades Fall
0%
20%
40%
60%
80%
100%
marked chinook
West Cascades Spr
Upper Willamette Spr
Snake Fall
Upper Columbia SuF
Spring Creek Fall
West Cascades Fall

Campbell Slough PIT tag array results from 2011
Detection Date
Range
No of
fish
detected
Range of days
between first
and last
detections
Species Tag site Tag Date
Range
6/3/11 1 5 Northern pike
minnow
Mouth of Lewis
River
4/3/10
7/12/11-7/20/11 7 1-12 Chinook
salmon
Little White Salmon
Hatchery (Columbia
Gorge, WA)
6/6/11-6/7/11
7/12/11
5 1-3 Chinook
salmon
Lyons Ferry
Hatchery (Snake
River, WA)
4/13/11-4/16/11
7/12/11 3 1-8 Chinook
salmon
Dworshak Hatchery
(Clearwater River,
ID)
5/26/11-6/6/11
7/12/11 1 9 Chinook
salmon
Irrigon Hatchery
(Middle Columbia,
OR)
4/20/11
7/13/11 4 10 sockeye
salmon
Sawtooth Hatchery
(Salmon River, ID)
4/6/11

Ecosystem Monitoring Results
• Distinctive fish communities by reach
• Multiple salmon species and stocks with distinctive patterns of occurrence by reach
• Measures of fish condition

Fish condition factor by site for unmarked chinook
0
0.2
0.4
0.6
0.8
1
1.2
1.4
1.6
Con
dition
Fact
or (± S
D)

Fish condition factor by month unmarked chinook
0
0.2
0.4
0.6
0.8
1
1.2
1.4
unmarked
marked

Lipid Content in unmarked Chinook salmon from EMP Sites
ab ab
ab b
a
ab
ab
0.0
0.5
1.0
1.5
2.0
2.5
Phopholipids
Cholesterol
Free Fatty Acids
Triglycerides
Wax esters
Lipid content typically 1-1.5%; no significant differences among sites

Salmon Growth rates (estimated from otoliths)
a a
a a a
b
b
0
0.1
0.2
0.3
0.4
0.5
0.6
0.7
0.8
0.9
grow
th r
ate
(mm/d
ay) fo
r past
7 d
ays
Lower growth rates in fish from Reach C sites

Salmon Growth rates by origin and stock
abc
b c abc
abc abc a
00.10.20.30.40.50.60.70.8
Desc
hut
es
Fal
l (n
=6)
Spr
ing
Cre
ek
Gro
up f
all
(n=9
4)
West
Cas
cades
Fal
l
(n=9
2)
West
Cas
cades
Spr
ing
(n=4
)
Sna
ke F
all
(n=7
)
Upp
er
Col
umbia
Sum
mer/
Fal
l…
Upp
er
Willa
mett
e
Riv
er
Spr
ing…
grow
th r
ate
(mm/d
ay)
b a
0
0.2
0.4
0.6
0.8
unmarked (n=183) marked (n=78)
grow
th r
ate
(mm/d
ay)
Growth rates lower in unmarked fish and in West Cascades fall chinook Most Reach C fish from these groups

Ecosystem Monitoring Results
• Distinctive fish communities by reach
• Multiple salmon species and stocks with distinctive patterns of occurrence by reach
• Variety of prey but consistent preference by Chinook for Dipteran prey; found at highest densities in nearshore emergent vegetation

Composition of available prey

Consumed prey: Diptera 65% of prey were Diptera

emergent
vegetation open water

Source of preferred prey items?
Emergent vegetation

Ecosystem Monitoring Results
• Distinctive fish communities by reach
• Multiple salmon species and stocks with distinctive patterns of occurrence by reach
• Variety of prey but consistent preference by Chinook for Dipteran prey; found at highest densities in nearshore emergent vegetation
• Evidence of human activity even at relatively undisturbed sites
− Non-native species, especially in Reaches E-H

Non-native species
0
10
20
30
40
50
60
% o
f to
tal se
cies
that
are
non
-
native
0
10
20
30
40
50
60
70
% n
on-na
tive
spe
cies
in c
atc
h

Ecosystem Monitoring Results
• Distinctive fish communities by reach
• Multiple salmon species and stocks with distinctive patterns of occurrence by reach
• Variety of prey but consistent preference by Chinook for Dipteran prey; found at highest densities in nearshore emergent vegetation
• Evidence of human activity even at relatively undisturbed sites
–Non-native species, especially in Reaches E-H
–Dominance of hatchery fish, especially in Reaches E-H

Marked vs. Unmarked Chinook and Coho Salmon
0%
20%
40%
60%
80%
100%
% o
f co
ho
salm
on c
atc
h
Coho salmon
unmarked
marked
0%
20%
40%
60%
80%
100%
% o
f ch
inoo
k s
alm
on c
atc
h
Chinook salmon
undetermined
unmarked
marked

Ecosystem Monitoring Results
• Distinctive fish communities by reach
• Multiple salmon species and stocks with distinctive patterns of occurrence by reach
• Variety of prey but consistent preference by Chinook for Dipteran prey; found at highest densities in nearshore emergent vegetation
• Evidence of human activity even at relatively undisturbed sites
–Non-native species, especially in Reaches E-H
–Dominance of hatchery fish, especially in Reaches E-H
–High summer water temperatures at most sites

Water Temperature The typical water
temperature range
from 5-10°C in
February-April,
rising to 20-25°C in
August, then
declining to 5-10°C
by Nov/Dec .
Lower
temperatures at
Hardy Slough,
Pierce Island,
Bradwood Slough
Water
temperatures
above preferred
range for salmon
in July and August
0
5
10
15
20
25
30
wate
r te
mp
era
ture
0C
A-Ilwaco Slough
B-Secret River
B-Welch Island
C-Ryan Island
C-Bradwood Slough
C-Jackson Island
C-Whites Island
C-Wallace Island
C-Lord/Walker Island
E-Sandy Island
E-Deer Island
E-Goat Island
E-Burke Island
F-Campbell Slough
G-Lemon Island
G-Washougal
G-Reed Island
H-Sand Island
H-Franz Lake
H-Pierce Island
H-Hardy Slough

Ecosystem Monitoring Results
• Distinctive fish communities by reach
• Multiple salmon species and stocks with distinctive patterns of occurrence by reach
• Variety of prey but consistent preference by Chinook for Dipteran prey; found at highest densities in nearshore emergent vegetation
• Evidence of human activity even at relatively undisturbed sites
–Non-native species, especially in Reaches F-H
–Dominance of hatchery fish, especially in Reaches F-H
–High summer water temperatures at most sites
–Chemical contaminants, especially below Portland/Vancouver

Persistent organic pollutants in Chinook salmon
0
1000
2000
3000
4000
5000
6000
7000
8000n
g/g
lip
id
PBDEs
PCBs
DDTs
PCBs: 21% of samples at or above estimated toxic effects threshold
PBDEs: 30% of samples at or above estimated toxic effects threshold

Persistent organic pollutants in Chinook salmon
0
1000
2000
3000
4000
5000
6000
7000
8000n
g/g
lip
id
PBDEs
PCBs
DDTs
PCBs: 21% of samples at or above estimated toxic effects threshold
PBDEs: 30% of samples at or above estimated toxic effects threshold

Summary of Findings
• Distinctive fish communities by reach
• Multiple salmon species and stocks with distinctive patterns of occurrence by reach
• Variety of prey but consistent preference by Chinook for Dipteran prey; found at highest densities in nearshore emergent vegetation
• Evidence of human activity even at relatively undisturbed sites
–Non-native species, especially in Reaches E-H
–Dominance of hatchery fish, especially in Reaches E-H
–High summer water temperatures at most sites
–Chemical contaminants, especially below Portland/Vancouver

Management Implications
• Tidal freshwater emergent marsh habitats are important to multiple salmon stocks
• Quality of these habitats would be maintained and improved by activities that will
–Preserve nearshore emergent vegetation
–Moderate summer temperatures
–Reduce the spread of non-native species
–Reduce chemical contamination