Embed Size (px)
Citation preview

1767
AJCS 5(13):1767-1775 (2011) ISSN:1835-2707
AMMI analysis to comprehend genotype-by-environment (G × E) interactions in rainfed
grown mungbean (Vigna radiata L.)
P. Thangavel, A. Anandan* and R. Eswaran
Department of Genetics and Plant Breeding, Faculty of Agriculture, Annamalai University, Annamalai Nagar-
608 002, India
*Corresponding author: [email protected]
Abstract
The additive main effects and multiplicative interaction (AMMI) model was used to analyse the yield and yield component traits data
of 58 mungbean genotypes grown in six moisture stress location-year environments. Main effects due to environments (E), genotypes
(G) and G × E interaction were found significant for plant height, number of branches per plant, number of clusters per plant,
number of pods per plant, 100 seed weight and grain yield per plant (P < 0.01). Gollob’s test declared two components, Interaction
Principal Component Axis 1 (IPCA 1) and IPCA 2, statistically significant (P < 0.01) for all the traits studied. The IPCA 1 of traits
studied were accounted more than 62% of the G × E sum of squares. This study revealed that expression of mungbean genotypes
varies between locations under drought condition, and brings out the suitability of specific genotype to rainfed condition through the
biplot. Furthermore, biplot reflects maturity groups for the genotypes, with short duration mungbean at the bottom, medium duration
genotypes in the middle and long duration genotypes at the top. AMMI provided such insight into G × E interactions. Trait by
environment biplot clustered the location into four distinct groups. Site E4 was characterized by strong positive associations of yield,
number of seeds per pod and 100 seed weight. Correlation between environmental scores and environmental variables gives a useful
insight about the interaction effects. In the present study, statistical analysis of yield trials of mungbean under moisture stress with the
AMMI model has revealed practical implications for plant breeding research towards drought tolerance in mungbean.
Keywords: Biplot; breeding; drought; Genotype × Environment interaction; yield; Vigna radiata.
Abbreviations: AMMI: Additive Main effects and Multiplicative Interaction; IPCA: Interaction Principal Component Axis; RMS:
Root mean square; PCA: Principal Component Analysis.
Introduction
Mungbean (Vigna radiata L.) is an important short season
summer grown grain legume, well suited to smallholder
production under adverse climatic conditions and commonly
used in Indian cuisine (Vijayalakshmi et al., 2003). Like
other legumes, mungbeans are high in protein, having around
25% of the seed dry weight and its amino acid profile is
complementary to cereal grains. Mungbean is produced in
tropical and sub-tropical rainfed environments with little or
no impounding of water, and it is prone to drought when soil
moisture or rainfall is inadequate to meet plant requirements.
It is an important pulse crop in developing countries of Asia,
Africa and Latin America where it is consumed as dry seeds,
fresh green pods (Karuppanapandian et al., 2006). The
regions that have grown traditionally mungbean are
becoming limited due to water scarcity. Tolerance at
emergence followed by seedling survival and establishment
are important in the maintenance of optimal crop stand in the
field and ultimately the economic yield (Bayuelo-Jimenez et
al., 2002). Mungbean lacks osmotic adjustment,
developmental plasticity and water extraction capacity during
the vegetative period (Chiang and Hubbell, 1978). Rainfall
distribution pattern varies across region and year. Hence,
characteristics of drought events vary across regions. Low
and variable rainfall during the early stage of crop
development contribute to terminal drought stress. Drought at
vegetative stage reduces biomass and at reproductive stage, it
can delay or prevent flowering. Therefore, target of rainfed
mungbean program is to develop cultivars with stable grain
yield under drought. Direct selection for yield under drought
integrates whole-plant response to water stress, but it is
complicated by the potentially large interaction of grain yield
with environment (Lafitte and Courtois, 2002). Breeders have
targeted the development of high-yielding, drought tolerant
mungbean cultivars. High yielding was positively correlated
to the relative water content and number of pods per plant
(Kumar and Sharma, 2009). Among the yield components
number of clusters per plant, number of pods per cluster and
pod length are important for grain yield under stress (Biradar
et al., 2007). Kang et al. (1985; 1986) selected drought
tolerant genotypes in a wide range of mungbean germplasm
lines. Tolerant lines possessed various traits, such as
continued leaf lamina expansion, stem elongation, root dry
weight, specific leaf weight and leaf area duration.
Alternatively, research efforts have concentrated on targeting
specific traits that can contribute to drought response (Lafitte,
1999). Traits such as, leaf water potential, photosynthesis,
pod density and total biomass may contribute to higher yields
under drought stress (Pannu and Singh, 1987). However,
morphological and physiological traits have been shown and
identified as marker for selecting drought tolerant genotypes,
breeding for high yield potential in drought prone
environments which remain unidentifiable, because of the

1768
complexity in the nature of drought stress. Therefore to
identify genotypes with stable grain yield under drought and
to evaluate genotype × environment (G × E) interaction
requires more sophisticated statistical tool. Additive main
effects and multiplicative interaction (AMMI) compared to
other models, was however espoused by Gauch (2006) thus
affirming its importance in environment based selection for
genotype breeding and selection for optimum performance.
In addition, it was observed that AMMI uniquely separates
G, E, and GE as required for most agricultural research
purposes, and also separates structural variation from noise as
well as any other method for the purpose of gaining accuracy
(Anandan et al., 2009). The objective of this research are i) to
determine the basis of adaptive response for yield and yield
component traits in range of environments using the AMMI
statistical model, and ii) to find association between genotype
and trait and trait and environment using biplot technique.
The water scarcity has multifarious effects on plant growth
and productivity. Therefore present investigation provide
insight into the selection strategies required for identifying
superior genotypes for target growing environments.
Result
Homogeneity of variance tests indicated homogenous error
variance for each trait in the six environments and allowed
for a combined analysis across environments. ANOVA
across environment indicated variances due to genotypes,
environments and G × E interaction are highly significant (P
< 0.01) for all the traits observed except number of seeds per
pod (data not shown). AMMI analysis was continued further
to estimate G × E for the traits exhibited significant G × E in
pooled analysis. The AMMI ANOVA (Table 2) shows that
genotype, environment, and the G × E interaction were
significant (P < 0.01). The G × E interaction accounted for a
high percentage of SS for number of branches per plant
(52%) and genotypes accounted for a large percentage of SS
remaining for all traits and ranged from 41 to 61% of the
treatment variation. The G × E was highly significant and
was further partitioned into four interaction PCA (IPCA)
axes. The criterion of postdictive success for AMMI using
all three replications and F-tests at the 0.05 probability level
recommended including the first two IPCA in the model.
The first IPCA components explained 44.27% (number of
branches) to 61.67% (plant height). The second IPCA
components explained between 21.49% (number of branches)
and 29.42% (seed yield). The mean squares for the IPCA 1
and IPCA 2 cumulatively contributed more than 75% of the
total G × E interaction for all the traits except number of
branches per plant (66%), where 66% was not sufficient to
consider a completely reliable interpretation of the behaviour
of G × E interaction. The noise SS, pattern and relevant
variation are presented in Table 3. Among all the traits
studied, number of branches per plant and number of pods
per plant accounted for 77% noise with less than 23% real
structure. Treatment SS variation explained real and relevant
patterns in the data and capturing more than the target
percentages (relevant variation) would be noise and irrelevant
features in the data. Except the traits number of branches per
plant and number of pods per plant, remaining traits
accounted for very close to the target percentage SS (Table
3). The first IPCA component of seed yield per plant
explained 75% of the treatment SS, which was close to the
target percentage SS explained (71%). Root mean square
(RMS) residual is the difference between a model’s expected
values and the actual observed values. RMS residual of
AMMI 1 for seed yield per plant in absolute quantity is 15.4
g per plant, explaining the fitness of the model. The RMS
residual of the AMMI 1 and 2 models for other traits are
presented in Table 3.
To investigate the main effects and interactions across
location - year environments, AMMI 1 and AMMI 2 biplots
were constructed for yield and yield component traits (Fig 1a
- lj). AMMI 1 biplot of main effects are shown along the
abscissa and the ordinate represents the first IPCA. The
interpretation of a biplot assay is that if main effects have
IPCA score close to zero, it indicates negligible interaction
effects and when a genotype and an environment have the
same sign on the IPCA axis, their interaction is positive; if
different, their interaction is negative. The IPCA 1 versus
IPCA 2 biplot (i.e. AMMI 2 biplot), explain the magnitude of
interaction of each genotype and environment. The genotypes
and environments that are farthest from the origin being more
responsive fit the worst. Genotypes and environments that
fall into the same sector interact positively; negatively if they
fall into opposite sectors (Anandan et al., 2009).
Plant height
The AMMI 1 biplot with the main effects plotted against the
IPCA 1 scores explained 88% of the treatment SS. The
average plant height for the 58 genotypes in each
environment measured was 41.36 cm in E1, 35.81 cm in E2,
41.37 cm in E3, 40.00 cm in E4, 35.15 cm in E5 and 43.89
cm in E6. Analysis of the genotype main effects showed that
G12 had the tallest plant (68.67 cm). All other genotypes
secured 28 cm or more except G30 (26.99 cm). Among the
environments, E2 and E5 had the shortest averaged plant
height (35 cm). In location-year environments, E1, E3, E4
and E6 displayed similar interaction effect, as they exhibited
negative IPCA with above average plant height. However,
environments E2 and E5, the same environment in two
different years, displayed higher positive interaction than
others with below average plant height (Fig 1a). AMMI2
biplot accounted for 95.6% of treatment SS and 86.1% of
interaction SS (Fig 1b). The genotypes and environments
that are farthest from the origin being more responsive fit the
worst. Genotypes and environments that fall into the same
sector interact positively; negatively if they fall into opposite
sectors. The best genotype with respect to sites E2 and E5
was G5; genotypes 40 and 21 were best for sites E3 and E6;
and for E1 and E4 the best genotypes were G38 and G13.
Number of branches per plant
The AMMI 1 biplot model for the number of branches per
plant captured 71.26% of the treatment SS, leaving a RMS
residual of 7.6 branches per plant (Fig 1c). The average
number of branches per plant for 58 genotypes in each
environment measured was1.78 in E1, 1.47 in E2, 1.58 in E3,
1.59 in E4, 1.55 in E5 and 1.57 in E6. Among all the location
– year testing environments, environments E3 and E6
displayed similar interaction effect, as they exhibited positive
IPCA with above average number of branches per plant.
However, E1 and E4 the same environment in two different
years, displayed higher positive and negative interaction
respectively. Analysis of the genotype main effects showed
that G34 and the maximum number of branches per plant
showed minimum responsiveness. The mean squares for the
IPCA 1 and IPCA 2 were significant and they cumulatively

1768
Table 1. Temperature, status of rainfall, relative humidity, soil properties, latitude, altitude and code for each environment is given
Site
Environmental
factors
E1
(Illavampatti)
E2
(Mettupallayam)
E3
(Chinnapanikkanur)
E4
(Illavampatti)
E5
(Mettupallayam)
E6
(Chinnapanikkanur)
Temp. (Max) 37.5 38.2 38 38.5 39.3 39.5
Temp. (Mini) 25.2 27 27.1 26.1 27.5 27.2
RH (%) 69 75 68 68 69 68
Rainfall (mm) 71 34.5 30 81 50.5 21
Soil texture Red sandy soil Black cotton soil Red sandy soil Red sandy soil Black cotton soil Red sandy soil
Soil pH 7.1 8.0 7.2 7.4 8.1 7.4
Latitude 11o 39’N 11o 38’N 11o 39’N 11o 39’N 11o 38’N 11o 39’N
Longitude 77 o 56’ E 77 o 56’E 77 o 56’ E 77 o 56’ E 77 o 56’E 77 o 56’ E
Altitude (ft) 771 788 773 771 788 773
Table 2. Analysis of variance for AMMI model of mung bean for yield and yield component traits under drought
Source of variation df Plant height
(cm)
No. of
branches
plant-1
No. of
clusters
plant-1
No. of pods
plant-1
100 seed wt.
(g)
Grain yield
plant-1 (g)
Treatments 347 314.8** 0.947** 10.3** 97.6** 0.62** 10.45**
Genotypes (G) 57 1137.7** 2.626** 32.8** 362.4** 1.55** 38.57**
Environments (E) 5 2053.3** 1.878** 85.0** 335.4** 9.75** 72.73**
G*E Interaction 285 119.7** 0.595** 4.4** 40.5* 0.28** 6.54**
IPCA I 61 345.0** 1.229** 11.5** 108.5** 0.75** 8.42**
IPCA II 59 141.8** 0.616* 5.2** 55.2** 0.32** 6.31**
IPCA III 57 50.2 0.492 2.1 14.1 0.12 2.01
IPCA IV 55 25.3 0.367 1.5 9.1 0.08 1.51
Residual 53 8.7 0.188 1.0 6.9 0.05 0.74
Error 684 42.4 0.458 2.5 34.1 0.10 4.13
Total 1043 134.1 0.618 5.1 56.0 0.27 6.33
*P <0.05 and **P <0.01
contributed to 82.34% of the treatment SS, leaving a RMS
residual of only 5.5 branches per plant. In AMMI 2 biplot,
genotypes 15, 21, 23, 26 and 5 in the vertex were more
responsive than other genotypes (Fig 1d). Among all the
genotypes, G15 was responsive and particularly stable for E1,
E3 and E6. Regarding the test sites, E5 was most
discriminating as indicated by the longest distance between
its marker and the origin. However, due to its large IPCA 1
and IPCA 2 score, genotypic differences observed at E5 may
not exactly reflect the genotypes in average number of
branches per plant.
Number of clusters per plant
The percentage of the treatment SS captured by an AMMI
biplot is a useful statistic for assessing the overall goodness
of fit. The AMMI 1 model captures 84.26% of the treatment
SS, leaving a RMS residual of 15.9 clusters per plant. The
environment E4 scores near zero had a little interaction
across genotypes and low discrimination among genotypes
(Fig 1e). In location – year environment, E1, E2, E3, E5 and
E6 had negative values for IPCA 1 with low main effect
except in E1. Genotypes with maximum number of clusters
per plant with low IPCA score are G34 and G12. The biplot
of two IPCA axes, together accounted for 92.8% of treatment
SS and 80% of interaction SS. This AMMI 2 model leaves
an RMS residual of 11.6 clusters per plant. In figure 1f, the
sites fell into four sectors: the best genotype with respect to
site E4 was G26. Genotype 5 was best for sites E2 and E5;
genotype 15 was best for sites E3 and E6; and for E1 the best
genotype was G21. Among all the environments, E4 was
most discriminating site as indicated by the longest vector
with the largest IPCA 2 score.
Number of pods per plant
The biplot of AMMI 1 (Fig1g) captured 85.46% of the
treatment SS, leaving a RMS residual of 40.9 pods per plant.
Analysis of the genotype main effects showed that G34 had
the highest pod numbers per plant (33). All other genotypes
produced 9 numbers of pods or more except G4 (8 pods per
plant). Among the environments, E1 had the lowest number
of pods and E5 had the highest number of pods per plant.
When considering the nature of responsiveness of genotype,
G34, G12 and G22 exhibited high main effect with low
interaction effect. Among all the location-year testing
environments, E3 and E4 displayed differences in interaction
effect but not in main effect with above average number of
pods per plant. IPCA 1 and IPCA 2 cumulatively contributed
to 95% of the treatment SS, leaving a RMS residual of 29.4
pods per plant. Genotypes G5, G57, G14, G13, G1 and G12
were the most responsive genotypes, while E2 was most
discriminating location (Fig 1h). Site E5 was not the most
discriminating, but genotypic differences at E5 should be
highly consistent with those averaged over sites, because it
had near-zero IPCA 2 scores compared to the other except
that the IPCA 2 score for E1 was smaller than that of E5.
100 seed weight
The AMMI 1 model captures on SS of 182.33, which is
84.7% of the treatment SS and 58.03% of interaction SS,
leaving a RMS residual of 3.73 g for 100 seeds.
Environments E2 and E5 showed more variability for
interaction effects. On the other hand, environment E1 and
E4, the same environment in two different years, were
clustered together and they exhibited positive IPCA 1 score
1769

1770
with above average 100 seed weight. Genotypes G40, G50,
G45, G22, G57, G55 and G37 differ in their main effect
considerably with low interaction effect. The AMMI 2 biplot
captured 84.7% of treatment SS, leaving a RMS residual of
2.63 g for 100 seeds. Among the six environments, E1 alone
exhibited interaction considerably lower than others.
However, the three locations E1, E2 and E3 were cluster with
their corresponding locations E4, E5 and E6 respectively in
the same sector. Among all the genotypes, G35, G38, G48,
G16, G22, G27, G39, G23 and G36 were more responsive
and the remaining genotypes were positioned around the plot
origin with low interaction effect.
Grain yield per plant
Analysis of the genotype main effects showed that G34 had
the highest yield (9.45 g/plant). All other genotypes yielded
2.4 g or more except G4 (2.18 g/plant). Among the
environments, E1 had the highest mean yield (5.44 g/plant).
The AMMI 1 model for the grain yield captures 84.8% of the
treatment SS, leaving a RMS residual of 15.4 g per plant.
Among all the location-year testing environments,
environments E2, E3, E4 and E5 displayed similar main
effects, but they differed in their interactions effects (Fig 1i).
The IPCA 1 score of genotypes G34, G12, G19, G22, G29,
1771
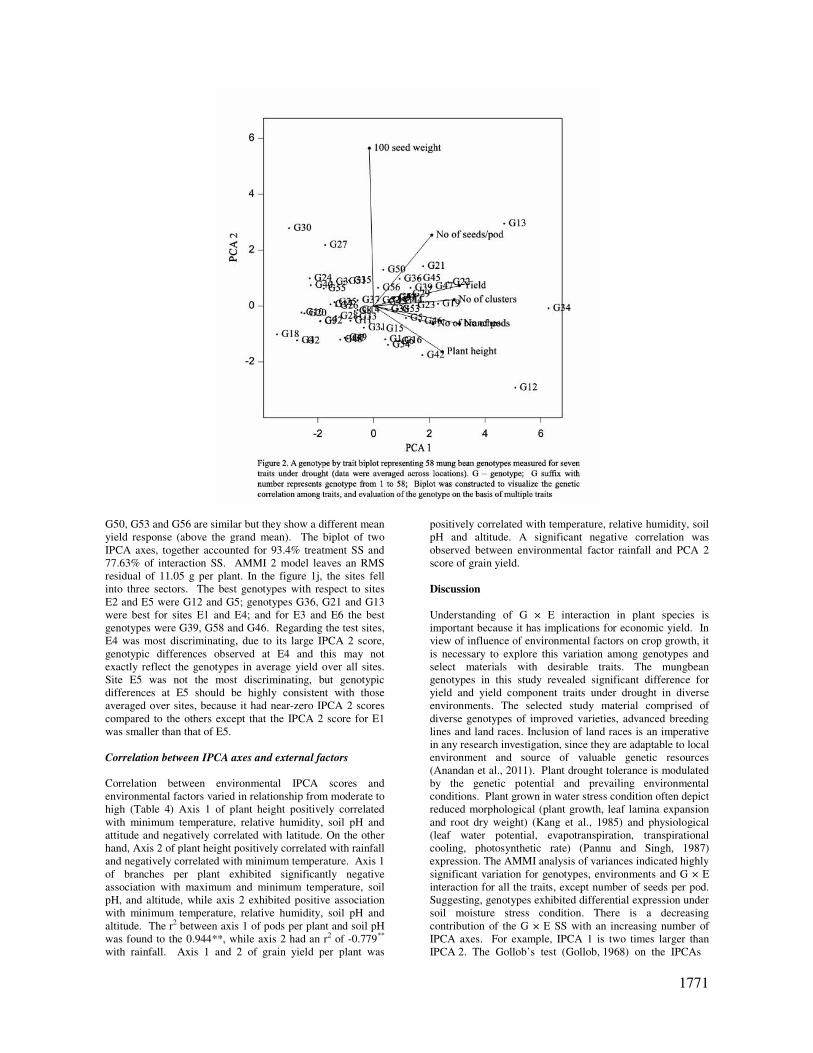
G50, G53 and G56 are similar but they show a different mean
yield response (above the grand mean). The biplot of two
IPCA axes, together accounted for 93.4% treatment SS and
77.63% of interaction SS. AMMI 2 model leaves an RMS
residual of 11.05 g per plant. In the figure 1j, the sites fell
into three sectors. The best genotypes with respect to sites
E2 and E5 were G12 and G5; genotypes G36, G21 and G13
were best for sites E1 and E4; and for E3 and E6 the best
genotypes were G39, G58 and G46. Regarding the test sites,
E4 was most discriminating, due to its large IPCA 2 score,
genotypic differences observed at E4 and this may not
exactly reflect the genotypes in average yield over all sites.
Site E5 was not the most discriminating, but genotypic
differences at E5 should be highly consistent with those
averaged over sites, because it had near-zero IPCA 2 scores
compared to the others except that the IPCA 2 score for E1
was smaller than that of E5.
Correlation between IPCA axes and external factors
Correlation between environmental IPCA scores and
environmental factors varied in relationship from moderate to
high (Table 4) Axis 1 of plant height positively correlated
with minimum temperature, relative humidity, soil pH and
attitude and negatively correlated with latitude. On the other
hand, Axis 2 of plant height positively correlated with rainfall
and negatively correlated with minimum temperature. Axis 1
of branches per plant exhibited significantly negative
association with maximum and minimum temperature, soil
pH, and altitude, while axis 2 exhibited positive association
with minimum temperature, relative humidity, soil pH and
altitude. The r2 between axis 1 of pods per plant and soil pH
was found to the 0.944**, while axis 2 had an r2 of -0.779**
with rainfall. Axis 1 and 2 of grain yield per plant was
positively correlated with temperature, relative humidity, soil
pH and altitude. A significant negative correlation was
observed between environmental factor rainfall and PCA 2
score of grain yield.
Discussion
Understanding of G × E interaction in plant species is
important because it has implications for economic yield. In
view of influence of environmental factors on crop growth, it
is necessary to explore this variation among genotypes and
select materials with desirable traits. The mungbean
genotypes in this study revealed significant difference for
yield and yield component traits under drought in diverse
environments. The selected study material comprised of
diverse genotypes of improved varieties, advanced breeding
lines and land races. Inclusion of land races is an imperative
in any research investigation, since they are adaptable to local
environment and source of valuable genetic resources
(Anandan et al., 2011). Plant drought tolerance is modulated
by the genetic potential and prevailing environmental
conditions. Plant grown in water stress condition often depict
reduced morphological (plant growth, leaf lamina expansion
and root dry weight) (Kang et al., 1985) and physiological
(leaf water potential, evapotranspiration, transpirational
cooling, photosynthetic rate) (Pannu and Singh, 1987)
expression. The AMMI analysis of variances indicated highly
significant variation for genotypes, environments and G × E
interaction for all the traits, except number of seeds per pod.
Suggesting, genotypes exhibited differential expression under
soil moisture stress condition. There is a decreasing
contribution of the G × E SS with an increasing number of
IPCA axes. For example, IPCA 1 is two times larger than
IPCA 2. The Gollob’s test (Gollob, 1968) on the IPCAs

1772
Table 3. The errors from uncontrolled variation, percent genotype × environment interaction explained by each statistically significant
interaction principal component axis (IPCA), IPCA captures percent interaction and root mean square (RMS) residual of AMMI (in percent).
Plant height
(cm)
No. of
branches
plant-1
No. of
clusters plant-
1
No. of pods
plant-1
100 seed wt.
(g)
Grain yield
plant-1 (g)
Noise SS 35.41 77.05 56.37 84.19 36.38 40.63
Real structure (pattern) 64.59 22.95 43.63 15.81 63.62 59.37 Errors from uncontrolled
variation Relevant variation (target) 79.54 57.40 68.02 66.36 64.11 70.53
% G × E of IPCA 1 61.67 44.27 55.70 57.33 58.03 48.21 Percent genotype ×
environment interaction % G × E of IPCA 2 24.52 21.49 24.29 28.21 24.14 29.42
% of IPCA 1 78.63 68.40 72.31 80.51 62.07 74.79 IPCA captures percent
interaction % of IPCA 2 86.29 79.48 80.94 90.12 70.86 83.43
RMS AMMI I 68.71 7.63 15.91 40.89 3.73 15.40 Root mean square (RMS)
residual of AMMI RMS AMMI II 43.07 5.49 11.62 29.42 2.63 11.05
Table 4. Correlation between IPCA axes and environmental factors for the AMMI analysis of yield and yield component traits of mung
bean under drought
Characters IPCA
axes
Temp.
(Max)
Temp.
(Mini) RH (%)
Rainfall
(mm) Soil pH Latitude Altitude (ft)
PCA 1 0.247 0.449** 0.659** -0.11 0.943** -0.993** 0.980** Plant height (cm)
PCA 2 -0.247 -0.721** 0.018 0.919** -0.043 0.058 -0.162
PCA 1 -0.419** -0.441** -0.248 -0.225 -0.831** 0.736** -0.708** No. of branches plant-1
PCA 2 0.07 0.477** 0.457** -0.644** 0.453** -0.604** 0.653**
PCA 1 0.262 0.342** 0.639** 0.117 0.942** -0.933** 0.898** No. of clusters plant-1
PCA 2 -0.046 -0.522** -0.320* 0.816** -0.225 0.360** -0.435**
PCA 1 0.267* 0.419** 0.560** 0.049 0.944** -0.962** 0.938** No. of pods plant-1
PCA 2 -0.044 0.342** 0.331* -0.779** 0.081 -0.232 0.299*
PCA 1 -0.022 0.054 0.618** 0.340* 0.792** -0.861** 0.802** 100 seed wt. (g)
PCA 2 0.310* 0.670** 0.271* -0.852** 0.375** -0.447** 0.526**
PCA 1 0.328* 0.348** 0.410** 0.184 0.901** -0.893** 0.858** Grain yield plant-1 (g)
PCA 2 0.099 0.466** 0.451** -0.831** 0.263* -0.380** 0.449**
*P <0.05 and **P <0.01
declared two components significant, while a third IPCA is
non significant. This is in line with Yan et al. (2002) that
most of the interaction occurs in the first few axes.
Conversely, Sivapalan et al. (2000) recommended an AMMI
model with the first four IPCAs. The residual SS of AMMI
for all the traits were non significant with minimum residual
mean SS and demonstrates a greater accuracy of the model.
The genotypes utilized in the present investigation are
adapted to tropics and subtropics and they have short to long
maturity period. The AMMI 1 biplot of yield (Fig 1i) clearly
groups the genotype related to maturity period, with early
duration genotype at the bottom (G1, G11, G35, G58, G39,
G21 and G13), long duration genotype at the top (G43, G5,
G48 and G26) and remaining genotypes grouped in the
middle are medium duration mungbeans. Drought or
moisture stress did not effect days to flower initiation
significantly (Kumar and Sharma, 2009). However, days to
flowering effects grain yield. Longer days to flowering,
directly influences source availability and accumulation of
assimilate, which are later remobilized for grain production.
A shorter day to flowering helps to avoid unfavourable
growing conditions (Yoshida, 1981). In the present
experiment, the mungbean cultivars exhibited differences in
growth and grain yield when subjected to drought conditions
during the growing season. This is in line with Thomas et al.
(2004). The presence of significant G × E interaction renders
overall means, less reliable and often confounds attempts at
identifying high yielding genotypes for specific site as well
as for wide adaptability. To gain insight into the interaction,
AMMI biplot has a clear agricultural interpretation (Zobel et
al., 1988). Among the tested genotypes G34, G12, G47, G22,
G45, G23, G53, G6, G41, G44 and G29 (medium duration);
G13, G21, G35, G58 and G39 (early duration) and G43 and
G5 (late maturing) exhibited high yield irrespective of their
responsiveness (Fig 2). High yielding low responsive
genotypes exhibited higher plant height than above average
with low interaction effect. Similarly, poor yielding low
responsive genotypes exhibited shorter plant height. For
example, less responsive genotypes 12 and 34 produced
significantly higher grain yield, which also showed higher
values for plant height. On the other hand, the least
responsive genotypes G2, G30, G4 and G40 exhibited lesser
yield, which also showed lower values for plant height. The
plant may be stunted due to the threshold turgor for stem cell
elongation is not attained under moisture stress. Kang et al.
(1985) reported significant reduction in plant height of
mungbean cultivars grown without water when compared to
the same grown with water. Thus, G × E interaction biplot of
plant height provides additional information regarding
drought response. The increased plant height by adaptive
genotypes, certainly harvest more sunlight to prepare more
photosynthates. Sangakkaran et al. (2000) reported that
drought tolerant mungbean diverted more carbon to roots
under moisture stress. When mungbean is grown under
rainfed condition, greater rooting depth should help to
acquire stored water from various depths to improve stability
in grain yield. Droughted plants diverted significantly higher
dry matter to roots and stems, while well watered plants
diverted to pods and grains (Kumar and Sharma, 2009). The
grain yield of nine low responsive genotypes (G12, G19,
G22, G29, G34, G42, G44, G50 and G53) pooled over
environments was not significantly reduced than average
yield with a reduction in soil moisture. The genotypes which
showed an enhanced yield over environments has higher

1773
plant height, number of branches, number of clusters, number
of pods, 100 seed weight and number of seeds per pod (Fig 3)
than population mean with less responsiveness (Fig 1a-1j).
The increase in yield among the genotypes might have been
due to continuous leaf expansion and root even under
conditions of reduced soil moisture (Kang et al., 1986).
Wahid and Rasul (2004) reported that green pods contributes
upto 20% of carbon from its own photosynthesis. Many
reports document the changes in seed yield as reliable
yardsticks to appraise drought tolerance. Drought tolerance at
the reproductive stage is the most important in terms of
economic yield. The development of reproductive organs,
which is under the control of photoassimilate production and
partitioning by the source tissues, is at this stage the most
critical (Taiz and Zeiger, 2002; Wahid and Rasul, 2004).
Therefore, increased drought at this stage, has a pronounced
effect on fruit development and yield. This study revealed
the G × E interaction pattern on grain yield, plant height
number of branches, pod number, cluster number and 100
seed weight in mungbean in response to moisture stress. The
environments show much variability in both main effects and
interactions. Trait association by environment biplot,
clustered environments into four distinct groups: Group 1
includes E1, group 2 consists of E4, group 3 includes E2 and
E5 and Group 4 consists of E6 and E3. Among all the
location-year testing environments, environment E1 interacts
with genotypes in much of the same way as E4. These two
sites displayed low interaction effect with above average
main effect. Therefore, E1 and E4 were classified as low
responsive environments and suitable site to study the
response of drought tolerant mechanism in mungbean. Trait
association by environment biplot (Fig 3) separated E1 and
E4, the same environment in two different years. The sites
E2 and E3 clustered with their corresponding environments
(years) E5 and E6 respectively. The clustering of
corresponding sites can be explained by similar weather
condition and rainfall pattern in both years. Soil texture,
distribution, and amount of rainfall received differentiated the
environment E2 and E5 from the other four environments.
Rainfall received during germination and late reproductive
stage and nature of Black Cotton Soil has differentiated E2
and E5 from the rest of the environments. Black cotton soil
has good water holding capacity with sufficient phosphorous
and other minerals required for the growth of legumes.
Separation between E1 and E4 might have been due to
differences in total rainfall received during the crop growth.
In location-year testing environments, environments E1 and
E4 received higher rainfall (Table 2) than other
environments. Similarly, there was sufficient rainfall during
germination, vegetative and reproductive stage. However,
environment E1 has received rainfall during initial
reproductive stage, while E4 received rainfall during two
intervals of its reproductive stage. Therefore, E4 has been
plotted near grain yield in trait association by environment
biplot (Fig 3). Among all the locations, E5 has been
categorized as highly interactive environment, because it
exhibited high positive interaction (IPCA score) effect with
above average main effect for most of the traits studied. The
high interaction effect of E5 might probably be due to higher
amount of rainfall received than its corresponding E2
environment. Furthermore, the environments E3 and E6
displayed lower main effects and higher negative interactions
than other environments, which can be explained by
differences in available soil moisture, soil texture, rainfall
and nutrient status of the soil. Correlations between
environmental factors and the environment IPCA scores can
lead to useful biological interpretation of the interaction
effects. All traits of environmental IPCA axes were
correlated with environmental factors with moderate to high
interaction effect in positive or negative direction. IPCA axes
1 of plant height, number of clusters, number of pods per
plant and grain yield was favoured by environmental factors
1774
like minimum temperature, high relative humidity, increased
soil pH and reduced photoperiod. IPCA axis 2 of plant height
and clusters per plant was highly favoured by rainfall.
Correlating the external environmental factors with the
environmental IPCA scores will help to identify the particular
factor responsible for the interaction effects.
Materials and methods
Plant material and experimental details
The experiment was conducted during the summer season at
Salem district North West zone of Tamil Nadu, India during
2009-2010 in three locations over two years. The test
environments were chosen to represent environments
typically rainfed, which receives less than 80 mm rainfall
during single mungbean cropping period. The location
details, planting dates, soil types, rainfall distribution pattern
were presented in Table 1. The Mungbean genotypes used in
this study comprised two genetically distinct approved
varieties (Co 6 and Co 7), 39 promising advanced lines and
17 local cultivars were evaluated in six environments. At
each location the experiment was a randomized complete
block design with three replications. Essential plant nutrients,
25 kg ha-1 N (urea), 17.4 kg ha-1 P2O5 (Single super
phosphate), 20 kg ha-1 K2O (muriate of potash) were supplied
as basal dose before sowing. Two rows, 4m in length were
planted with a spacing of 30 cm between rows. Each row
contains 40 plants spaced at 10 cm apart. Plots were managed
conventionally following the established normal practices.
Plant height (cm), number of branches per plant, number of
clusters per plant, number of pods per plant, number of seeds
per pod and grain yield per plant (g) was observed in 10
plants selected at random in each replication. A sample of
100 seeds were collected at random for each genotype to
estimate 100 seed weight and presented in grams.
To analyze the G × E interaction, the AMMI model was
used (Gauch, 1988). The AMMI statistical model is a
combination of customary analysis of variance (ANOVA)
and principal component analysis (PCA). The equation of
this model is:
Yge = µ + αg + βe + Σn λn γgn δen + ρge + εger
with Yge is the trait of genotype g in environment e; µ is the
grand mean, αg is the genotypes deviation from grand mean
and the environment deviation βe, λn is the eigenvalue of
PCA axis n; γgn and δen are the genotype and environment
PCA scores for PCA axis n; ρge is the residual of AMMI
model and εger is the random error. AMMI uses ordinary
ANOVA to analyze main effects and principal component to
analyze the non-additive residual (interaction) left over by the
ANOVA model. PCA decomposes the interaction into PCA
axes 1 to N and a residual remains if all axes are not used. If
most of the G × E interaction sum of squares (SS) can be
captured in the first N PCA axes, a reduced AMMI model,
incorporating only the first N axes, can be used. The
interaction between any genotype and environment can be
estimated by multiplying the score of the interaction principal
component axis (IPCA) of genotype by an environment IPCA
score.
Postdictive assessments
The percentage of the treatment sum of squares (SS) captured
by an AMMI biplot is a useful statistic for assessing the
overall goodness of fit. It is calculated by percentage addition
of SS (Genotype + Environment + IPCA 1) divide treatment
SS. In addition, root mean square (RMS) residual is a useful
summary statistic regarding model fit. To avoid spurious
interpretation of statistical result, the relevant portion of G ×
E interaction was calculated for each trait. Factoring the
errors from uncontrolled variation (“noise”) out of the total G
× E interaction SS is important because most of the noise
appears in the interaction, since the interaction contains
majority of the treatment degrees of freedom. “Noise” SS,
“real structure” SS and target relevant variation percentage
were calculated as described by Gauch and Zobel (1997).
For a full description of AMMI models and interpretations
see Gauch and Zobel (1996; 1997). Genotype × trait and
environment × trait averaged across all environments were
investigated using biplots. These biplots were constructed to
visualization of the genetic correlation among traits, and
evaluation of the genotype or environment on the basis of
multiple traits (Lee et al., 2003). Correlation with external
factors helps to study the measurable changes in the
environments or genotypes, which are related to the
interaction in the data (McLaren and Chaudhary, 1998;
Anandan et al., 2009). Correlation between environment
IPCA scores of a trait and some factors represents the
particular environmental factors influence on the trait.
Conclusion
Increased drought tolerance should contribute to yield
stability across the environments. Therefore, our analyzes
have shown the insight into the nature of G × E interaction in
the mungbean raised under rainfed and emphasises
importance of varietal development for moisture stress
condition. Further, this study brings out that, drought
tolerance in mungbean is related to better vegetative growth
for more efficient photoassimilates partitioned to root growth
to acquire higher yield under drought condition. Correlation
studies revealed that minimum temperature, relative
humidity, soil pH and rainfall had highly interacted and
influenced the yield and component traits of mungbean.
Biplots generated by AMMI model gives more valuable and
hidden useful information from the data, which gives an
overall picture of genotype behaviour under moisture stress
condition.
References
Anandan A, Rajiv G, Eswaran R, Prakash M (2011)
Genotypic variation and relationships between quality traits
and trace elements in traditional and improved rice (Oryza
sativa L.) genotypes. J Food Sci. 76(4): 122 - 130
Anandan A, Sabesan T, Eswaran R, Rajiv G, Muthalagan N,
Suresh R (2009) Appraisal of environmental interaction on
quality traits of rice by additive main effects and
multiplicative interaction analysis. Cereal Res Comm.
37(1): 139-148
Bayuelo-Jimenez JS, Craig, R, Lynch JP (2002) Salinity
tolerance of Phaseolus species during germination and
early seedling growth. Crop Sci. 42: 584-1594
Biradar KS, Salimath PM, Ravikumar RL (2007) Association
of Early Vigour with Drought Tolerance in Greengram
(Vigna radiata (L.) Wilczek). Karnataka J Agric Sci. 20(3):
610-612
Chiang MY, Hubbel JN (1978) Effect of irrigation on
mungbean yield. In: Proceeding of First International
Mungbean Symposium, AVRDC, Shanhua, Tainan, pp. 93-
96

1774
1775
Gauch GH, Zobel RW (1996) AMMI analysis of yield trials.
In: Kang MS, Gauch HG (eds) Genotype by environment
interaction, CRC Press, Boca Raton, FL. pp 85-122
Gauch HG (1988) Model selection and validation for yield
trials with interaction. Biometrics 44: 705-715
Gauch JHG, Zobel RW (1997) Identifying mega-
environments and targeting genotypes. Crop Sci. 37: 311-
326
Gauch Jr. HG (2006) Statistical Analysis of Yield Trials by
AMMI and GGE. Crop Sci. 46: 1488-500
Gollob HF (1968) A statistical model which combines
features of factor analysis and analysis of variance
techniques. Psychometrika. 33: 73 - 115
Kang CW, Kuo GC, Son ER (1985) Studies on drought
tolerance screening method in mungbean 1. Drought
tolerance of seedling stage in green house. Res Rept RDA.
(crops) 27(1): 191-198
Kang CW, Kuo GC, Son ER (1986) Screening mung beans
(Vigna radiate L. Wilczek) for drought tolerance 2. Field
trial. Res Rept RDA. (crops) 28(1): 156-161
Karuppanapandian T, Karuppudurai T, Sinha PB, Haniya
AH, Manoharan K (2006) Genetic diversity in green gram
[Vigna radiata (L.)] landraces analyzed by using random
amplified polymorphic DNA (RAPD). Afr J Biotechnol. 5:
1214-1219
Kumar A, Sharma KD (2009) Physiological Responses and
Dry Matter Partitioning of Summer Mungbean (Vigna
radiata L.) Genotypes Subjected to Drought Conditions. J
Agron Crop Sci. 95: 270–277
Lafitte HR (1999) Genetic improvement of rice for water-
limited environments: constraints and research
opportunities, In: O'Toole JC et al. (ed) Genetic
improvement of rice for water-limited environments, IRRI,
Los Banos, Philippines
Lafitte R, Courtois B (2002) Interpreting cultivar ×
environment interactions for yield in upland rice: assigning
value to drought-adaptive traits. Crop Sci 42: 1409–1420
Lee SJ, Yan W, Joung KA, Ill MC (2003) Effects of year,
site, genotype, and their interactions on the concentration
of various isoflavones in soybean. Field Crops Res.
81:181–192
Mc Laren CG, Chaudhary RC (1998) Use of additive main
effects and multiplicative interaction models to analyze
multilocation rice variety trials. Oryza. 34: 306- 318
Pannu RK, Singh DP (1987) Influence of water deficits on
morpho-physiological and yield behaviour of mungbean
(Vigna radiata (L.) wilczek). Paper presented the 2nd
international symposium on mungbean, AVRDC, Bangkok,
Thailand, 16-20 November 1987
Sangakkaran UR, Frehner M, Nosberger J, (2000) Effect of
soil moisture and potassium fertilizer on shoot water
potential, photosynthesis and partitioning of carbon in
mungbean and cowpea. J Agron Crop Sci. 185: 201–207
Sivapalan S, Brien LO, Ferrara GO, Hollamby GL, Barclay I,
Martin PJ (2000) An adaptation analysis of Australian and
CIMMYT/ICARDA wheat germplasm in Australian
production environments. Aust J Agric Res. 51: 903-915
Taiz L, Zeiger E (2002) Plant Physiology, 3rd ed. Sinauer
Associates Inc Publishers Massachusetts
Thomas MJR, Fukai S, Peoples MB (2004) The effect of
timing and severity of water deficit on growth,
development, yield accumulation and nitrogen fixation of
mungbean. Field Crops Res. 86: 67–80
Vijayalakshmi P, Amirthaveni S, Devadas RP, Weinberger
K, Tsou SCS, Shanlnugasundaram S (2003) Enhanced
bioavailability of iron from mung beans and its effects on
health of school children. Technical Bulletin No. 30.
Shanhua, Tainan, Taiwan 741, Republic of China (ROC).
Asian Vegetable Research and Development Center. p 32
Wahid A, Rasul E (2004) Photosynthesis in leaf, stem, flower
and fruit. In: Pessarakli M (ed) Handbook of
Photosynthesis, 2nd ed. CRC Press Florida, pp 479-497
Yan W, Rajcan I (2002) Biplots analysis of the test sites and
trait relations of soybean in Ontario. Crop Sci. 42: 11-20
Yoshida S (1981) Fundamentals of Rice Crop Science. IRRI,
Los Banos, Philippines
Zobel RW, Wright MJ, Gauch Jr HG (1988) Statistical
analysis of a yield trial. Agron J. 80: 388—393