Embed Size (px)
Citation preview
INCLUSIVE GROWTH AND POLICIES:THE SOUTH ASIAN EXPERIENCE
Thangavel PalanivelChief Economist for Asia-Pacific
UNDP, New York
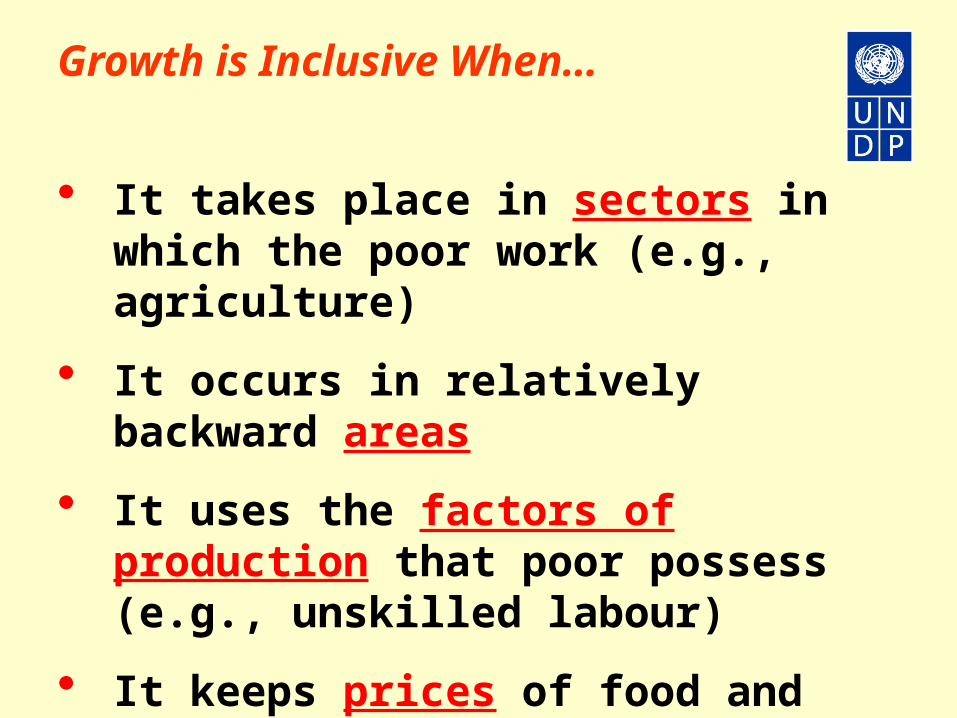
Growth is Inclusive When…
• It takes place in sectors in which the poor work (e.g., agriculture)
• It occurs in relatively backward areas
• It uses the factors of production that poor possess (e.g., unskilled labour)
• It keeps prices of food and other basics relatively low
Growth is accelerating, but it is concentrated in certain sectors and areas. Consequently inequality has increased and poverty reduction slowed down
Message 1:
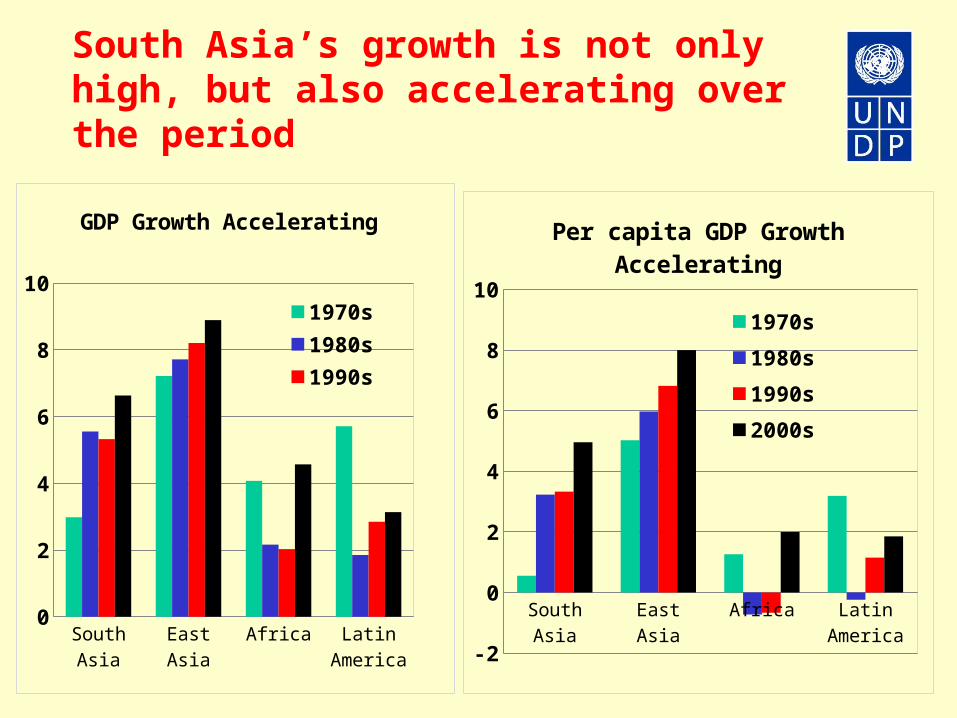
South Asia’s growth is not only high, but also accelerating over the period
South Asia East Asia Africa Latin America
-2
0
2
4
6
8
10
Per capita GDP Growth Accelerat-ing
1970s
1980s
1990s
2000s
South Asia East Asia Africa Latin America
0
2
4
6
8
10
GDP Growth Accelerating
1970s 1980s
1990s 2000s

Despite accelerated economic growth, there is a slowdown in poverty reduction
South Asia East Asia Africa China India
-10
-8
-6
-4
-2
0
2
Annual rate of poverty reduction slowed down in India and South
Asia
1981-90
1990-99
1999-2005
Ch
ange
in P
over
ty r
ate
( $1
.25
a d
ay)
South Asia
East Asia
Africa China India0.0
0.2
0.4
0.6
0.8
1.0
1.2
1.4
Growth elasticity of poverty declined in India and South Asia
1981-90 1990-99 1999-2005
(%)
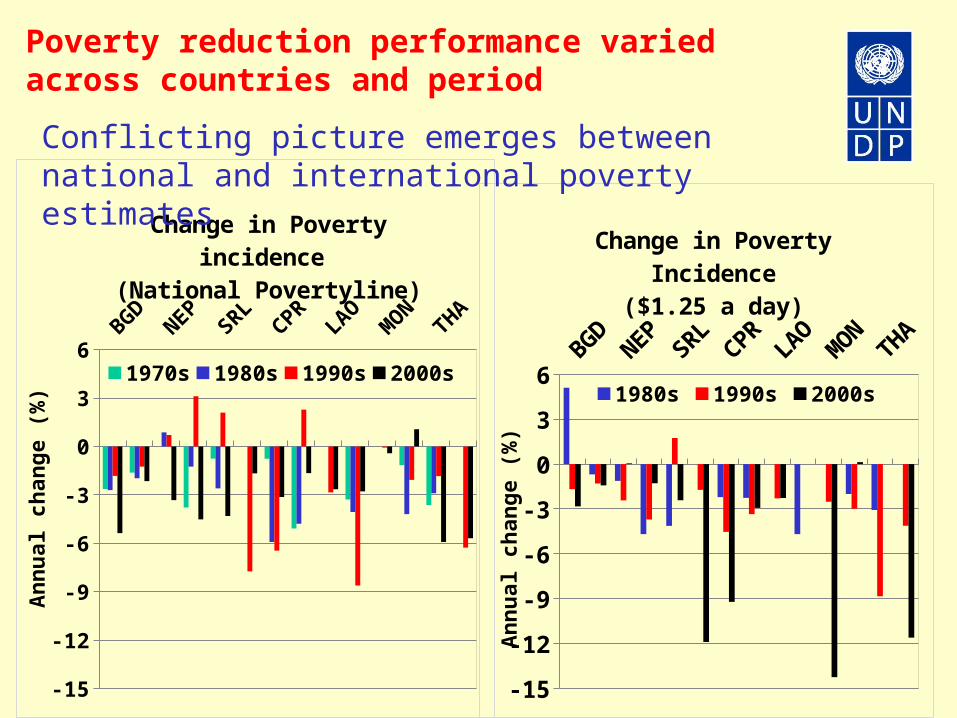
Poverty reduction performance varied across countries and period
BGD
NEPSRL
CPRLAO
MO
NTH
A
-15
-12
-9
-6
-3
0
3
6
Change in Poverty Incidence($1.25 a day)
1980s 1990s 2000s
An
nu
al c
han
ge (
%)
BGDNEP
SRLCPR
LAOM
ONTHA
-15
-12
-9
-6
-3
0
3
6
Change in Poverty incidence (National Povertyline)
1970s 1980s 1990s 2000s
An
nu
al c
han
ge (
%)
Conflicting picture emerges between national and international poverty estimates
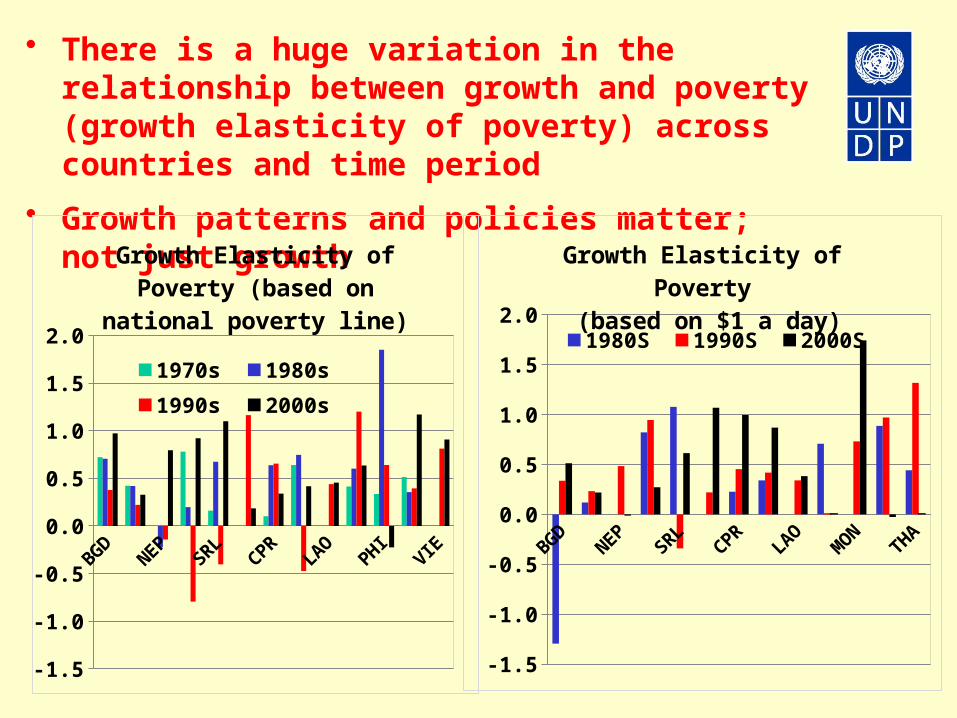
• There is a huge variation in the relationship between growth and poverty (growth elasticity of poverty) across countries and time period
• Growth patterns and policies matter; not just growth
BGD
NEPSRL
CPRLAO
PHI
VIE
-1.5
-1.0
-0.5
0.0
0.5
1.0
1.5
2.0
Growth Elasticity of Poverty (based on national poverty line)
1970s 1980s 1990s
2000s
BGD
NEPSRL
CPRLAO
MO
NTH
A
-1.5
-1.0
-0.5
0.0
0.5
1.0
1.5
2.0
Growth Elasticity of Poverty (based on $1 a day)
1980S 1990S 2000S
Message 2:
Growth elasticity of poverty varies across countries and periods due to
1. Changes in the pattern of growth affect income distribution which in turn influence the relationship between growth and poverty
2. Initial levels of inequality also determine the strength of the nexus between growth and poverty

Growth in Certain Sectors or Areas is More Pro-Poor
Agr
Ind
Ser
Agr
Ind
Ser
Agr
Ind
Ser
Agr
Ind
Ser
Agr
Ind
Ser
Bangladesh
India Nepal Pakistan Sri Lanka
0
4
8
12
Sectoral Growth in South Asia
1970s 1980s 1990s
2000s
%
Agr Ind Ser Agr Ind SerSouth Asia East Asia
0
4
8
12
Sectoral GDP Growth
1970s 1980s 1990s 2000s
%
Agricultural growth in China and India (1980s), industrial growth in Malaysia and Thailand (1970s & 1980s), and services growth in India and Brazil (2000s)
19811984
19871990
19931996
19992002
200520
25
30
35
40
45
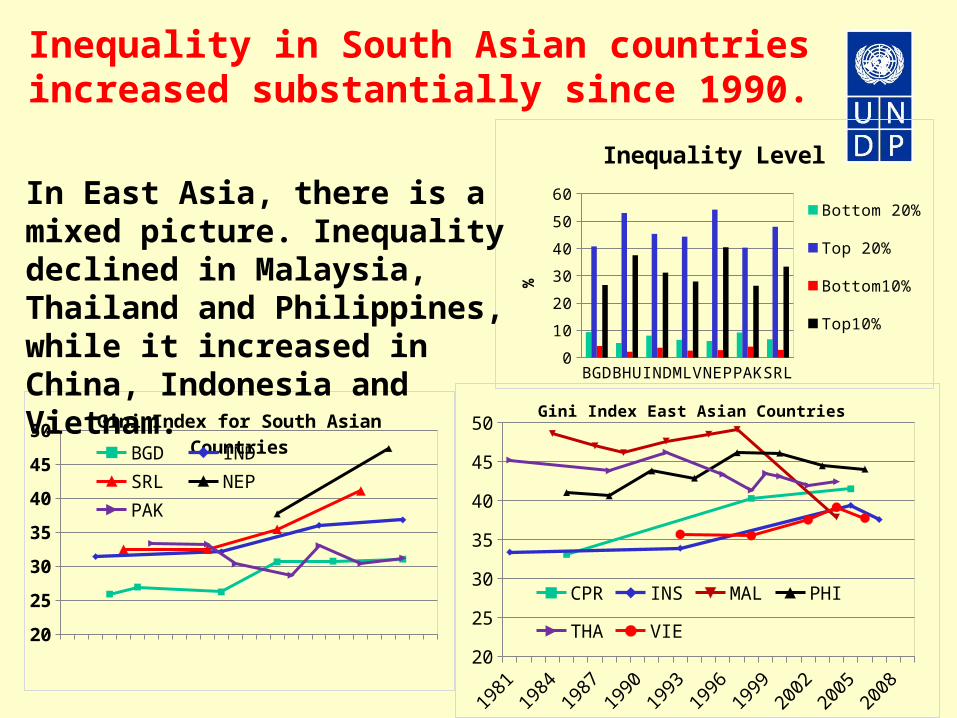
50Gini Index for South Asian Countries
BGD IND
SRL NEP
PAK
19811984
19871990
19931996
19992002
20052008
20
25
30
35
40
45
50Gini Index East Asian Countries
CPR INS MAL PHI
THA VIE
BGDBHU
IND
MLV
NEPPAK
SRL0
10
20
30
40
50
60
Inequality Level
Bottom 20%
Top 20%
Bottom10%
Top10%
%
Inequality in South Asian countries increased substantially since 1990.
In East Asia, there is a mixed picture. Inequality declined in Malaysia, Thailand and Philippines, while it increased in China, Indonesia and Vietnam.
Inequalities increased in South Asia but there is a need to distinguish between good and bad inequalities
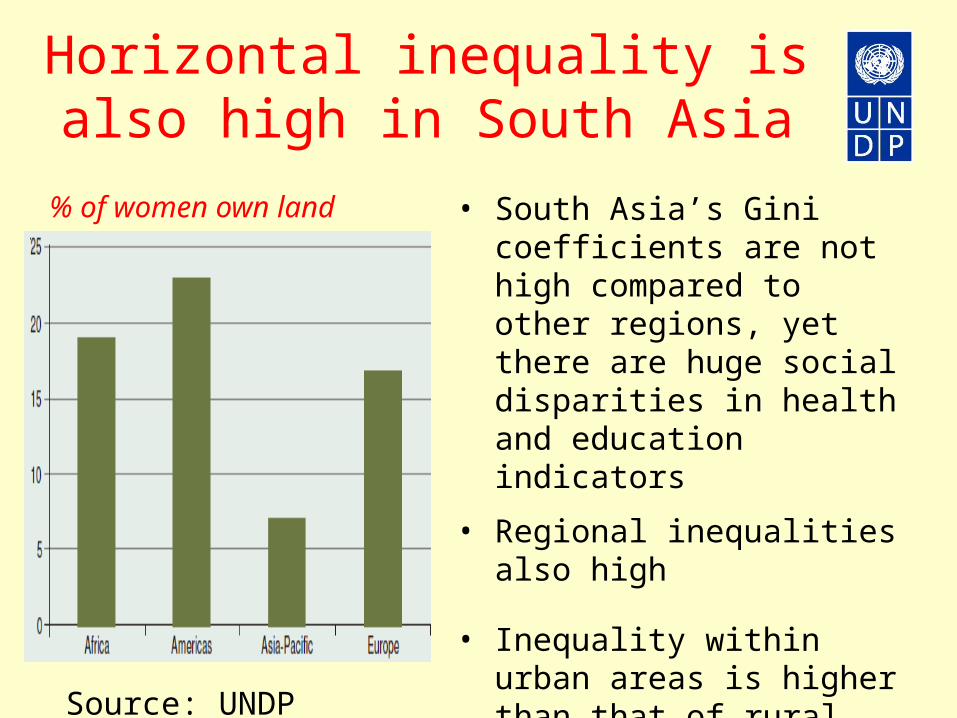
• South Asia’s Gini coefficients are not high compared to other regions, yet there are huge social disparities in health and education indicators
• Regional inequalities also high
• Inequality within urban areas is higher than that of rural areas
• Women own only 7% of farms in Asia versus 18% in Africa;
Horizontal inequality is also high in South Asia
% of women own land
Source: UNDP
Employment is growing but low labour productivity gains limit the creation of decent employment opportunities; almost half the workers in South Asia are ‘working poor’
Message 3:
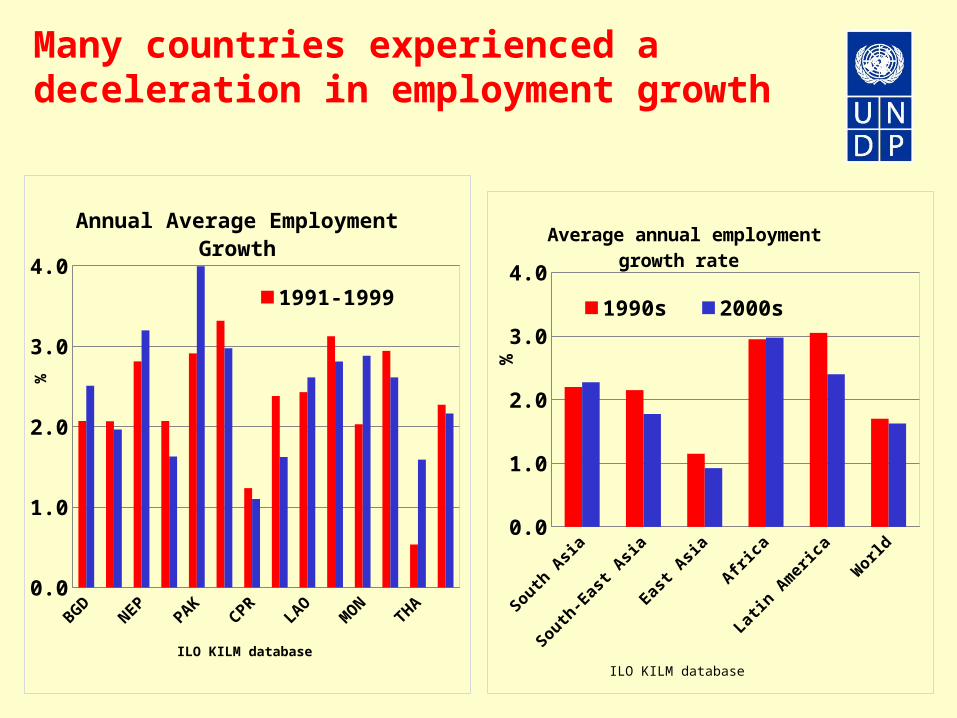
Many countries experienced a deceleration in employment growth
South
Asia
South
-Eas
t Asia
East A
sia
Africa
Latin
Am
erica
Wor
ld0.0
1.0
2.0
3.0
4.0
Average annual employment growth rate
1990s 2000s
ILO KILM database
%
BGDIN
DNEP
SRLPAK
CMB
CPRIN
SLAO
MAL
MON
PHITHA
VIE0.0
1.0
2.0
3.0
4.0
Annual Average Employment Growth
1991-1999 2000-2008
ILO KILM database
%
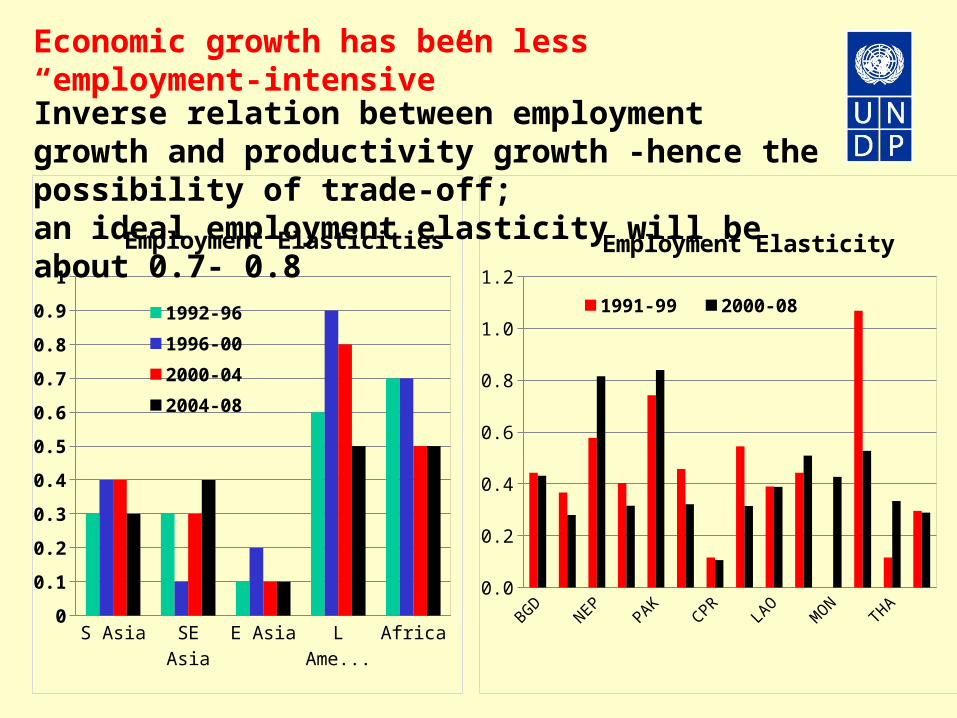
Economic growth has been less “employment-intensive”
S Asia SE Asia E Asia L America Africa0
0.1
0.2
0.3
0.4
0.5
0.6
0.7
0.8
0.9
1
Employment Elasticities
1992-96
1996-00
2000-04
2004-08
BGDIN
DNEP
SRLPAK
CMB
CPRIN
SLAO
MAL
MON
PHITHA
VIE0.0
0.2
0.4
0.6
0.8
1.0
1.2
Employment Elasticity
1991-99 2000-08
Inverse relation between employment growth and productivity growth -hence the possibility of trade-off; an ideal employment elasticity will be about 0.7- 0.8
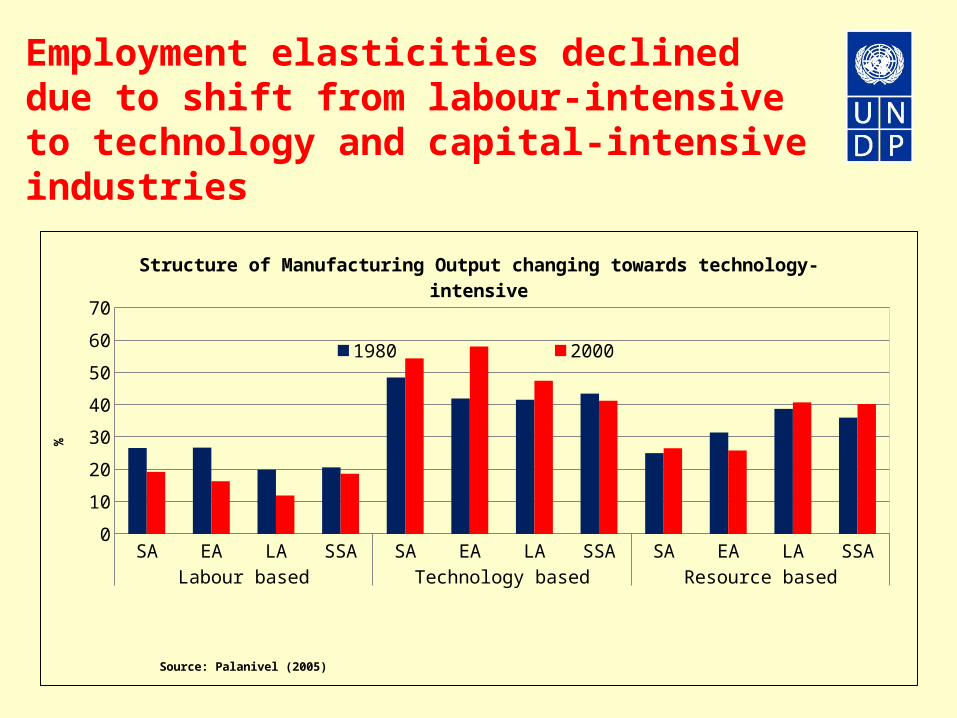
Employment elasticities declined due to shift from labour-intensive to technology and capital-intensive industries
SA EA LA SSA SA EA LA SSA SA EA LA SSALabour based Technology based Resource based
0
10
20
30
40
50
60
70
Structure of Manufacturing Output changing towards technology-intensive
1980 2000
Source: Palanivel (2005)
%
• Economic reforms and transition (e.g., China)
• Incentive structure favour capital-intensive production (e.g., tax holidays to promote FDI, cheap credits)
• Capital deepening in the face of labour shortage (example: Malaysia since the 1990s)
• Difficulties faced by labour intensive industries (e.g., rigid labour laws, lack of access to credit by SMEs)
Economic Reforms and Policy Environment favour Capital & Technology Intensive Growth
S Asia
E Asia
SE Asia
L Am
erica
SS Afr
ica
World
0
5000
10000
15000
20000
25000
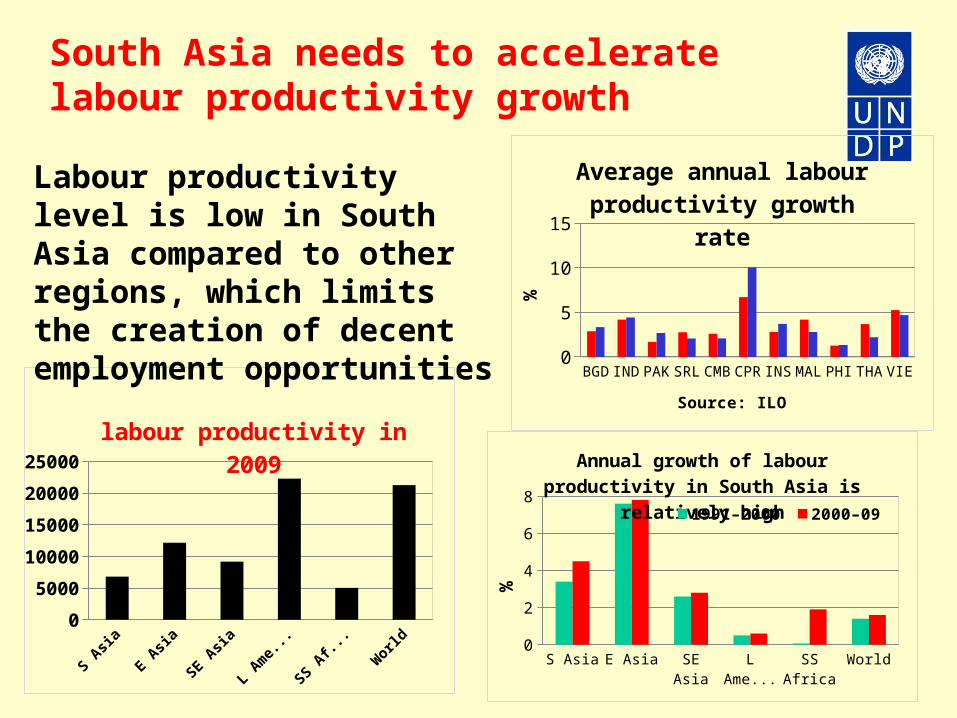
labour productivity in 2009
S Asia
E Asia
SE Asia
L Am
e...
SS Af..
.
World
0
2
4
6
8
Annual growth of labour productivity in South Asia is relatively high
1991–2000 2000–09%
BGDIN
DPAK
SRLCM
BCPR
INS
MAL
PHITHA
VIE02468
1012
Average annual labour produc-tivity growth rate
1991-00 2000-08
Source: ILO
%
South Asia needs to accelerate labour productivity growth
Labour productivity level is low in South Asia compared to other regions, which limits the creation of decent employment opportunities
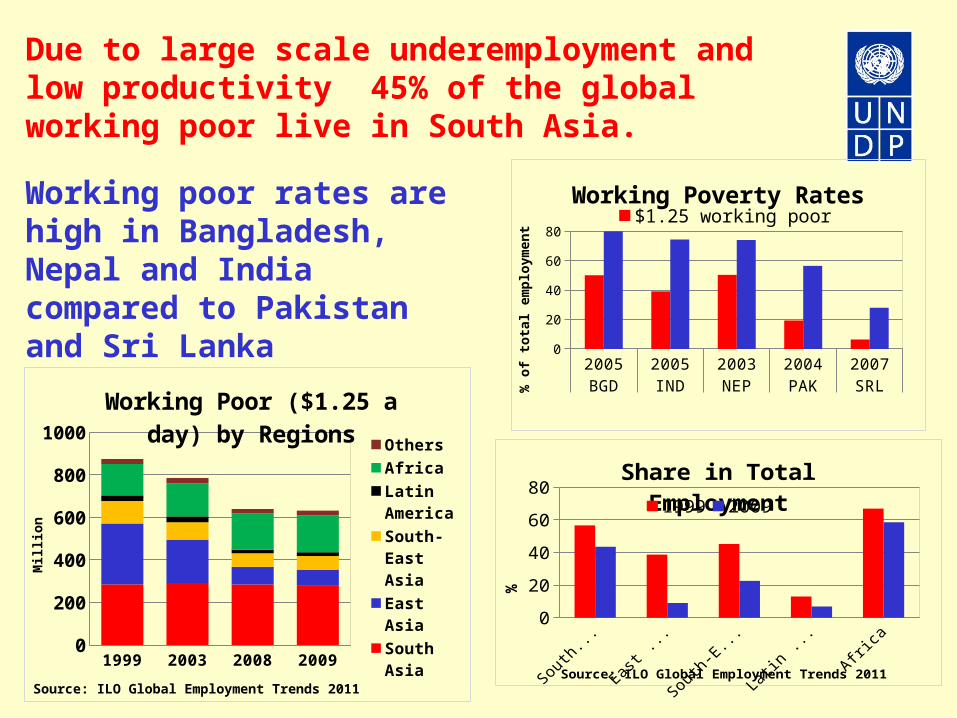
Working poor rates are high in Bangladesh, Nepal and India compared to Pakistan and Sri Lanka
Due to large scale underemployment and low productivity 45% of the global working poor live in South Asia.
1999 2003 2008 20090
200
400
600
800
1000
Working Poor ($1.25 a day) by Regions
Others
Africa
Latin Amer-ica
South-East Asia
East Asia
South Asia
Source: ILO Global Employment Trends 2011
Mil
lion
South
Asia
East A
sia
South-
East...
Latin A
me...
Africa
0
20
40
60
80Share in Total Employment
1999 2009
Source: ILO Global Employment Trends 2011
%
2005 2005 2003 2004 2007BGD IND NEP PAK SRL
0
20
40
60
80
Working Poverty Rates$1.25 working poor $2.00 working poor
% o
f tot
al e
mpl
oym
ent
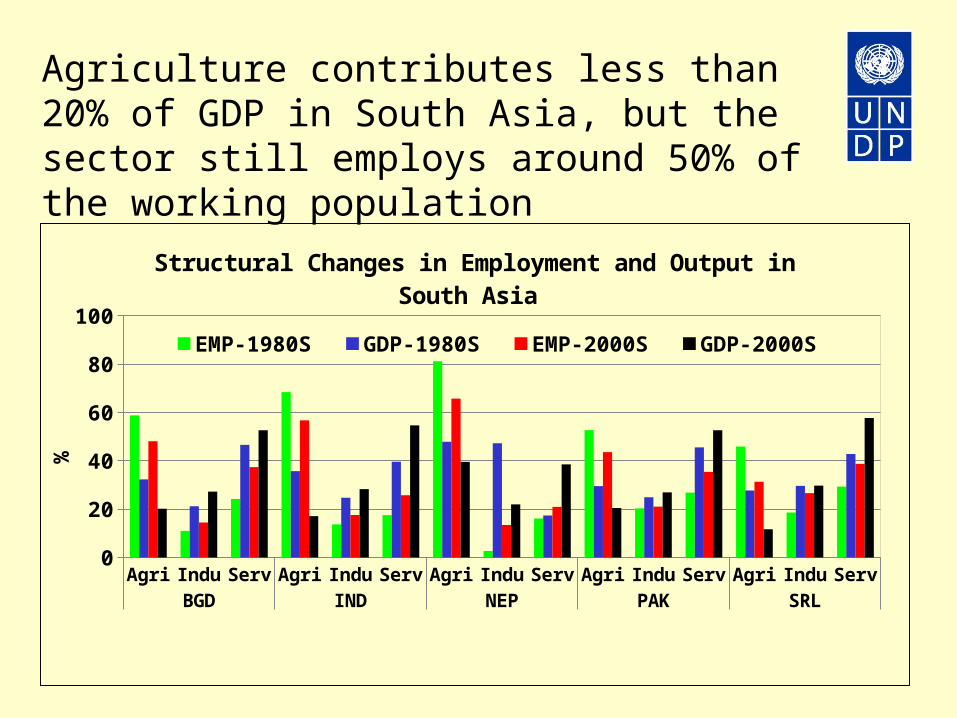
Agri Indu Serv Agri Indu Serv Agri Indu Serv Agri Indu Serv Agri Indu ServBGD IND NEP PAK SRL
0
20
40
60
80
100
Structural Changes in Employment and Output in South Asia
EMP-1980S GDP-1980S EMP-2000S GDP-2000S
%Agriculture contributes less than 20% of GDP in South Asia, but the sector still employs around 50% of the working population
High food and fuel prices reduce purchasing power of the poor more severely than the rich
Message 4:
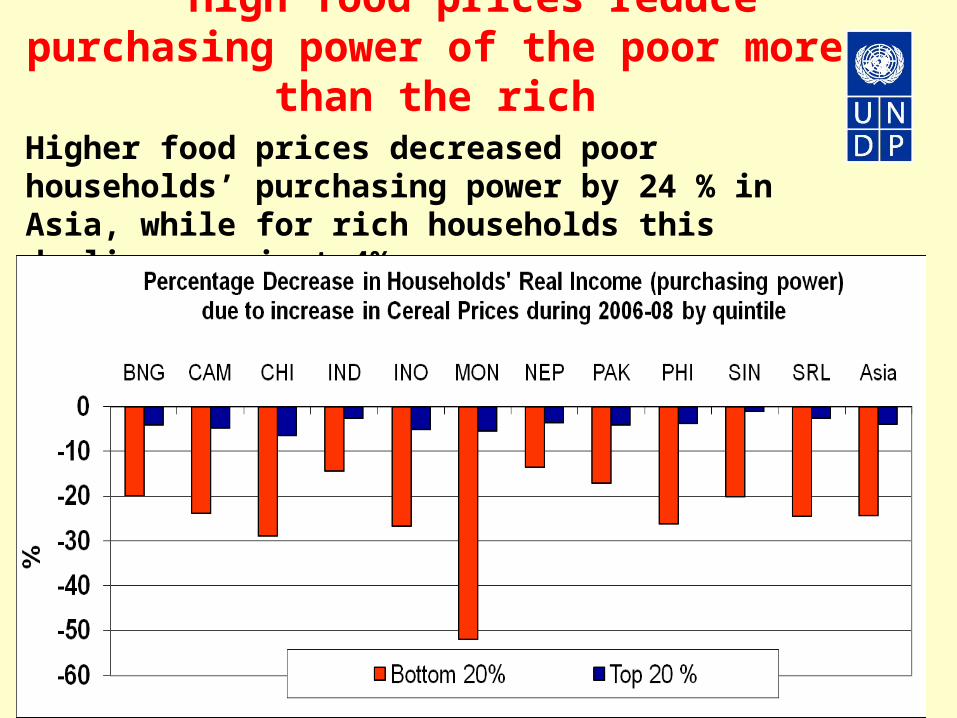
High food prices reduce purchasing power of the poor more than the rich
Higher food prices decreased poor households’ purchasing power by 24 % in Asia, while for rich households this decline was just 4%.
Given the diverse impacts of growth on poverty, it is clear that growth alone won’t reduce poverty. Growth and pro-poor social policies will accelerate poverty reduction
Message 5:
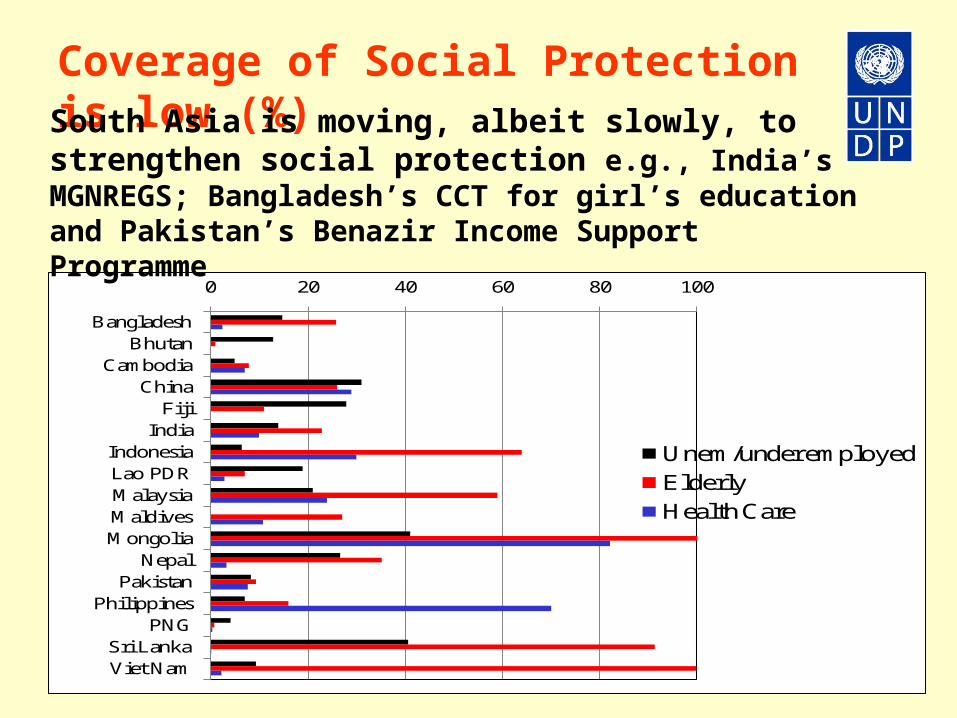
Coverage of Social Protection is low (%)
0 20 40 60 80 100
BangladeshBhutan
CambodiaChina
FijiIndia
IndonesiaLao PDRMalaysiaMaldivesMongolia
NepalPakistan
PhilippinesPNG
Sri LankaViet Nam
Unem/under employedElderlyHealth Care
South Asia is moving, albeit slowly, to strengthen social protection e.g., India’s MGNREGS; Bangladesh’s CCT for girl’s education and Pakistan’s Benazir Income Support Programme
• Poverty & hunger are still high, share of elderly is increasing rapidly, disintegration of family & community networks, increased frequency of economic shocks/natural calamities or health crises /pandemics
• Poor have high vulnerability to risks and lack access to instruments to mitigate and cope with them
• Current social assistance programmes are fragmented and not well targeted
Why does South Asia Need Stronger Social Protection?
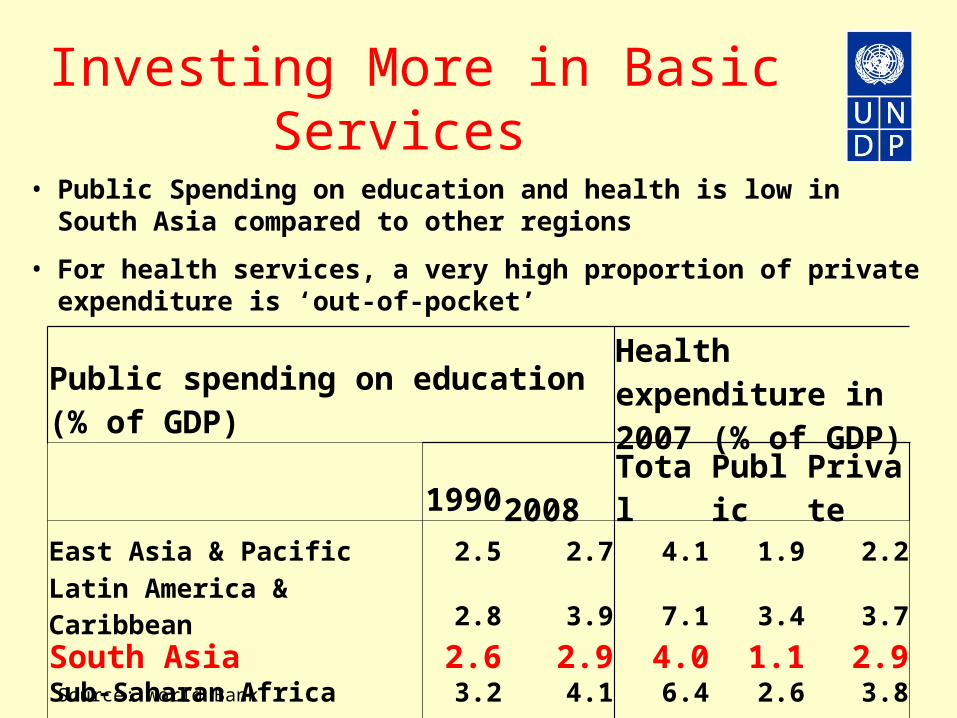
Investing More in Basic Services
• Public Spending on education and health is low in South Asia compared to other regions
• For health services, a very high proportion of private expenditure is ‘out-of-pocket’
Source: World Bank
Public spending on education (% of GDP)Health expenditure in 2007 (% of GDP)
1990 2008 Total Public Private
East Asia & Pacific 2.5 2.7 4.1 1.9 2.2
Latin America & Caribbean 2.8 3.9 7.1 3.4 3.7South Asia 2.6 2.9 4.0 1.1 2.9Sub-Saharan Africa 3.2 4.1 6.4 2.6 3.8World 3.8 4.6 9.7 5.8 3.9
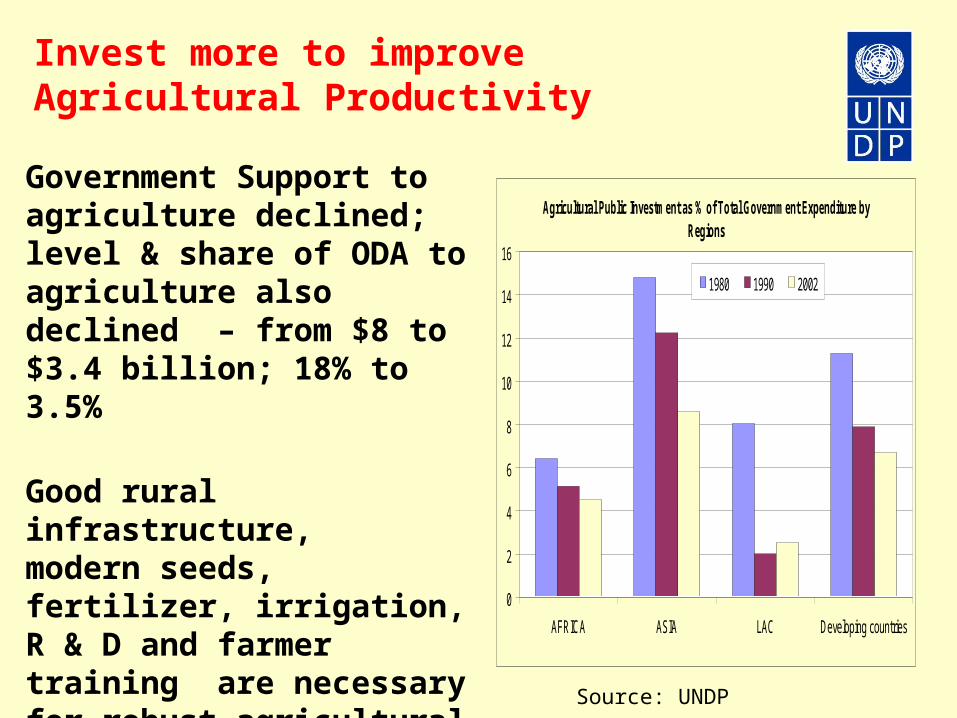
Government Support to agriculture declined; level & share of ODA to agriculture also declined – from $8 to $3.4 billion; 18% to 3.5%
Good rural infrastructure, modern seeds, fertilizer, irrigation, R & D and farmer training are necessary for robust agricultural productivity & growth
Source: UNDP
Agricultural Public Investment as % of Total Government Expenditure by Regions
0
2
4
6
8
10
12
14
16
AFRICA ASIA LAC Developing countries
1980 1990 2002
Invest more to improve Agricultural Productivity
Conclusions
• High economic growth alone does not ensure rapid poverty reduction.
• Sound economic and social policies help achieve inclusive growth
– Develop human and physical assets of poor people
– Foster a inclusive financial system
– Promote growth in key sectors (agriculture and rural development)
– Provide an effective safety net and strengthen social protection