Embed Size (px)
Citation preview
1
Oyster Creek License RenewalPresentation to
ACRS Subcommittee
January 18, 2007
APPLICANT'S EXHIBIT 40
2
AmerGen Representatives
• Fred Polaski• John O’Rourke• Howie Ray• Pete Tamburro
• Dr. Hardayal Mehta• Barry Gordon• Jon Cavallo• Ahmed Ouaou
3
Agenda
• Drywell Shell Corrosion– Physical Overview– Cause and Corrective Actions– Drywell Shell Thickness Analysis– Sand Bed Region– Embedded Portions of the Drywell Shell– Upper Shell
4
Drywell Shell Corrosion Cause and Corrective Actions
5
6
7
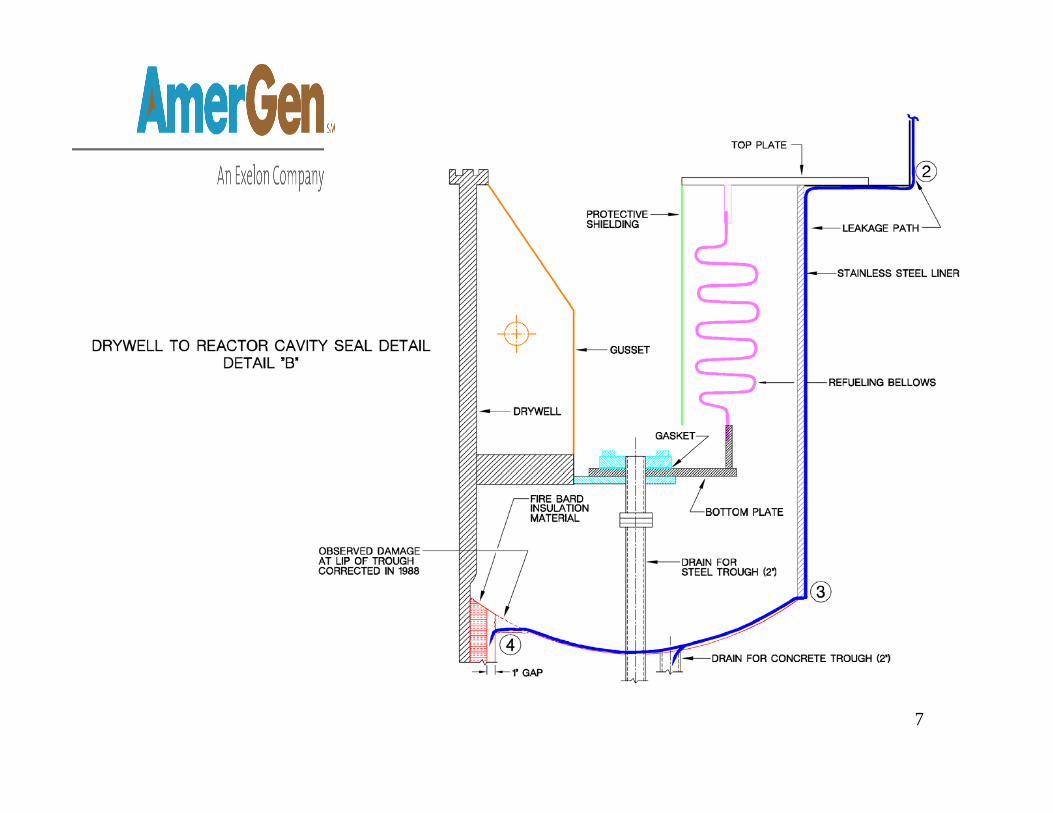
LIP REPAIRED IN 1988 OUTAGE
8
9

10
11
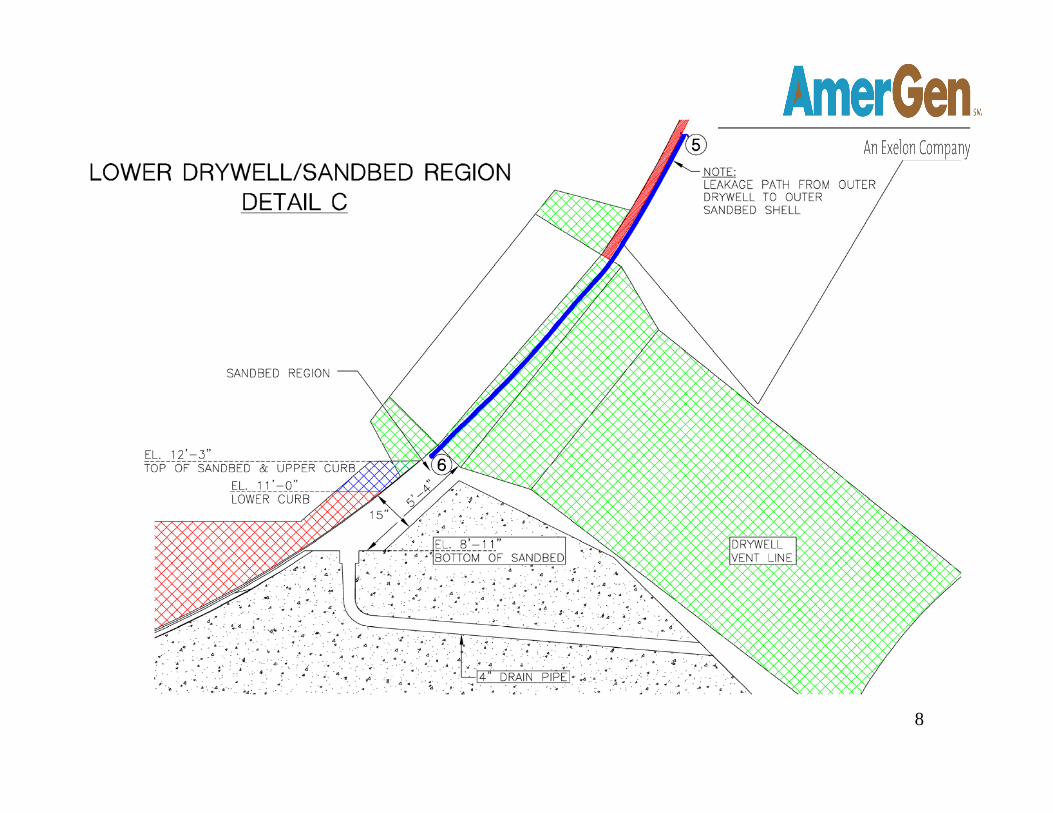
Cause and Corrective Actions
• Water accumulation in the sand bed region resulted in corrosion of the exterior surface of the drywell shell
• Corrective actions were completed in 1992– Prevented water intrusion into the sand bed region– Eliminated corrosive environment by removing the
sand – Coated the drywell shell with epoxy in the sand
bed region
12
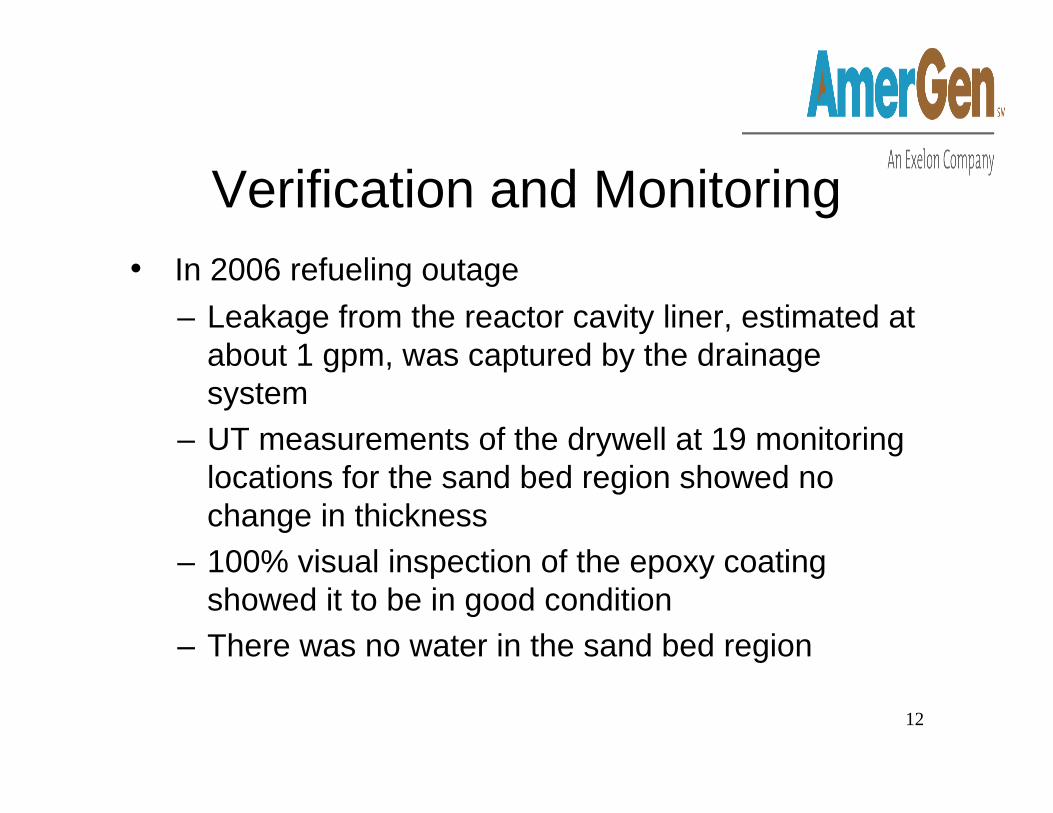
Verification and Monitoring• In 2006 refueling outage
– Leakage from the reactor cavity liner, estimated at about 1 gpm, was captured by the drainage system
– UT measurements of the drywell at 19 monitoring locations for the sand bed region showed no change in thickness
– 100% visual inspection of the epoxy coating showed it to be in good condition
– There was no water in the sand bed region
13
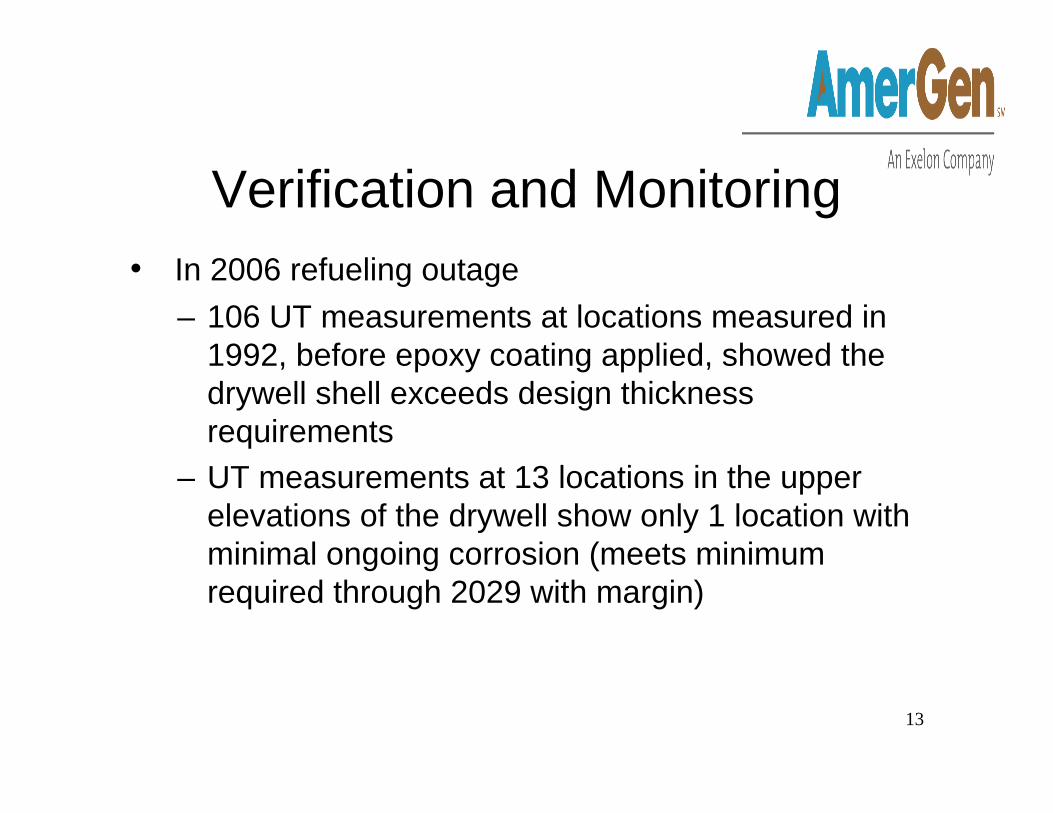
Verification and Monitoring• In 2006 refueling outage
– 106 UT measurements at locations measured in 1992, before epoxy coating applied, showed the drywell shell exceeds design thickness requirements
– UT measurements at 13 locations in the upper elevations of the drywell show only 1 location with minimal ongoing corrosion (meets minimum required through 2029 with margin)
14
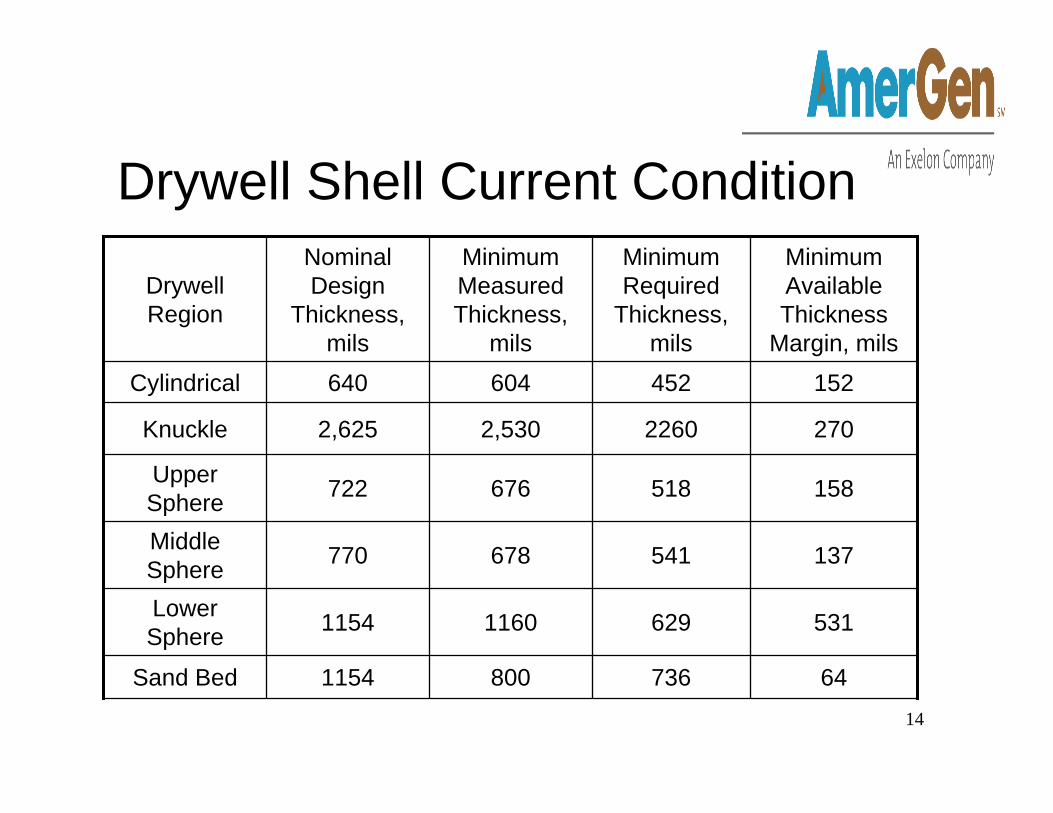
Drywell Shell Current Condition
647368001154Sand Bed
53162911601154Lower Sphere
137541678770Middle Sphere
158518676722Upper Sphere
27022602,5302,625Knuckle
152452604640Cylindrical
Minimum Available Thickness
Margin, mils
Minimum Required
Thickness, mils
Minimum Measured Thickness,
mils
Nominal Design
Thickness, mils
Drywell Region
15
Drywell Thickness Analysis
Hardayal S. Mehta, Ph.D., P.E. General Electric
16
Drywell Analysis• Analysis completed in early 1990s
– Without sand in the sand bed• Modeling of the drywell
– Loads and Load Combinations• Buckling analysis
– Controls the required drywell shell thickness in the sand bed region
– Uniform drywell shell thickness of 736 mils over the entire sand bed region was used in the analysis
• ASME Section VIII stress analysis based on 62 psi• Drywell pressure design basis change from 62 psi to
44 psi– Stress analysis of the drywell shell based on 44 psi
17
Modeling of the Drywell
18
Drywell Configuration• Oyster Creek Drywell Geometry
– It is 105’-6” high– Drywell head is 33’ in diameter– Spherical section has an inside diameter of 70’– Ten vent pipes, 6’-6” in diameter, are equally spaced around
the circumference to connect the drywell to the vent header inside the pressure suppression chamber
– Drywell interior filled with concrete to elevation 10’-3” to provide a level floor
– Base of the drywell is supported on a concrete pedestal conforming to the curvature of the vessel
– Shell thicknesses vary• Drywell shell, i.e., the sphere, cylinder, dome and transitions,
was constructed from SA-212, Grade B Steel ordered to SA-300 spec.
19
Finite Element Models Used• Axisymmetric, Beam and Pie Slice models used• Axisymmetric drywell model used to evaluate
– Unflooded and flooded seismic inertia loading– Thermal loading during postulated accident condition
• Beam drywell model used to evaluate stresses due to seismic relative support displacement
• Pie slice drywell model used for the Code and buckling evaluations– Vent lines included in the model
• No sand stiffness considered in any of the models
20
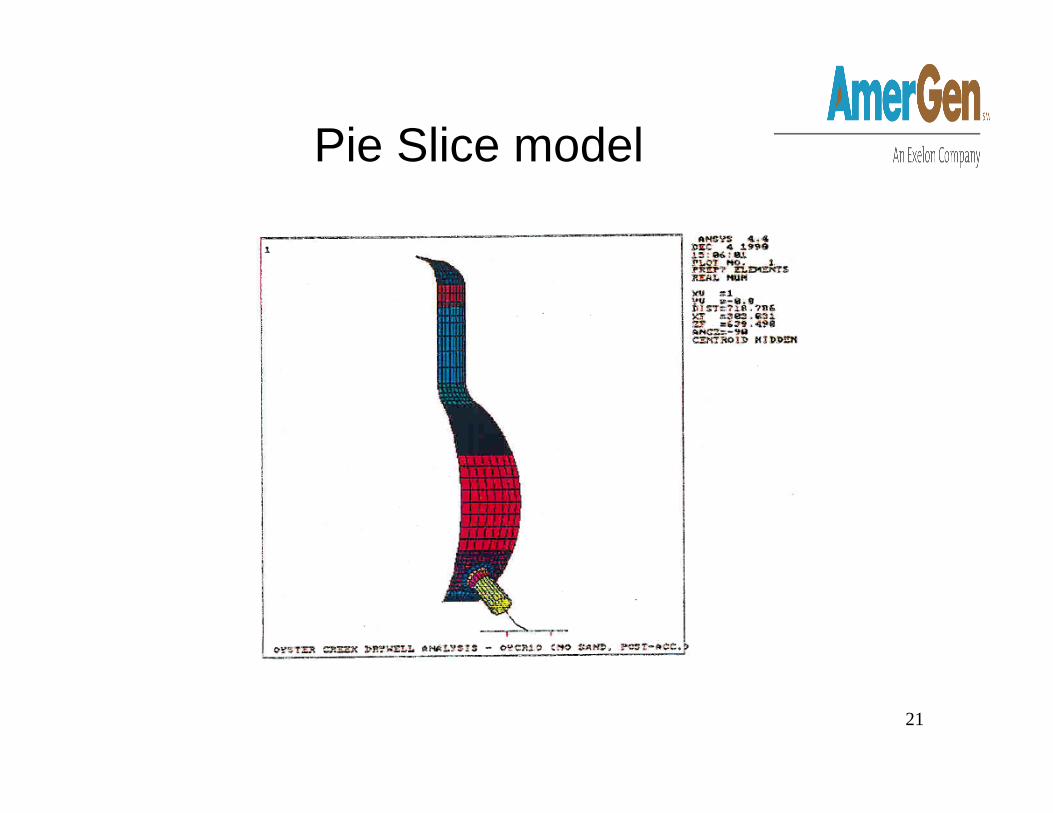
Pie Slice Model and Load Application
• Taking advantage of symmetry of the drywell with 10 vent lines, a 36 degree section was modeled – The model included the drywell shell from base of the sand
bed region to the top of the elliptical head and the vent and vent header
– Drywell shell thickness in the sand bed region: 736 mils uniform
21
Pie Slice model
22
Applied Loads
• Gravity loading consists of dead weight loads, penetration loads, live loads
• Design pressure of 62 psi pressure (at 175oF)– Note 62 psi criterion was later changed to 44 psi per Tech.
Spec. Amendment #165 (SER dated September 13, 1993)
• Seismic Loads – Inertia loads– Relative support displacement (Drywell and Reactor
Building)
23
Seismic Load Definition• Axisymmetric finite element model used to determine
inertia loading– Drywell is constrained at the “reactor building/drywell/ star
truss” interface at elevation 82’-6” and at its base
• Spectra at two locations: At the mat foundation and at the upper constraint
• Envelope spectrum used in ANSYS analysis
24
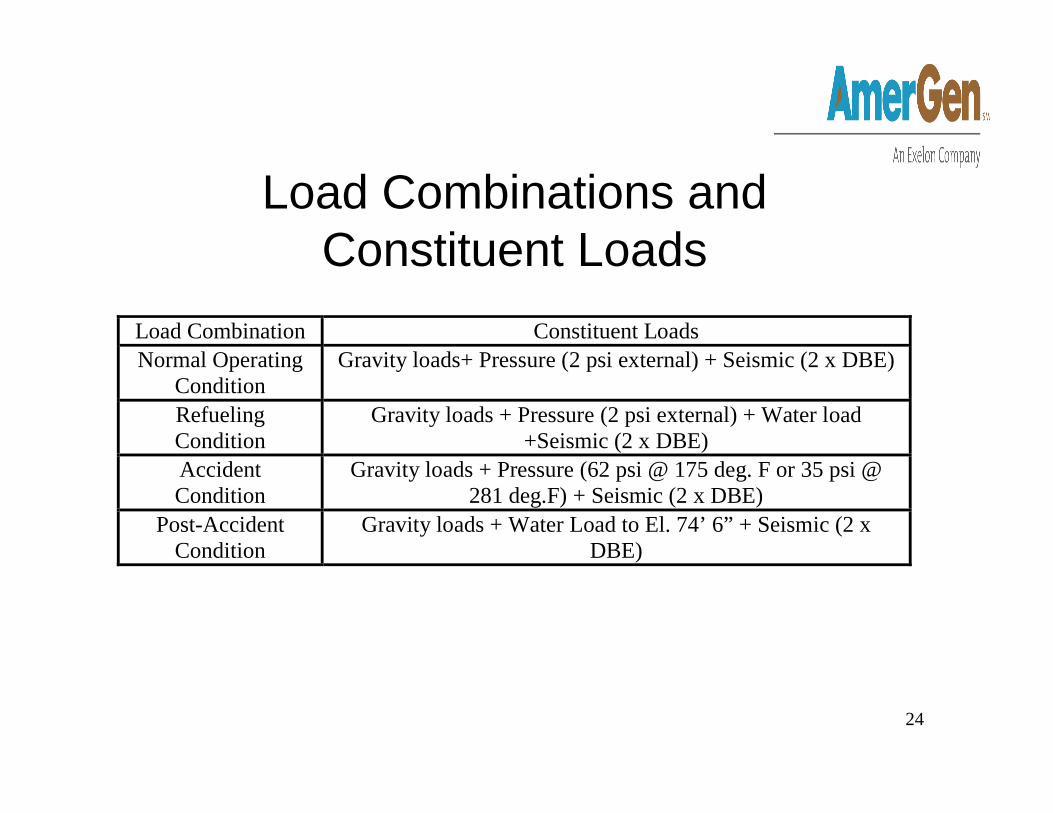
Load Combinations and Constituent Loads
Load Combination Constituent Loads Normal Operating
Condition Gravity loads+ Pressure (2 psi external) + Seismic (2 x DBE)
Refueling Condition
Gravity loads + Pressure (2 psi external) + Water load +Seismic (2 x DBE)
Accident Condition
Gravity loads + Pressure (62 psi @ 175 deg. F or 35 psi @ 281 deg.F) + Seismic (2 x DBE)
Post-Accident Condition
Gravity loads + Water Load to El. 74’ 6” + Seismic (2 x DBE)

25
Buckling Analysis
26
Buckling Analysis Conclusion
• The buckling analysis was conducted using a uniform drywell shell thickness in the sand bed region of 736 mils.
• Stress limits and safety factors are in accordance with the Coderequirements.
• The analysis shows that the drywell shell meets ASME Code Case N-284 requirements considering all design basis loads and load combinations.
• A locally thinned 12”x 12” area down to 536 mils was evaluated and determined not to have significant impact on buckling.
• The drywell shell thickness will be monitored using 736 mils as acceptance criteria for the minimum required general thickness and 536 mils as the minimum required local thickness.
27
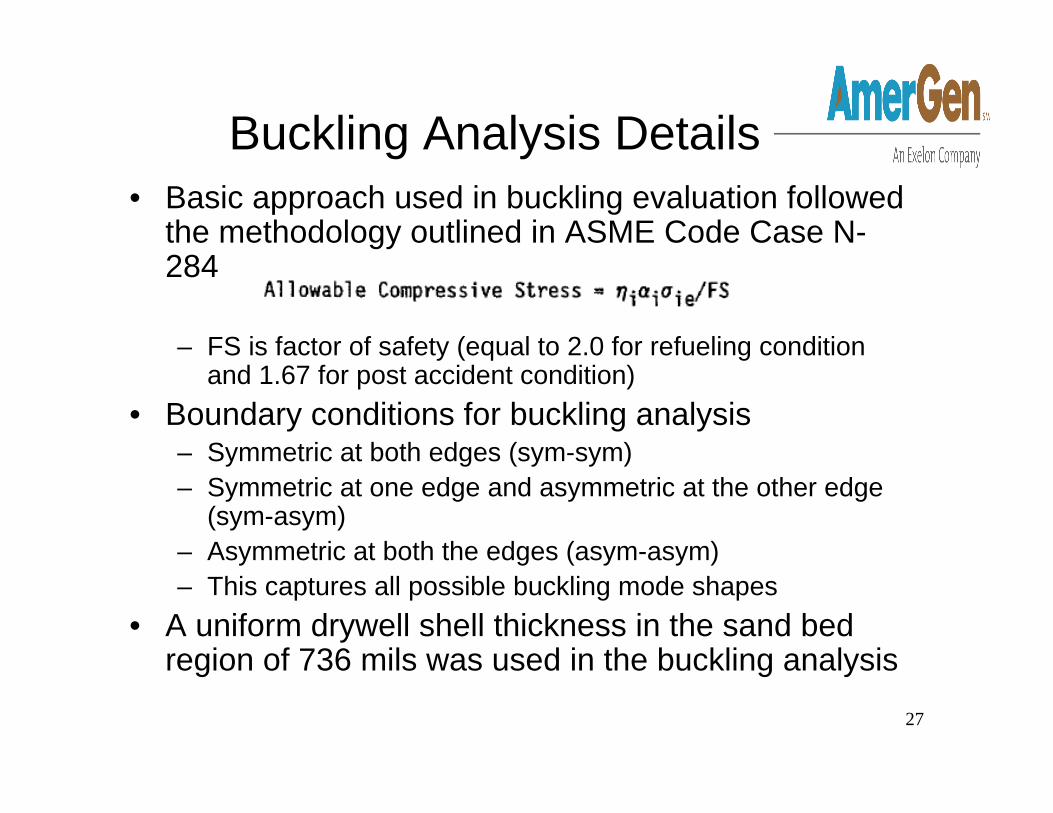
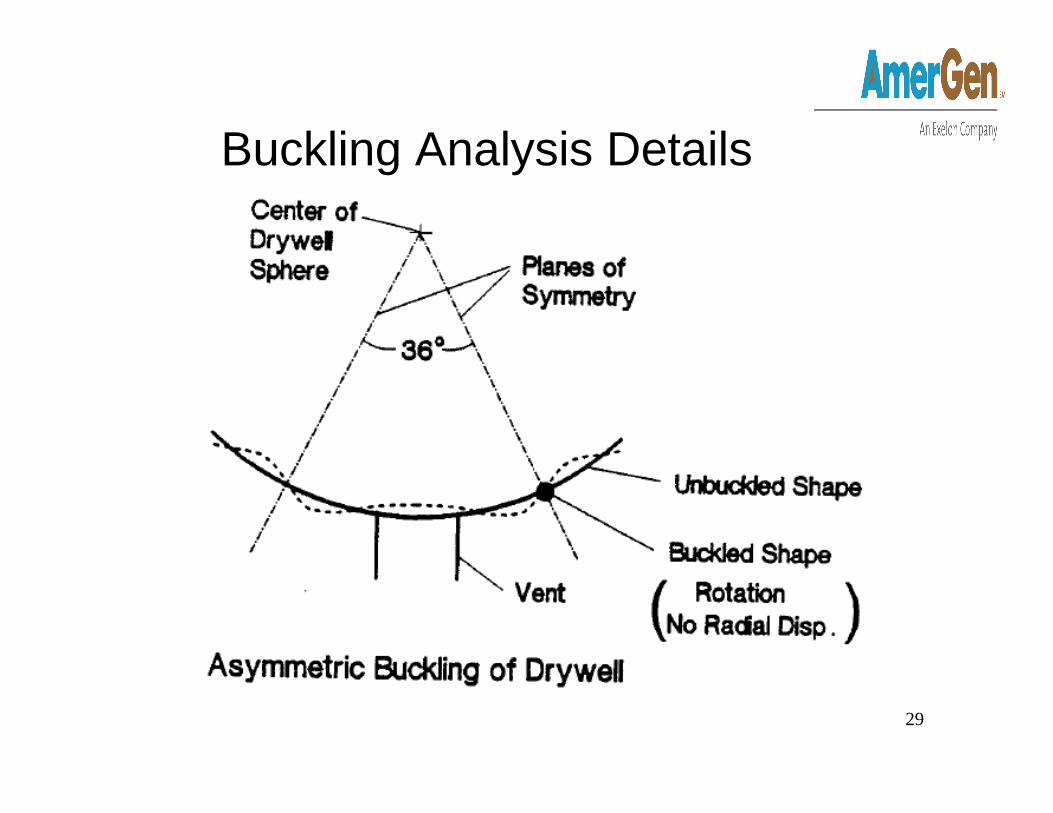
Buckling Analysis Details• Basic approach used in buckling evaluation followed
the methodology outlined in ASME Code Case N-284
– FS is factor of safety (equal to 2.0 for refueling condition and 1.67 for post accident condition)
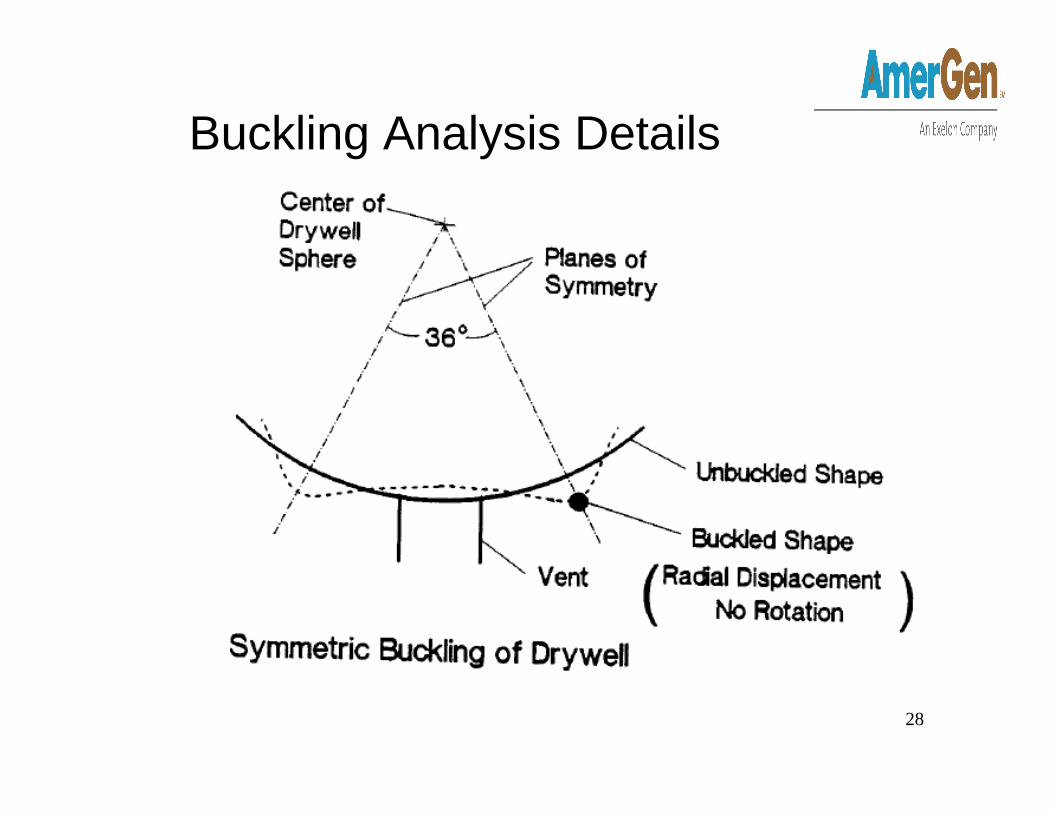
• Boundary conditions for buckling analysis– Symmetric at both edges (sym-sym)– Symmetric at one edge and asymmetric at the other edge
(sym-asym)– Asymmetric at both the edges (asym-asym)– This captures all possible buckling mode shapes
• A uniform drywell shell thickness in the sand bed region of 736 mils was used in the buckling analysis
28
Buckling Analysis Details
29
Buckling Analysis Details
30
Buckling Analysis Details
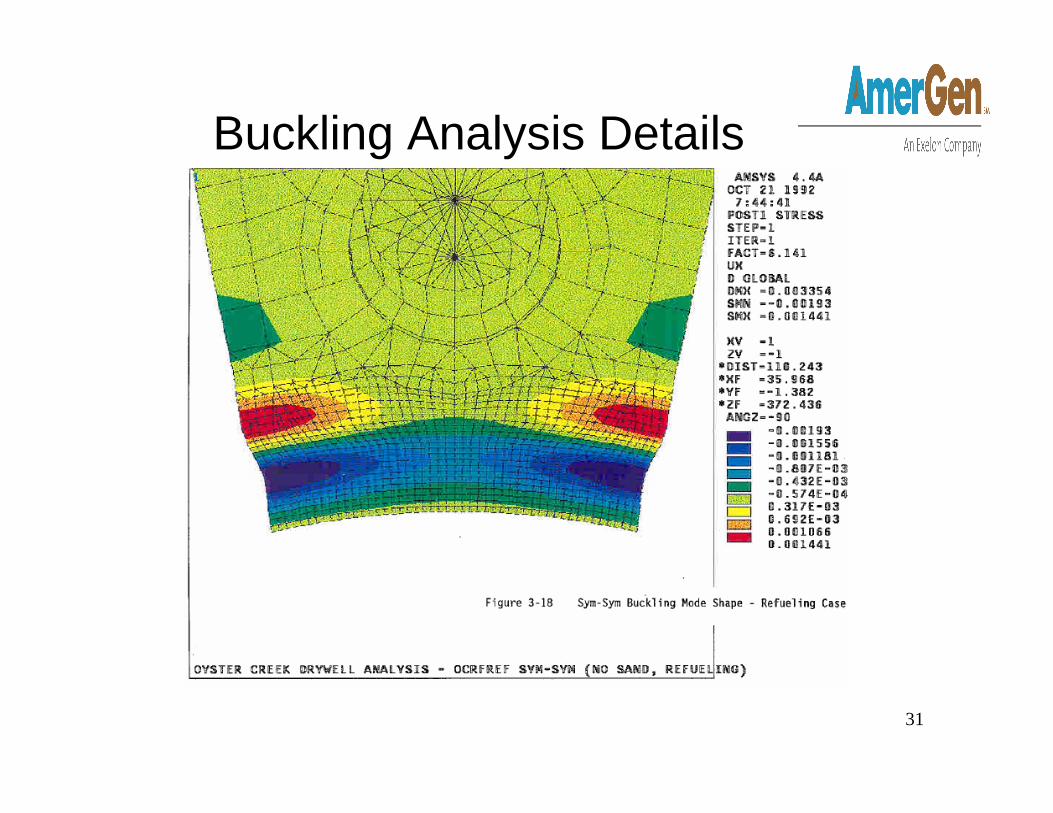
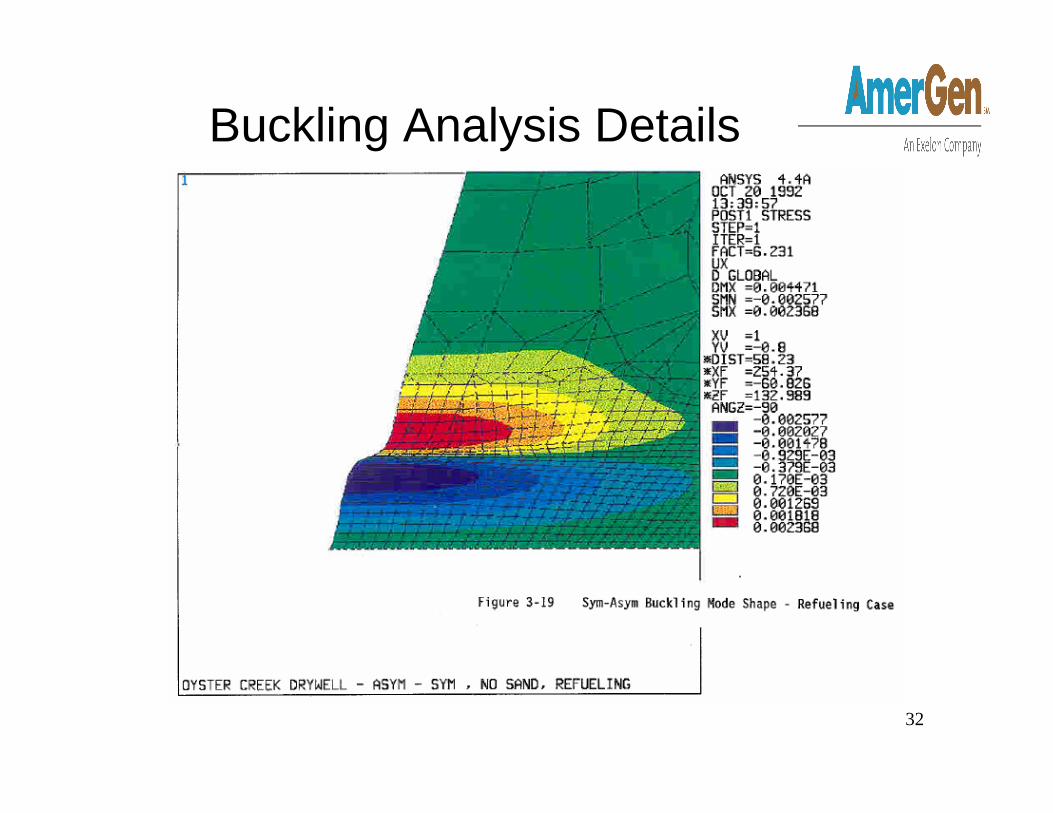
• Limiting load combination is the refueling condition • Loads during refueling condition are
– Gravity loads including weight of refueling water– External pressure of 2 psig– Seismic inertia and deflection loads for unflooded condition
31
Buckling Analysis Details
32
Buckling Analysis Details
33
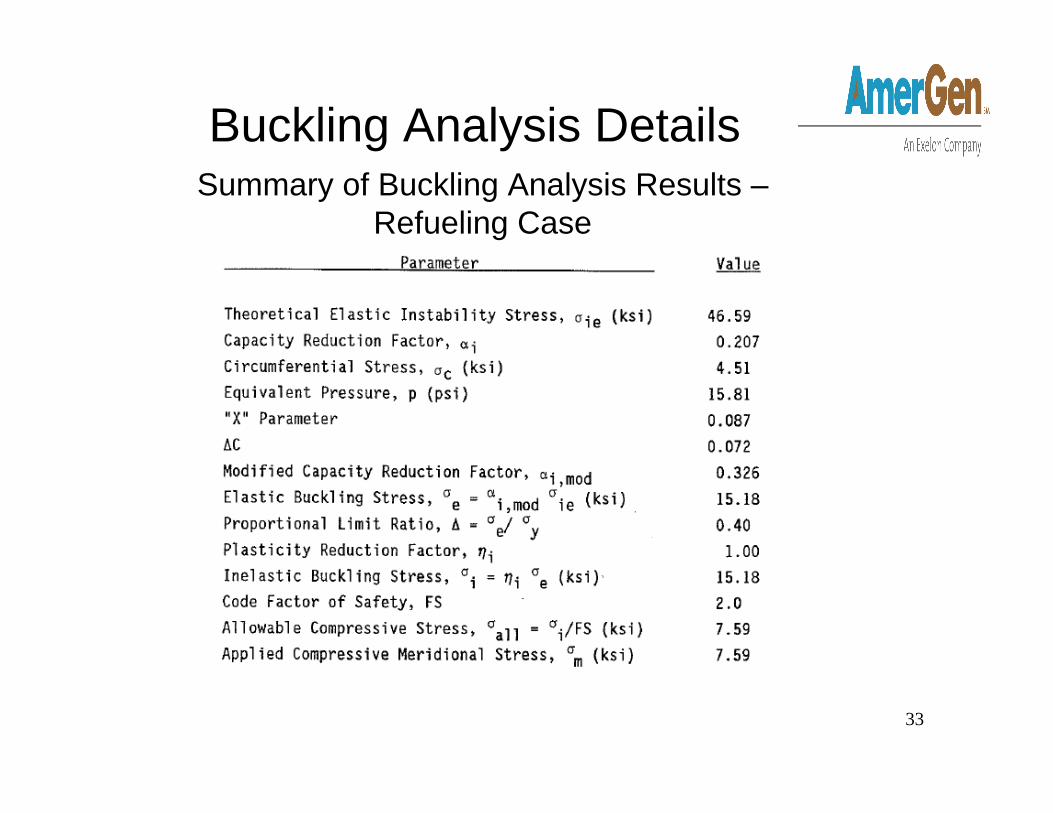
Buckling Analysis DetailsSummary of Buckling Analysis Results –
Refueling Case
34
Evaluation of Local Thinning on Buckling Analysis - Sensitivity Study
• A locally 12”x12” thin area was modeled in the sand bed region drywell shell in the highest stress area, to determine the impact of local thinning on buckling stress– Establish minimum required local thickness down to 536
mils
Note: UT thickness measurements taken through 2006 show that locally thinned areas of the drywell shell are not coincident with high stress areas. The locally thinned areas are typically scattered below and near the vent headers. These areas are not highly stressed because of the additional stiffness providedby the vent header.
35
Buckling Analysis Conclusion
• The buckling analysis was conducted using a uniform drywell shell thickness in the sand bed region of 736 mils.
• Stress limits and safety factors are in accordance with the Coderequirements.
• The analysis shows that the drywell shell meets ASME Code Case N-284 requirements considering all design basis loads and load combinations.
• A locally thinned 12”x 12” area down to 536 mils was evaluated and determined not to have significant impact on buckling.
• The drywell shell thickness will be monitored using 736 mils as acceptance criteria for the minimum required general thickness and 536 mils as the minimum required local thickness.
36
ASME Section VIII Stress Analysis
37
ASME Section VIII Stress Analysis Conclusion
• Stress analysis of the drywell shell was conducted in accordance with ASME Code and SRP 3.8.2 using reduced thicknesses due to corrosion.
• Stress limits and safety factors are in accordance with the ASME Code requirements.
• The analysis shows that the drywell shell meets ASME Code Stressrequirements considering all design basis loads and load combinations.
• To regain margin, a plant specific analysis was conducted that reduced drywell design basis pressure from 62 psi to 44 psi (Tech Spec Amendment #165)
• The reduction in pressure resulted in a stress reduction of up to 5200 psi
• The minimum required general and local drywell shell thicknesses were calculated in accordance with ASME Code based on 44 psi pressure.
• The drywell shell thickness will be monitored for corrosion using the calculated minimum required general and local thicknesses as acceptance criteria.
38
Codes and Standards• The Oyster Creek drywell vessel was designed,
fabricated and erected in accordance with the 1962 Edition of ASME Code, Section VIII and Code Cases 1270N-5, 1271N and 1272N-5
• Original Code of record and Code Cases do not provide specific guidance in two areas
• For the size of the region of increased membrane stress, guidance sought from Subsection NE of Section III
• For the Post-accident stress limits Standard Review Plan Section 3.8.2 was used as guidance
39
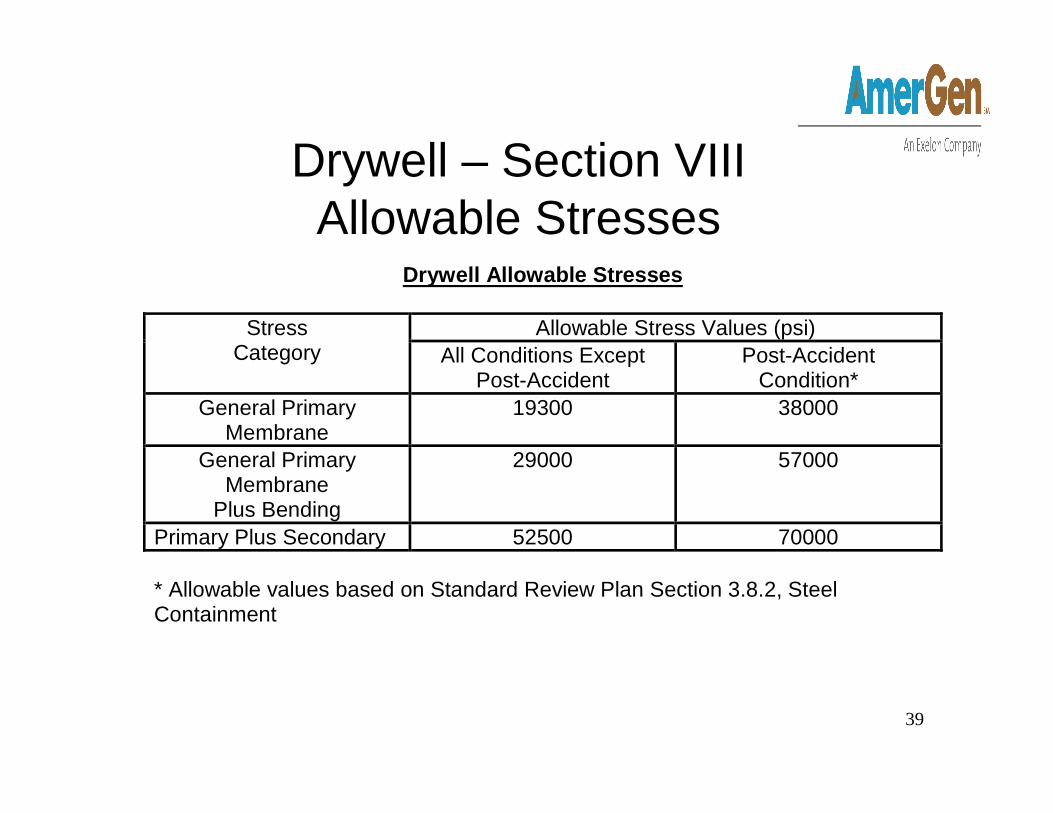
Drywell – Section VIII Allowable Stresses
Drywell Allowable Stresses
Allowable Stress Values (psi) Stress Category All Conditions Except
Post-Accident Post-Accident
Condition* General Primary
Membrane 19300 38000
General Primary Membrane
Plus Bending
29000 57000
Primary Plus Secondary 52500 70000
* Allowable values based on Standard Review Plan Section 3.8.2, Steel Containment
40
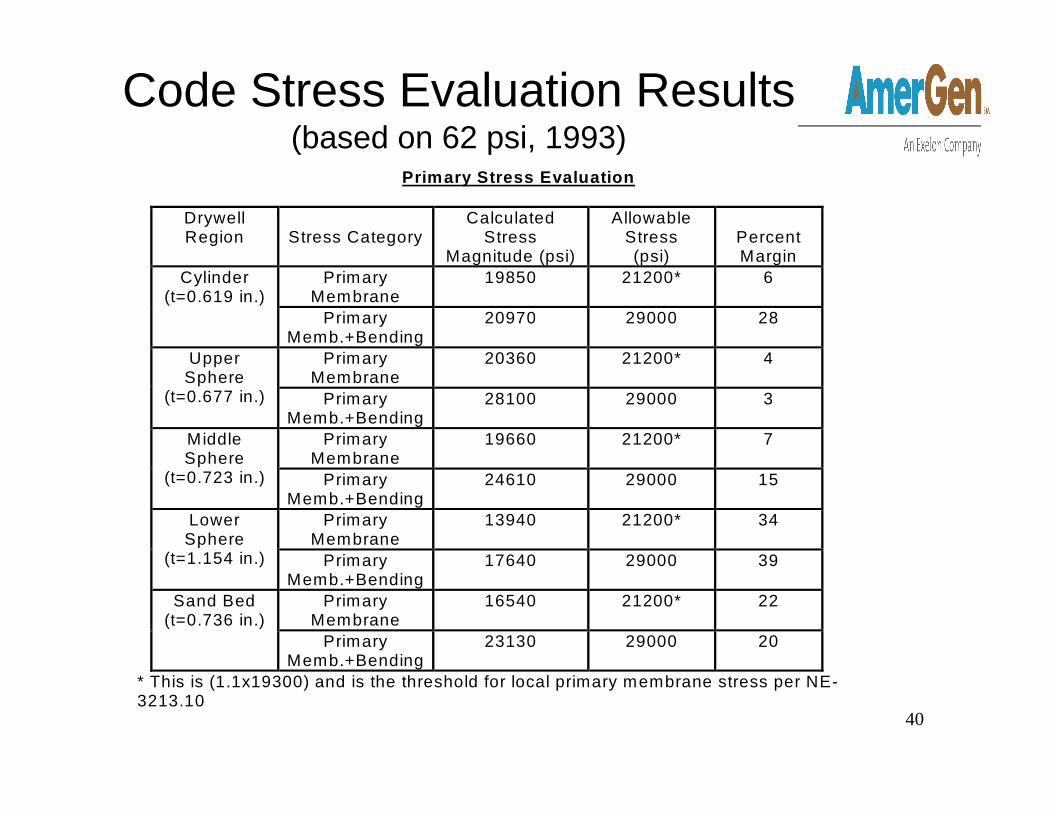
Code Stress Evaluation Results(based on 62 psi, 1993)
Primary Stress Evaluation
Drywell Region
Stress Category
Calculated Stress
Magnitude (psi)
Allowable Stress (psi)
Percent Margin
Primary Membrane
19850 21200* 6 Cylinder (t=0.619 in.)
Primary Memb.+Bending
20970 29000 28
Primary Membrane
20360 21200* 4 Upper Sphere
(t=0.677 in.) Primary Memb.+Bending
28100 29000 3
Primary Membrane
19660 21200* 7 Middle Sphere
(t=0.723 in.) Primary Memb.+Bending
24610 29000 15
Primary Membrane
13940 21200* 34 Lower Sphere
(t=1.154 in.) Primary Memb.+Bending
17640 29000 39
Primary Membrane
16540 21200* 22 Sand Bed (t=0.736 in.)
Primary Memb.+Bending
23130 29000 20
* This is (1.1x19300) and is the threshold for local primary membrane stress per NE-3213.10
41
Regain Margin through Licensing Basis Change
• The drywell pressure of 62 psi was very conservative• Analysis was conducted in early 1990’s to establish
Oyster Creek specific drywell design pressure.– Design pressure changed from 62 psi to 44 psi.
• 44 psi is based on conservatively calculated peak drywell pressure of 38.1 psi plus an added 15% allowance.
– The change was approved by NRC per Technical Specification Amendment No. 165 (SER dated September 13, 1993).
– The reduction in pressure resulted in a pressure stress reduction of up to 5200 psi
• Recalculated the required drywell shell thicknesses based on 44 psi to regain thickness margin.
42
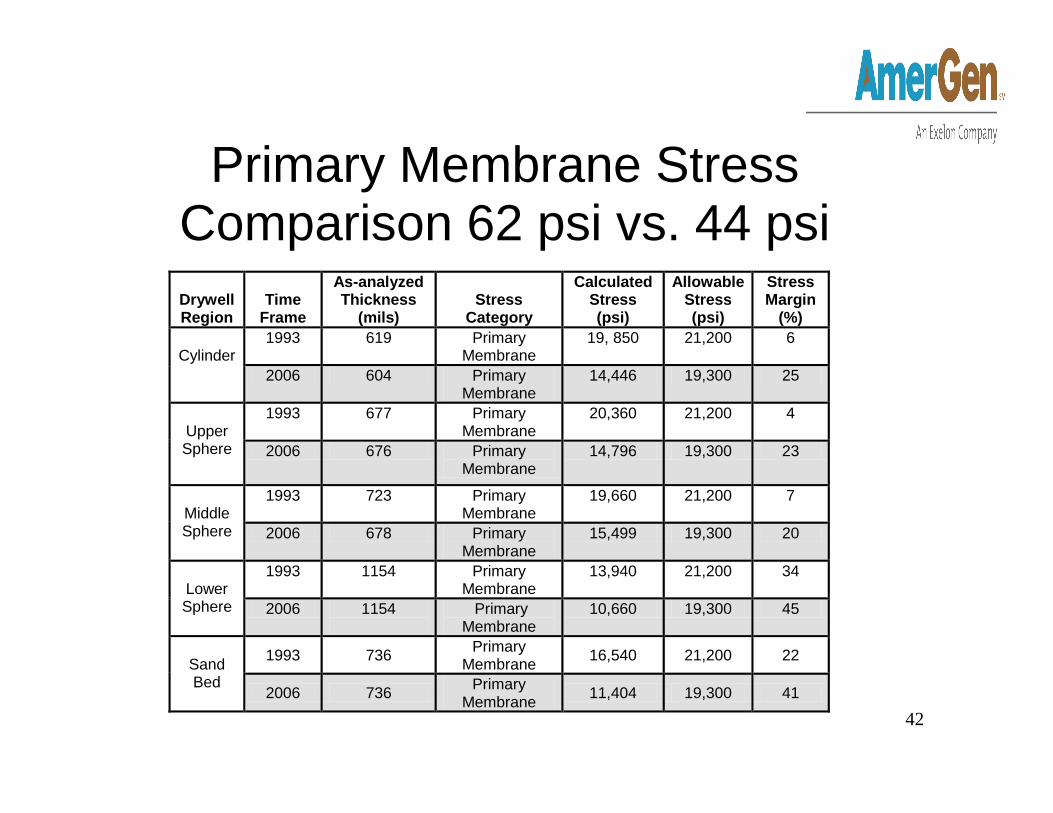
Primary Membrane Stress Comparison 62 psi vs. 44 psi
Drywell Region
Time
Frame
As-analyzed Thickness
(mils)
Stress
Category
Calculated Stress (psi)
Allowable Stress (psi)
Stress Margin
(%) 1993 619 Primary
Membrane 19, 850 21,200 6
Cylinder 2006 604 Primary
Membrane 14,446 19,300 25
1993 677 Primary Membrane
20,360 21,200 4 Upper Sphere 2006 676 Primary
Membrane 14,796 19,300 23
1993 723 Primary Membrane
19,660 21,200 7 Middle Sphere
2006 678 Primary
Membrane 15,499 19,300 20
1993 1154 Primary Membrane
13,940 21,200 34 Lower Sphere
2006 1154
Primary
Membrane 10,660 19,300 45
1993 736 Primary Membrane 16,540 21,200 22
Sand Bed
2006 736 Primary Membrane 11,404 19,300 41
43
Minimum Required Drywell Shell Thickness
• Minimum required general thickness for 44 psi– Calculated based on primary membrane stresses for 62 psi,
adjusted for pressure reduction (62 psi to 44 psi)• Minimum required local thickness for 44 psi
– Calculated based on ASME Section III provisions which allow increase in allowable local primary membrane stress from 1.0 Smc to 1.5 Smc
– Local thickness criteria is applicable to an area of 2.5” in diameter and less consistent with ASME Section III, Subsection NE-3332.1
– Extent of Locally thinned areas is evaluated per ASME Section III, Subsection NE-3213.10, NE-3332.2, and NE-3335.1
44
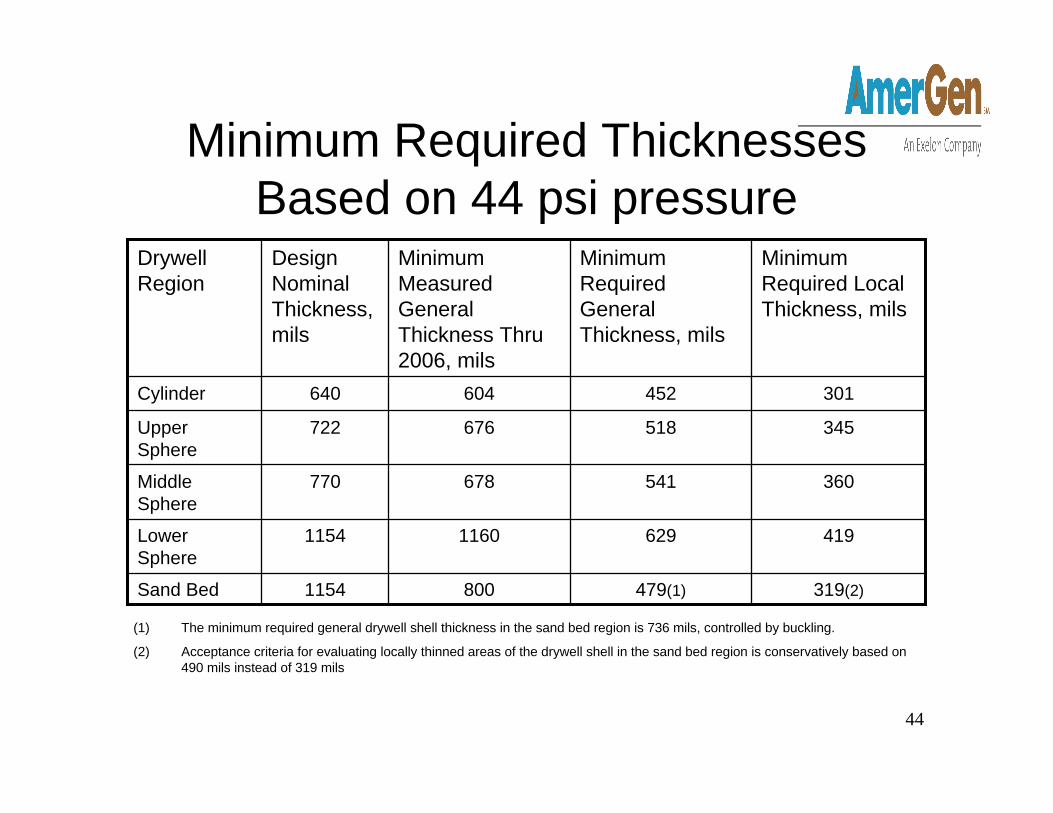
Minimum Required Thicknesses Based on 44 psi pressure
1154
1154
770
722
640
Design Nominal Thickness, mils
Sand Bed
Lower Sphere
Middle Sphere
Upper Sphere
Cylinder
Drywell Region
319(2)479(1)800
4196291160
360541678
345518676
301452604
Minimum Required Local Thickness, mils
Minimum Required General Thickness, mils
Minimum Measured General Thickness Thru 2006, mils
(1) The minimum required general drywell shell thickness in the sand bed region is 736 mils, controlled by buckling.
(2) Acceptance criteria for evaluating locally thinned areas of the drywell shell in the sand bed region is conservatively based on 490 mils instead of 319 mils
45
ASME Section VIIIStress Analysis Conclusion
• Stress analysis of the drywell shell was conducted in accordance with ASME Code and SRP 3.8.2 using reduced thicknesses due to corrosion.
• Stress limits and safety factors are in accordance with the ASME Code requirements.
• The analysis shows that the drywell shell meets ASME Code Stressrequirements considering all design basis loads and load combinations.
• To regain margin, a plant specific analysis was conducted that reduced drywell design basis pressure from 62 psi to 44 psi (Tech Spec Amendment #165)
• The reduction in pressure resulted in a stress reduction of up to 5200 psi
• The minimum required general and local drywell shell thicknesses were calculated in accordance with ASME Code based on 44 psi pressure.
• The drywell shell thickness will be monitored for corrosion using the calculated minimum required general and local thicknesses as acceptance criteria.

46
Sand Bed Region
47
Sand Bed Region Conclusions• Corrosion on the outside of the drywell
shell in the sand bed region has been arrested
• The coating shows no degradation• There is sufficient margin to the
minimum thickness requirement (64 mils margin above code required average thickness of 736 mils)
48
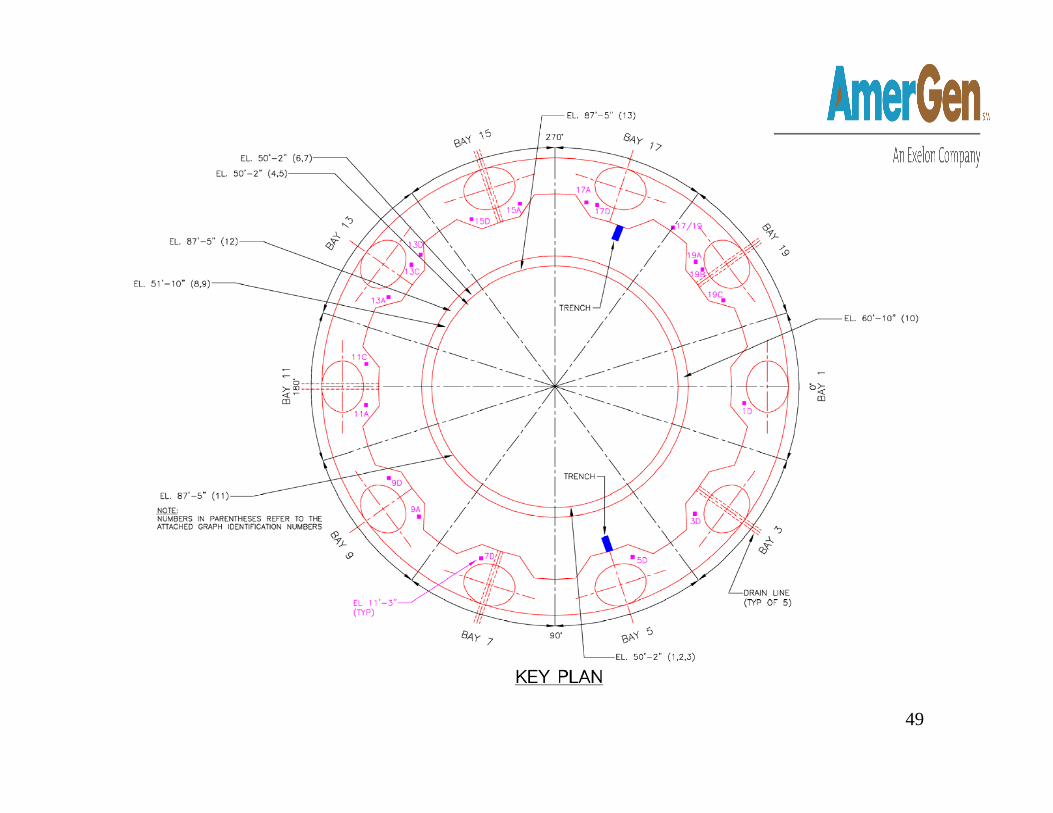
Background and HistorySand Bed Internal UTs
• 1983 to 1986 corrosion data 360° at elev. 11’3”– When thin locations were identified, UT
measurements were taken horizontally and vertically to locate the thinnest locations
– UT grid measurements were taken at the thinnest locations
– 19 locations were selected for corrosion monitoring based on over 500 initial data points measured
– At least one grid is located in each of the 10 bays
49
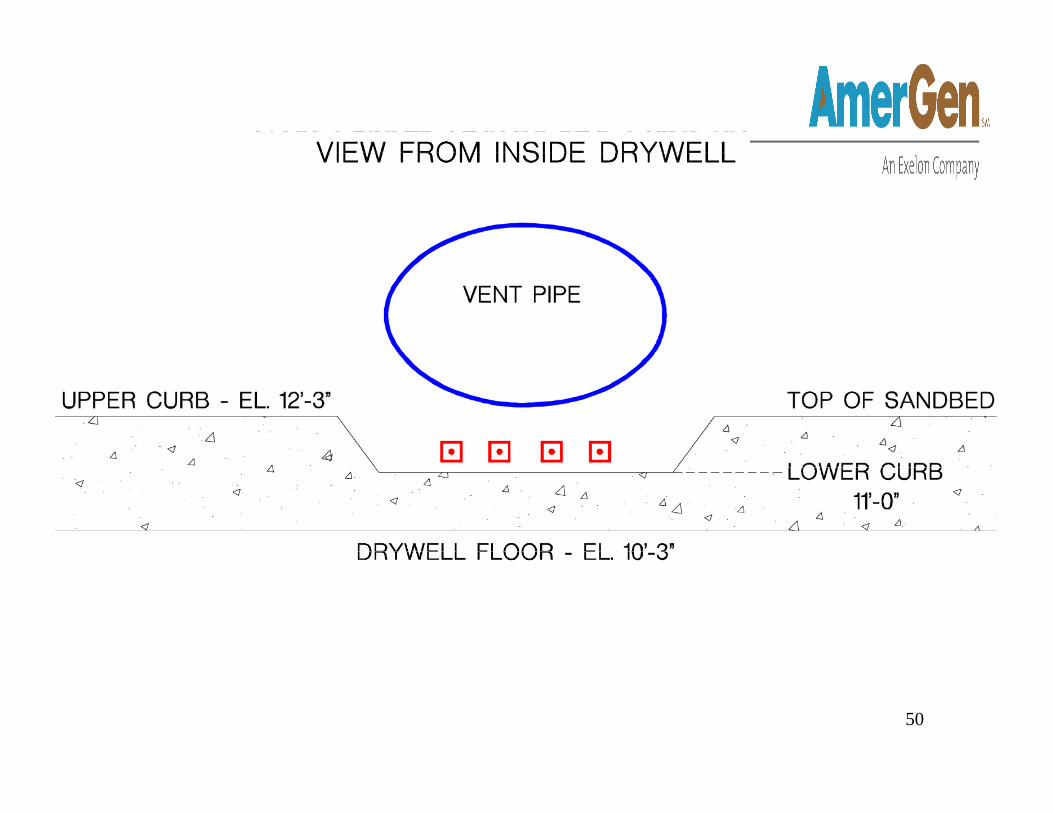
50
View from Inside the Drywell
51
52
53
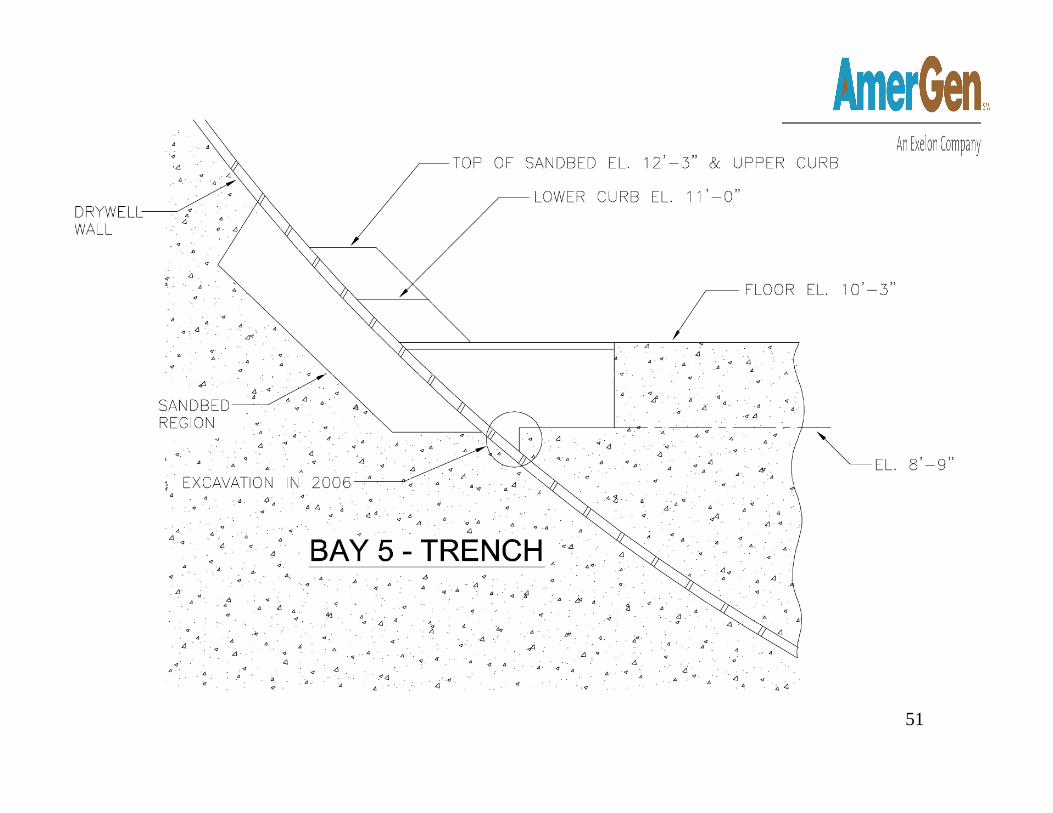
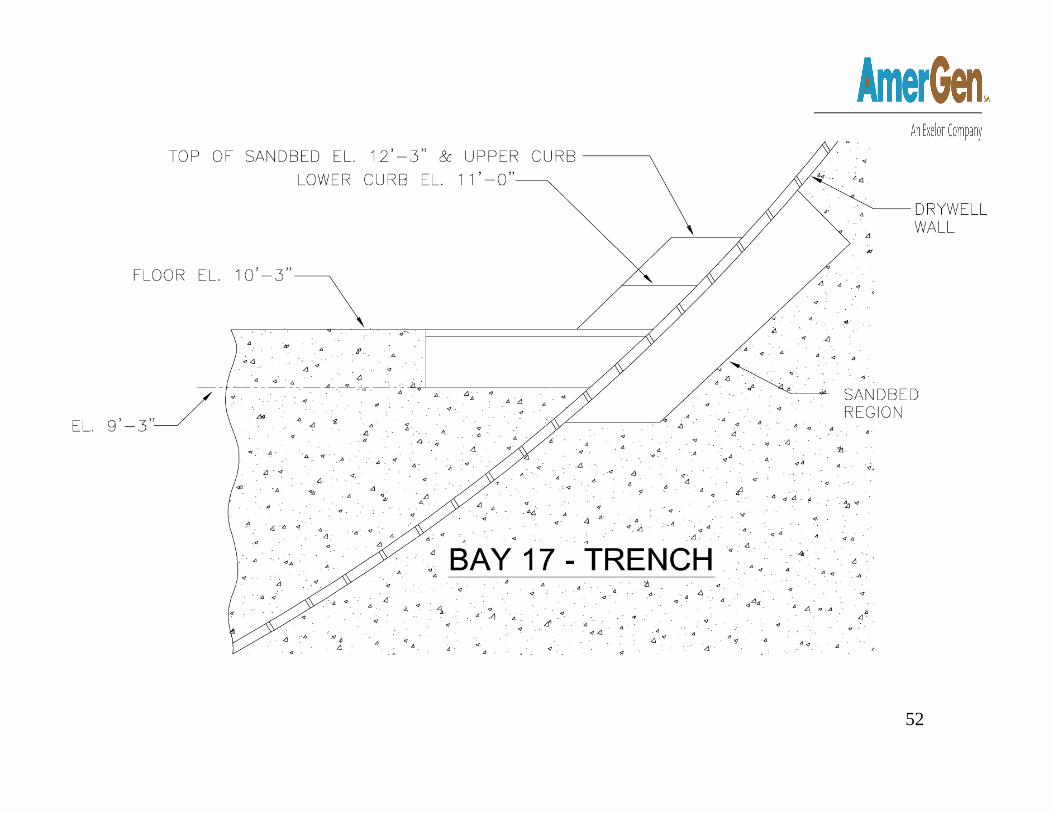
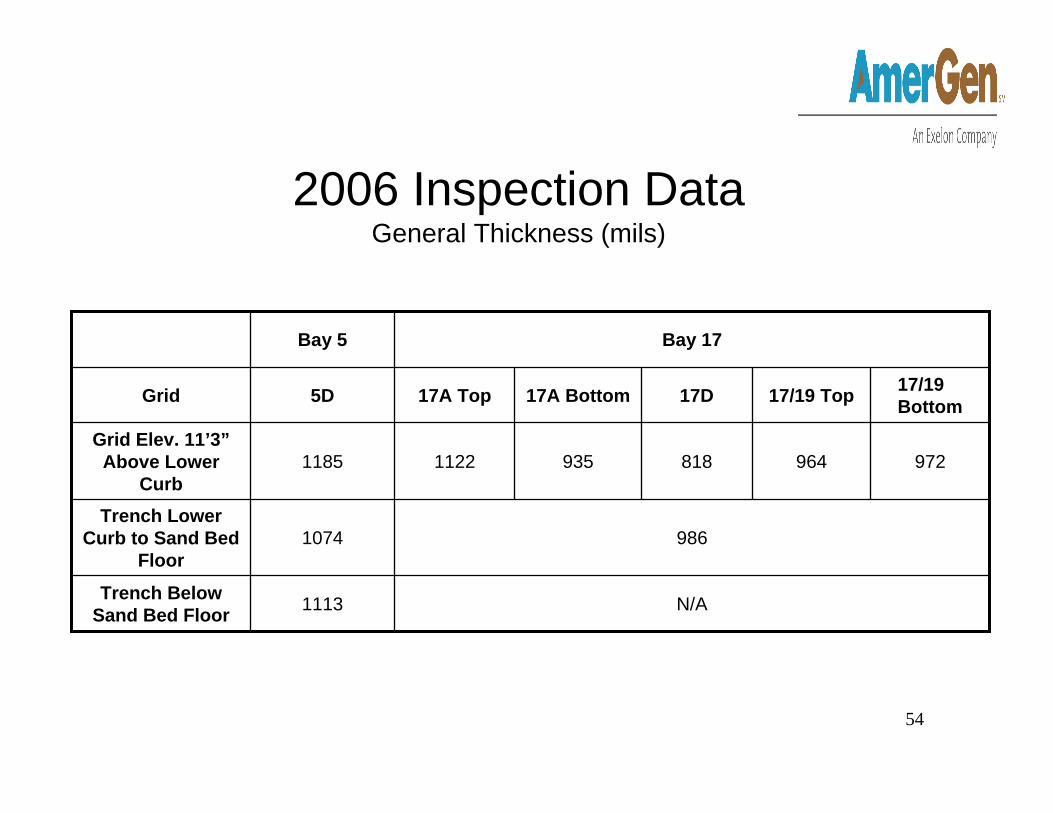
Sand Bed Region Background and History
• Trenches in bays 5 and 17 were excavated in 1986 to determine corrosion in sand bed at elevations below the drywell interior floor– Bays 5 and 17 were selected because UT
measurements indicated these bays had the least and the most corrosion, respectively
– The trenches extend to about the elevation of the bottom of the sand bed
– UT measurements taken in the trenches confirmed that the corrosion below elev. 11’ 3”was bounded by the monitoring at elev. 11’ 3”
54
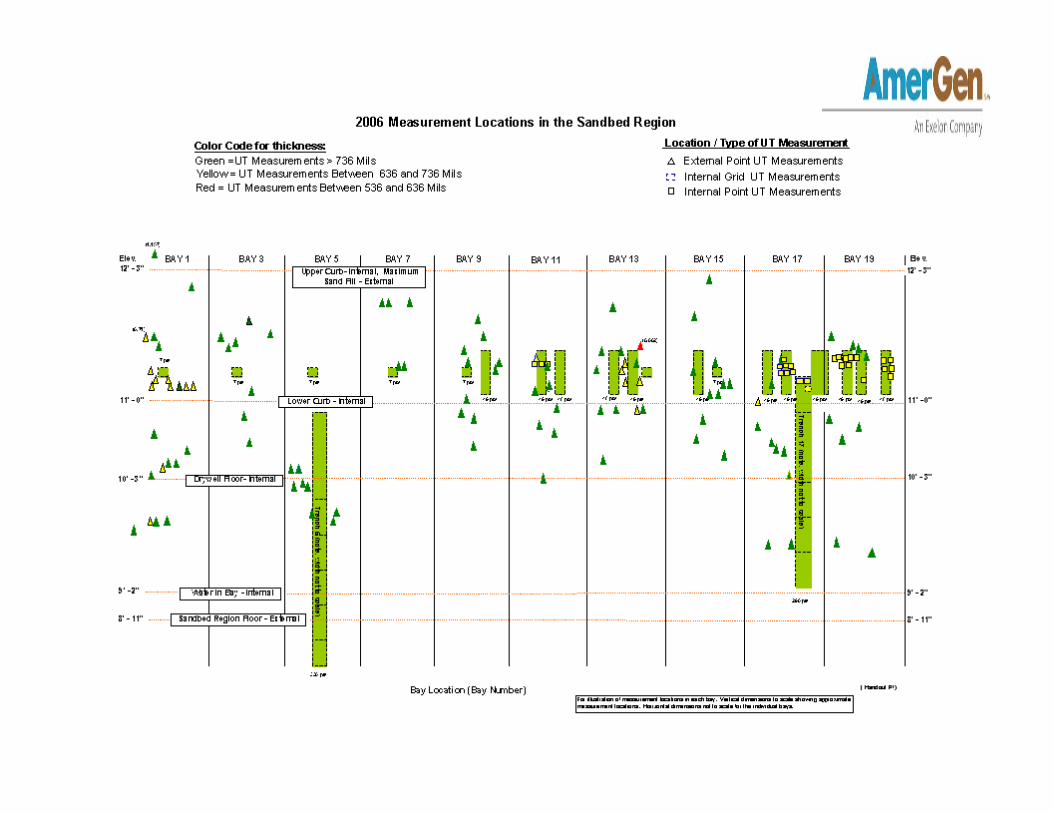
2006 Inspection DataGeneral Thickness (mils)
97296481893511221185Grid Elev. 11’3”
Above Lower Curb
Bay 17Bay 5
17/19 Bottom17/19 Top17D17A Bottom17A Top5DGrid
N/A1113Trench Below Sand Bed Floor
9861074Trench Lower
Curb to Sand Bed Floor
55
Sand Bed Region Background and History
• Sand was removed in 1992 and the shell was cleaned
• External UT measurements were taken in all bays at thinned local areas (as determined by visual inspection)
• The shell was coated with epoxy coating• UT grid measurements were taken at the 19
monitored locations at elev. 11’3” as a baseline for the new condition
56
Condition of the Drywell Shell in the Sand Bed
Region After Sand Removal
57
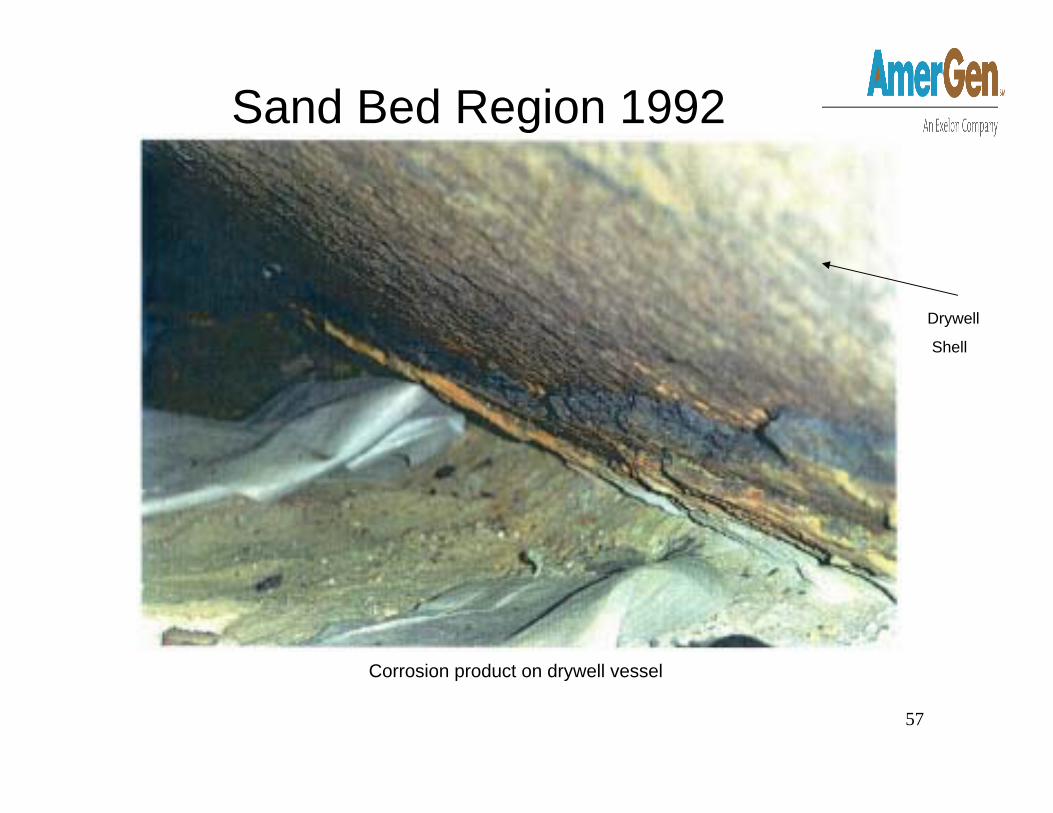
Corrosion product on drywell vessel
Sand Bed Region 1992
Drywell
Shell
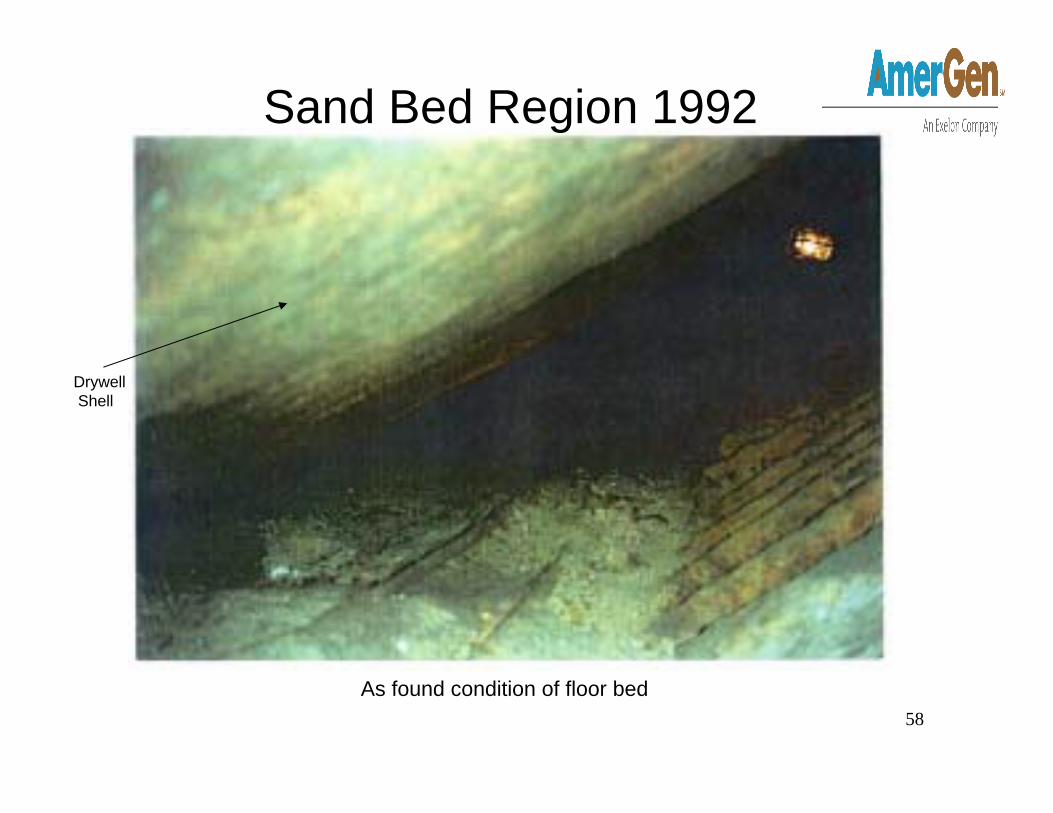
58As found condition of floor bed
Sand Bed Region 1992
DrywellShell
59
Condition of the Drywell Shell in the Sand Bed
Region After Application of Epoxy Coating
60
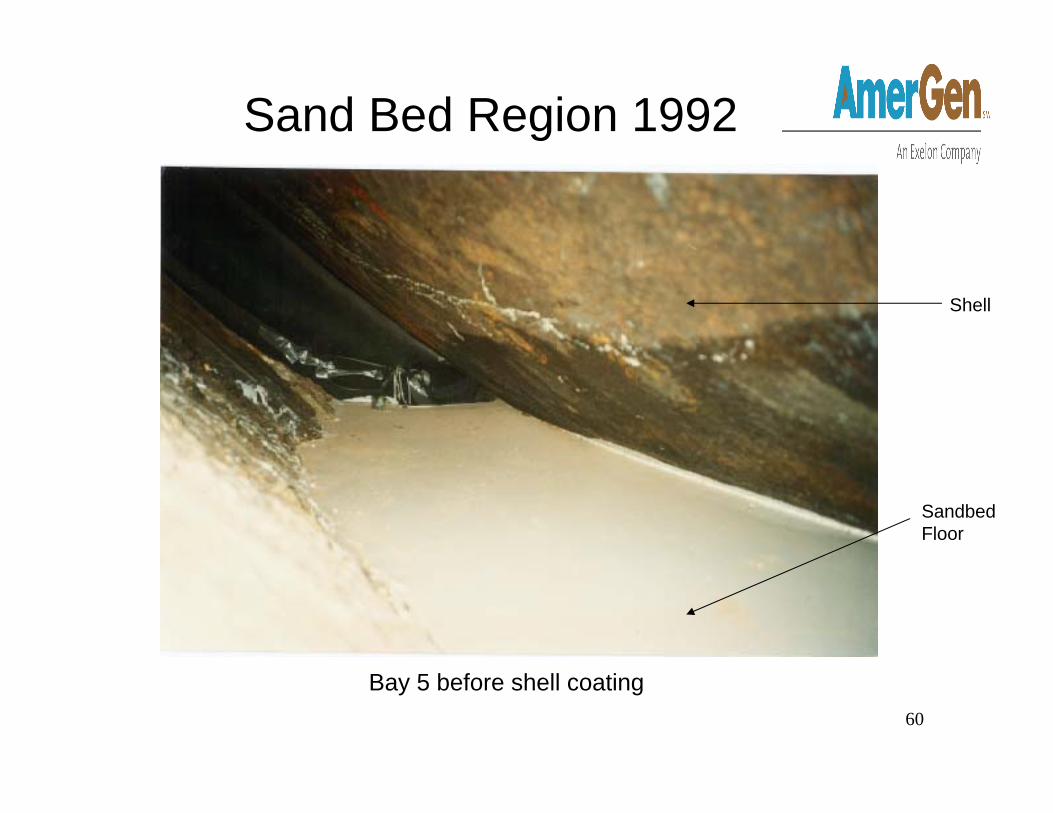
Bay 5 before shell coating
Shell
SandbedFloor
Sand Bed Region 1992
61
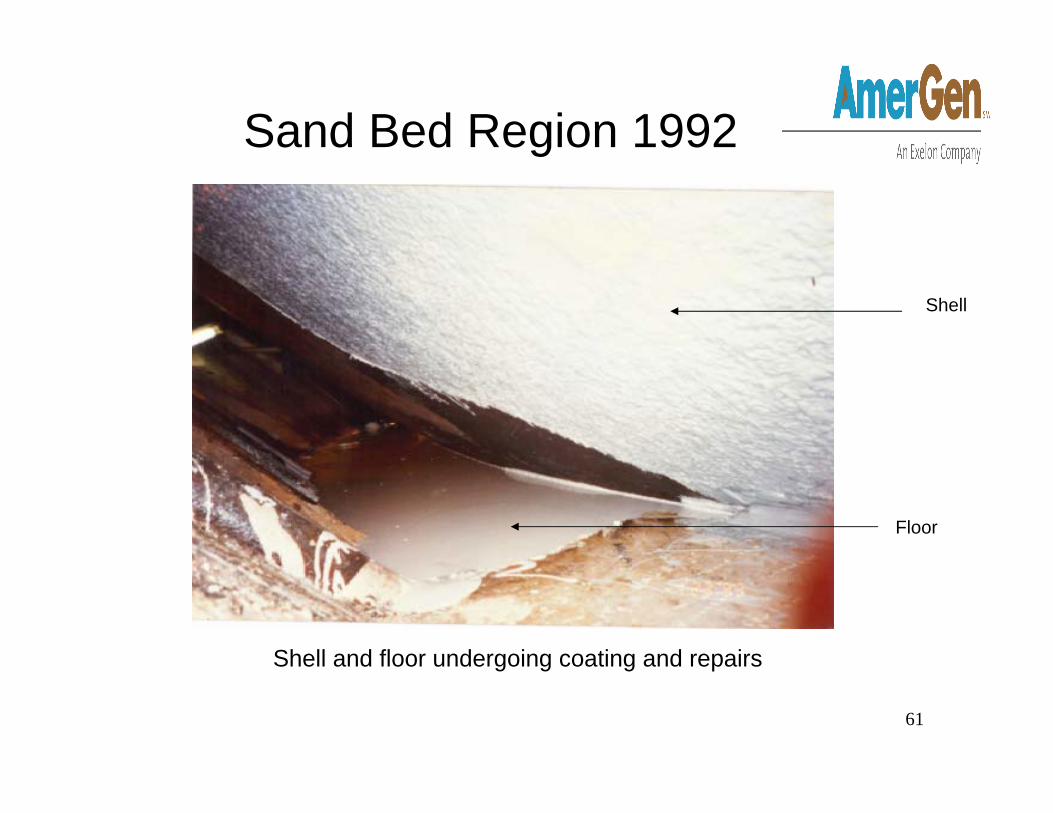
Shell and floor undergoing coating and repairs
Shell
Floor
Sand Bed Region 1992
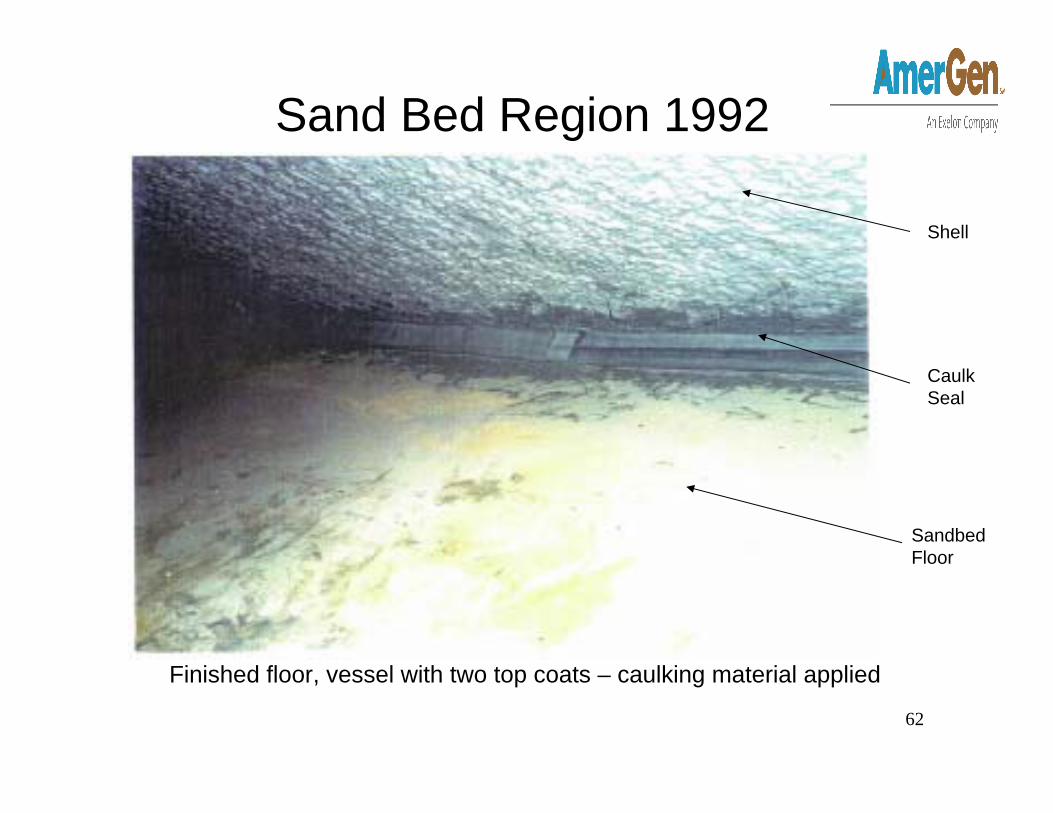
62
Finished floor, vessel with two top coats – caulking material applied
Sand Bed Region 1992
Shell
CaulkSeal
SandbedFloor
63
Sand Bed Region Background and History
• DEVOE Epoxy coating system (3 part)– Designed for application on corroded
surfaces– One coat DEVOE 167 Rust Penetrating
Sealer• Penetrates rusty surfaces• Reinforces rusty steel substrates• Ensures adhesion of Devran 184 epoxy coating
64
Sand Bed Region Background and History
• DEVOE Epoxy coating system– Two coats Devran 184 epoxy coating
• Designed for tank bottoms, including water tanks, fuel tanks, selected chemical tanks
• Coating application was tested in a mock-up for coating thickness and absence of holidays or pinholes
• Two coats used to minimize any chance of pinholes or holidays
• The two coats are different colors
65
Use of Coatings to Prevent Corrosion
Jon R. Cavallo, PE, PCSVice President
Corrosion Control Consultants and Labs, Inc.
66
Background and History• The OCNGS Protective Coatings Monitoring
and Maintenance Program aging management program is consistent with NUREG 1801, Rev. 1 (the GALL Report), Appendix XI.S8– NUREG 1801, Appendix XI.S8 only covers
Coating Service Level I coatings• In addition, the OCNGS Coating Monitoring
and Maintenance Program includes the Coating Service Level II coatings applied to exterior of drywell in Sand Bed region
67
Background and History• Inspection and evaluation of OCNGS external coated
drywell Sand Bed region surfaces (Coating Service Level II Coatings) is conducted in accordance with ASME Section XI, Subsection IWE by qualified VT inspectors.– Areas shall be examined (as a minimum) for
flaking, blistering, peeling, discoloration and other signs of distress.
• The premise of ASME Section XI, Subsection IWE is that degradation of a steel substrate will be indicated by the presence of visual anomalies in the attendant protective coatings
68
How Barrier Coating Systems Prevent Corrosion
• Barrier coating systems separate the electrolyte from the anodes, cathodes and conductors
• A barrier coating system has been applied to the steel substrate in the OCGS Sand Bed region
69
Technical Review of OCGS Sand Bed Region
Coating System
• The OCGS Sand Bed region barrier coating system consists of:– Devoe Pre-Prime 167 penetrating sealer– Devoe Devran 184 mid- and top-coat– Devoe Devmat 124S caulkand is appropriate for the intended service
70
Technical Review of OCGS Sand Bed Region Coating System• With periodic condition assessment and maintenance
(if required), the OCNGS Sand Bed region coating system will continue to prevent corrosion of the steel substrate for the period of extended operation
• Oyster Creek inspected 100% of the Sand Bed region coating in 2006 and will inspect at least three bays every other outage, with all 10 inspected every 10 years
• The 10 year inspection periodicity cycle is appropriate and commensurate with the Sand Bed Region environment and industry experience– EPRI 1003102, “Guideline on Nuclear Safety-Related Coatings”

71
UT Thickness MeasurementsIn the Sand Bed
Pete TamburroOyster Creek Engineering
72
Background and HistorySand Bed Region
• UT grid measurements were taken at the 19 monitored locations at elev. 11’3”as a baseline for the new condition in 1992
• In 1992, thinnest grid average thickness 800 mils vs. criterion of 736 mils
• In 1992, thinnest local reading 618 mils vs. criterion of 490 mils
73
Background and HistorySand Bed Region
• 19 grids repeated in 1994 and 1996– Statistically, no changes in thickness were
observed– Basis for corrosion “arrested” in the sand bed
region, on outer surface of the drywell– Basis for NRC SER concluding that further UT
measurements are not needed and visual inspection of the coating is sufficient
• The 2006 UT measurements confirmed that corrosion has been arrested
74
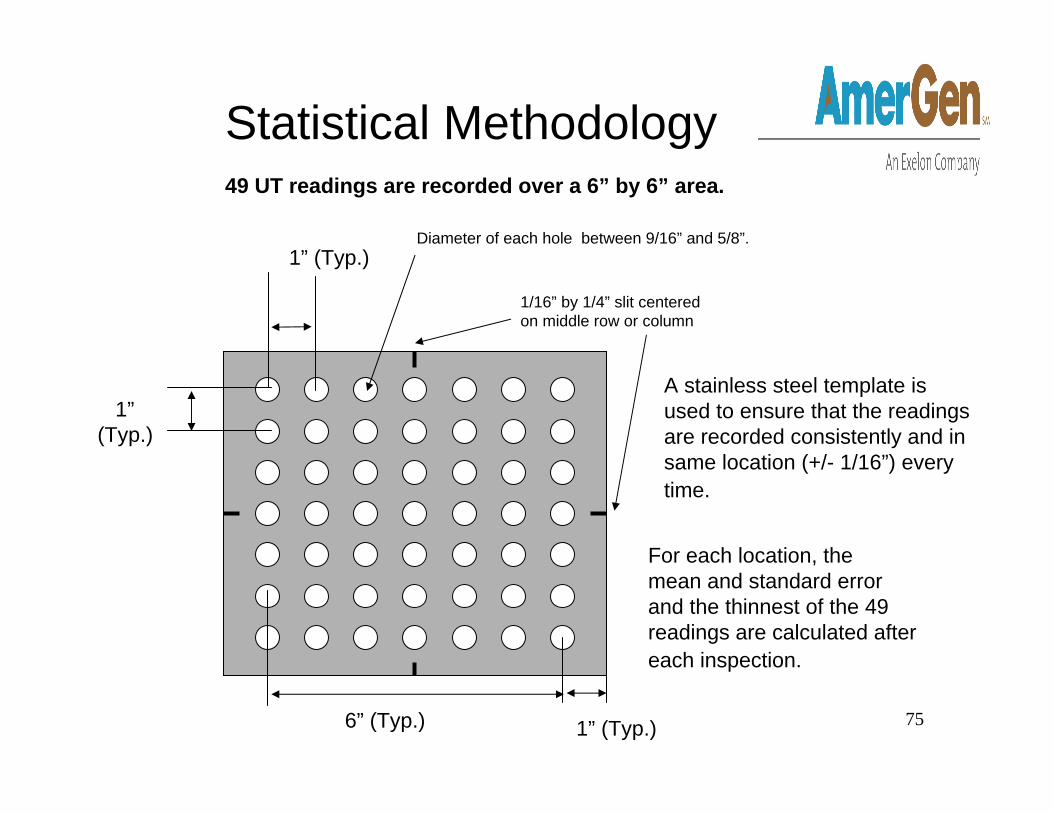
UT Measurements of 6”x6” GridSand Bed Region
• Measurement locations are marked on the inside of the drywell shell
• Use a stainless steel template with 49 holes to align the UT probe
• UT probe placed perpendicular to the surface to consistently obtain lowest reading
• A protective grease is applied to the 6”x6”grid during operation, and removed to take UT measurements
75
49 UT readings are recorded over a 6” by 6” area.
1” (Typ.)
1”(Typ.)
Diameter of each hole between 9/16” and 5/8”.
1/16” by 1/4” slit centered on middle row or column
1” (Typ.)
A stainless steel template is used to ensure that the readings are recorded consistently and in same location (+/- 1/16”) every time.
Statistical Methodology
For each location, the mean and standard error and the thinnest of the 49 readings are calculated after each inspection.
6” (Typ.)
76
Statistical Methodology• Because of roughness of the exterior surface
of the drywell shell in the sand bed, there is uncertainty in the mean thickness calculated for each grid location
• The major contributor to the uncertainty in the means is the variance from point to point due to the rough surface and not inaccuracy or repeatability of the UT Instrumentation
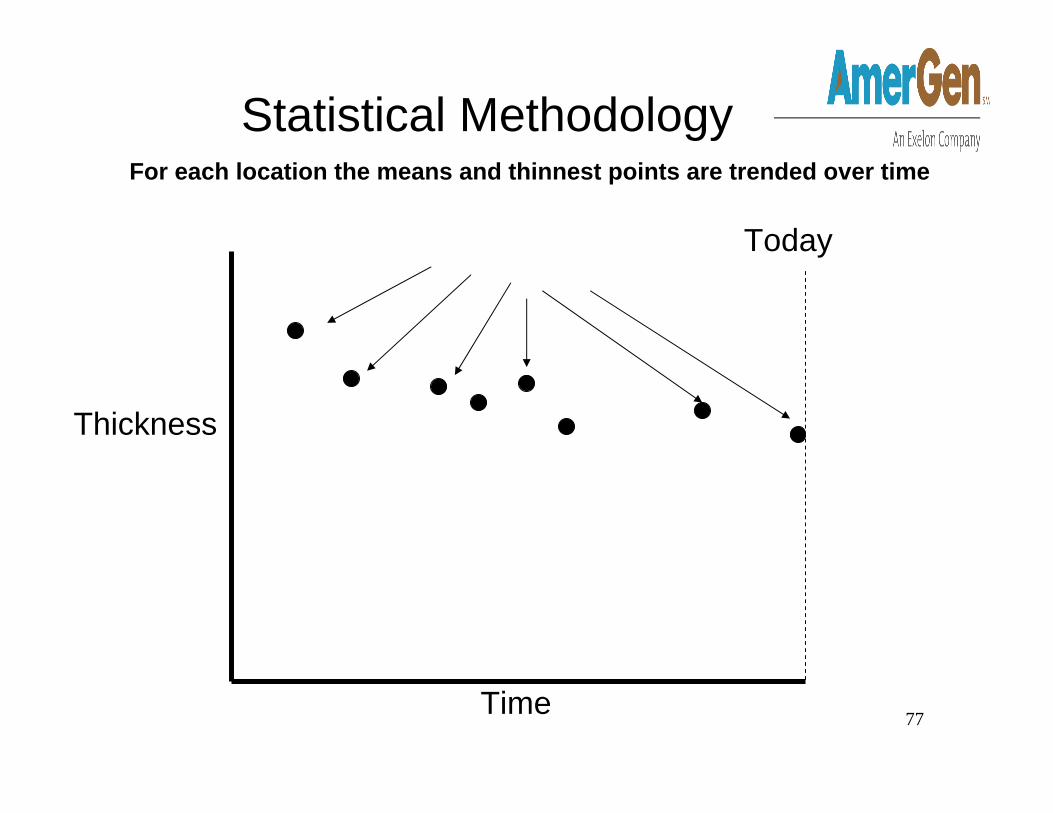
77Time
Thickness
For each location the means and thinnest points are trended over time
Today
Statistical Methodology
78Time
Thickness
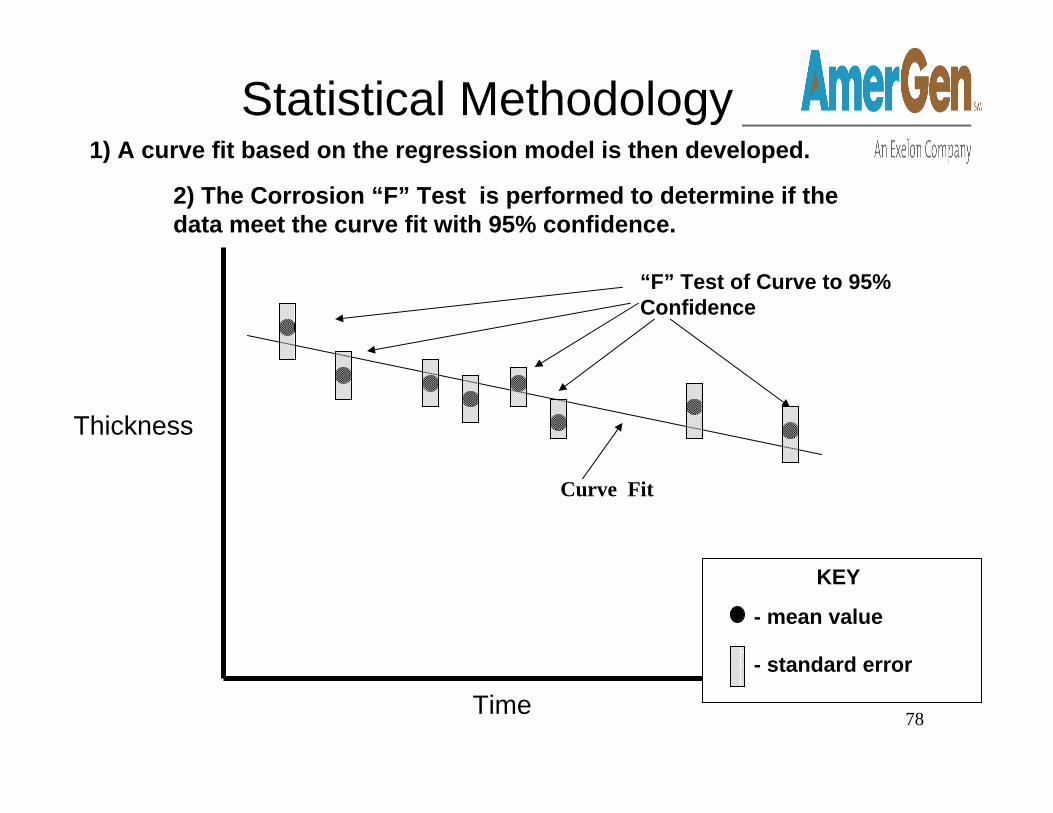
“F” Test of Curve to 95% Confidence
Curve Fit
2) The Corrosion “F” Test is performed to determine if the data meet the curve fit with 95% confidence.
- mean value
- standard error
KEY
1) A curve fit based on the regression model is then developed.
Statistical Methodology
79
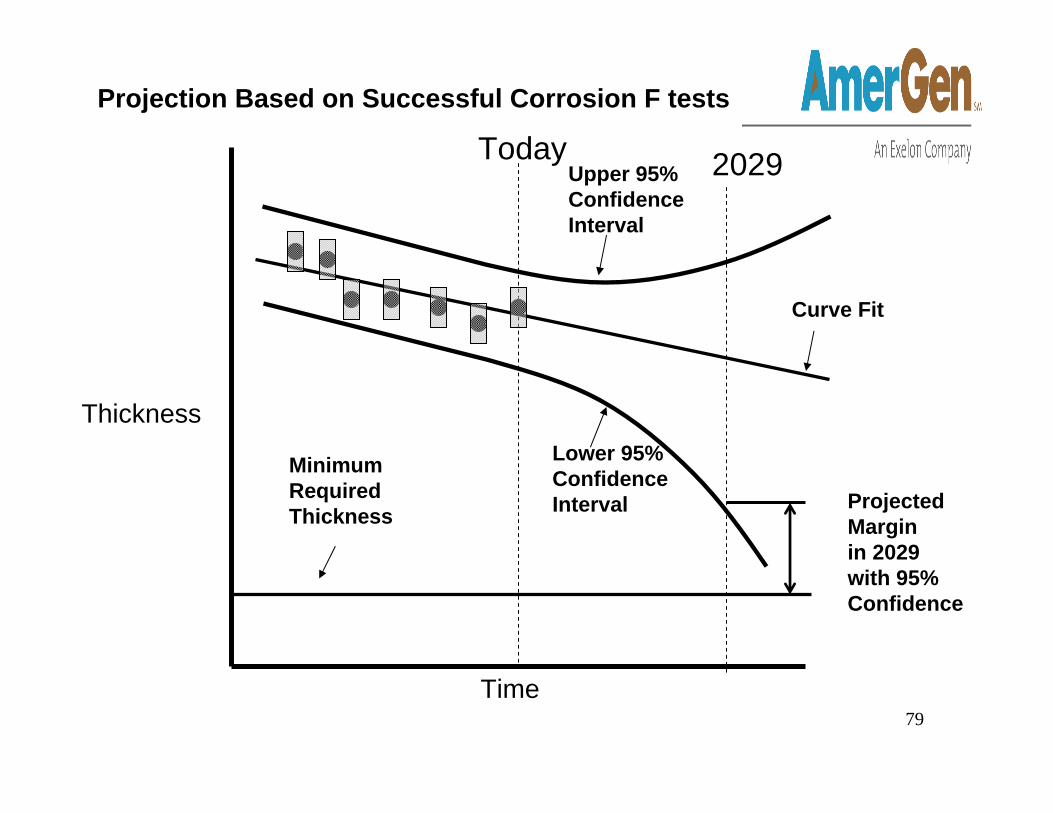
Minimum Required Thickness
Thickness
Today 2029
Time
Curve Fit
Upper 95% Confidence Interval
Lower 95% Confidence Interval Projected
Marginin 2029 with 95% Confidence
Projection Based on Successful Corrosion F tests
80
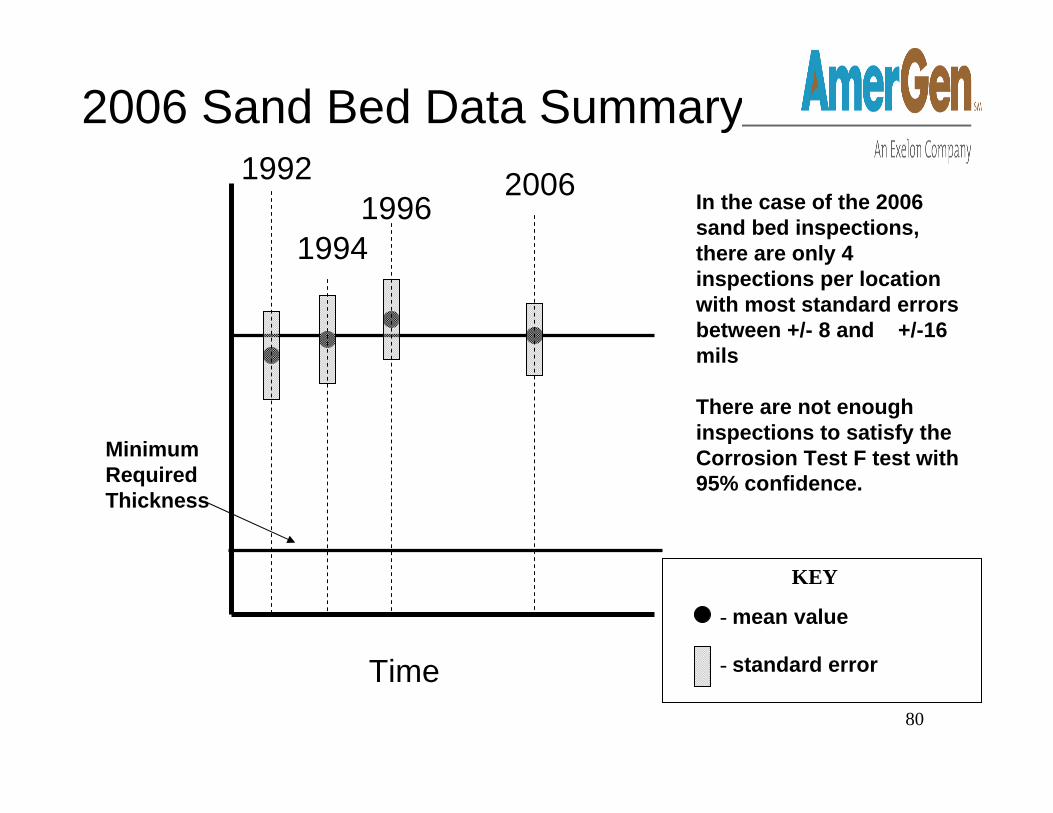
Time
Minimum Required Thickness
2006
2006 Sand Bed Data Summary
19961994
1992
- mean value
- standard error
KEY
In the case of the 2006 sand bed inspections, there are only 4 inspections per location with most standard errors between +/- 8 and +/-16 mils
There are not enough inspections to satisfy the Corrosion Test F test with 95% confidence.
81
Statistical Methodology
• We then employed a conservative statistical analysis based on a “Monte Carlo” type simulation to determine a minimum statistically observable corrosion rate for the purpose of ensuring adequate inspection frequency
82
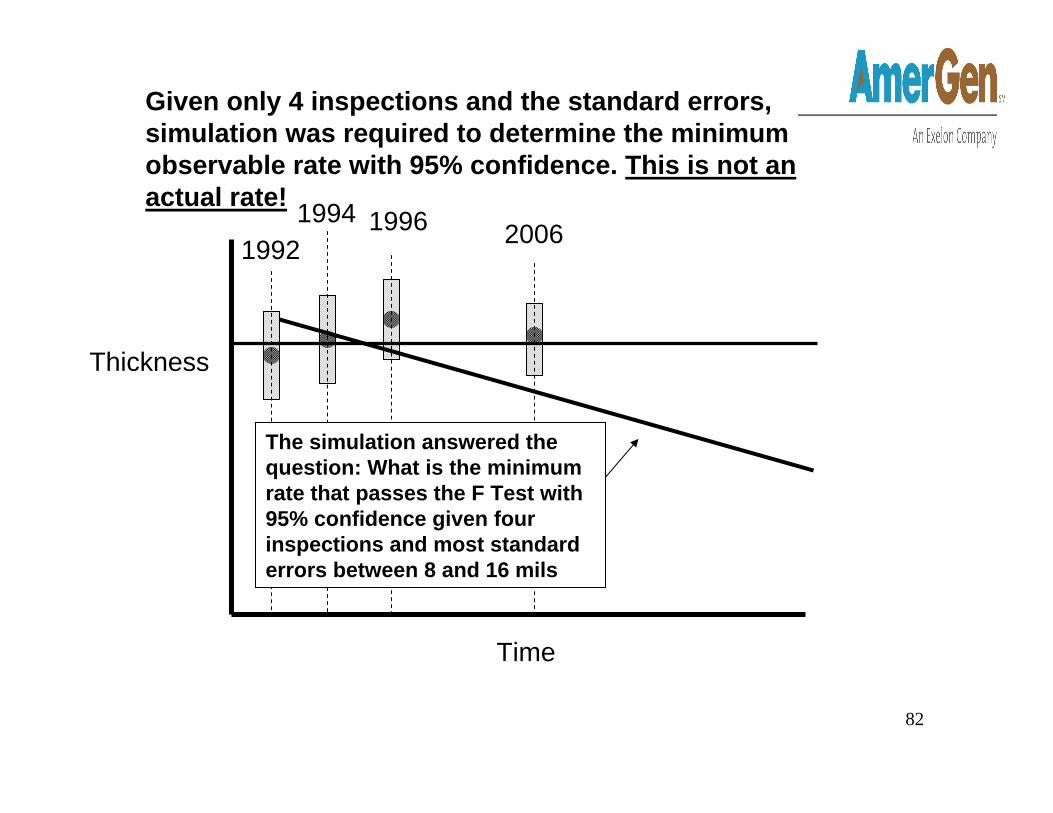
Time
Thickness
Given only 4 inspections and the standard errors, simulation was required to determine the minimum observable rate with 95% confidence. This is not an actual rate!
2006199619941992
The simulation answered the question: What is the minimum rate that passes the F Test with 95% confidence given four inspections and most standard errors between 8 and 16 mils
83
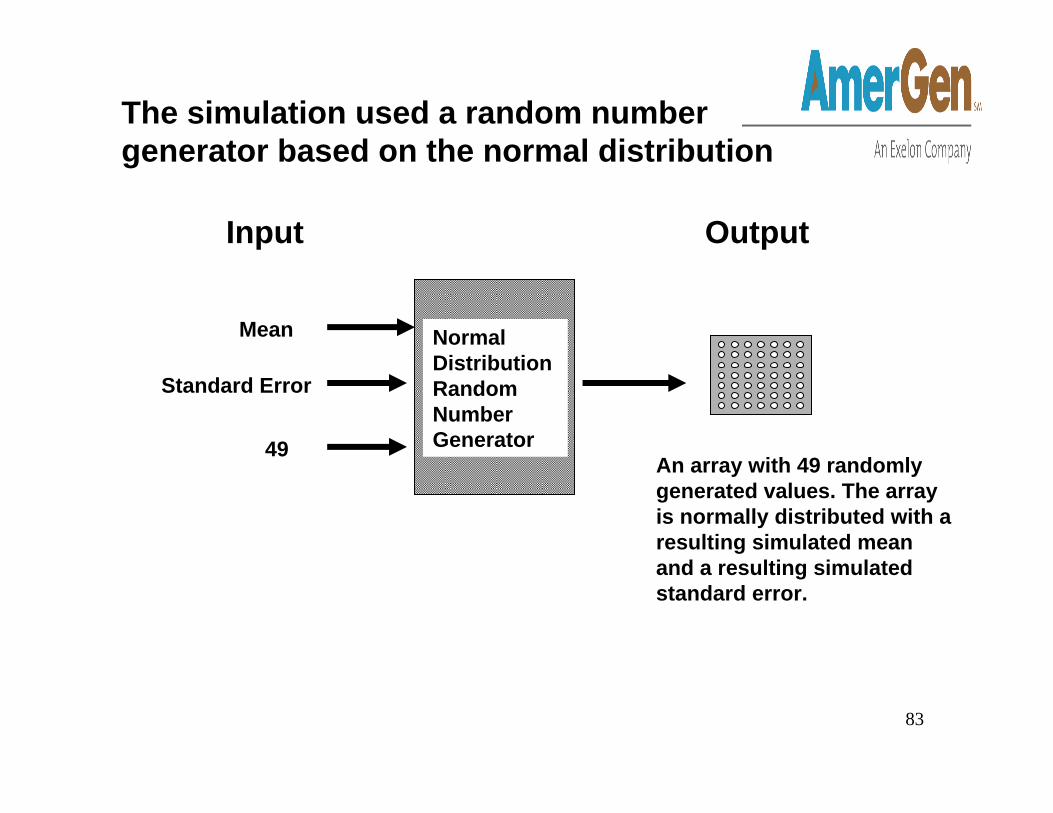
The simulation used a random number generator based on the normal distribution
Normal Distribution Random Number Generator
Mean
Standard Error
49
Input Output
An array with 49 randomly generated values. The array is normally distributed with a resulting simulated mean and a resulting simulated standard error.
84Time
Thickness
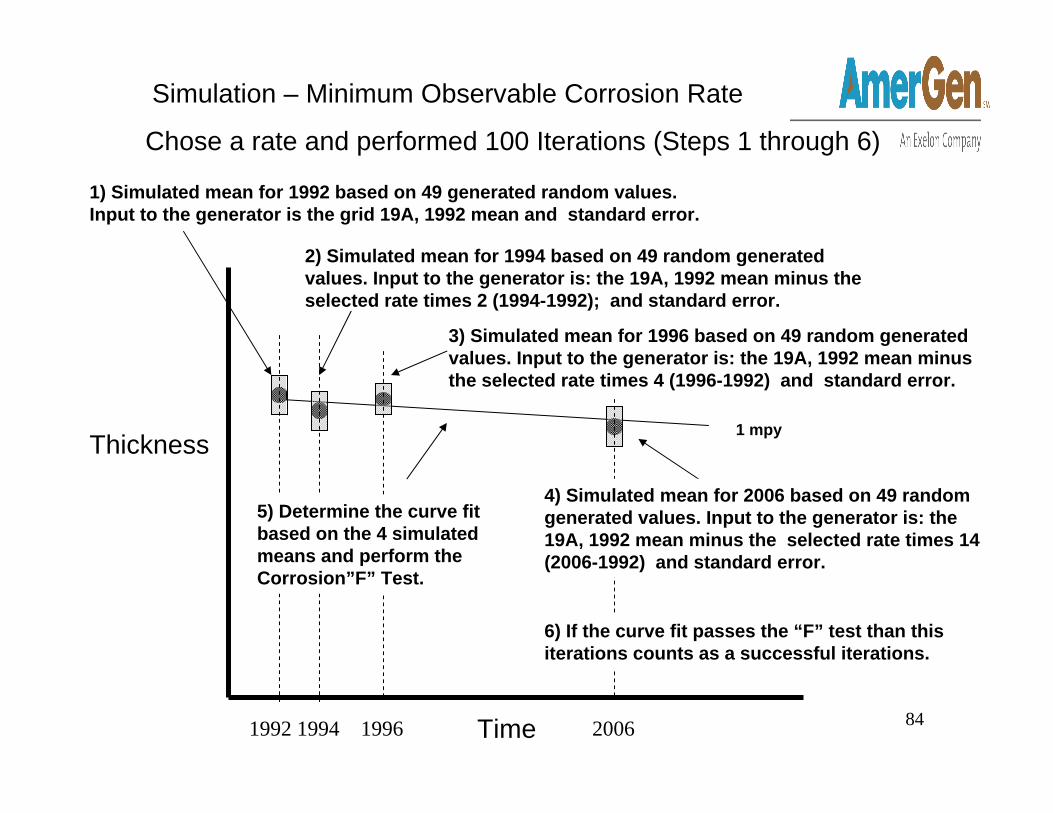
1) Simulated mean for 1992 based on 49 generated random values. Input to the generator is the grid 19A, 1992 mean and standard error.
Chose a rate and performed 100 Iterations (Steps 1 through 6)
2) Simulated mean for 1994 based on 49 random generated values. Input to the generator is: the 19A, 1992 mean minus the selected rate times 2 (1994-1992); and standard error.
3) Simulated mean for 1996 based on 49 random generated values. Input to the generator is: the 19A, 1992 mean minus the selected rate times 4 (1996-1992) and standard error.
Simulation – Minimum Observable Corrosion Rate
1 mpy
2006199619941992
4) Simulated mean for 2006 based on 49 random generated values. Input to the generator is: the 19A, 1992 mean minus the selected rate times 14 (2006-1992) and standard error.
5) Determine the curve fit based on the 4 simulated means and perform the Corrosion”F” Test.
6) If the curve fit passes the “F” test than this iterations counts as a successful iterations.
85Time
Thickness
Simulation – Minimum Observable Corrosion Rate
20061996
1994
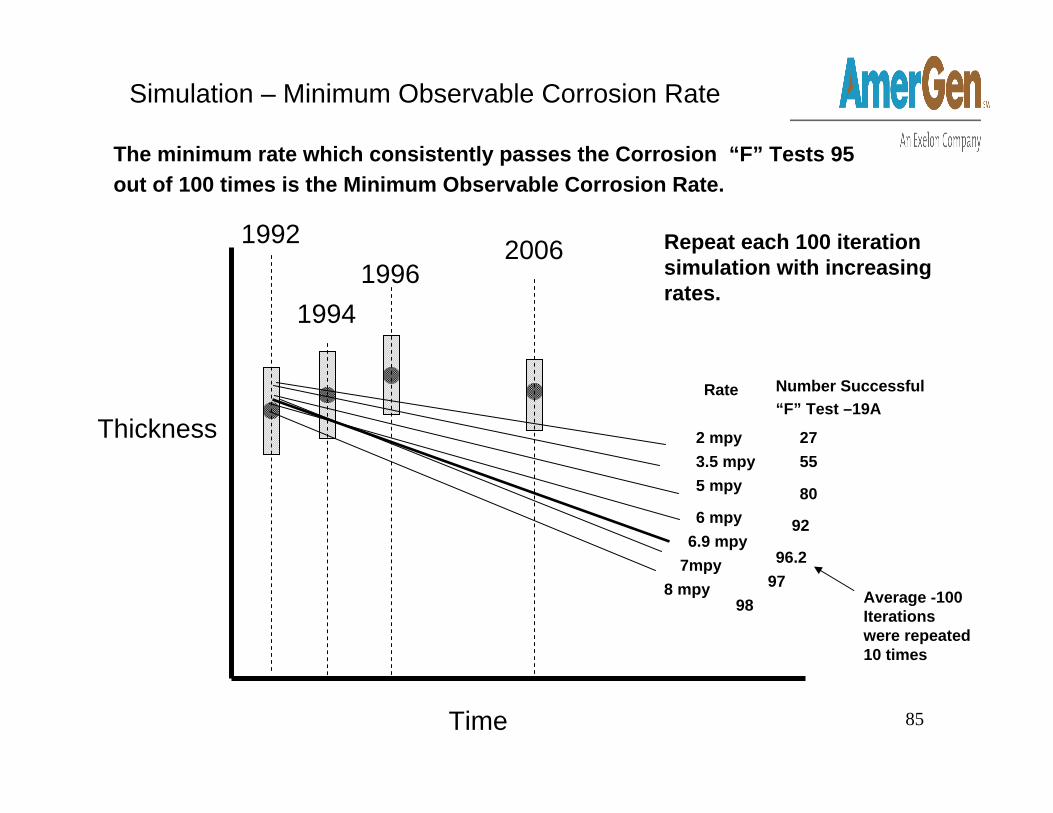
1992 Repeat each 100 iteration simulation with increasing rates.
The minimum rate which consistently passes the Corrosion “F” Tests 95 out of 100 times is the Minimum Observable Corrosion Rate.
5 mpy
2 mpy
8 mpy7mpy
6 mpy
Rate Number Successful “F” Test –19A
80
27
92
9798
3.5 mpy 55
6.9 mpy96.2
Average -100 Iterations were repeated 10 times
86
Time
Thickness
Minimum Required Thickness
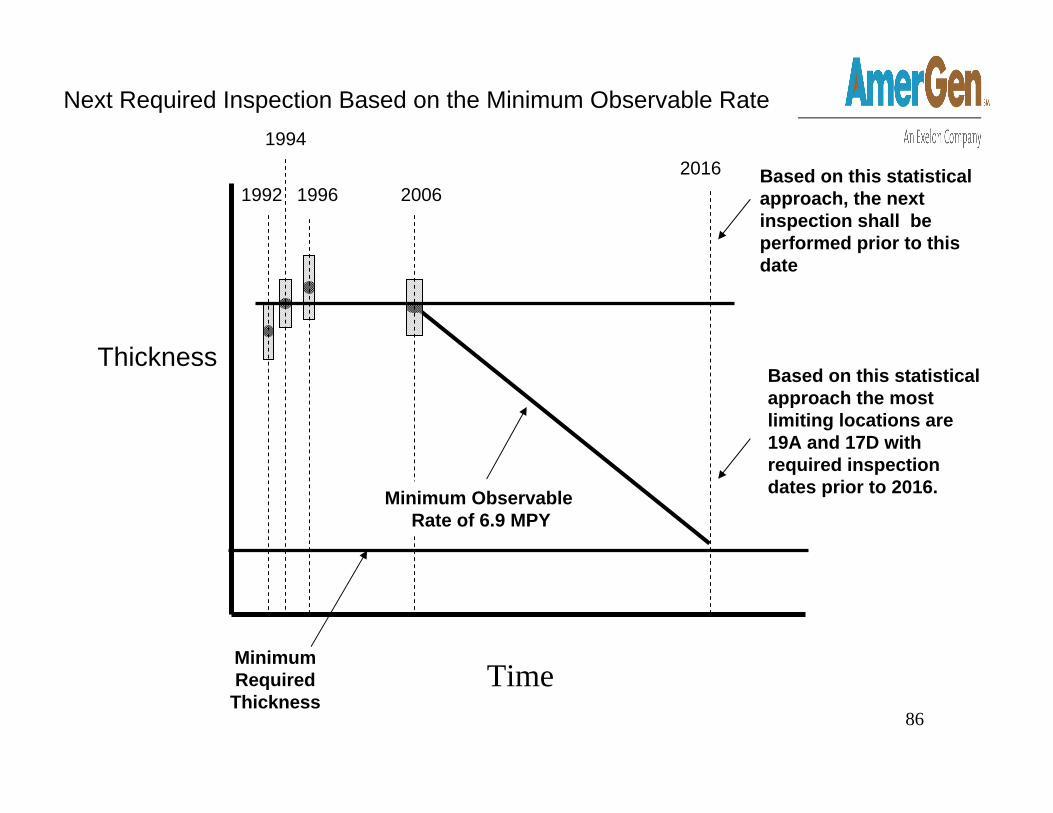
Next Required Inspection Based on the Minimum Observable Rate
Based on this statistical approach, the next inspection shall be performed prior to this date
Based on this statistical approach the most limiting locations are 19A and 17D with required inspection dates prior to 2016.
20061996
1994
1992
Minimum Observable Rate of 6.9 MPY
2016
87
Results of the Statistical Simulation
• The most limiting locations are 19A and 17D, with required inspections prior to 2016
• Therefore, the next inspection scheduled for 2010 is appropriate
• Analysis after future inspections will be used to determine the appropriate inspection frequency
88
2006 InspectionsSand Bed Region
• Visual inspection of coating in all 10 bays (external)
• UT measurements of 19 grids at elev. 11’3”(internal)
• UT measurements 106 locally thinned single point locations (external)
89
2006 Inspection ResultsSand Bed Region
• Visual inspection of External Shell Coating – no degradation
90
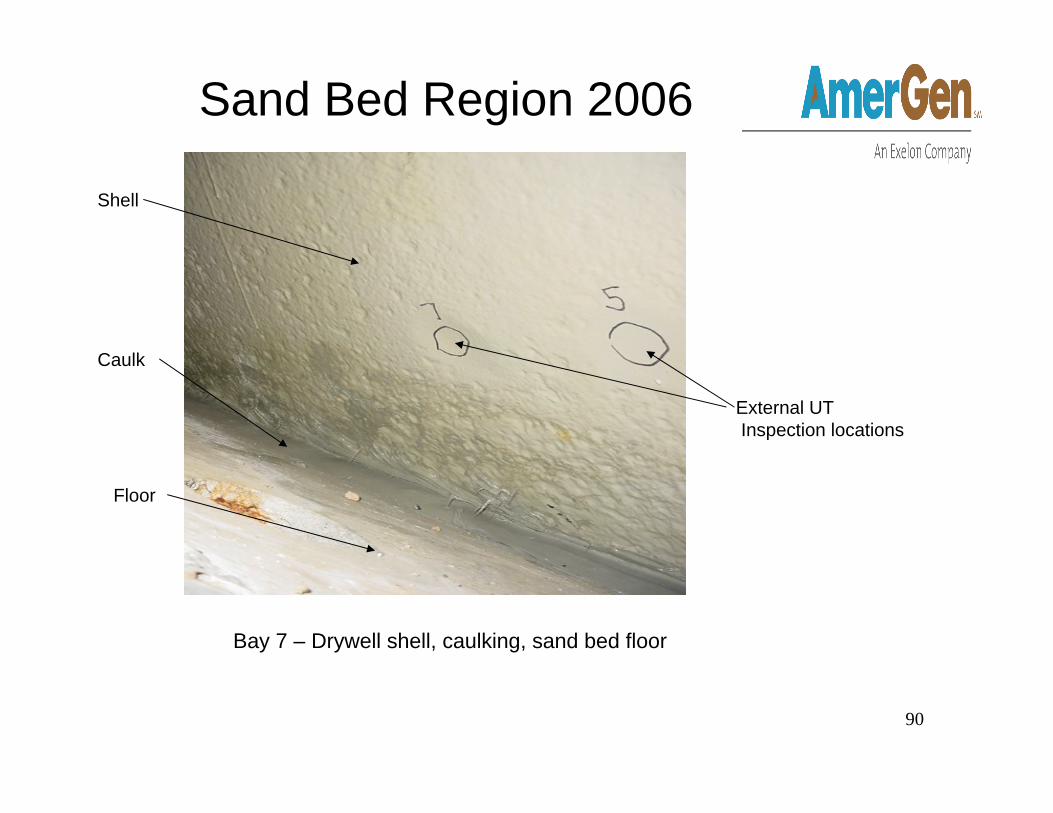
Bay 7 – Drywell shell, caulking, sand bed floor
External UTInspection locations
Shell
Caulk
Floor
Sand Bed Region 2006
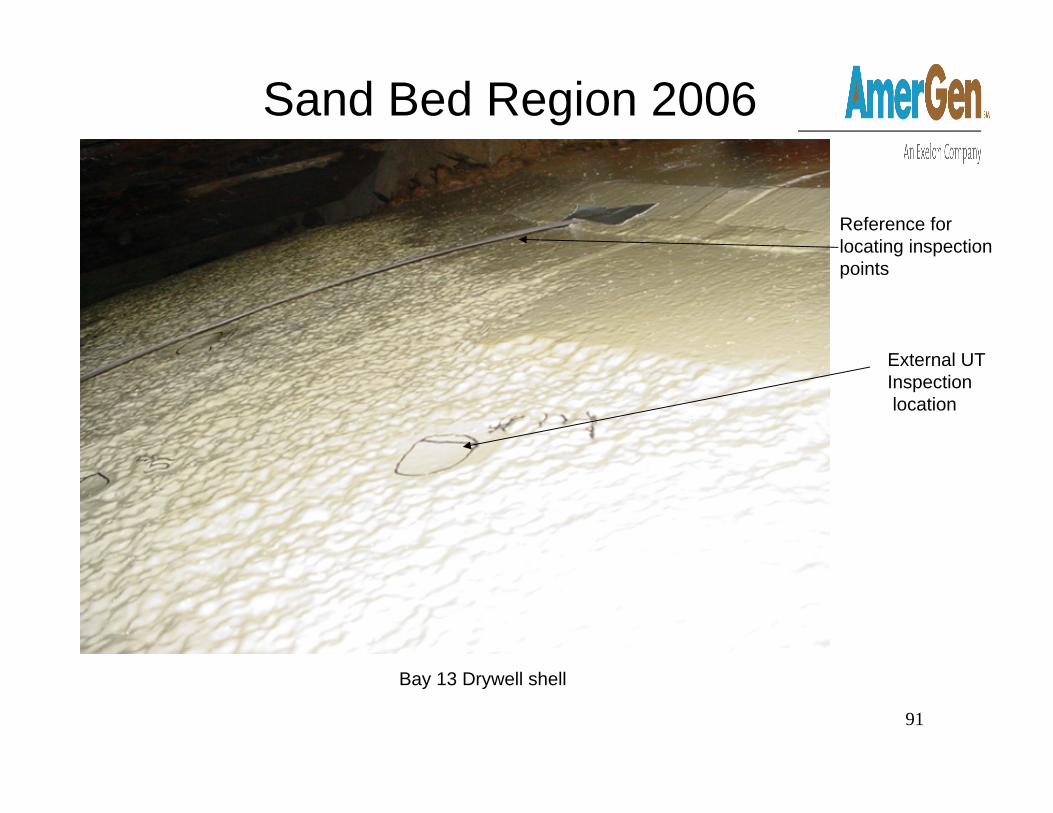
91
Bay 13 Drywell shell
Reference for locating inspection points
External UT Inspectionlocation
Sand Bed Region 2006

92
Drywell Shell Bay 19
Shell
CaulkFloor
Sand Bed Region 2006
93
2006 Inspection ResultsSand Bed Region
• UT measurements at 19 internal grid locations –No ongoing corrosion
94
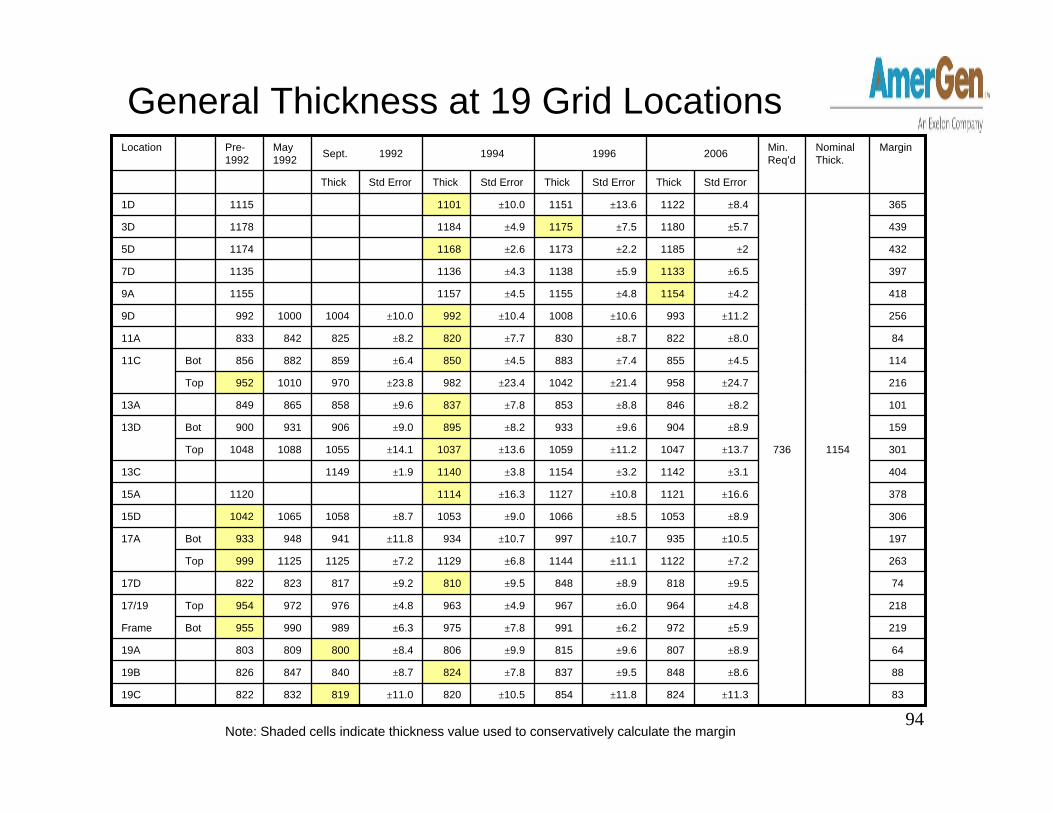
General Thickness at 19 Grid Locations
83±11.3824±11.8854±10.5820±11.081983282219C
88±8.6848±9.5837±7.8824±8.784084782619B
64±8.9807±9.6815±9.9806±8.480080980319A
219±5.9972±6.2991±7.8975±6.3989990955BotFrame
218±4.8964±6.0967±4.9963±4.8976972954Top17/19
74±9.5818±8.9848±9.5810±9.281782382217D
263±7.21122±11.11144±6.81129±7.211251125999Top
197±10.5935±10.7997±10.7934±11.8941948933Bot17A
306±8.91053±8.51066±9.01053±8.710581065104215D
378±16.61121±10.81127±16.31114112015A
404±3.11142±3.21154±3.81140±1.9114913C
3011154736±13.71047±11.21059±13.61037±14.1105510881048Top
159±8.9904±9.6933±8.2895±9.0906931900Bot13D
101±8.2846±8.8853±7.8837±9.685886584913A
216±24.7958±21.41042±23.4982±23.89701010952Top
114±4.5855±7.4883±4.5850±6.4859882856Bot11C
84±8.0822±8.7830±7.7820±8.282584283311A
256±11.2993±10.61008±10.4992±10.0100410009929D
418±4.21154±4.81155±4.5115711559A
397±6.51133±5.91138±4.3113611357D
432±21185±2.21173±2.6116811745D
439±5.71180±7.51175±4.9118411783D
365±8.41122±13.61151±10.0110111151D
Std ErrorThickStd ErrorThickStd ErrorThickStd ErrorThick
MarginNominal Thick.
Min. Req’d2006199619941992Sept.May
1992Pre-1992
Location
Note: Shaded cells indicate thickness value used to conservatively calculate the margin
95
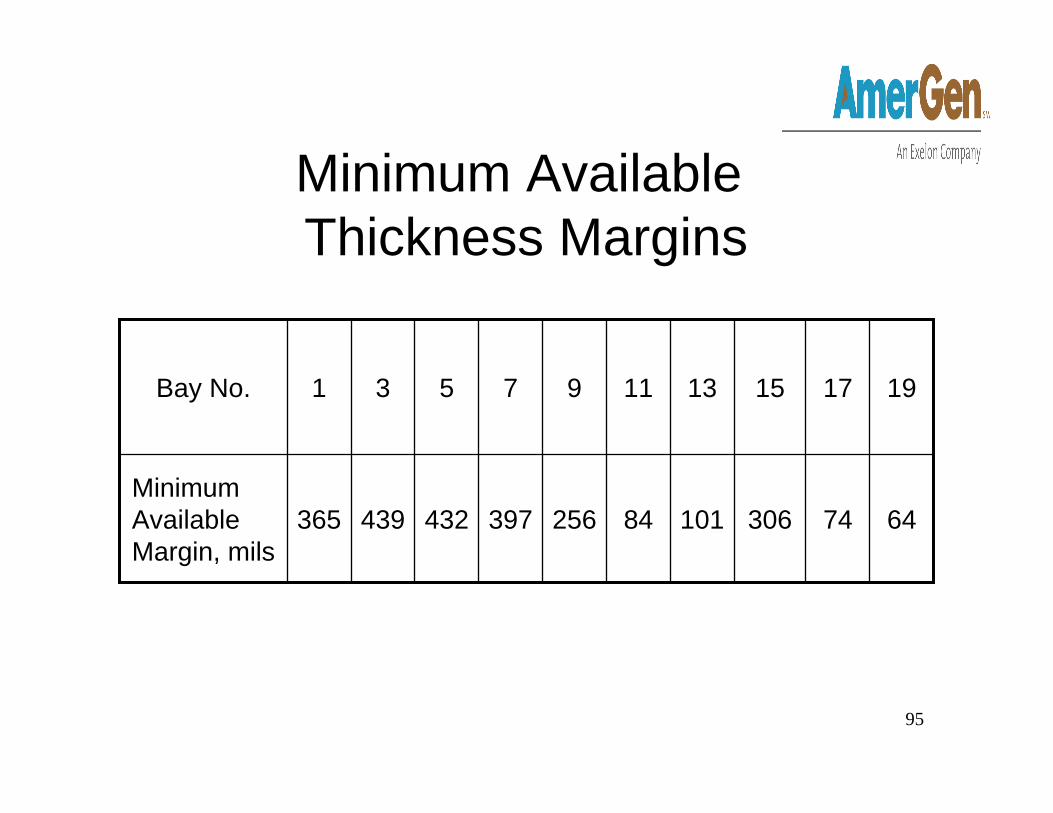
Minimum AvailableThickness Margins
647430610184256397432439365Minimum Available Margin, mils
191715131197531Bay No.
96
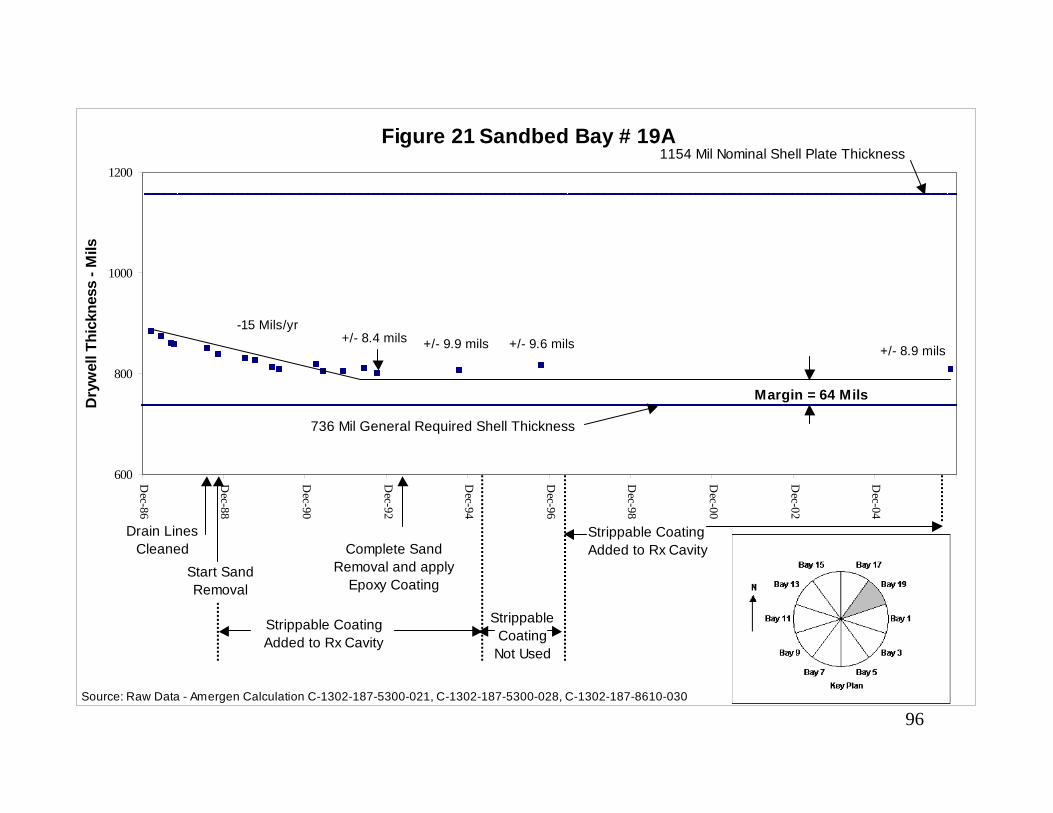
Figure 21 Sandbed Bay # 19A
600
800
1000
1200
Dec-86
Dec-88
Dec-90
Dec-92
Dec-94
Dec-96
Dec-98
Dec-00
Dec-02
Dec-04
Dry
wel
l Thi
ckne
ss -
Mils
1154 Mil Nominal Shell Plate Thickness
Complete Sand Removal and apply
Epoxy CoatingStart SandRemoval
Drain Lines Cleaned
Strippable Coating Added to Rx Cavity
Strippable Coating
Not Used
736 Mil General Required Shell Thickness
Margin = 64 Mils
-15 Mils/yr
Source: Raw Data - Amergen Calculation C-1302-187-5300-021, C-1302-187-5300-028, C-1302-187-8610-030
Strippable Coating Added to Rx Cavity
+/- 8.4 mils +/- 9.9 mils +/- 9.6 mils +/- 8.9 mils

97
Figure 1. Sandbed Bay # 1D
600
800
1000
1200
Dec-86
Dec-88
Dec-90
Dec-92
Dec-94
Dec-96
Dec-98
Dec-00
Dec-02
Dec-04
Dec-06
Dry
wel
l Thi
ckne
ss -
Mils
Start SandRemoval
Complete Sand Removal and apply
Epoxy Coating
736 Mil General Required Shell Thickness
Strippable Coating
Not Used
Strippable Coating Added to Rx Cavity
Drain Lines Cleaned
1154 Mil Nominal Shell Plate Thickness
Margin = 365 Mils
Source: Raw Data - AmerGen Calculation C-1302-187-5300-021, C-1302-187-5300-028, C-1302-187-8610-030
Strippable Coating Added to Rx Cavity
+/- 10 mils+/- 13.6 mils
+/- 8.4 mils
98
2006 Inspection ResultsExternal Sand Bed UTs
• 106 individual UT measurements were taken externally in the sand bed region
• It was verified that all 106 measurements meet the local thickness requirements (both buckling and membrane stresses)
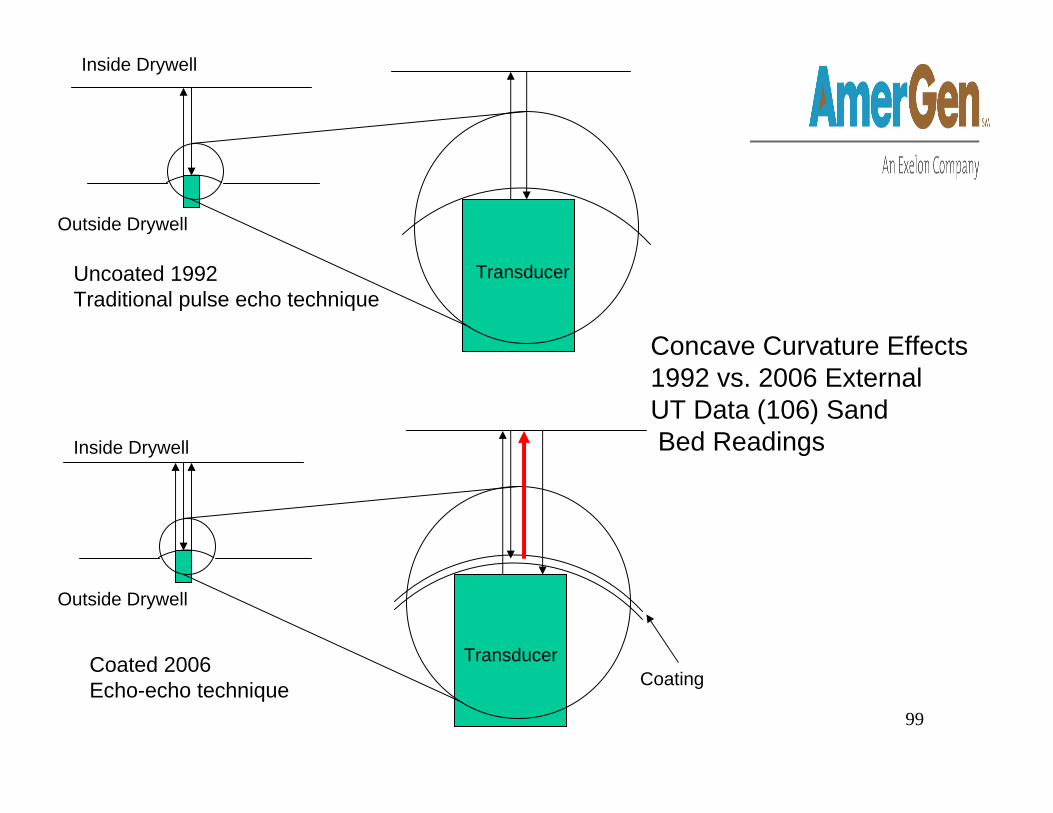
• The 2006 measurements are not directly comparable to the 1992 results because of differences in measurement techniques
99
Uncoated 1992Traditional pulse echo technique
Coated 2006Echo-echo technique
Concave Curvature Effects1992 vs. 2006 ExternalUT Data (106) SandBed Readings
Coating
Inside Drywell
Outside Drywell
Transducer
Transducer
Inside Drywell
Outside Drywell
100
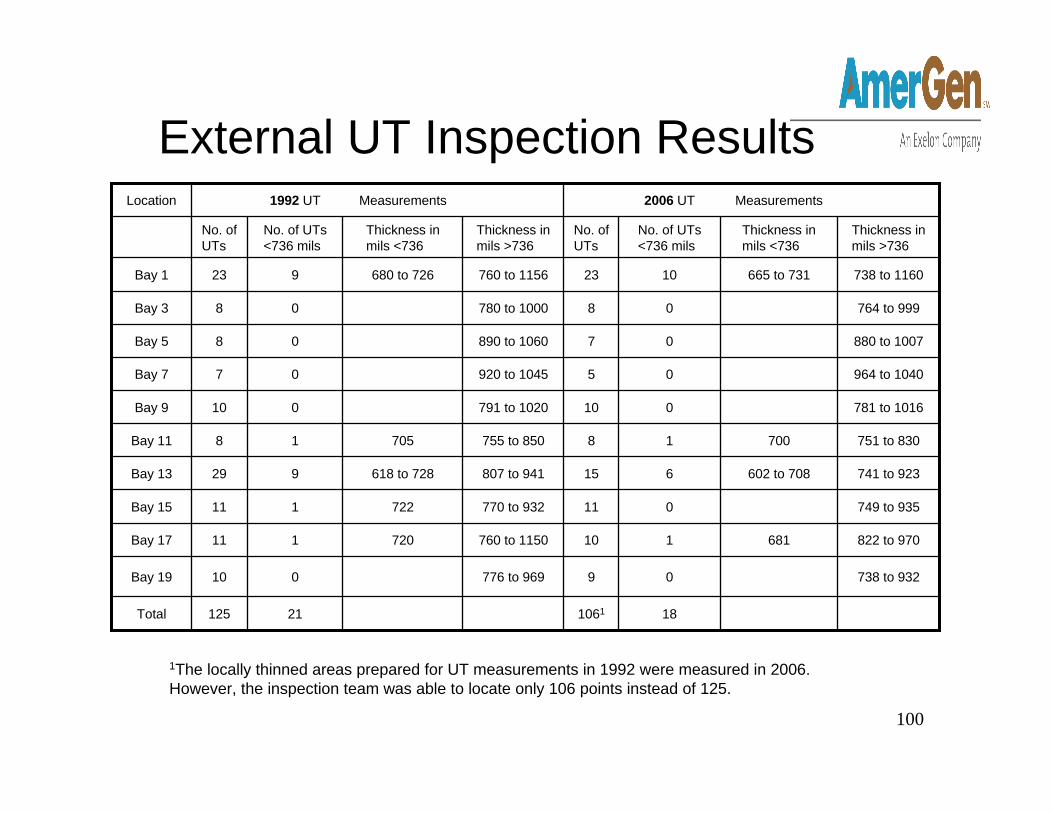
External UT Inspection Results
18106121125Total
738 to 93209776 to 969010Bay 19
822 to 970681110760 to 1150720111Bay 17
749 to 935011770 to 932722111Bay 15
741 to 923602 to 708615807 to 941618 to 728929Bay 13
751 to 83070018755 to 85070518Bay 11
781 to 1016010791 to 1020010Bay 9
964 to 104005920 to 104507Bay 7
880 to 100707890 to 106008Bay 5
764 to 99908780 to 100008Bay 3
738 to 1160665 to 7311023760 to 1156680 to 726923Bay 1
Thickness in mils >736
Thickness in mils <736
No. of UTs <736 mils
No. of UTs
Thickness in mils >736
Thickness in mils <736
No. of UTs <736 mils
No. of UTs
Measurements2006 UTMeasurements1992 UTLocation
1The locally thinned areas prepared for UT measurements in 1992 were measured in 2006. However, the inspection team was able to locate only 106 points instead of 125.
101
102
Sand Bed Region Conclusions
• Corrosion on the outside of the drywell shell in the sand bed region has been arrested
• The coating shows no degradation• There is sufficient margin to the minimum
thickness requirement (maintain 64 mils margin above code required average thickness of 736 mils)
103
Future Inspections in the Sand Bed Region
• Visual inspection of exterior coating in three bays every other outage, inspecting all 10 bays once every 10 years
• UT measurements at 19 grid locations at elev. 11’3” in 2010, then every 10 years thereafter
• Repeat UT at 106 locally thinned locations from the exterior in 2008 outage– In future outages, perform UT in 2 bays every outage
104
Embedded Portions of the Drywell Shell
105
Embedded Shell Conclusions• Corrosion on the embedded surfaces of the
drywell shell, both interior and exterior, is not significant– The environment of embedded steel in concrete
prevents significant corrosion• Estimated at <1 mil / year• Drywell shell meets design basis
requirements, with margin to 2029
106
107
108
109
110
Embedded Shell – Exterior Surface
• Any corrosion of the drywell exterior embedded surface occurred because of water leakage into the sand bed region
• Corrective actions for the sand bed region arrested corrosion of the drywell exterior embedded shell– Water leakage into the sand bed region was prevented– The joint between the drywell shell and floor of the sand bed
region was sealed to prevent water from contacting the exterior shell
111
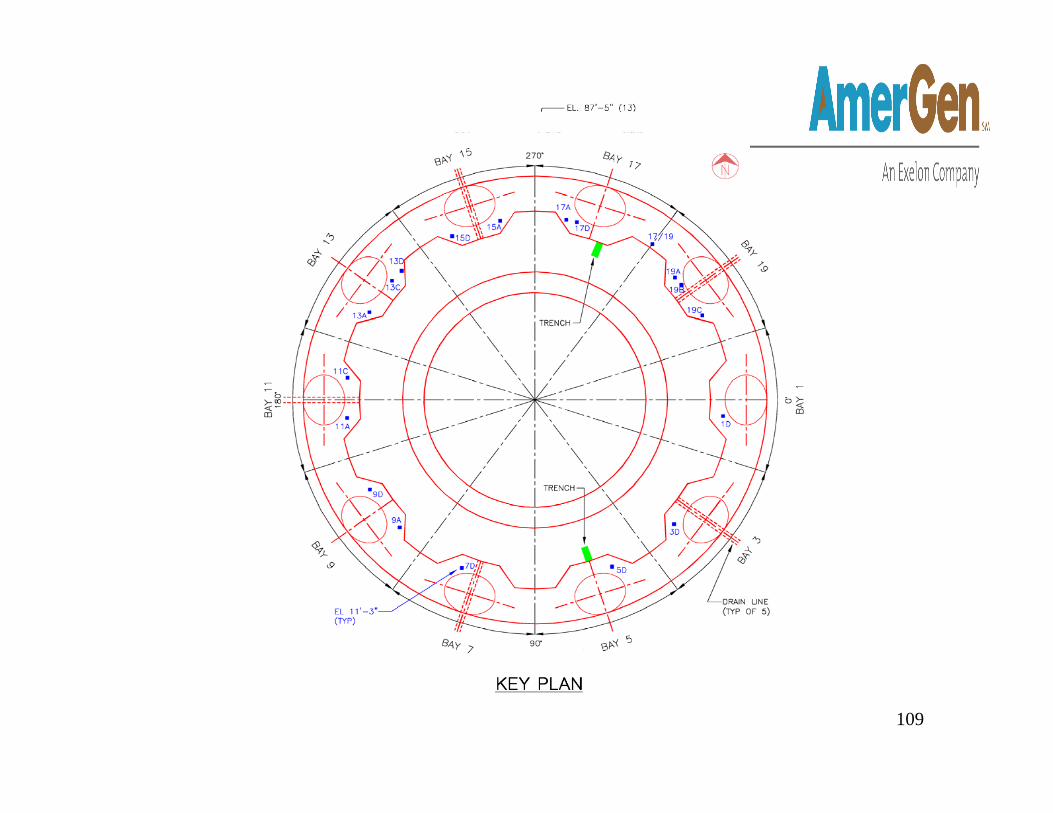
Embedded Shell – Interior Surface
• Water that was identified in the trenches in bays 5 and 17 inside the drywell when the foam filling was removed during the 2006 refueling outage was determined to have originated from equipment leakage inside the drywell (Not from external sources)
112
Embedded Shell - Interior Surface
• Investigations into the source of the water indicate that there could have been water below the drywell interior floor for an extended period
• Additional concrete was removed from the bottom of the bay 5 trench to expose 6 inches of drywell shell that was embedded on both sides for UT thickness measurements of the drywell shell
113
Embedded Shell – Interior Surface
• Corrective actions during the 2006 refueling outage included– Caulking the joint between the drywell
interior floor and the drywell shell– Repairs to the collection trough in the sub-
pile room
114
Corrosion of Steel Embedded in Concrete
Barry GordonStructural Integrity Associates, Inc.
115
Corrosion of SteelEmbedded in Concrete
• Drywell shell was constructed first, followed by pouring of concrete both on the inside and the outside of the shell
• The high pH (e.g., 12.5 to 14) environment created during hydration of the cement in the concrete results in the formation of a passive, protective film [Fe(OH)2 + Ca(OH)2] on the carbon steel surface that mitigates corrosion in the absence of an aggressive environment
116
Exterior Embedded Steel Environment
• The reactor cavity water that flowed into the embedded region outside the drywell was affected by the sand bed
• However, the chemistry of the water leachate from moist sand from the sand bed region was measured in 1986 revealed high purity water:– pH >7, <0.045 ppm Cl- <0.032 ppm SO4
=
(US Water: 59 ppm Cl-, 81 ppm SO4=)
– This water is not aggressive to the embedded steel in concrete per GALL/EPRI
117
Exterior Embedded Steel Environment
• The water in the embedded region would have been the same quality as in the sand bed region, except the pH would have been greater because of the interaction with high pH concrete pore water
• Per GALL NUREG-1801 Vol. 2, Rev.1 and EPRI 1002950, no aging effects are expected since pH>5.5, <500 ppm Cl- and <1500 ppm SO4
=
(GALL II.B1.2-2, II.B1.2-8)
118
Interior Embedded Steel Environment
• Chemistry of the drywell Trench #5 water (from equipment leakage) shows high pH, low Cl-, low SO4
= and high Ca:– pH 8.4 to 10.2 (despite CO2) (> GALL/EPRI limit)– Cl-: 13.6 – 14.6 ppm (<< 500 ppm GALL/EPRI limit)– SO4
=: 228 - 230 ppm (<<1500 ppm GALL/EPRI limit)– Ca: 83.5 – 96.6 ppm (No GALL/EPRI limit)
• Water is characterized as good quality “concrete pore water” that mitigates steel corrosion
• Trench #5 water complies with GALL/EPRI embedded steel guidelines
119
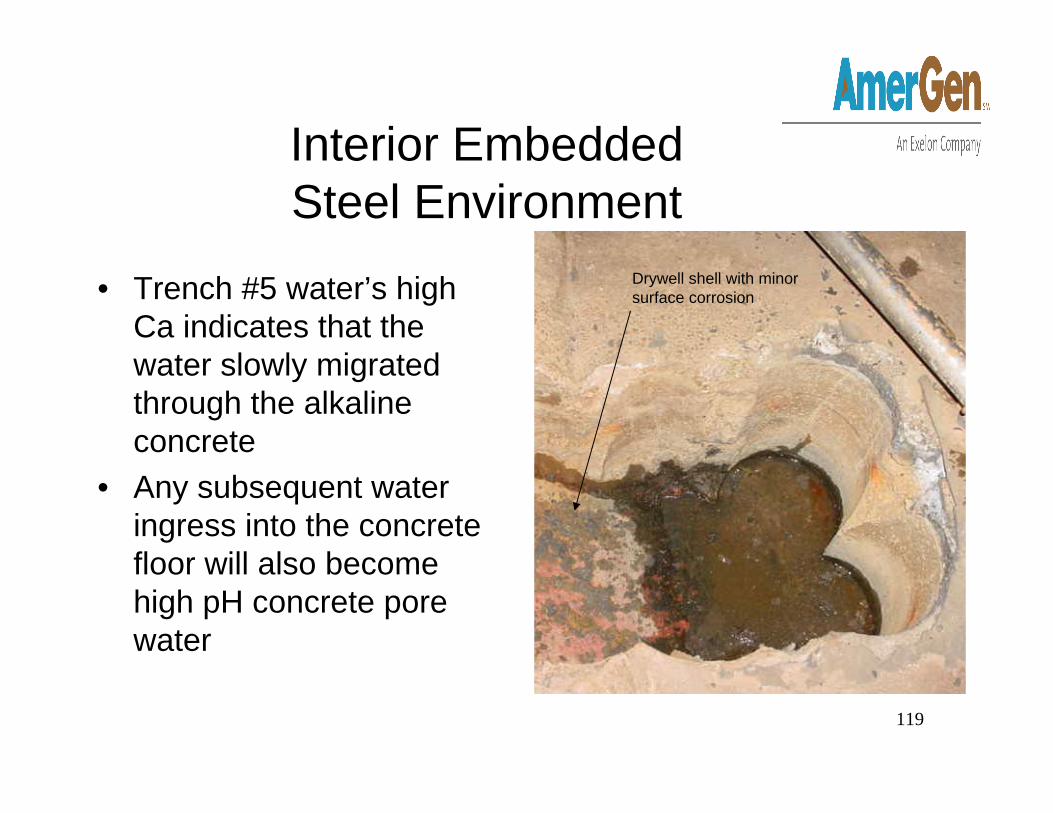
Interior Embedded Steel Environment
• Trench #5 water’s high Ca indicates that the water slowly migrated through the alkaline concrete
• Any subsequent water ingress into the concrete floor will also become high pH concrete pore water
Drywell shell with minor surface corrosion
120
Interior Embedded Steel Environment
• Corrosion of the steel shell not wetted by high pH concrete pore water is mitigated by subsequent inerting of the drywell during operation
• Any possible subsequent steel corrosion could occur only during brief outages when fresh oxygenated water can contact with the shell
• Finally, transport of any oxygenated water through the concrete to the steel is slow, will increase in pH and must displace oxygen depleted water before any possible corrosion can occur
121
2006 Outage InspectionsEmbedded Shell
• Visual inspection of the surface in the trenches showed minor corrosion which was easily removed with no visible loss of material or degradation of the surface
122
2006 Outage InspectionsEmbedded Shell
• UT measurements in the trenches measure total corrosion on the inside and outside between 1986 and 2006– Corrosion was occurring on the exterior surface
that was not embedded until 1992 when sand was removed
– Material loss was consistent with the corrosion rates on the outside of the drywell before the sand was removed
123
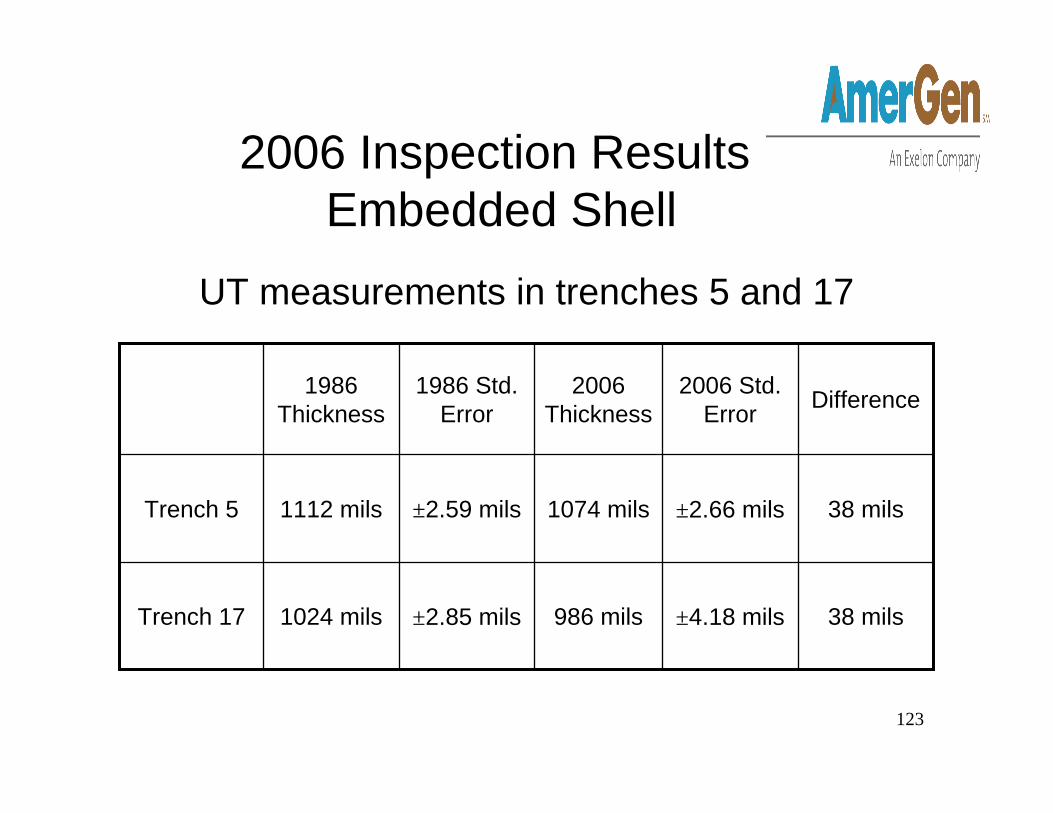
2006 Inspection ResultsEmbedded Shell
UT measurements in trenches 5 and 17
38 mils±4.18 mils986 mils±2.85 mils1024 milsTrench 17
38 mils±2.66 mils1074 mils±2.59 mils1112 milsTrench 5
Difference2006 Std. Error
2006 Thickness
1986 Std. Error
1986 Thickness
124
2006 Inspection ResultsEmbedded Shell
• UT measurements of the 6 inch surface excavated in the bottom of the trench in bay 5 were performed to determine total corrosion, both interior and exterior
• Measured thickness is 1113 mils, as compared to a nominal of 1154 mils– A change of 41 mils, approximately 1 mil/yr

125
2006 Outage InspectionsEmbedded Shell
• The 106 individual UT measurements made from the exterior of the sand bed region are a baseline for monitoring corrosion of the interior embedded surface of the drywell in future outages
126
2006 Inspection ResultsEmbedded Shell
• The joint sealant between the sand bed floor and the exterior drywell shell was inspected and found to be in good condition
• No water was identified in the sand bed region in any of the 10 bays
127
Embedded Shell Conclusions
• Corrosion on the embedded surfaces of the drywell shell, both interior and exterior, is not significant– The environment of embedded steel in concrete
prevents significant corrosion• Estimated at <1 mil / year• Drywell shell meets code thickness
requirements, with margin to 2029
128
Future Inspections on the Embedded Shell
• Repeat UT measurements in both trenches, including the newly excavated 6 inches in 2008– If results indicate no significant changes, then fill the
trenches with concrete and restore the curb to original configuration
• Repeat UT measurements at 106 external points in 2008– Perform external UT measurements in 2 bays every refuel
outage starting in 2010– All bays will be inspected every 10 years
129
Upper Drywell Shell
130
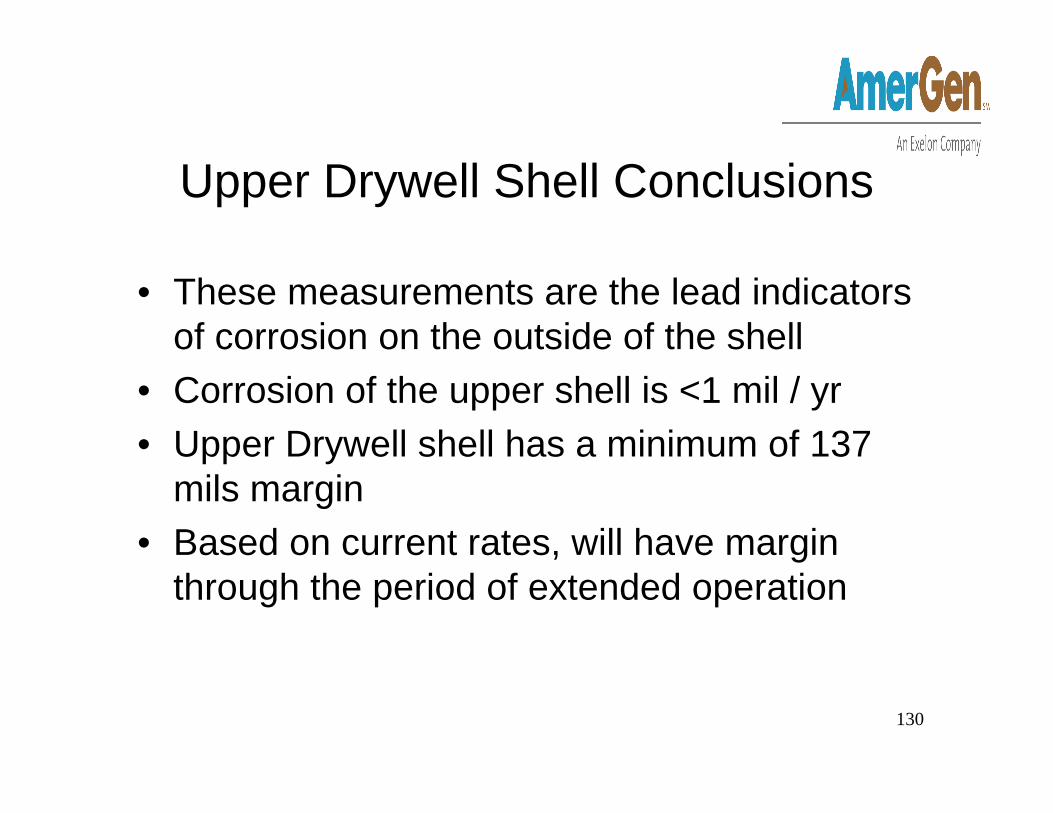
Upper Drywell Shell Conclusions
• These measurements are the lead indicators of corrosion on the outside of the shell
• Corrosion of the upper shell is <1 mil / yr• Upper Drywell shell has a minimum of 137
mils margin• Based on current rates, will have margin
through the period of extended operation
131
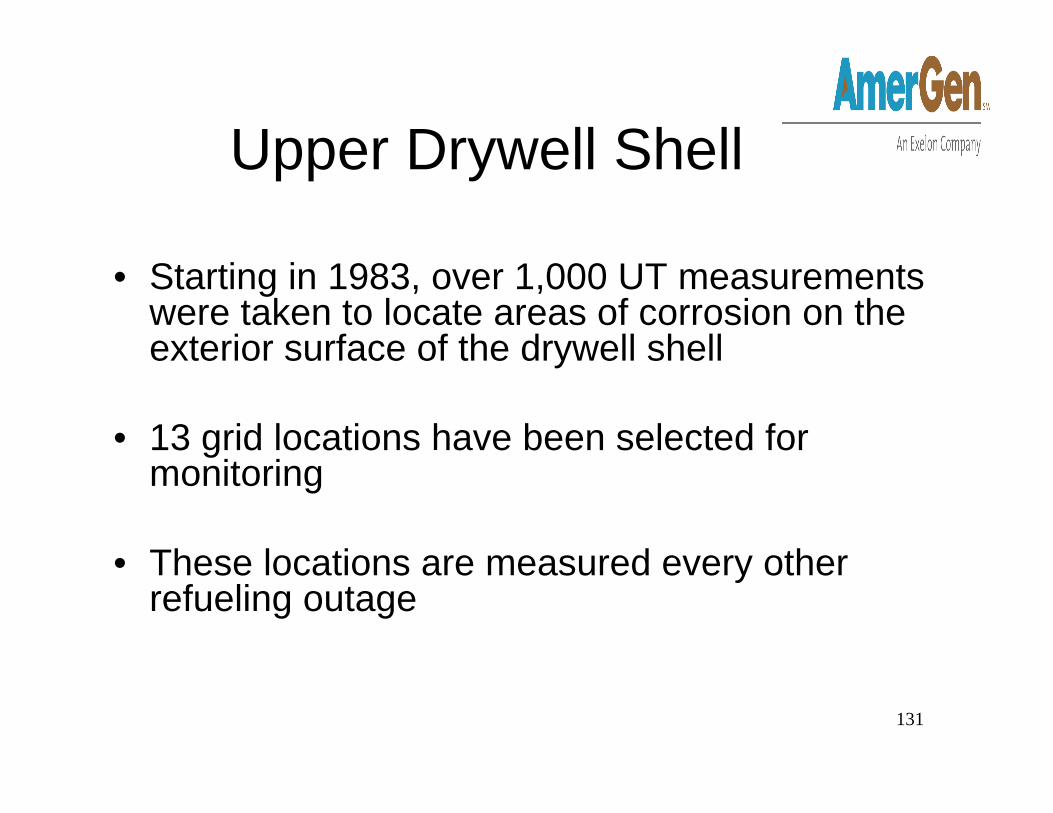
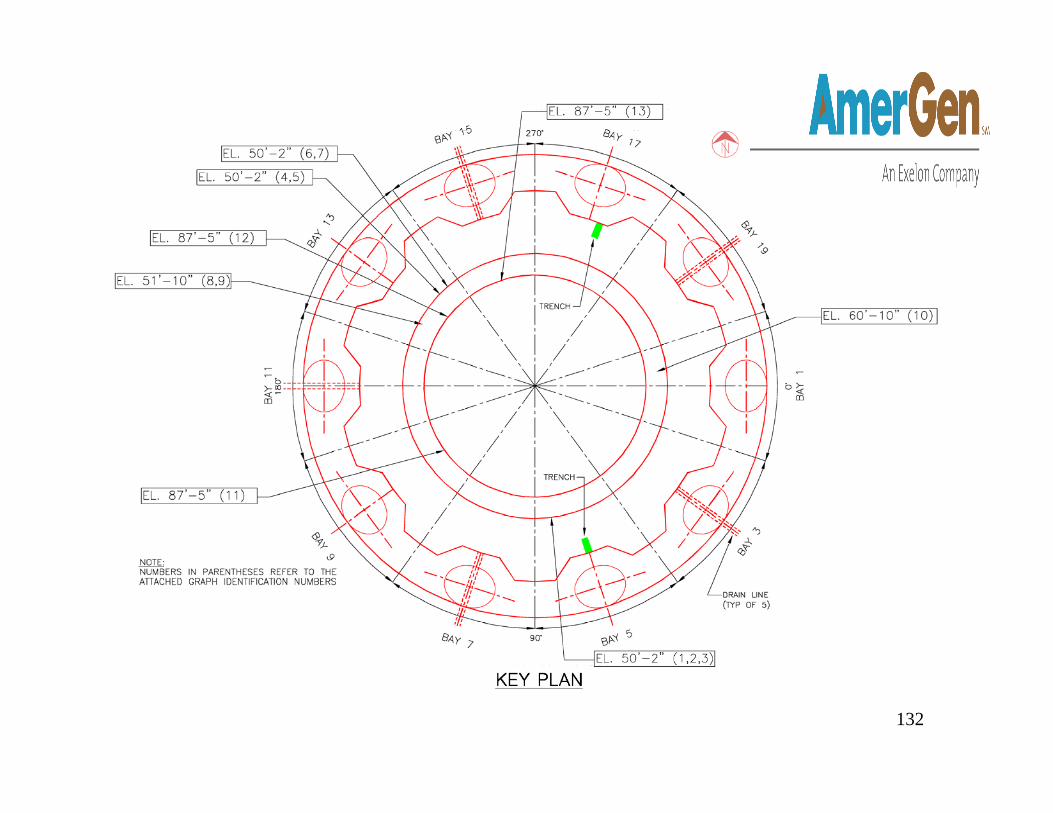
Upper Drywell Shell
• Starting in 1983, over 1,000 UT measurements were taken to locate areas of corrosion on the exterior surface of the drywell shell
• 13 grid locations have been selected for monitoring
• These locations are measured every other refueling outage
132

133
Upper Drywell UT Measurements
720 749727729724728
726724
726729725
726728
Bay 15-23L
757758760758767763
762762765
758764
Bay 15-23H
No Observable Ongoing Corrosion678693682690683
685688
689678688
687684
Bay 13-31L
No Observable Ongoing Corrosion762758762766759
765763
760758765
762779
Bay 13-31H
No Observable Ongoing Corrosion705701706705702
703702
703705706
706703
Bay 5-5L
No Observable Ongoing Corrosion760756754757754
759759
755758760
761761
Bay 5-5H
No Observable Ongoing Corrosion
747743741748741747747
742745748
743745746
Bay 5-D12
50’ 2”
541Elevation
mils2006200420001996199419933199219911990198919881987mils
Projected Thickness in
2029
Minimum Required Thickness
LocationMonitored Elevation
Average Measured Thickness 1,2 mils

134
Upper Drywell UT Measurements
No Observable Ongoing Corrosion
633630628632633631630
628627
642638636636
638Bay 15-31
No Observable Ongoing Corrosion
642640635636640641637
635629
643645641642
643Bay 13-28
No Observable Ongoing Corrosion
617612604613613629614
614612
620619622620
619452Bay 9-20Elevation87’ 5”
No Observable Ongoing Corrosion
691693689693711693518Bay 1-
50-22Elevation 60’ 10”
No Observable Ongoing Corrosion
685687679684680683676
683683682
686Bay 13-32L
No Observable Ongoing Corrosion
715713715715714717717
715715720
716Bay 13-32H
51’ 10”
518Elevation
mils2006200420001996199419933199219911990198919881987mils5
Projected Thickness in
2029
Minimum Required Thickness
LocationMonitored Elevation
Average Measured Thickness 1,2 mils
Notes:
1. The average thickness is based on 49 Ultrasonic Testing (UT) measurements performed at each location.
2. Multiple inspections were performed in the years 1988, 1990, 1991, and 1992.
3. The 1993 elevation 60’ 10” Bay 5-22 inspections was performed on January 6, 1993. All other locations were inspected in December 1992.

135
Upper Drywell Shell 2006 Inspection Results
• 12 of the 13 locations show no statistically observable corrosion
• The location with the minimum margin (137 mils) has no ongoing corrosion
• 1 location shows a corrosion rate of 0.66 mils/year– Projected thickness in 2029 is 720 mils, compared to a
minimum required thickness of 541 mils
136
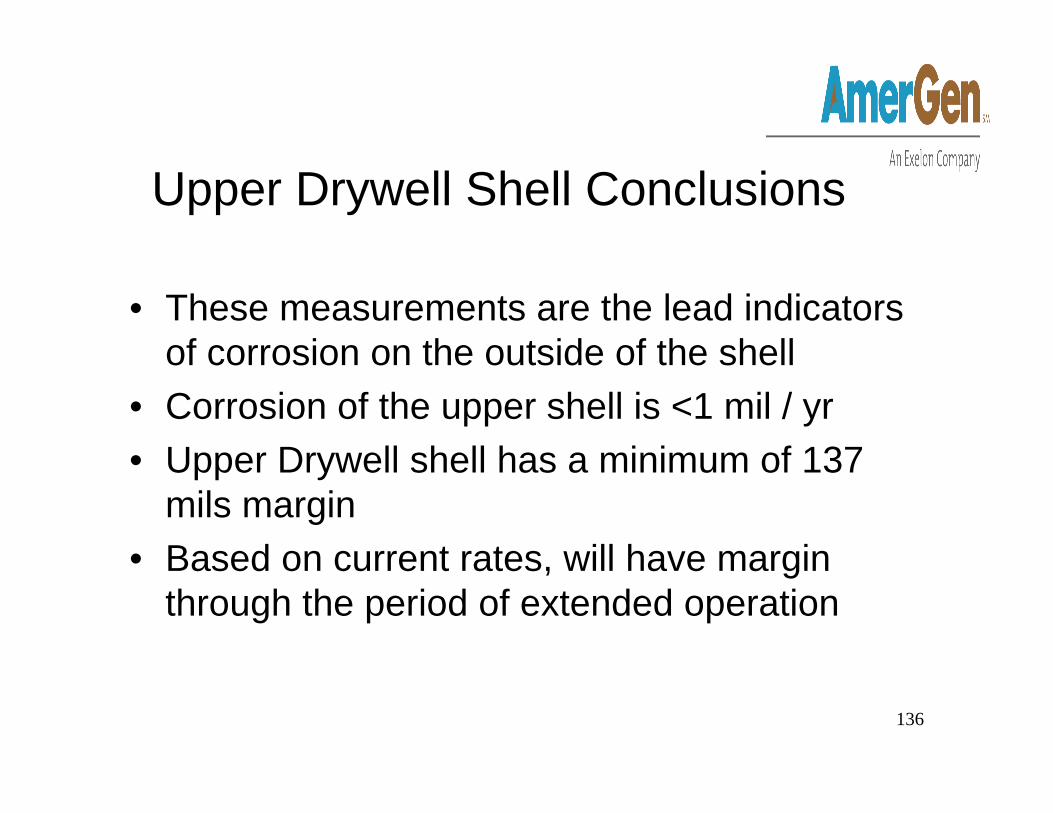
Upper Drywell Shell Conclusions
• These measurements are the lead indicators of corrosion on the outside of the shell
• Corrosion of the upper shell is <1 mil / yr• Upper Drywell shell has a minimum of 137
mils margin• Based on current rates, will have margin
through the period of extended operation
137
Overall Conclusions
• The corrective actions to mitigate drywell shell corrosion have been effective
• The drywell shell corrosion has been arrested in the sand bed region and continues to be very low in the upper drywell elevations
• The corrosion on the embedded portion of the drywell shell is not significant
• The drywell shell meets code safety margins• We have an effective aging management program to
ensure continued safe operation