Embed Size (px)
Citation preview
Department of Chemical and Biological Engineering
Inorganic Environmental Chemistry
CHALMERS UNIVERSITY OF TECHNOLOGY
Gothenburg, 2012
Oxidation behavior of
selected FeCr alloys
in environments
relevant for solid
oxide electrolysis
applications
Master thesis performed at Chalmers High Temperature Corrosion
Center
Patrik Alnegren
II
Oxidation behavior of selected FeCr alloys in environments relevant for solid oxide electrolysis
applications
Master of Science Thesis in Chemical Engineering
30 credit points
Patrik Alnegren
2012
CHALMERS UNIVERSITY OF TECHNOLOGY
Supervisor: Jan Froitzheim
Examiner: Jan-Erik Svensson

III
Abstract If society is to move towards using more renewable energy sources the power fluctuations of e.g. wind
and solar energy need to be balanced. Energy storage by production of hydrogen from solid oxide
electrolysis cells (SOEC) offers a solution to overcome these obstacles. However, the performance of
current SOECs decreases too fast for the technology to be commercialized. This drop in performance
over time is partly due to the degradation of metallic interconnects (bipolar plates) within the cell
stacks. This study investigates the corrosion performance of selected ferritic steels in simulated SOEC
environments. Ferritic steels have many properties that are desirable for interconnects but suffer from
oxidation and chromium evaporation over time. Four different FeCr alloys have been exposed in
different partial pressures of dry O2 (anode side) and in 34% H2O -3% H2-Ar (cathode side) at 850°C
and gravimetrical measurements have been performed to study oxidation rates. Chromium evaporation
has been measured and compared for the oxygen containing environments. Chromium evaporation
was found to vary largely with oxygen partial pressure, while the oxidation rate of the steels did not
vary substantially in the different oxygen partial pressures. Differences in oxidation behavior of the
steels were observed between the exposures in different partial pressures of dry O2 and in 34% H2O -
3% H2 -Ar. Both reduced and increased oxidation rates were observed in the steam with hydrogen
environment compared to the oxygen environments for different materials.
Keywords: Solid oxide electrolysis cell, SOEC, SOFC, degradation, high temperature corrosion,
chromium evaporation, denuder technique
IV
Table of contents Abstract ................................................................................................................................................. III
Table of contents ................................................................................................................................... IV
1 Introduction ..................................................................................................................................... 1
1.1. Aim .......................................................................................................................................... 2
2 Theory ............................................................................................................................................. 2
2.1 Electrolysis cells ...................................................................................................................... 2
2.2 SOC ......................................................................................................................................... 4
2.3 Corrosion ................................................................................................................................. 6
2.3.1 Thermodynamics ............................................................................................................. 6
2.4 Scale formation and growth..................................................................................................... 8
2.4.2 Kinetics .......................................................................................................................... 13
2.5 Chromium evaporation .......................................................................................................... 15
2.6 Interconnect design ................................................................................................................ 16
2.6.1 Ferritic stainless steel interconnects .............................................................................. 17
2.6.2 Alloying elements in ferritic stainless steel interconnects ............................................. 19
2.7 Degradation of SOEC ............................................................................................................ 20
3 Experimental ................................................................................................................................. 21
3.1 Material ................................................................................................................................. 21
3.2 Exposures .............................................................................................................................. 21
3.2.1 Oxygen side exposures (gravimetric) ............................................................................ 21
3.2.2 Fuel side exposures (gravimetric) ................................................................................. 22
3.2.3 Chromium evaporation .................................................................................................. 23
3.3 Analysis ................................................................................................................................. 24
3.3.1 Calibration of spectrophotometer .................................................................................. 24
4 Results ........................................................................................................................................... 26
4.1 Gravimetrical investigations .................................................................................................. 26
4.2 Morphology and microstructure ............................................................................................ 33
4.3 Chromium-evaporation ......................................................................................................... 39
5 Discussion ..................................................................................................................................... 40
5.1 AL 441 HP............................................................................................................................. 40
5.2 E-brite .................................................................................................................................... 41
5.3 Crofer 22H ............................................................................................................................. 42
5.4 Sanergy HT............................................................................................................................ 43

V
5.5 Oxygen pressure dependence ................................................................................................ 45
5.5.1 Oxidation ....................................................................................................................... 45
5.5.2 Chromium evaporation .................................................................................................. 46
5.6 Estimated steel life time ........................................................................................................ 48
6 Conclusions ................................................................................................................................... 49
6.1 Restrictions ............................................................................................................................ 50
6.2 Suggestions for future work .................................................................................................. 50
7 References ..................................................................................................................................... 50
1
1 Introduction Global warming due to increased atmospheric carbon dioxide from fossil fuel combustion is a
commonly accepted fact. Adding the diminishing supply of oil and the increasing oil price there
are both economic and environmental incentives towards alternative energy sources and energy
carriers. One major issue in achieving sustainable energy production is the substantial
fluctuation of many renewable energy sources, such as wind, wave and solar power, which
makes balancing grid load difficult. To use hydrogen as energy storage and energy carrier offers
great possibilities for society to move towards a carbon free economy, but in order to be able to
realize a hydrogen infrastructure cheap and efficient hydrogen production is necessary.
Hydrogen is currently almost exclusively produced from hydrocarbons, of which most of them
come from fossil fuels [1]. Electrochemical production of hydrogen works by splitting water
into hydrogen and oxygen gas. Powered by renewable energy sources, these electrochemical
processes offers means of cleaner production of hydrogen compared to traditional fossil fuel
reforming. Commercially available electrochemical methods, such as alkaline water electrolysis
and proton exchange membranes, operate at temperatures below 100°C. In recent years solid
oxide electrolysis cells (SOEC) have gained increased attention. These cells are operated at high
temperatures (>600°C) and offer many advantages over conventional electrolysis, such as
reduced required electrical power [2] and increased hydrogen production density [3]. Another
powerful advantage of SOEC technology is that because of the high operating temperature CO2
can be electrolyzed to CO[4] and even co-electrolysis of hydrogen to produce syngas [5][6]is
possible. This offers the possibility for fossil fuel independent production of hydrocarbons if the
electrolysis is powered by e.g. wind power. Most SOECs rely on basically the same technology
as solid oxide fuel cells (SOFC), which commonly uses yttria stabilized zirconia (YSZ) as
oxygen ion conducting electrolyte. Indeed several studies have included cell stacks operating
successfully in both SOEC and SOFC mode [7][8][9][10]. The use of SOEC in combination
with SOFC technology offers great potential to balance power fluctuations from renewable
energy sources by using hydrogen as energy storage.
The high degree of similarity between SOFC and SOEC technology has enabled SOEC
development to achieve substantial success in short time since many technical issues have
already been addressed in SOFC related research. The same is true for the choice of
interconnect materials for SOEC which relies basically on studies carried out in the SOFC
context. The role of the interconnect component in SOEC and SOFC units is to electrically
connect individual cells in series to form a multi-cell stack with higher power density. Ferritic
stainless steels have many desirable properties for use in solid oxide cell stacks and are the most
common type of materials used as interconnect.
Degradation of stack performance over time is an issue that needs to be solved before SOEC can
be a competitive technology for commercial electrolysis. Due to the high efficiency of existing
water electrolysis technology (and even more so for SOEC) the two main factors that should
affect hydrogen cost are electricity price and durability of the electrolyzer system according to a
study by John A. Turner [11]. Known degradation phenomena can be partly linked to the
degradation of metallic interconnects. Known issues with steel interconnects are increased
contact resistance due to oxide scale growth and evaporation of chromium species and
consequent poisoning of the cathode in SOFCs [12].
2
More than a decade of research has led to substantial progress in the development of ferritic
steel interconnects for SOFC, but little research has been done to evaluate these interconnects in
SOEC applications. It is expected that due to the high degree of optimization achieved in SOFC
steel development a change in environment leads to different priorities regarding materials
optimization. Hence this study focuses on degradation phenomena of ferritic steel interconnects
in SOEC relevant environments, where the major difference lies on the oxygen side where the
oxygen partial pressure is higher and the atmosphere drier for SOEC.
1.1. Aim The aim of this thesis is to test the degradation performance of different commercial steels
under simulated SOEC environments. The work is focused on oxidation behavior and
evaporation of volatile chromium species, both phenomena closely linked to cell stack
degradation. The aim is not to do in-depth studies of oxidation mechanisms, but to do a more
widespread research in the relatively new field that is SOEC. By doing this, the hope is to
discover which the differences and similarities between the degradation behavior of ferritic
steels in electrolysis environments compared to fuel cell environments are, to see what can be
linked to knowledge achieved in the more studied field of SOFC. Future commercial SOEC
stacks may be run at pressures well above atmospheric, which could lead to faster degradation
of ferritic steel interconnects. Hence, this study will have substantial focus on finding
correlations between degradation behavior and oxygen partial pressure.
2 Theory
2.1 Electrolysis cells In chemistry, electrolysis is the process of driving a nonspontaneous chemical reaction by using
applied direct current [13], thus converting electrical energy into chemical energy. Just as with
galvanic reactions the resulting voltage potential needed to drive an electrolysis reaction can be
derived from the Nernst equation (2.1) and standard potentials from the electrochemical series.
(1)
where E is the cell potential, E° the standard cell potential, R the gas constant, T the
temperature, n the stoichiometric coefficient of transferred electrons, F the Faraday’s constant
and Q the reaction quotient for the cell reaction. Electrolysis reactions differ from spontaneous
galvanic reactions in that an external electric power source is needed to drive the reaction [13].
Equation (1) gives the theoretic thermodynamic value for the required potential to drive a
reaction, however in reality a larger potential is needed. The additional potential is called
overpotential which is due to electrochemical kinetics at the electrode surface. The overpotential
is needed to overcome activation energy barriers for electron transfer in the half-cell reactions at
the anode and cathode interfaces [14] and is affected by e.g. type of electrodes and temperature.
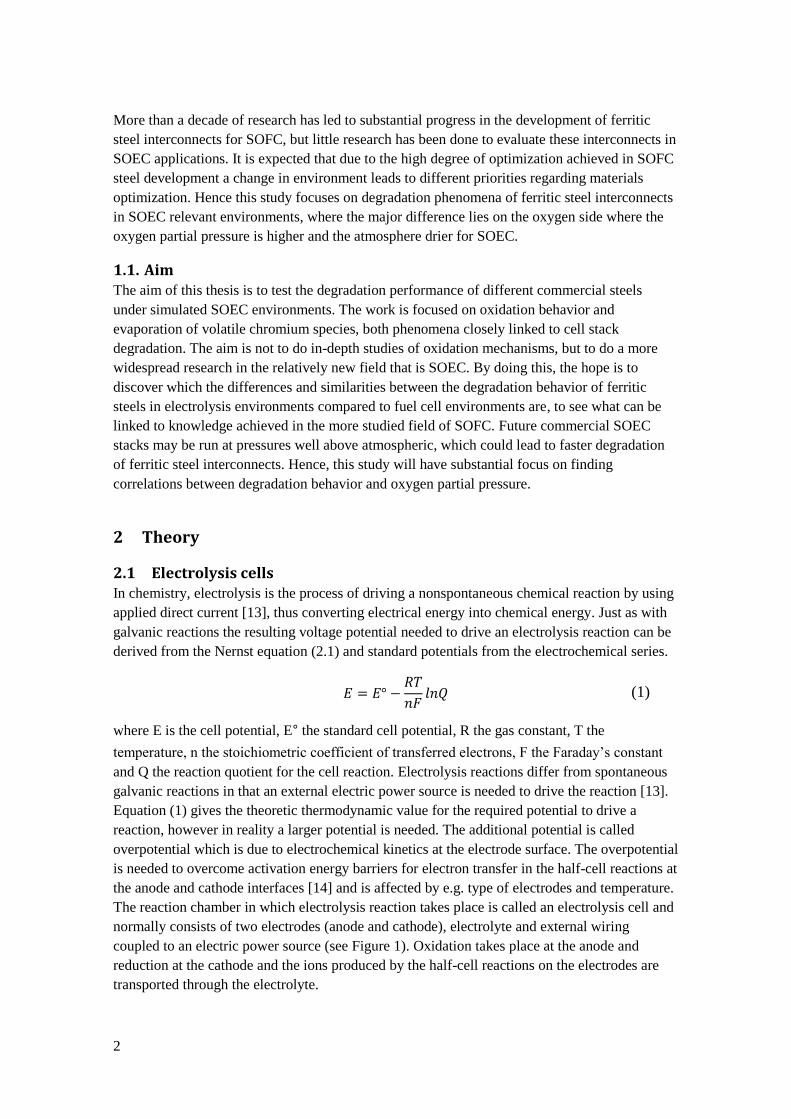
The reaction chamber in which electrolysis reaction takes place is called an electrolysis cell and
normally consists of two electrodes (anode and cathode), electrolyte and external wiring
coupled to an electric power source (see Figure 1). Oxidation takes place at the anode and
reduction at the cathode and the ions produced by the half-cell reactions on the electrodes are
transported through the electrolyte.
3
Figure 1. A schematic illustration of a so called Hoffman cell [15]. This is a type of electrolysis cell that
is can be used for electrolyzing water into hydrogen and oxygen gas.
Hydrogen is a most promising future energy carrier and can be produced by simple electrolysis
of water. The theoretical potential required to drive water electrolysis under standard conditions
(1 atm, 25°C) is 1.23V, but in reality a quite substantial overpotential is needed. There are
several types of electrolysis cell technologies available, operating at different temperatures and
pressures. In the low temperature range alkaline water electrolysis and permeable electrolyte
membrane (PEM) electrolysis cells are two common and well established techniques [2]. Solid
oxide electrolysis cells (SOEC) operate at temperatures of 600°C and above and are often
referred to as high temperature steam electrolysers (HTE).
The theoretical potential, or Nernst potential, needed for an electrolysis reaction is a function of
temperature. The total energy demand (or gain) for a chemical reaction is given by (2)
(2)
where H is the enthalpy, G is Gibbs energy and S is entropy. Gibbs energy is related to
electrical energy, or cell potential, by (3), which is the relation that allows for deriving the
Nernst equation (1). [16]
(3)
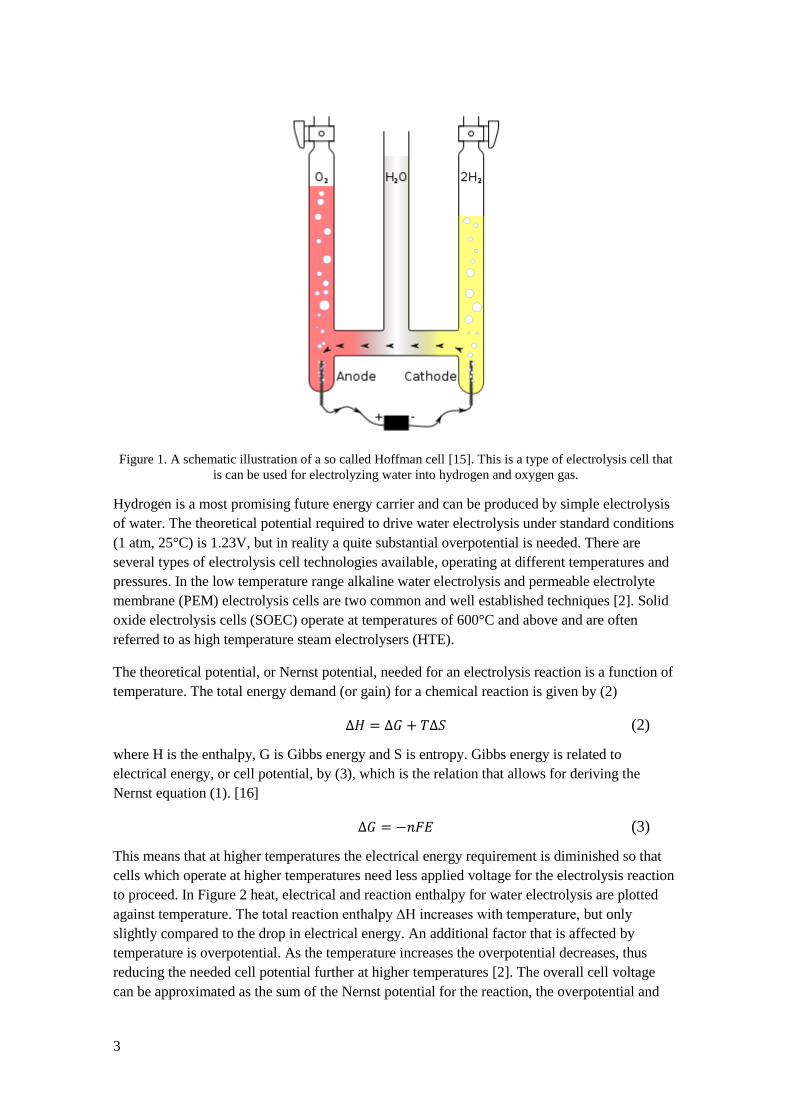
This means that at higher temperatures the electrical energy requirement is diminished so that
cells which operate at higher temperatures need less applied voltage for the electrolysis reaction
to proceed. In Figure 2 heat, electrical and reaction enthalpy for water electrolysis are plotted
against temperature. The total reaction enthalpy ∆H increases with temperature, but only
slightly compared to the drop in electrical energy. An additional factor that is affected by
temperature is overpotential. As the temperature increases the overpotential decreases, thus
reducing the needed cell potential further at higher temperatures [2]. The overall cell voltage
can be approximated as the sum of the Nernst potential for the reaction, the overpotential and
4
the ohmic resistance over the cell [17]. The theoretical cell potential for an electrolysis reaction
will be converted into chemical energy, but the inevitable additional electrical energy will be
converted into heat. Cells that operate at higher temperatures will use this generated heat for the
splitting of water, thus utilizing more of the input energy and increasing the efficiency. A term
commonly used in electrolysis contexts is the thermoneutral potential. This basically means the
potential at which the generated heat is equal to the heat consumed by the electrolysis reaction
[2]. When operating below the thermoneutral potential heat needs to be supplied (endothermic
operation) and when operating above heat needs to be removed, or cooled off, in order to
maintain the desired working temperature (exothermic operation). Assuming that there are no
short-circuits in a cell the production rate of hydrogen will have a linear dependency on the
electrical current through the cell [13]. The electrical current can, according to Ohm’s law, be
adjusted by the applied potential.
Figure 2. Calculated total energy demand ∆H, electrical energy demand ∆G and thermal energy demand
T∆S for steam electrolysis are plotted against temperature [18].
2.2 SOC Solid oxide cells (SOC) can be used to electrolyze steam into hydrogen and oxygen (SOEC
mode). This reaction requires input of electrical energy e.g. from wind turbines or nuclear
power plants. SOC can also be used reversibly as solid oxide fuel cells (SOFC mode),
harnessing the reaction energy from hydrogen being oxidized to water and converting it to
electrical energy [2]. In fact current SOEC technology has been able to progress rapidly by
benefiting on development of SOC for fuel cell operation.
Solid oxide refers to the ion conducting electrolyte material which is a solid ceramic material,
commonly made of yttria stabilized zirconia, or in short YSZ. Temperatures of 600-1000°C are
needed in order to increase the diffusivity and overcome activation energy in the ceramic
electrolyte material and achieve sufficient conductivity for oxygen ions [19]. A schematic
picture of a two cell SOEC electrolyzing steam is presented in Figure 3. Vaporized water is fed
into the cathode electrode where it gets dissociated into hydrogen and oxygen ions. The
hydrogen gas is collected at the cathode outlet, but needs to be separated from residual steam.
The applied potential over the cell drives the transport of oxygen ions through the electrolyte.
5
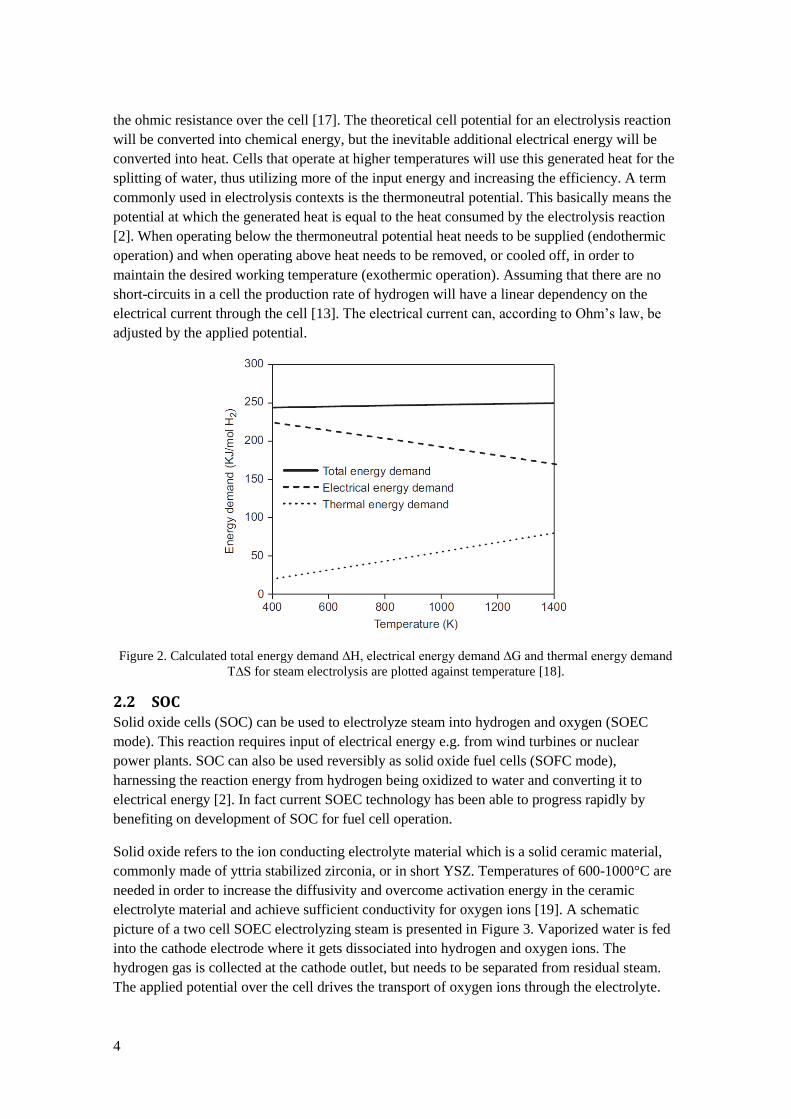
At the anode electrolyte interface the oxygen ions are oxidized to oxygen gas which is passed
through the anode outlet, which can be assisted by using air as a sweeping gas. The
electrochemical reactions where the electron transfer occurs are believed to take place at the
gas- electrode-electrolyte interfaces. These junctions, where the electrodes meet the electrolyte,
are called triple phase boundaries [2][18].
Figure 3. Schematic picture of two solid oxide electrolysis cells coupled in series. The same reactions are
occurring in both cells. An applied potential drives the splitting of water molecules into hydrogen and
oxygen.
In order to get more power density SOC are coupled in series to form cell stacks. There are two
main types of designs for SOC units: tubular and planar stacks. The latter is the design
presented in Figure 3, with the electrolyte sandwiched between the electrodes and corrugated
interconnects that allows for gas to flow to the electrodes. Tubular SOC usually have their cell
components, i.e. anode, cathode and electrolyte, deposited onto a porous ceramic support tube
which is permeable to gas [19]. The anode and cathode gases flow through each side of the tube
diameter. This report will focus on the planar design where interconnecting plates are used.
Planar cell stacks as compared to tubular stacks offers advantages of cheaper production and
higher power density and is nowadays the stack design most commonly used for both SOFC and
SOEC [2][20][19].
In planar design SOC stacks, the cells are separated by electronically conducting
interconnecting plates. These interconnects distribute the current to the cells and separate
cathode and anode gases from each other. The gas tightness of the interconnect is crucial since
the products of the electrodes would otherwise react with each other to form water again, thus
rendering the electrolysis useless. High electronic conductivity is necessary to keep the ohmic
losses over the stack low and to keep the efficiency of the stack high. The material choices for
the interconnects in SOC are perovskite-type ceramics based on rare earth chromites, such as
lanthanum chromite, or metallic alloys [19]. As development of SOC has lead to decreased
operating temperatures metallic interconnects have become more common. More information
regarding interconnects will be provided in section 2.6.
The cathode, where the fuel or hydrogen is generated, is most commonly made up of a porous
mix of metallic nickel and electrolyte material (commonly YSZ) [2]. The mix ensures good
6
adhesion to the electrolyte and matching of thermal expansion coefficient [19]. Nickel is chosen
due its catalytic properties and is especially important when SOFC stacks are fed with syngas
since it catalyses the reformation of methane into hydrogen and carbon monoxide. The oxygen
electrode, or anode, is normally made up of a lanthanum strontium manganite (LSM) and YSZ
composite [2]. The electrodes should have high catalytic properties to increase the reaction
kinetics and thus lowering the polarization resistance of the cell.
The change in volume of solids with temperature can be compared by their coefficient of
thermal expansion (CTE). It is crucial for a planar cell stack to have reasonably matching CTE’s
of all its components: electrodes, electrolyte and interconnects. If this is not the case, cracks due
to internal stresses will occur during thermal cycling of the stack (turning on and off). This is
part of the reason why electrolyte material is commonly mixed in with electrode material. By
doing this an electrode-electrolyte gradient is created which increases the tolerance to thermal
cycling due to the resulting gradient of thermal expansion properties.
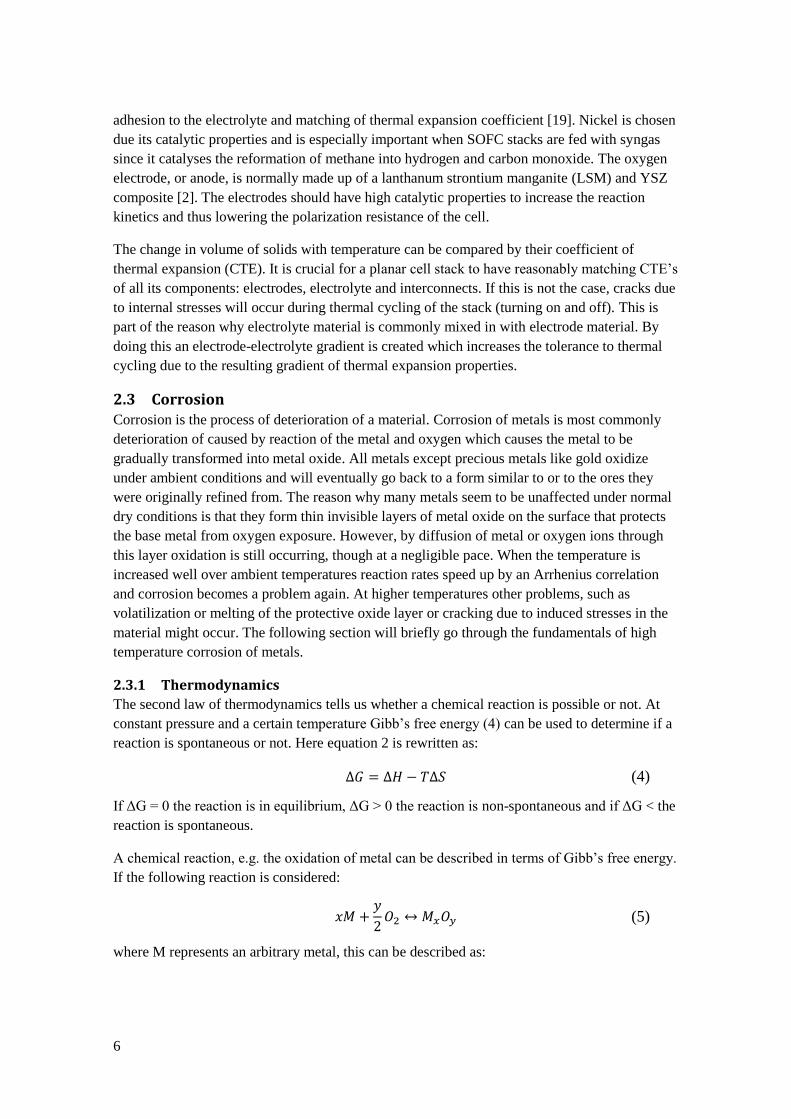
2.3 Corrosion Corrosion is the process of deterioration of a material. Corrosion of metals is most commonly
deterioration of caused by reaction of the metal and oxygen which causes the metal to be
gradually transformed into metal oxide. All metals except precious metals like gold oxidize
under ambient conditions and will eventually go back to a form similar to or to the ores they
were originally refined from. The reason why many metals seem to be unaffected under normal
dry conditions is that they form thin invisible layers of metal oxide on the surface that protects
the base metal from oxygen exposure. However, by diffusion of metal or oxygen ions through
this layer oxidation is still occurring, though at a negligible pace. When the temperature is
increased well over ambient temperatures reaction rates speed up by an Arrhenius correlation
and corrosion becomes a problem again. At higher temperatures other problems, such as
volatilization or melting of the protective oxide layer or cracking due to induced stresses in the
material might occur. The following section will briefly go through the fundamentals of high
temperature corrosion of metals.
2.3.1 Thermodynamics
The second law of thermodynamics tells us whether a chemical reaction is possible or not. At
constant pressure and a certain temperature Gibb’s free energy (4) can be used to determine if a
reaction is spontaneous or not. Here equation 2 is rewritten as:
(4)
If ΔG = 0 the reaction is in equilibrium, ΔG > 0 the reaction is non-spontaneous and if ΔG < the
reaction is spontaneous.
A chemical reaction, e.g. the oxidation of metal can be described in terms of Gibb’s free energy.
If the following reaction is considered:
(5)
where M represents an arbitrary metal, this can be described as:
7
(6)
Where ΔG° is the free energy change when all species are in their standard states, R is the ideal
gas constant and a is the thermodynamic activity of a specific species. The activity of pure
solids, in this case the metal and its oxide, can be approximated as unity. When the reaction is in
equilibrium ΔG is equal to zero and the equation can then be written as
(7)
and if the oxygen activity is approximated as oxygen partial pressure this becomes
(8)
This equation allows one to calculate if a metal or oxide is thermodynamically stable or not at a
certain temperature and oxygen partial pressure. The oxygen pressure where metal and oxide are
in equilibrium is called dissociation pressure. At a oxygen partial pressure below the
dissociation pressure the oxide is reduced to metal and above the dissociation pressure the metal
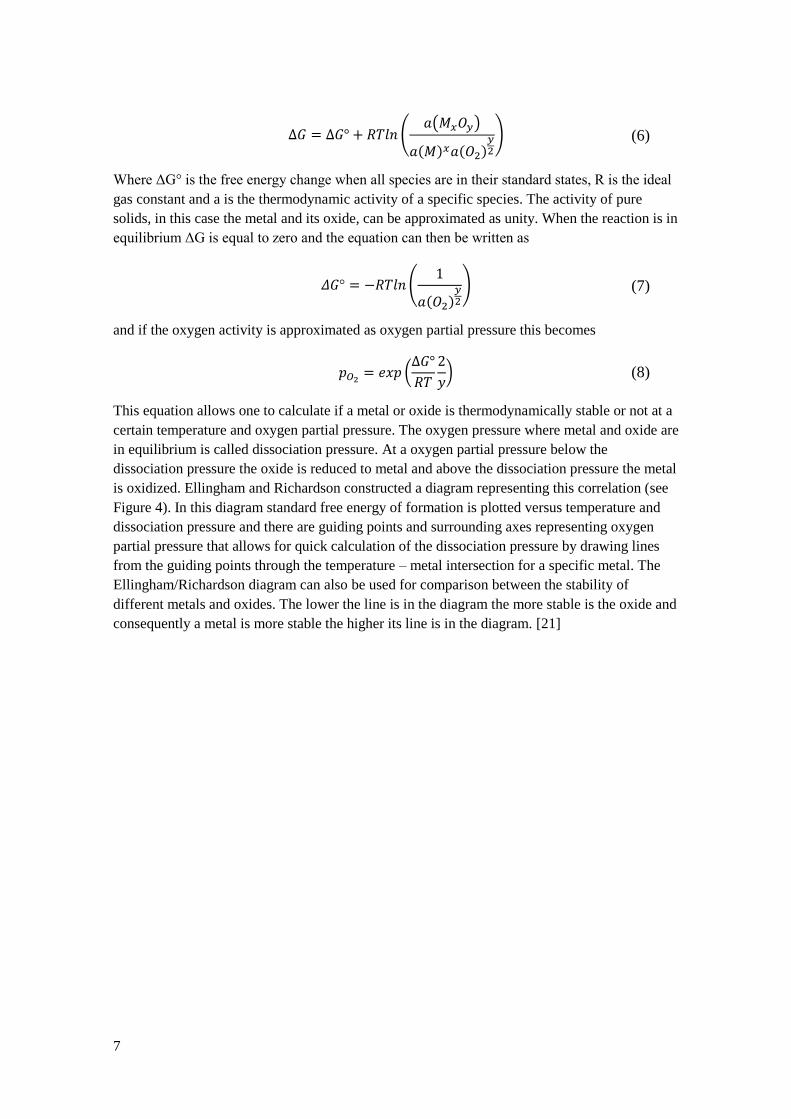
is oxidized. Ellingham and Richardson constructed a diagram representing this correlation (see
Figure 4). In this diagram standard free energy of formation is plotted versus temperature and
dissociation pressure and there are guiding points and surrounding axes representing oxygen
partial pressure that allows for quick calculation of the dissociation pressure by drawing lines
from the guiding points through the temperature – metal intersection for a specific metal. The
Ellingham/Richardson diagram can also be used for comparison between the stability of
different metals and oxides. The lower the line is in the diagram the more stable is the oxide and
consequently a metal is more stable the higher its line is in the diagram. [21]
8
Figure 4. Ellingham/Richardson diagram. Standard free energy of formation for selected oxides are
plotted against temperature [21].
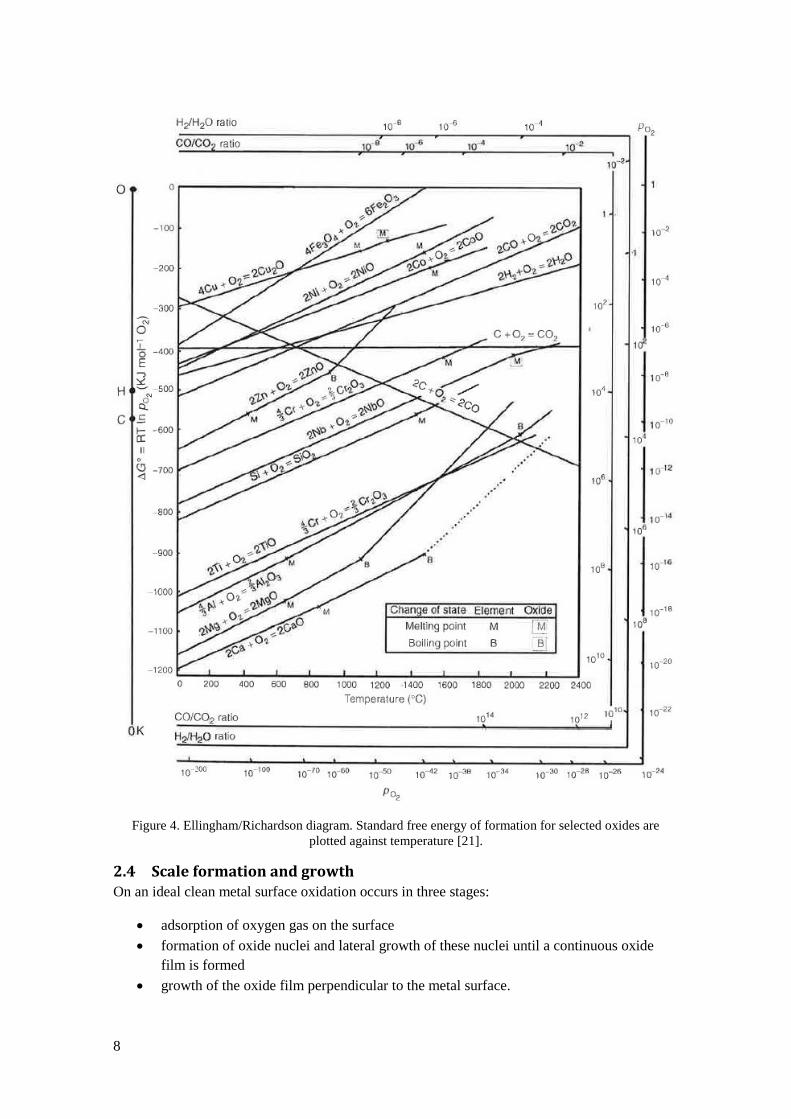
2.4 Scale formation and growth On an ideal clean metal surface oxidation occurs in three stages:
adsorption of oxygen gas on the surface
formation of oxide nuclei and lateral growth of these nuclei until a continuous oxide
film is formed
growth of the oxide film perpendicular to the metal surface.
9
This is schematically illustrated in Figure 5. At atmospheric conditions the two first stages
happen in an instant and can only be observed at lower oxygen partial pressures. Once a
continuous oxide film is formed the oxidation proceeds by thickening of this film. At this stage
the mechanism is completely changed. Oxygen and metal are now separated by an oxide film
and all further reaction has to be preceded by solid state diffusion through the oxide film.
Diffusion can be either metal cation diffusion, oxygen anion diffusion or both. At atmospheric
pressures the diffusion through the oxide scale is often the rate determining step for the
oxidation process which leads to reduction of the oxidation rate as the scale grows thicker. It
should be noted however that not all metals form dense oxide layers but might instead have
porous oxide structures which allows gas transport through the scale and thus offer less
protection against continued oxidation. Oxide structures can be crystalline, amorphous or
vitreous. The latter is a non-crystalline structure just like for amorphous materials but it
possesses short range order, but no long range order. An example of a vitreous oxide film is
SiO2, which is one of the few oxides that keeps its non-crystalline form at higher temperatures.
Films of Cr2O3 are vitreous at room temperature but become crystalline at higher temperatures.
Since the scale is initially formed by many oxide nuclei it will consist of multiple crystals and
thus be polycrystalline. Polycrystalline films have incoherent boundaries between the oxide
nuclei, called grain boundaries. These grain boundaries may provide paths of easier diffusion
through the oxide film.[22]
Figure 5. Schematic illustration of the initial stages of oxidation of a clean metal surface. From the top:
adsorption of oxygen gas, oxide nucleation and lateral growth followed by increased thickness of the
oxide layer by ion diffusion.
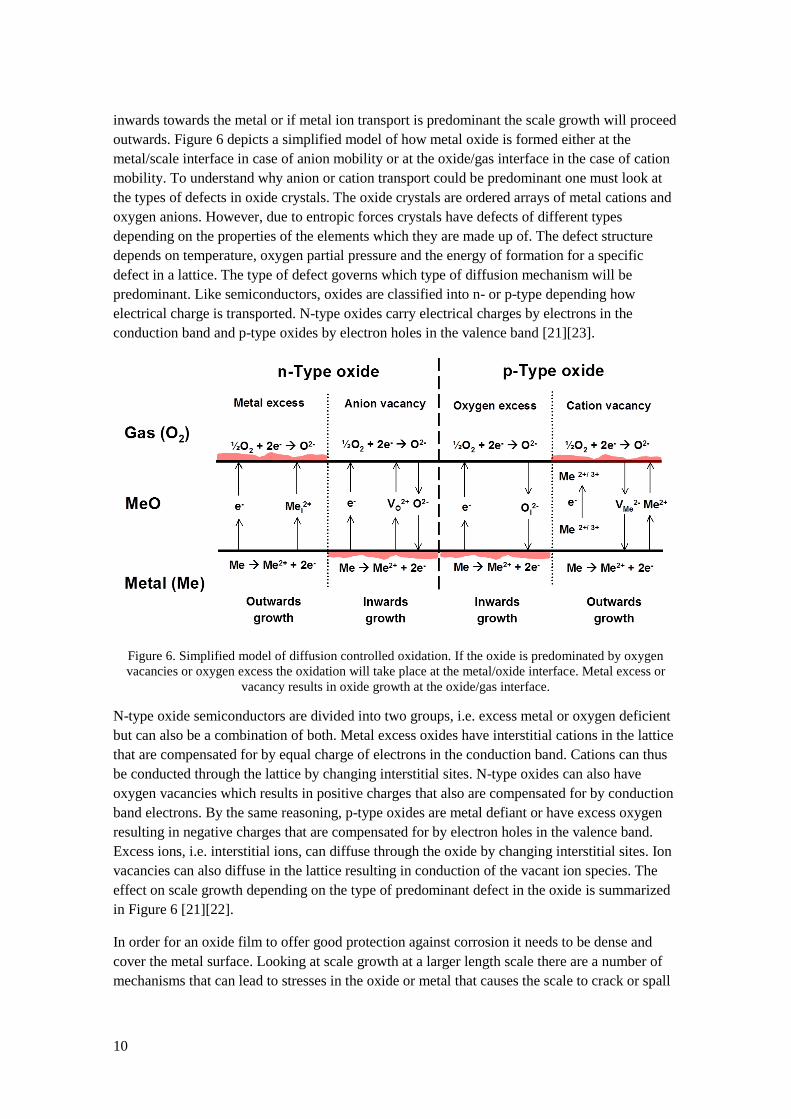
The direction in which oxide scale is growing is determined by the type of ion diffusion through
the scale. If the diffusion is predominated by oxygen ion diffusion the oxide scale will grow
10
inwards towards the metal or if metal ion transport is predominant the scale growth will proceed
outwards. Figure 6 depicts a simplified model of how metal oxide is formed either at the
metal/scale interface in case of anion mobility or at the oxide/gas interface in the case of cation
mobility. To understand why anion or cation transport could be predominant one must look at
the types of defects in oxide crystals. The oxide crystals are ordered arrays of metal cations and
oxygen anions. However, due to entropic forces crystals have defects of different types
depending on the properties of the elements which they are made up of. The defect structure
depends on temperature, oxygen partial pressure and the energy of formation for a specific
defect in a lattice. The type of defect governs which type of diffusion mechanism will be
predominant. Like semiconductors, oxides are classified into n- or p-type depending how
electrical charge is transported. N-type oxides carry electrical charges by electrons in the
conduction band and p-type oxides by electron holes in the valence band [21][23].
Figure 6. Simplified model of diffusion controlled oxidation. If the oxide is predominated by oxygen
vacancies or oxygen excess the oxidation will take place at the metal/oxide interface. Metal excess or
vacancy results in oxide growth at the oxide/gas interface.
N-type oxide semiconductors are divided into two groups, i.e. excess metal or oxygen deficient
but can also be a combination of both. Metal excess oxides have interstitial cations in the lattice
that are compensated for by equal charge of electrons in the conduction band. Cations can thus
be conducted through the lattice by changing interstitial sites. N-type oxides can also have
oxygen vacancies which results in positive charges that also are compensated for by conduction
band electrons. By the same reasoning, p-type oxides are metal defiant or have excess oxygen
resulting in negative charges that are compensated for by electron holes in the valence band.
Excess ions, i.e. interstitial ions, can diffuse through the oxide by changing interstitial sites. Ion
vacancies can also diffuse in the lattice resulting in conduction of the vacant ion species. The
effect on scale growth depending on the type of predominant defect in the oxide is summarized
in Figure 6 [21][22].
In order for an oxide film to offer good protection against corrosion it needs to be dense and
cover the metal surface. Looking at scale growth at a larger length scale there are a number of
mechanisms that can lead to stresses in the oxide or metal that causes the scale to crack or spall
11
of. A general rule is that the thicker an oxide layer is the larger are the stresses acting on it and
the more likely it is to break. Below follows some mechanisms that induces stress during oxide
scale growth.
2.4.1.1 Pilling- Bedworth ratio
Metals and their corresponding oxides seldom have the same specific volume. When oxidation
occurs by inwards growth the volume mismatch between oxide and metal results in induced
growth stresses. In 1923 Pilling and Bedworth proposed a method for classifying the growth
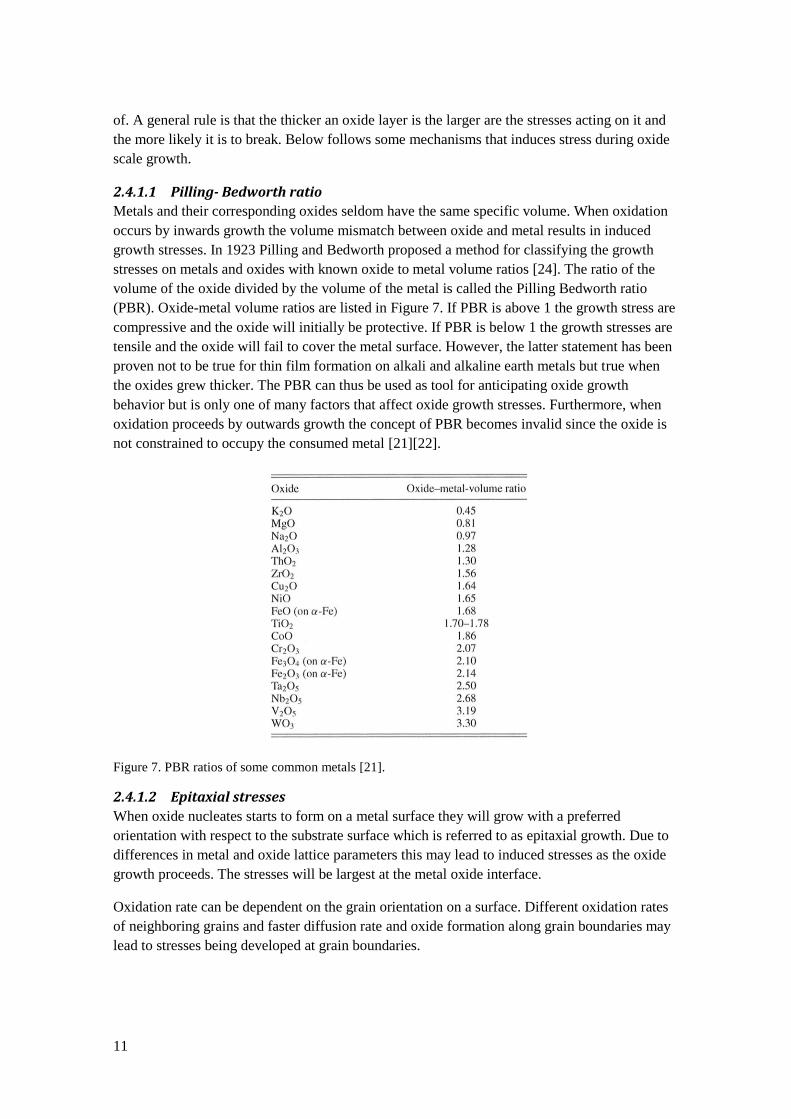
stresses on metals and oxides with known oxide to metal volume ratios [24]. The ratio of the
volume of the oxide divided by the volume of the metal is called the Pilling Bedworth ratio
(PBR). Oxide-metal volume ratios are listed in Figure 7. If PBR is above 1 the growth stress are
compressive and the oxide will initially be protective. If PBR is below 1 the growth stresses are
tensile and the oxide will fail to cover the metal surface. However, the latter statement has been
proven not to be true for thin film formation on alkali and alkaline earth metals but true when
the oxides grew thicker. The PBR can thus be used as tool for anticipating oxide growth
behavior but is only one of many factors that affect oxide growth stresses. Furthermore, when
oxidation proceeds by outwards growth the concept of PBR becomes invalid since the oxide is
not constrained to occupy the consumed metal [21][22].
Figure 7. PBR ratios of some common metals [21].
2.4.1.2 Epitaxial stresses
When oxide nucleates starts to form on a metal surface they will grow with a preferred
orientation with respect to the substrate surface which is referred to as epitaxial growth. Due to
differences in metal and oxide lattice parameters this may lead to induced stresses as the oxide
growth proceeds. The stresses will be largest at the metal oxide interface.
Oxidation rate can be dependent on the grain orientation on a surface. Different oxidation rates
of neighboring grains and faster diffusion rate and oxide formation along grain boundaries may
lead to stresses being developed at grain boundaries.
12
2.4.1.3 Compositional changes in the alloy or scale
When alloys are oxidized one element is usually preferentially oxidized which may lead to
depletion of this element and a local change in the alloy composition. Compositional changes in
the alloy may lead to changes in the lattice parameters which may lead to stresses. Likewise,
compositional changes in the oxide may also result in stresses.
2.4.1.4 Stresses induced by certain growth mechanisms
When cation transport is predominant voids and cavities may form at the metal/scale interface
since metal is being transported to the oxide surface. Thin oxide films may initially deform and
keep contact with the metal, but as the film grows thicker more force is required to deform it
and voids and cavities are formed. When the oxide film continues to grow stresses build up
between oxide and metal. When oxidation occurs by a mix of cation and anion diffusion oxides
may form within the oxide scale which will result in growth by thickening of the scale and by
lateral growth. Such growth induces larger stresses and may lead to cracking of the oxide film.
2.4.1.5 Thermal stresses
Thermal stresses are common causes to cracking and spalling of oxide scales but is not related
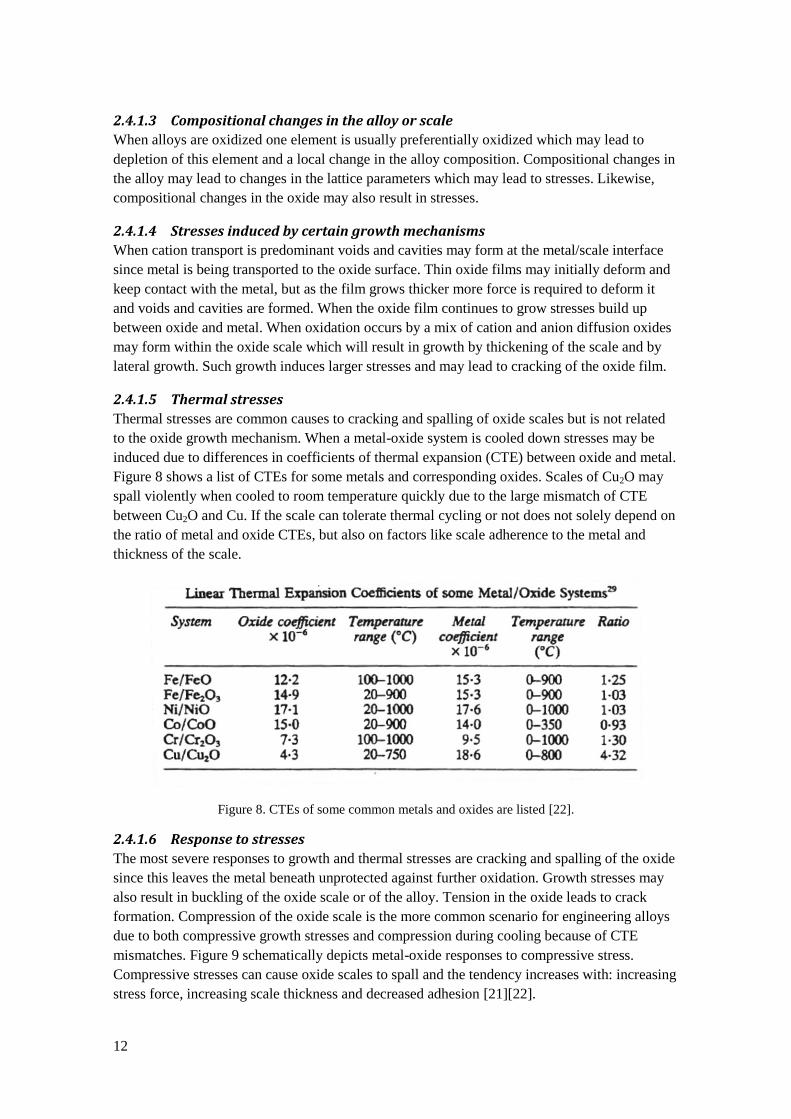
to the oxide growth mechanism. When a metal-oxide system is cooled down stresses may be
induced due to differences in coefficients of thermal expansion (CTE) between oxide and metal.
Figure 8 shows a list of CTEs for some metals and corresponding oxides. Scales of Cu2O may
spall violently when cooled to room temperature quickly due to the large mismatch of CTE
between Cu2O and Cu. If the scale can tolerate thermal cycling or not does not solely depend on
the ratio of metal and oxide CTEs, but also on factors like scale adherence to the metal and
thickness of the scale.
Figure 8. CTEs of some common metals and oxides are listed [22].
2.4.1.6 Response to stresses
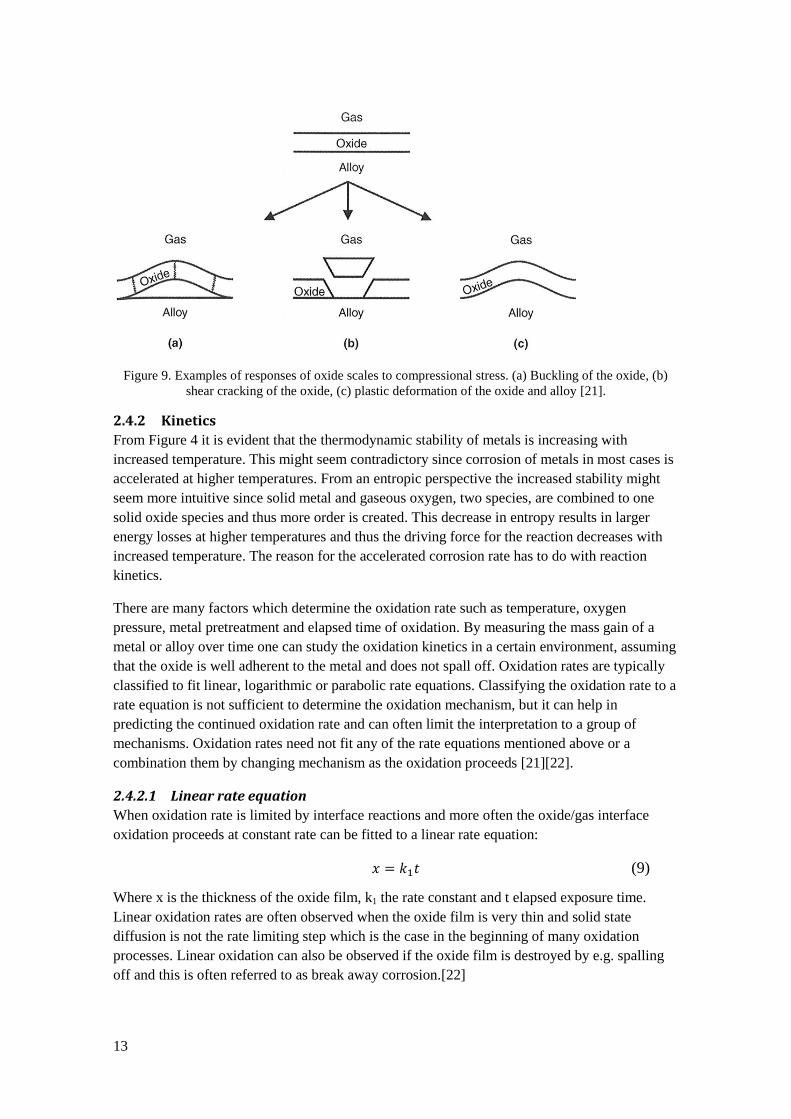
The most severe responses to growth and thermal stresses are cracking and spalling of the oxide
since this leaves the metal beneath unprotected against further oxidation. Growth stresses may
also result in buckling of the oxide scale or of the alloy. Tension in the oxide leads to crack
formation. Compression of the oxide scale is the more common scenario for engineering alloys
due to both compressive growth stresses and compression during cooling because of CTE
mismatches. Figure 9 schematically depicts metal-oxide responses to compressive stress.
Compressive stresses can cause oxide scales to spall and the tendency increases with: increasing
stress force, increasing scale thickness and decreased adhesion [21][22].
13
Figure 9. Examples of responses of oxide scales to compressional stress. (a) Buckling of the oxide, (b)
shear cracking of the oxide, (c) plastic deformation of the oxide and alloy [21].
2.4.2 Kinetics
From Figure 4 it is evident that the thermodynamic stability of metals is increasing with
increased temperature. This might seem contradictory since corrosion of metals in most cases is
accelerated at higher temperatures. From an entropic perspective the increased stability might
seem more intuitive since solid metal and gaseous oxygen, two species, are combined to one
solid oxide species and thus more order is created. This decrease in entropy results in larger
energy losses at higher temperatures and thus the driving force for the reaction decreases with
increased temperature. The reason for the accelerated corrosion rate has to do with reaction
kinetics.
There are many factors which determine the oxidation rate such as temperature, oxygen
pressure, metal pretreatment and elapsed time of oxidation. By measuring the mass gain of a
metal or alloy over time one can study the oxidation kinetics in a certain environment, assuming
that the oxide is well adherent to the metal and does not spall off. Oxidation rates are typically
classified to fit linear, logarithmic or parabolic rate equations. Classifying the oxidation rate to a
rate equation is not sufficient to determine the oxidation mechanism, but it can help in
predicting the continued oxidation rate and can often limit the interpretation to a group of
mechanisms. Oxidation rates need not fit any of the rate equations mentioned above or a
combination them by changing mechanism as the oxidation proceeds [21][22].
2.4.2.1 Linear rate equation
When oxidation rate is limited by interface reactions and more often the oxide/gas interface
oxidation proceeds at constant rate can be fitted to a linear rate equation:
(9)
Where x is the thickness of the oxide film, k1 the rate constant and t elapsed exposure time.
Linear oxidation rates are often observed when the oxide film is very thin and solid state
diffusion is not the rate limiting step which is the case in the beginning of many oxidation
processes. Linear oxidation can also be observed if the oxide film is destroyed by e.g. spalling
off and this is often referred to as break away corrosion.[22]
14
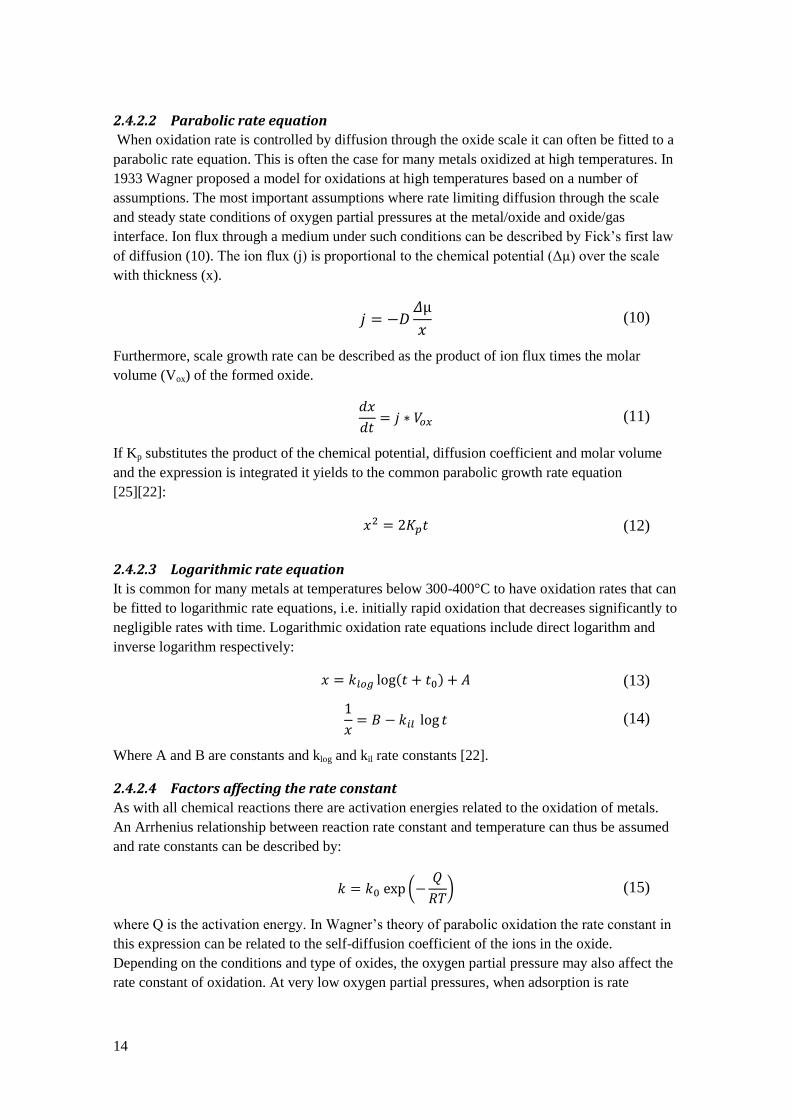
2.4.2.2 Parabolic rate equation
When oxidation rate is controlled by diffusion through the oxide scale it can often be fitted to a
parabolic rate equation. This is often the case for many metals oxidized at high temperatures. In
1933 Wagner proposed a model for oxidations at high temperatures based on a number of
assumptions. The most important assumptions where rate limiting diffusion through the scale
and steady state conditions of oxygen partial pressures at the metal/oxide and oxide/gas
interface. Ion flux through a medium under such conditions can be described by Fick’s first law
of diffusion (10). The ion flux (j) is proportional to the chemical potential (Δµ) over the scale
with thickness (x).
(10)
Furthermore, scale growth rate can be described as the product of ion flux times the molar
volume (Vox) of the formed oxide.
(11)
If Kp substitutes the product of the chemical potential, diffusion coefficient and molar volume
and the expression is integrated it yields to the common parabolic growth rate equation
[25][22]:
(12)
2.4.2.3 Logarithmic rate equation
It is common for many metals at temperatures below 300-400°C to have oxidation rates that can
be fitted to logarithmic rate equations, i.e. initially rapid oxidation that decreases significantly to
negligible rates with time. Logarithmic oxidation rate equations include direct logarithm and
inverse logarithm respectively:
(13)
(14)
Where A and B are constants and klog and kil rate constants [22].
2.4.2.4 Factors affecting the rate constant
As with all chemical reactions there are activation energies related to the oxidation of metals.
An Arrhenius relationship between reaction rate constant and temperature can thus be assumed
and rate constants can be described by:
(15)
where Q is the activation energy. In Wagner’s theory of parabolic oxidation the rate constant in
this expression can be related to the self-diffusion coefficient of the ions in the oxide.
Depending on the conditions and type of oxides, the oxygen partial pressure may also affect the
rate constant of oxidation. At very low oxygen partial pressures, when adsorption is rate
15
limiting, the rate of reaction is proportional to the oxygen partial pressure and under linear phase
boundary controlled oxidations it is proportional to square root of oxygen partial pressure. Even
when the oxidation rate is diffusion controlled the reaction rate can depend on oxygen partial
pressure. If the oxide is non- stoichiometric and is metal deficient or has excess oxygen the
parabolic rate constant is proportional to p(O2)1/n
, where n is a function of the oxide defect
structure. Stoichiometric oxides like Cr2O3 and Al2O3 have fewer defects and thus lower
diffusion rates than non-stoichiometric oxides like FeO and Fe2O3. Diffusion rate is also
affected by the presence of grain boundaries and lattice dislocations that offer alternative
diffusion paths compared to lattice diffusion. This type of diffusion is called short-circuit
diffusion and usually requires lower activation energy than lattice diffusion. Hence, this is often
the predominant diffusion mechanism at lower temperatures and as the temperature increases
lattice diffusion becomes a larger part of the total ion flux through the oxide scale. Higher rate
constants have been observed in more fine grain oxide films due to the high amount of grain
boundary diffusion paths. This also allows short-circuit diffusion to be predominant at higher
temperatures [21][22].
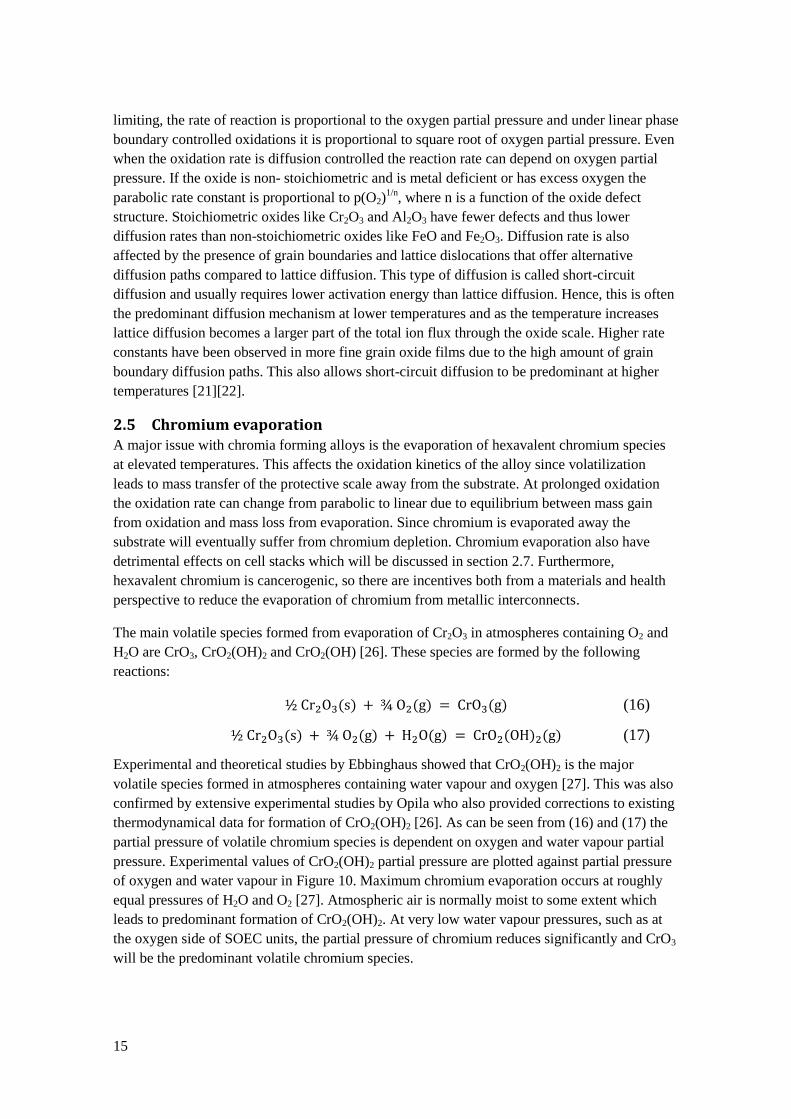
2.5 Chromium evaporation A major issue with chromia forming alloys is the evaporation of hexavalent chromium species
at elevated temperatures. This affects the oxidation kinetics of the alloy since volatilization
leads to mass transfer of the protective scale away from the substrate. At prolonged oxidation
the oxidation rate can change from parabolic to linear due to equilibrium between mass gain
from oxidation and mass loss from evaporation. Since chromium is evaporated away the
substrate will eventually suffer from chromium depletion. Chromium evaporation also have
detrimental effects on cell stacks which will be discussed in section 2.7. Furthermore,
hexavalent chromium is cancerogenic, so there are incentives both from a materials and health
perspective to reduce the evaporation of chromium from metallic interconnects.
The main volatile species formed from evaporation of Cr2O3 in atmospheres containing O2 and
H2O are CrO3, CrO2(OH)2 and CrO2(OH) [26]. These species are formed by the following
reactions:
(16)
(17)
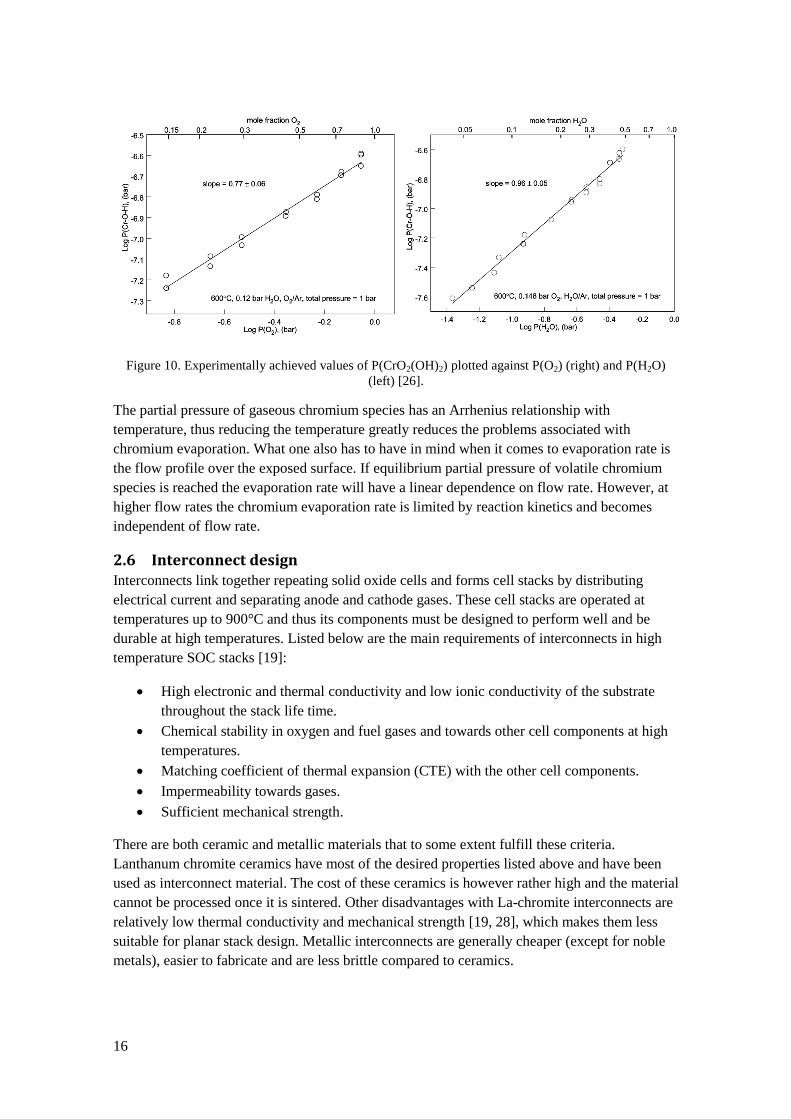
Experimental and theoretical studies by Ebbinghaus showed that CrO2(OH)2 is the major
volatile species formed in atmospheres containing water vapour and oxygen [27]. This was also
confirmed by extensive experimental studies by Opila who also provided corrections to existing
thermodynamical data for formation of CrO2(OH)2 [26]. As can be seen from (16) and (17) the
partial pressure of volatile chromium species is dependent on oxygen and water vapour partial
pressure. Experimental values of CrO2(OH)2 partial pressure are plotted against partial pressure
of oxygen and water vapour in Figure 10. Maximum chromium evaporation occurs at roughly
equal pressures of H2O and O2 [27]. Atmospheric air is normally moist to some extent which
leads to predominant formation of CrO2(OH)2. At very low water vapour pressures, such as at
the oxygen side of SOEC units, the partial pressure of chromium reduces significantly and CrO3
will be the predominant volatile chromium species.
16
Figure 10. Experimentally achieved values of P(CrO2(OH)2) plotted against P(O2) (right) and P(H2O)
(left) [26].
The partial pressure of gaseous chromium species has an Arrhenius relationship with
temperature, thus reducing the temperature greatly reduces the problems associated with
chromium evaporation. What one also has to have in mind when it comes to evaporation rate is
the flow profile over the exposed surface. If equilibrium partial pressure of volatile chromium
species is reached the evaporation rate will have a linear dependence on flow rate. However, at
higher flow rates the chromium evaporation rate is limited by reaction kinetics and becomes
independent of flow rate.
2.6 Interconnect design Interconnects link together repeating solid oxide cells and forms cell stacks by distributing
electrical current and separating anode and cathode gases. These cell stacks are operated at
temperatures up to 900°C and thus its components must be designed to perform well and be
durable at high temperatures. Listed below are the main requirements of interconnects in high
temperature SOC stacks [19]:
High electronic and thermal conductivity and low ionic conductivity of the substrate
throughout the stack life time.
Chemical stability in oxygen and fuel gases and towards other cell components at high
temperatures.
Matching coefficient of thermal expansion (CTE) with the other cell components.
Impermeability towards gases.
Sufficient mechanical strength.
There are both ceramic and metallic materials that to some extent fulfill these criteria.
Lanthanum chromite ceramics have most of the desired properties listed above and have been
used as interconnect material. The cost of these ceramics is however rather high and the material
cannot be processed once it is sintered. Other disadvantages with La-chromite interconnects are
relatively low thermal conductivity and mechanical strength [19, 28], which makes them less
suitable for planar stack design. Metallic interconnects are generally cheaper (except for noble
metals), easier to fabricate and are less brittle compared to ceramics.
17
High temperature alloys generally rely on the formation of a passivating oxide layer that retards
the oxidation of the metal surface, thus protecting against further corrosion. Alloys containing
Cr, Si or Al are commonly used for high temperature applications as they can form good
protective oxide layers of Cr2O3, SiO2 and Al2O3 respectively. However, silica and alumina
forming alloys are not suitable as interconnect materials as these oxides have too low electronic
conductivity which would lead to too large reduction in stack performance due to ohmic losses
[28, 29]. Thus when designing alloys for interconnects it is important to keep the Si and Al
concentrations low to avoid the formation of continuous silica or alumina layers.
Chromia has several orders of magnitude higher electrical conductivity than silica and alumina
and is therefore the preferred passivating layer former for metallic interconnects. The downside
of Cr2O3 is that it has, compared to SiO2 and Al2O3, a higher growth rate and can therefore not
be used at as high temperatures as La-chromites. Austenitic chromia forming steels are Fe-Cr
alloys that adopts the FCC structure due to the mix in with an austenitic stabilizer, such as Ni
[22]. These steels have 18-30wt% chromium and have good corrosion resistance at high
temperatures, but their thermal expansion coefficient is too large compared to other cell
components in SOCs and are therefore not very suitable as interconnect materials [30, 31]. They
could possibly be used at lower temperatures of around 600°C where materials can be made
thinner and CTE is not as large issue [32]. Among the Fe-Cr based alloys there are two types
that seem more suitable as interconnect materials. Ferritic steels and chromium based alloys
both have tolerable matching CTEs with SOC components and are therefore the two types of
alloys which are most frequently studied [12].
Due to the brittleness well above ambient temperature high chromium content alloys have had
limited use as construction material in industrial applications. The company Plansee has
however developed oxide dispersion strengthened (ODS) chromium that has substantially
improved mechanical properties and their product Ducrolloy is an Cr-5Fe-1Y2O3 alloy for SOC
interconnects. Chromium based alloys typically have a few percent of iron mixed in to match
CTE with SOC components. ODS alloys are quite expensive and difficult to fabricate since
powder metallurgical techniques needs to be used [33].
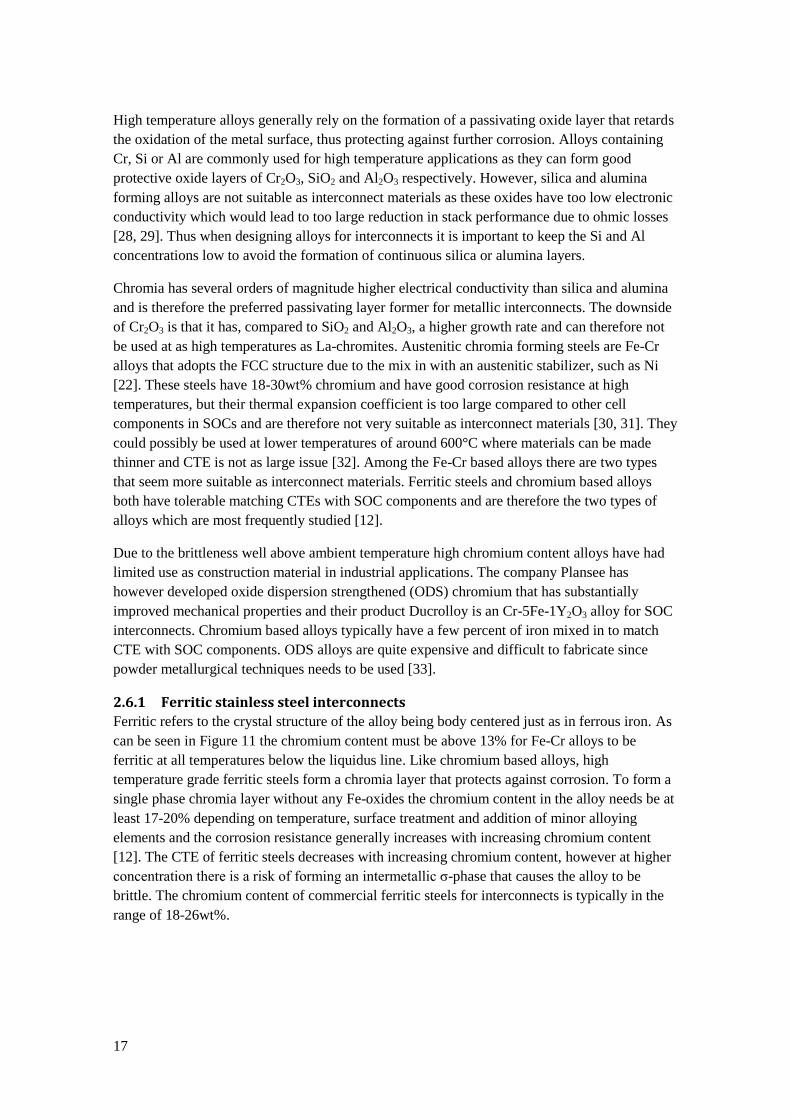
2.6.1 Ferritic stainless steel interconnects
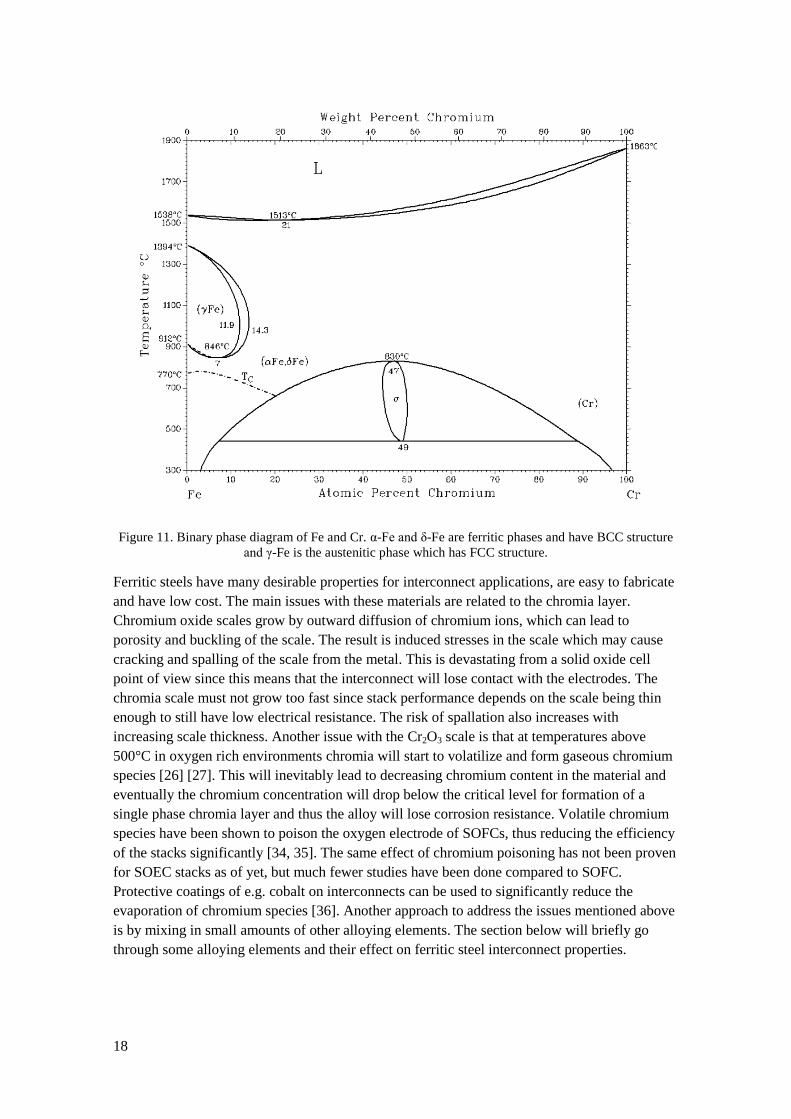
Ferritic refers to the crystal structure of the alloy being body centered just as in ferrous iron. As
can be seen in Figure 11 the chromium content must be above 13% for Fe-Cr alloys to be
ferritic at all temperatures below the liquidus line. Like chromium based alloys, high
temperature grade ferritic steels form a chromia layer that protects against corrosion. To form a
single phase chromia layer without any Fe-oxides the chromium content in the alloy needs be at
least 17-20% depending on temperature, surface treatment and addition of minor alloying
elements and the corrosion resistance generally increases with increasing chromium content
[12]. The CTE of ferritic steels decreases with increasing chromium content, however at higher
concentration there is a risk of forming an intermetallic σ-phase that causes the alloy to be
brittle. The chromium content of commercial ferritic steels for interconnects is typically in the
range of 18-26wt%.
18
Figure 11. Binary phase diagram of Fe and Cr. α-Fe and δ-Fe are ferritic phases and have BCC structure
and γ-Fe is the austenitic phase which has FCC structure.
Ferritic steels have many desirable properties for interconnect applications, are easy to fabricate
and have low cost. The main issues with these materials are related to the chromia layer.
Chromium oxide scales grow by outward diffusion of chromium ions, which can lead to
porosity and buckling of the scale. The result is induced stresses in the scale which may cause
cracking and spalling of the scale from the metal. This is devastating from a solid oxide cell
point of view since this means that the interconnect will lose contact with the electrodes. The
chromia scale must not grow too fast since stack performance depends on the scale being thin
enough to still have low electrical resistance. The risk of spallation also increases with
increasing scale thickness. Another issue with the Cr2O3 scale is that at temperatures above
500°C in oxygen rich environments chromia will start to volatilize and form gaseous chromium
species [26] [27]. This will inevitably lead to decreasing chromium content in the material and
eventually the chromium concentration will drop below the critical level for formation of a
single phase chromia layer and thus the alloy will lose corrosion resistance. Volatile chromium
species have been shown to poison the oxygen electrode of SOFCs, thus reducing the efficiency
of the stacks significantly [34, 35]. The same effect of chromium poisoning has not been proven
for SOEC stacks as of yet, but much fewer studies have been done compared to SOFC.
Protective coatings of e.g. cobalt on interconnects can be used to significantly reduce the
evaporation of chromium species [36]. Another approach to address the issues mentioned above
is by mixing in small amounts of other alloying elements. The section below will briefly go
through some alloying elements and their effect on ferritic steel interconnect properties.
19
2.6.2 Alloying elements in ferritic stainless steel interconnects
2.6.2.1 Si and Al
Silicon and aluminum requires very low oxygen partial pressure to be oxidized and can thus be
oxidized internally in the alloy, beneath the protective chromia scale. This internal oxidation has
been shown to increase the oxidation rate of chromium oxide scales due to induced internal
stresses in the alloy [37]. Si has also been reported to decrease adhesion between the oxide scale
and metal and cause the chromia layer to spall of during thermal cycling [12]. The presence of
small amounts of Si in interconnect steels can also severely increase the electrical contact
resistance due to formation of a continous silica sublayer. This phenomenon can occur even at
such low Si concentrations as 0.1wt% [38]. By the same principle alumina layers can also form
and decrease conductivity. To avoid internal scales of silica and alumina commercial
interconnect steels, like Crofer 22 APU, are alloyed by vacuum melting, which is an expensive
process.
2.6.2.2 Refractory elements (Nb, W, Mo)
The elements Nb, W and Mo are classified into a group of hard and heat resistant metals called
refractory metals. These elements have been shown to form so called Laves phases which
increase the creep strength of ferritic steels, a property that is needed for thin metallic
interconnects. The Laves phases are intermetallic precipitates which consist of (Fe, Cr)2(Nb, W,
Mo) and these precipitates increases the hardness of the steel, but also the brittleness [39]. The
elements W and Mo do form Laves phases, but their contribution to increased creep strength is
mainly attributed to solid solution strengthening due to their large atomic radii [40].
Froitzheim et al. [41] observed increased oxidation rate of a Si free 1%Nb-22%Cr steel,
compared to steels that contained higher amounts of Si. The increased growth rate of the
chromia scale was concluded to be due to the formation of niobium oxide at the metal/chromia
layer interface and Nb was proposed to promote the oxidation of chromium by increasing the
diffusion rate of chromium ions due to doping of Cr2O3 with Nb. Higher concentrations of Si in
the steel were found to suppress this detrimental effect. Silicon dissolves in the (Fe,Cr)2Nb
Laves phases and inhibits the formation of Nb oxide at the scale/metal interface. Thus the
combined addition of Si and Nb offers the advantage of higher creep strength for the steel due to
Laves phase precipitates formation with reduced tendency for increased oxidation rate. Since Si
is dissolved in the Laves phases it is less prone to form an insulating silicon oxide layer and thus
due to the presence of Nb additions within the steel, higher Si content can be tolerated. By
modification of the alloy chemisty, e.g. by addition of Nb, the tolerance for minor Si levels
could be increased and possibly there would be no need for expensive refining steps [42].
2.6.2.3 Ti
Like aluminum and silicon, the presence of titanium in the alloy results in internal oxidation.
The internal titanium oxide zone can have the beneficial effect of strengthening the near-oxide
scale area and can prevent scale buckling [25]. Ti also reduces contact resistance of the scale
due to a doping effect of chromium oxide [43]. However, the diffusion of Cr ions is also
increased by this doping effect, which results in higher growth rate of the chromia scale. Too
high concentrations of Ti may also lead to spallation of the chromia scale. Pirón and
Quadakkers reported that 0.15wt% Ti caused severe internal oxidation at the grain boundaries
resulting in plastic deformation and buckling of the oxide scale [44].
20
2.6.2.4 Mn
Manganese has become a standard alloying element in commercial ferritic steels for SOC
interconnects. Mn diffuses through the oxide layer and results in a two phase protective oxide
layer with MnCr2O4 spinel on top and Cr2O3 below[25].This chromium manganese spinel
substantially lowers the rate of evaporation of chromium species from the steel substrate [45],
which are known to poison the oxygen electrode of SOFCs and deplete the alloy from
chromium. Additionally, the introduction of a MnCr2O4 spinel layer increases the conductivity
of the oxide scale for the interconnect [46].
2.6.2.5 Reactive elements(RE)
Oxygen active elements such as yttrium, hafnium, cerium, lanthanum and zirconium are known
to have very beneficial effects on the oxidation behavior of chromia forming alloys [47]. In high
temperature corrosion science these elements are often referred to as reactive elements and their
influence on the oxidation behavior is called the reactive element effect. Small additions of
these elements to a chromia forming alloy greatly increases the adherence of the chromia scale
to the metal [21]. Additionally, reactive elements significantly decrease the chromium oxide
growth rate and enhance the selective oxidation of chromium, thus restricting the formation of
iron oxides. The latter effect makes it possible to use less chromium in alloys and yet form a
protective chromia scale. Or if the same amount of chromium is used in an alloy the oxide scale
will form faster in the presence of added REs.
The oxidation mechanism of chromium is also altered when reactive elements are present, from
predominant outward cation diffusion to oxygen inward transport [48]. Even though the RE
effect has been known for more than 70 years the mechanism behind it is still in debate. The
effect has been studied extensively and suggested mechanisms include segregation of RE to the
oxide grain boundaries which reduces cation transport, tying up sulfur which prevents it to
accumulate at the scale/metal interface and weaken adhesion. It has also been shown that REs
are effective both when added as metal or oxide dispersion to an alloy and even when applied to
a metal or oxide surface [21]. As a consequence of reactive element doping the contact
resistance of a metal interconnect can be improved. Studies with Y doping has shown that
contact resistance of decreases compared to undoped alloys due to the decreased growth rate
and improved adhesion of the chromia scale [29].
2.7 Degradation of SOEC Temperatures between 600-1000°C are necessary to achieve sufficient reaction kinetics and
conductivity within cell stacks, but these high temperatures also speed up chemical side
reactions and other degrading processes. Durability of electrolyzers has been pointed out as one
of the main factors that affect hydrogen cost [11]. Hence there are strong incentives towards
developing more long lasting SOEC stacks. Degradation phenomena of SOC stacks have been
more studied for units run in SOFC mode than in SOEC mode. Even if the operation is
different, the knowledge from SOFC testing can in many cases be transferred to SOEC
technology. Currently SOC stacks degrade more in SOEC mode than in SOFC mode [49]. Some
known degradation phenomena for SOEC includes delamination of oxygen electrodes,
coarsening of nickel particles in the fuel electrode, loss of ionic conductivity in the electrolyte,
formation of inhibiting species due to migration of ions from interconnects and increase of
ohmic resistance due to oxide scale build up on metallic interconnects [8, 49]. Chromium
evaporation is known to be a major problem in SOFC stacks since volatile chromium is gets
21
deposited on the cathode and poisons the oxygen electrode. This phenomenon is less studied for
SOEC mode but is suspected to be less detrimental to stack performance.
3 Experimental
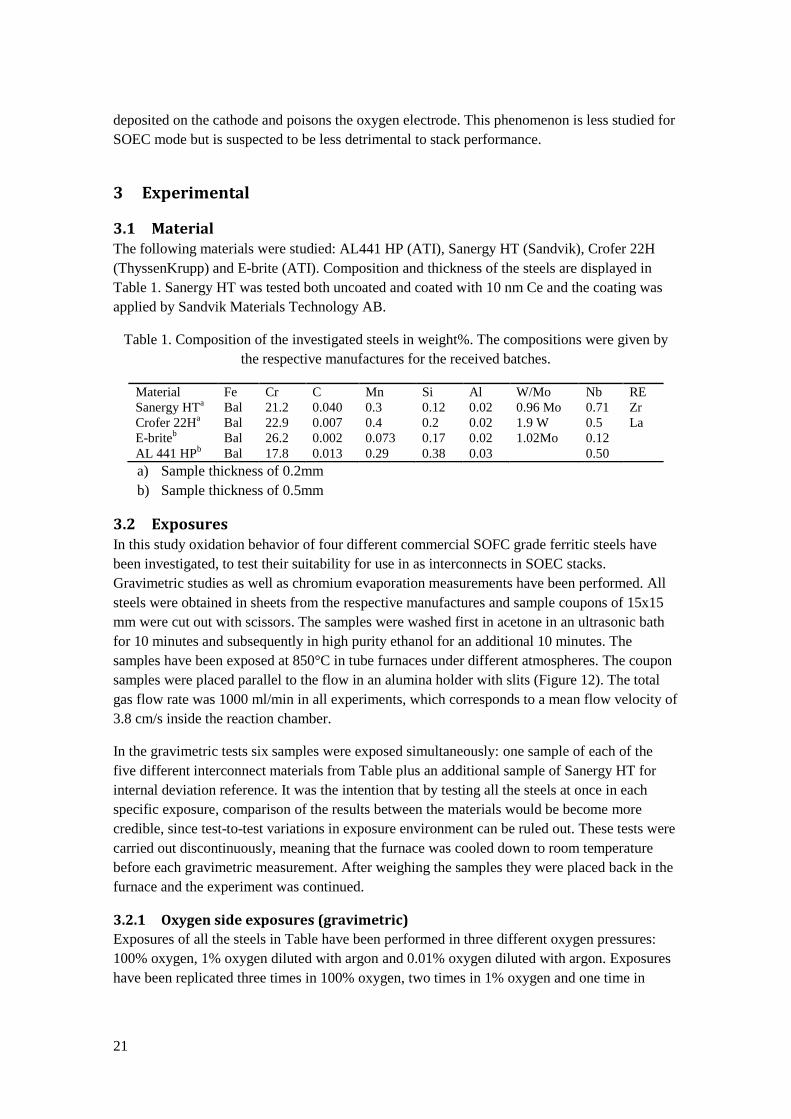
3.1 Material The following materials were studied: AL441 HP (ATI), Sanergy HT (Sandvik), Crofer 22H
(ThyssenKrupp) and E-brite (ATI). Composition and thickness of the steels are displayed in
Table 1. Sanergy HT was tested both uncoated and coated with 10 nm Ce and the coating was
applied by Sandvik Materials Technology AB.
Table 1. Composition of the investigated steels in weight%. The compositions were given by
the respective manufactures for the received batches.
Material Fe Cr C Mn Si Al W/Mo Nb RE
Sanergy HTa
Bal 21.2 0.040 0.3 0.12 0.02 0.96 Mo 0.71 Zr
Crofer 22Ha Bal 22.9 0.007 0.4 0.2 0.02 1.9 W 0.5 La
E-briteb Bal 26.2 0.002 0.073 0.17 0.02 1.02Mo 0.12
AL 441 HPb Bal 17.8 0.013 0.29 0.38 0.03 0.50
a) Sample thickness of 0.2mm
b) Sample thickness of 0.5mm
3.2 Exposures In this study oxidation behavior of four different commercial SOFC grade ferritic steels have
been investigated, to test their suitability for use in as interconnects in SOEC stacks.
Gravimetric studies as well as chromium evaporation measurements have been performed. All
steels were obtained in sheets from the respective manufactures and sample coupons of 15x15
mm were cut out with scissors. The samples were washed first in acetone in an ultrasonic bath
for 10 minutes and subsequently in high purity ethanol for an additional 10 minutes. The
samples have been exposed at 850°C in tube furnaces under different atmospheres. The coupon
samples were placed parallel to the flow in an alumina holder with slits (Figure 12). The total
gas flow rate was 1000 ml/min in all experiments, which corresponds to a mean flow velocity of
3.8 cm/s inside the reaction chamber.
In the gravimetric tests six samples were exposed simultaneously: one sample of each of the
five different interconnect materials from Table plus an additional sample of Sanergy HT for
internal deviation reference. It was the intention that by testing all the steels at once in each
specific exposure, comparison of the results between the materials would be become more
credible, since test-to-test variations in exposure environment can be ruled out. These tests were
carried out discontinuously, meaning that the furnace was cooled down to room temperature
before each gravimetric measurement. After weighing the samples they were placed back in the
furnace and the experiment was continued.
3.2.1 Oxygen side exposures (gravimetric)
Exposures of all the steels in Table have been performed in three different oxygen pressures:
100% oxygen, 1% oxygen diluted with argon and 0.01% oxygen diluted with argon. Exposures
have been replicated three times in 100% oxygen, two times in 1% oxygen and one time in
22
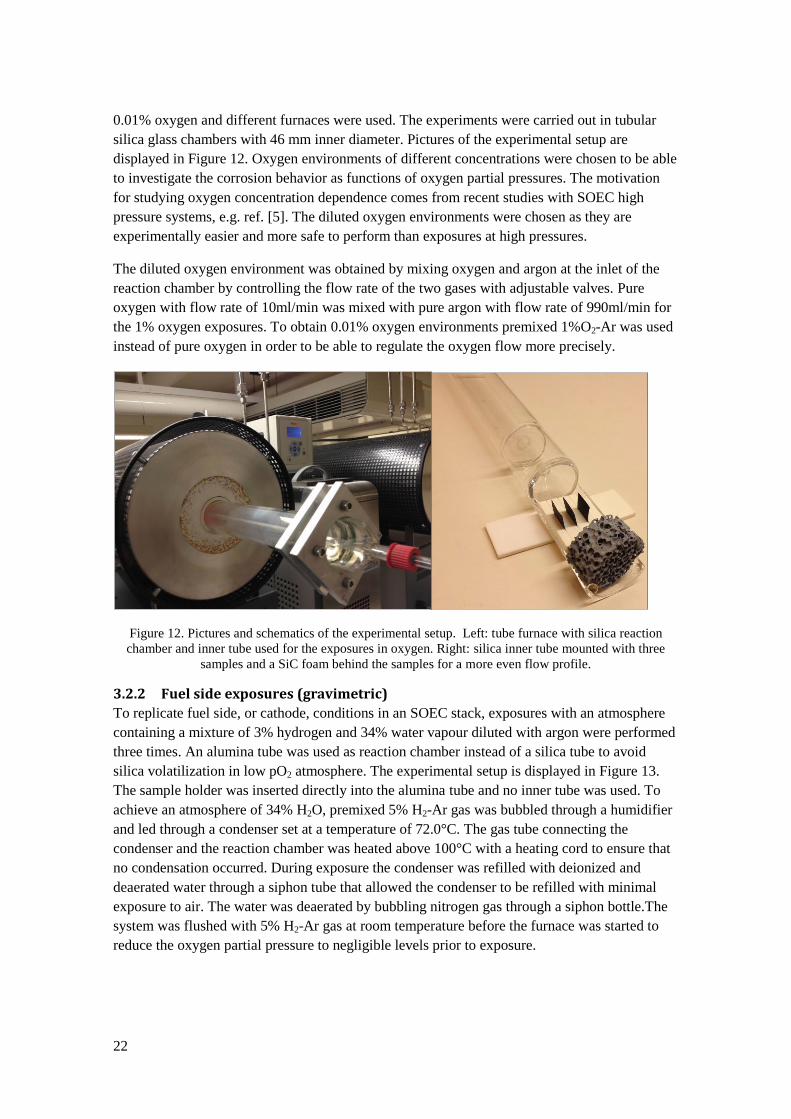
0.01% oxygen and different furnaces were used. The experiments were carried out in tubular
silica glass chambers with 46 mm inner diameter. Pictures of the experimental setup are
displayed in Figure 12. Oxygen environments of different concentrations were chosen to be able
to investigate the corrosion behavior as functions of oxygen partial pressures. The motivation
for studying oxygen concentration dependence comes from recent studies with SOEC high
pressure systems, e.g. ref. [5]. The diluted oxygen environments were chosen as they are
experimentally easier and more safe to perform than exposures at high pressures.
The diluted oxygen environment was obtained by mixing oxygen and argon at the inlet of the
reaction chamber by controlling the flow rate of the two gases with adjustable valves. Pure
oxygen with flow rate of 10ml/min was mixed with pure argon with flow rate of 990ml/min for
the 1% oxygen exposures. To obtain 0.01% oxygen environments premixed 1%O2-Ar was used
instead of pure oxygen in order to be able to regulate the oxygen flow more precisely.
Figure 12. Pictures and schematics of the experimental setup. Left: tube furnace with silica reaction
chamber and inner tube used for the exposures in oxygen. Right: silica inner tube mounted with three
samples and a SiC foam behind the samples for a more even flow profile.
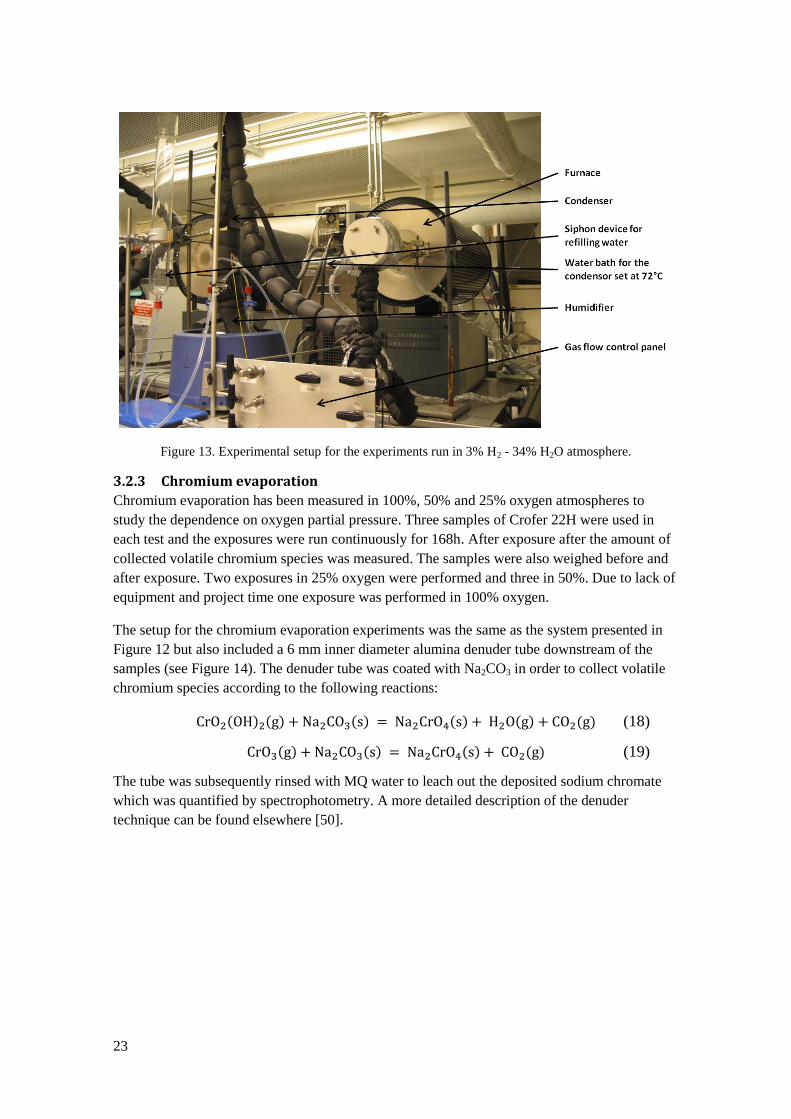
3.2.2 Fuel side exposures (gravimetric)
To replicate fuel side, or cathode, conditions in an SOEC stack, exposures with an atmosphere
containing a mixture of 3% hydrogen and 34% water vapour diluted with argon were performed
three times. An alumina tube was used as reaction chamber instead of a silica tube to avoid
silica volatilization in low pO2 atmosphere. The experimental setup is displayed in Figure 13.
The sample holder was inserted directly into the alumina tube and no inner tube was used. To
achieve an atmosphere of 34% H2O, premixed 5% H2-Ar gas was bubbled through a humidifier
and led through a condenser set at a temperature of 72.0°C. The gas tube connecting the
condenser and the reaction chamber was heated above 100°C with a heating cord to ensure that
no condensation occurred. During exposure the condenser was refilled with deionized and
deaerated water through a siphon tube that allowed the condenser to be refilled with minimal
exposure to air. The water was deaerated by bubbling nitrogen gas through a siphon bottle.The
system was flushed with 5% H2-Ar gas at room temperature before the furnace was started to
reduce the oxygen partial pressure to negligible levels prior to exposure.
23
Figure 13. Experimental setup for the experiments run in 3% H2 - 34% H2O atmosphere.
3.2.3 Chromium evaporation
Chromium evaporation has been measured in 100%, 50% and 25% oxygen atmospheres to
study the dependence on oxygen partial pressure. Three samples of Crofer 22H were used in
each test and the exposures were run continuously for 168h. After exposure after the amount of
collected volatile chromium species was measured. The samples were also weighed before and
after exposure. Two exposures in 25% oxygen were performed and three in 50%. Due to lack of
equipment and project time one exposure was performed in 100% oxygen.
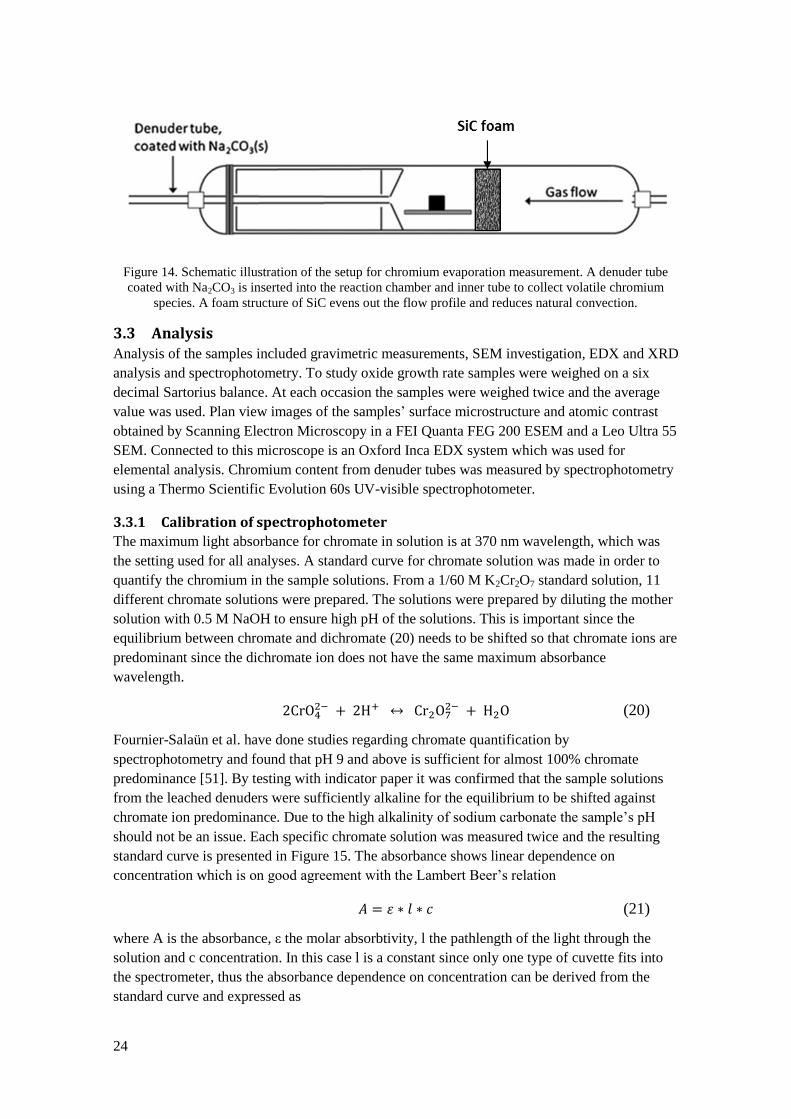
The setup for the chromium evaporation experiments was the same as the system presented in
Figure 12 but also included a 6 mm inner diameter alumina denuder tube downstream of the
samples (see Figure 14). The denuder tube was coated with Na2CO3 in order to collect volatile
chromium species according to the following reactions:
(18)
(19)
The tube was subsequently rinsed with MQ water to leach out the deposited sodium chromate
which was quantified by spectrophotometry. A more detailed description of the denuder
technique can be found elsewhere [50].
24
Figure 14. Schematic illustration of the setup for chromium evaporation measurement. A denuder tube
coated with Na2CO3 is inserted into the reaction chamber and inner tube to collect volatile chromium
species. A foam structure of SiC evens out the flow profile and reduces natural convection.
3.3 Analysis Analysis of the samples included gravimetric measurements, SEM investigation, EDX and XRD
analysis and spectrophotometry. To study oxide growth rate samples were weighed on a six
decimal Sartorius balance. At each occasion the samples were weighed twice and the average
value was used. Plan view images of the samples’ surface microstructure and atomic contrast
obtained by Scanning Electron Microscopy in a FEI Quanta FEG 200 ESEM and a Leo Ultra 55
SEM. Connected to this microscope is an Oxford Inca EDX system which was used for
elemental analysis. Chromium content from denuder tubes was measured by spectrophotometry
using a Thermo Scientific Evolution 60s UV-visible spectrophotometer.
3.3.1 Calibration of spectrophotometer
The maximum light absorbance for chromate in solution is at 370 nm wavelength, which was
the setting used for all analyses. A standard curve for chromate solution was made in order to
quantify the chromium in the sample solutions. From a 1/60 M K2Cr2O7 standard solution, 11
different chromate solutions were prepared. The solutions were prepared by diluting the mother
solution with 0.5 M NaOH to ensure high pH of the solutions. This is important since the
equilibrium between chromate and dichromate (20) needs to be shifted so that chromate ions are
predominant since the dichromate ion does not have the same maximum absorbance
wavelength.
(20)
Fournier-Salaün et al. have done studies regarding chromate quantification by
spectrophotometry and found that pH 9 and above is sufficient for almost 100% chromate
predominance [51]. By testing with indicator paper it was confirmed that the sample solutions
from the leached denuders were sufficiently alkaline for the equilibrium to be shifted against
chromate ion predominance. Due to the high alkalinity of sodium carbonate the sample’s pH
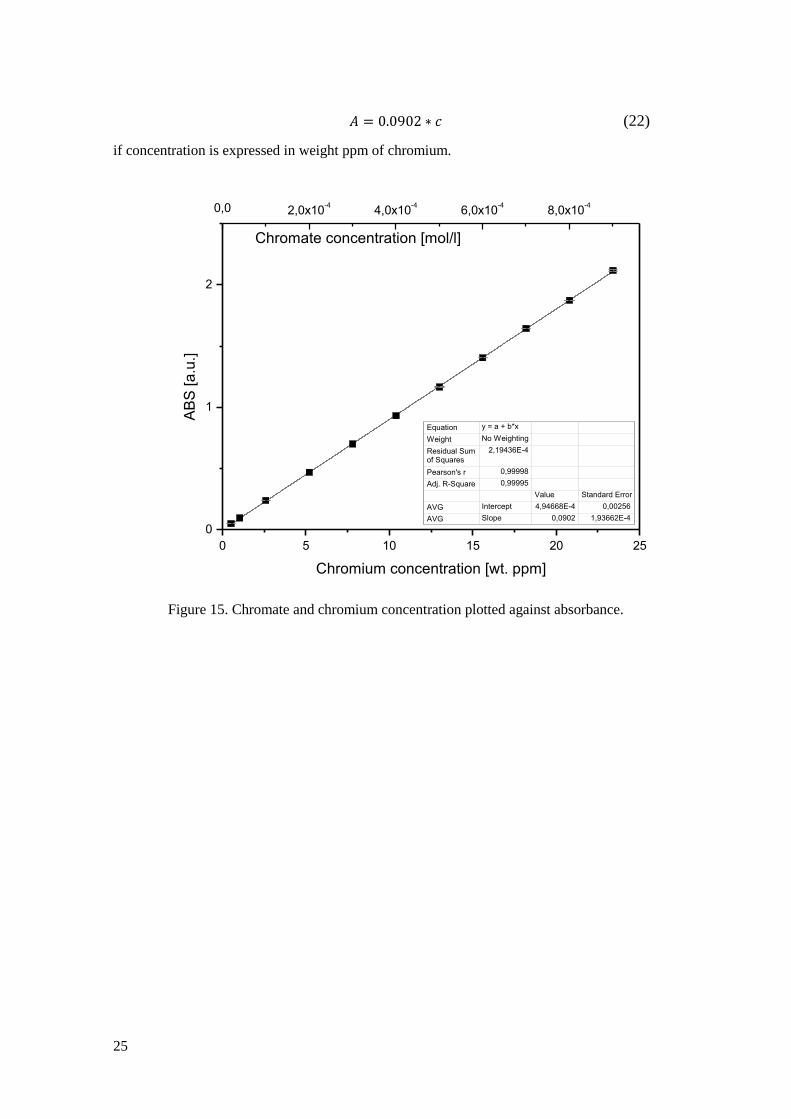
should not be an issue. Each specific chromate solution was measured twice and the resulting
standard curve is presented in Figure 15. The absorbance shows linear dependence on
concentration which is on good agreement with the Lambert Beer’s relation
(21)
where A is the absorbance, ε the molar absorbtivity, l the pathlength of the light through the
solution and c concentration. In this case l is a constant since only one type of cuvette fits into
the spectrometer, thus the absorbance dependence on concentration can be derived from the
standard curve and expressed as
25
(22)
if concentration is expressed in weight ppm of chromium.
0 5 10 15 20 25
0
1
2
AB
S [a
.u.]
Chromium concentration [wt. ppm]
Equation y = a + b*x
Weight No Weighting
Residual Sum of Squares
2,19436E-4
Pearson's r 0,99998
Adj. R-Square 0,99995
Value Standard Error
AVG Intercept 4,94668E-4 0,00256
AVG Slope 0,0902 1,93662E-4
0,0 2,0x10⁻⁴
4,0x10⁻⁴
6,0x10⁻⁴
8,0x10⁻⁴
Chromate concentration [mol/l]
Figure 15. Chromate and chromium concentration plotted against absorbance.
26
4 Results
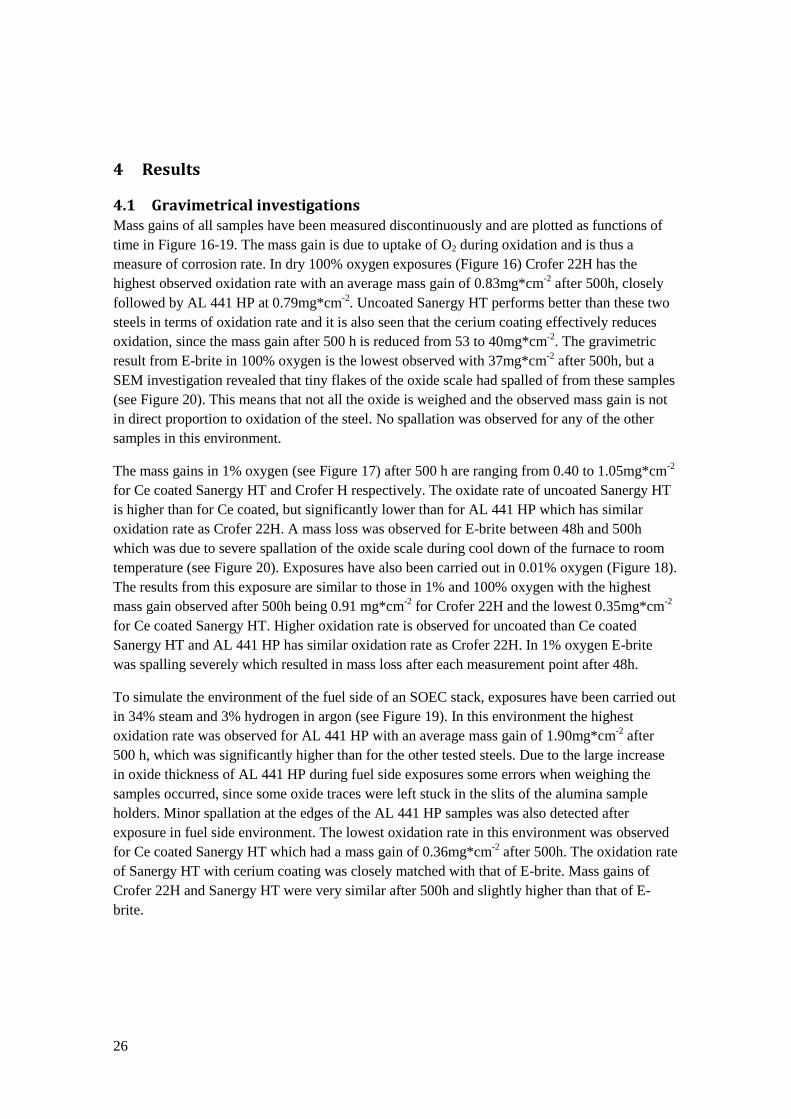
4.1 Gravimetrical investigations Mass gains of all samples have been measured discontinuously and are plotted as functions of
time in Figure 16-19. The mass gain is due to uptake of O2 during oxidation and is thus a
measure of corrosion rate. In dry 100% oxygen exposures (Figure 16) Crofer 22H has the
highest observed oxidation rate with an average mass gain of 0.83mg*cm-2
after 500h, closely
followed by AL 441 HP at 0.79mg*cm-2
. Uncoated Sanergy HT performs better than these two
steels in terms of oxidation rate and it is also seen that the cerium coating effectively reduces
oxidation, since the mass gain after 500 h is reduced from 53 to 40mg*cm-2
. The gravimetric
result from E-brite in 100% oxygen is the lowest observed with 37mg*cm-2
after 500h, but a
SEM investigation revealed that tiny flakes of the oxide scale had spalled of from these samples
(see Figure 20). This means that not all the oxide is weighed and the observed mass gain is not
in direct proportion to oxidation of the steel. No spallation was observed for any of the other
samples in this environment.
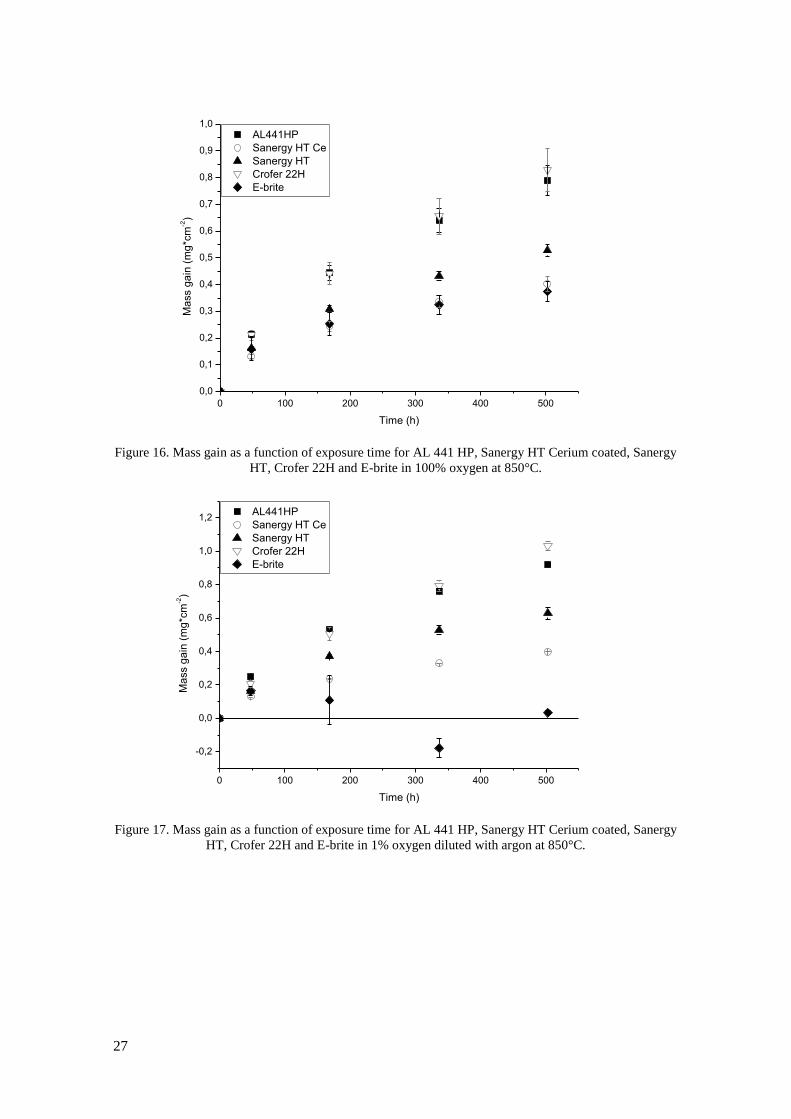
The mass gains in 1% oxygen (see Figure 17) after 500 h are ranging from 0.40 to 1.05mg*cm-2
for Ce coated Sanergy HT and Crofer H respectively. The oxidate rate of uncoated Sanergy HT
is higher than for Ce coated, but significantly lower than for AL 441 HP which has similar
oxidation rate as Crofer 22H. A mass loss was observed for E-brite between 48h and 500h
which was due to severe spallation of the oxide scale during cool down of the furnace to room
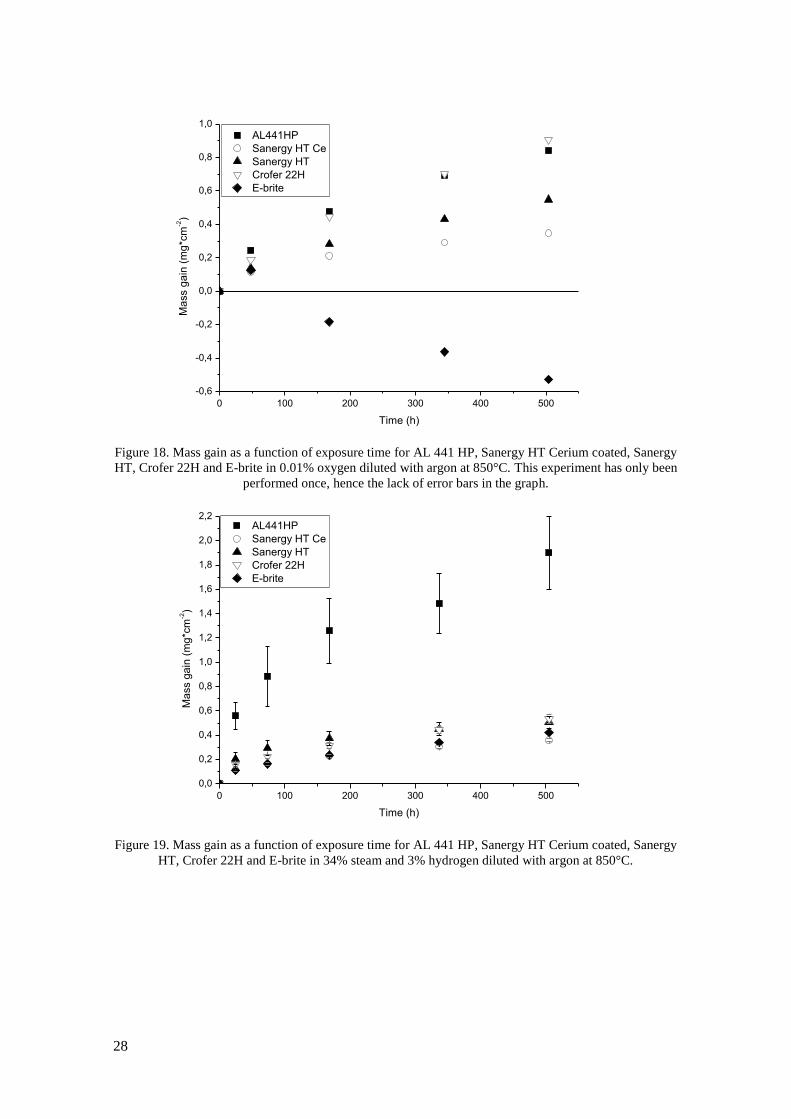
temperature (see Figure 20). Exposures have also been carried out in 0.01% oxygen (Figure 18).
The results from this exposure are similar to those in 1% and 100% oxygen with the highest
mass gain observed after 500h being 0.91 mg*cm-2
for Crofer 22H and the lowest 0.35mg*cm-2
for Ce coated Sanergy HT. Higher oxidation rate is observed for uncoated than Ce coated
Sanergy HT and AL 441 HP has similar oxidation rate as Crofer 22H. In 1% oxygen E-brite
was spalling severely which resulted in mass loss after each measurement point after 48h.
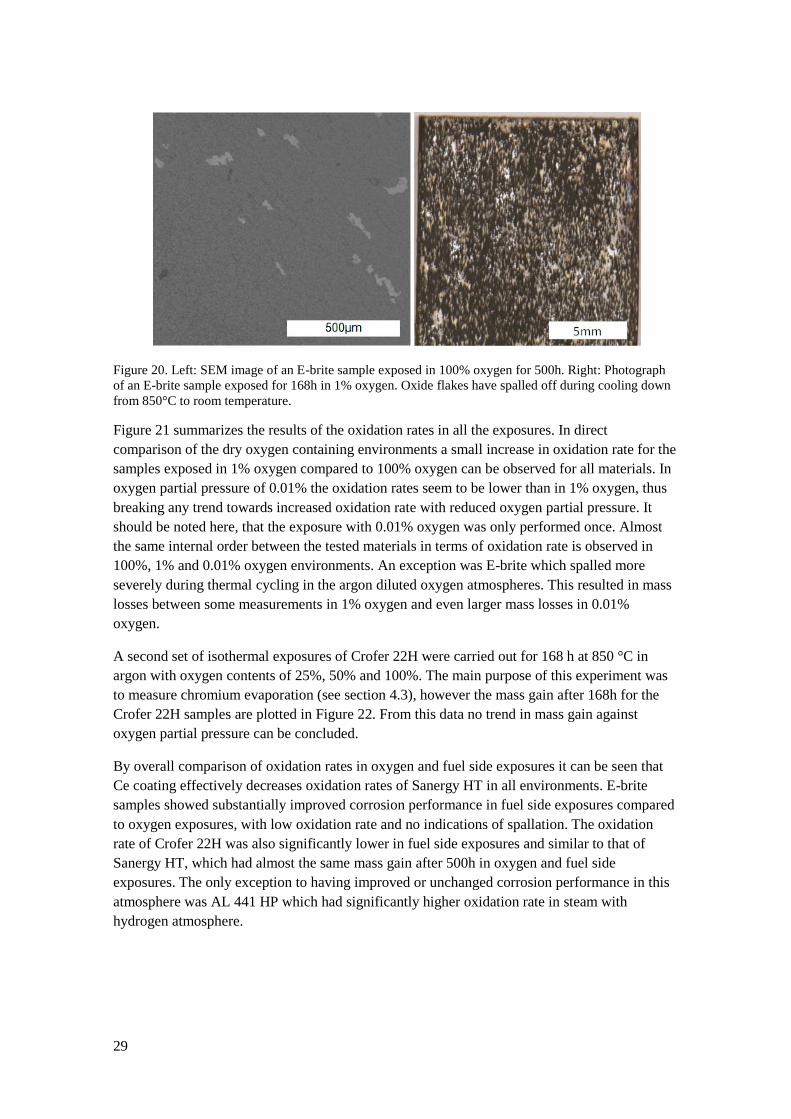
To simulate the environment of the fuel side of an SOEC stack, exposures have been carried out
in 34% steam and 3% hydrogen in argon (see Figure 19). In this environment the highest
oxidation rate was observed for AL 441 HP with an average mass gain of 1.90mg*cm-2
after
500 h, which was significantly higher than for the other tested steels. Due to the large increase
in oxide thickness of AL 441 HP during fuel side exposures some errors when weighing the
samples occurred, since some oxide traces were left stuck in the slits of the alumina sample
holders. Minor spallation at the edges of the AL 441 HP samples was also detected after
exposure in fuel side environment. The lowest oxidation rate in this environment was observed
for Ce coated Sanergy HT which had a mass gain of 0.36mg*cm-2
after 500h. The oxidation rate
of Sanergy HT with cerium coating was closely matched with that of E-brite. Mass gains of
Crofer 22H and Sanergy HT were very similar after 500h and slightly higher than that of E-
brite.
27
0 100 200 300 400 500
0,0
0,1
0,2
0,3
0,4
0,5
0,6
0,7
0,8
0,9
1,0 AL441HP
Sanergy HT Ce
Sanergy HT
Crofer 22H
E-briteM
ass g
ain
(m
g*c
m-2)
Time (h)
Figure 16. Mass gain as a function of exposure time for AL 441 HP, Sanergy HT Cerium coated, Sanergy
HT, Crofer 22H and E-brite in 100% oxygen at 850°C.
0 100 200 300 400 500
-0,2
0,0
0,2
0,4
0,6
0,8
1,0
1,2 AL441HP
Sanergy HT Ce
Sanergy HT
Crofer 22H
E-brite
Ma
ss g
ain
(m
g*c
m-2)
Time (h)
Figure 17. Mass gain as a function of exposure time for AL 441 HP, Sanergy HT Cerium coated, Sanergy
HT, Crofer 22H and E-brite in 1% oxygen diluted with argon at 850°C.
28
0 100 200 300 400 500
-0,6
-0,4
-0,2
0,0
0,2
0,4
0,6
0,8
1,0
AL441HP
Sanergy HT Ce
Sanergy HT
Crofer 22H
E-briteM
ass g
ain
(m
g*c
m-2)
Time (h)
Figure 18. Mass gain as a function of exposure time for AL 441 HP, Sanergy HT Cerium coated, Sanergy
HT, Crofer 22H and E-brite in 0.01% oxygen diluted with argon at 850°C. This experiment has only been
performed once, hence the lack of error bars in the graph.
0 100 200 300 400 500
0,0
0,2
0,4
0,6
0,8
1,0
1,2
1,4
1,6
1,8
2,0
2,2 AL441HP
Sanergy HT Ce
Sanergy HT
Crofer 22H
E-brite
Ma
ss g
ain
(m
g*c
m-2)
Time (h)
Figure 19. Mass gain as a function of exposure time for AL 441 HP, Sanergy HT Cerium coated, Sanergy
HT, Crofer 22H and E-brite in 34% steam and 3% hydrogen diluted with argon at 850°C.
29
Figure 20. Left: SEM image of an E-brite sample exposed in 100% oxygen for 500h. Right: Photograph
of an E-brite sample exposed for 168h in 1% oxygen. Oxide flakes have spalled off during cooling down
from 850°C to room temperature.
Figure 21 summarizes the results of the oxidation rates in all the exposures. In direct
comparison of the dry oxygen containing environments a small increase in oxidation rate for the
samples exposed in 1% oxygen compared to 100% oxygen can be observed for all materials. In
oxygen partial pressure of 0.01% the oxidation rates seem to be lower than in 1% oxygen, thus
breaking any trend towards increased oxidation rate with reduced oxygen partial pressure. It
should be noted here, that the exposure with 0.01% oxygen was only performed once. Almost
the same internal order between the tested materials in terms of oxidation rate is observed in
100%, 1% and 0.01% oxygen environments. An exception was E-brite which spalled more
severely during thermal cycling in the argon diluted oxygen atmospheres. This resulted in mass
losses between some measurements in 1% oxygen and even larger mass losses in 0.01%
oxygen.
A second set of isothermal exposures of Crofer 22H were carried out for 168 h at 850 °C in
argon with oxygen contents of 25%, 50% and 100%. The main purpose of this experiment was
to measure chromium evaporation (see section 4.3), however the mass gain after 168h for the
Crofer 22H samples are plotted in Figure 22. From this data no trend in mass gain against
oxygen partial pressure can be concluded.
By overall comparison of oxidation rates in oxygen and fuel side exposures it can be seen that
Ce coating effectively decreases oxidation rates of Sanergy HT in all environments. E-brite
samples showed substantially improved corrosion performance in fuel side exposures compared
to oxygen exposures, with low oxidation rate and no indications of spallation. The oxidation
rate of Crofer 22H was also significantly lower in fuel side exposures and similar to that of
Sanergy HT, which had almost the same mass gain after 500h in oxygen and fuel side
exposures. The only exception to having improved or unchanged corrosion performance in this
atmosphere was AL 441 HP which had significantly higher oxidation rate in steam with
hydrogen atmosphere.
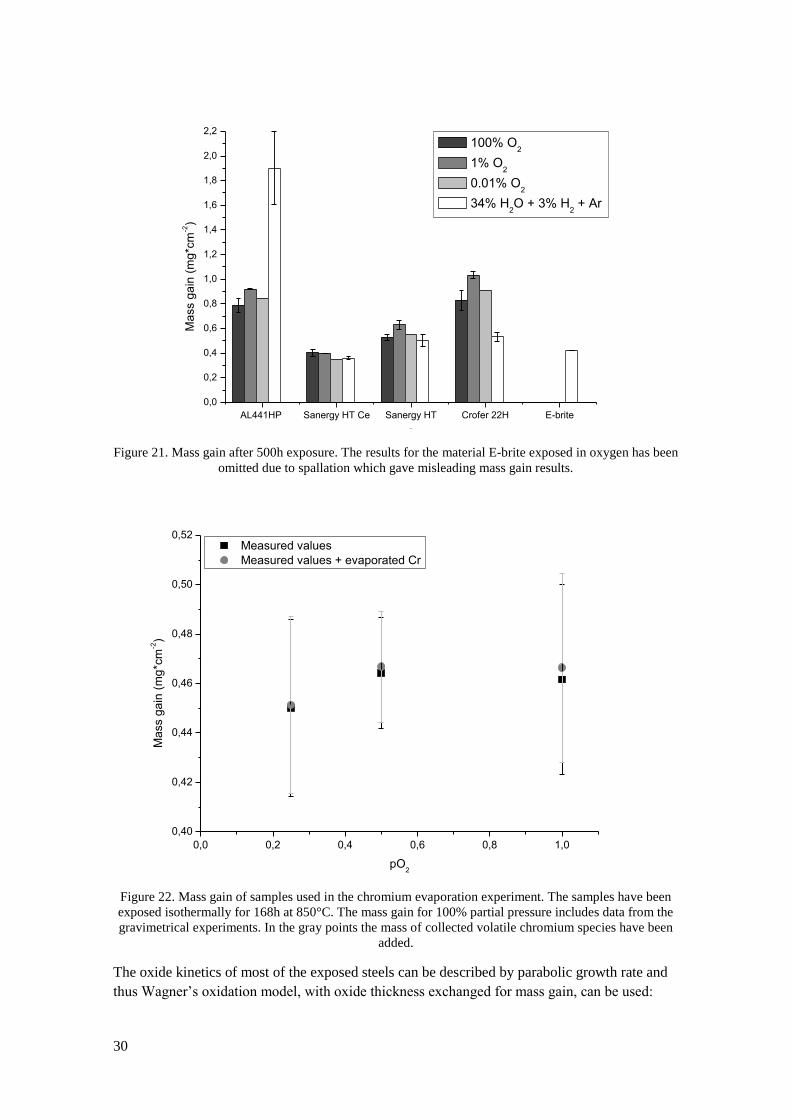
30
AL441HP Sanergy HT Ce Sanergy HT Crofer 22H E-brite
0,0
0,2
0,4
0,6
0,8
1,0
1,2
1,4
1,6
1,8
2,0
2,2
100% O2
1% O2
0.01% O2
34% H2O + 3% H
2 + Ar
Ma
ss g
ain
(m
g*c
m-2)
A
Figure 21. Mass gain after 500h exposure. The results for the material E-brite exposed in oxygen has been
omitted due to spallation which gave misleading mass gain results.
0,0 0,2 0,4 0,6 0,8 1,0
0,40
0,42
0,44
0,46
0,48
0,50
0,52 Measured values
Measured values + evaporated Cr
Ma
ss g
ain
(m
g*c
m-2)
pO2
Figure 22. Mass gain of samples used in the chromium evaporation experiment. The samples have been
exposed isothermally for 168h at 850°C. The mass gain for 100% partial pressure includes data from the
gravimetrical experiments. In the gray points the mass of collected volatile chromium species have been
added.
The oxide kinetics of most of the exposed steels can be described by parabolic growth rate and
thus Wagner’s oxidation model, with oxide thickness exchanged for mass gain, can be used:
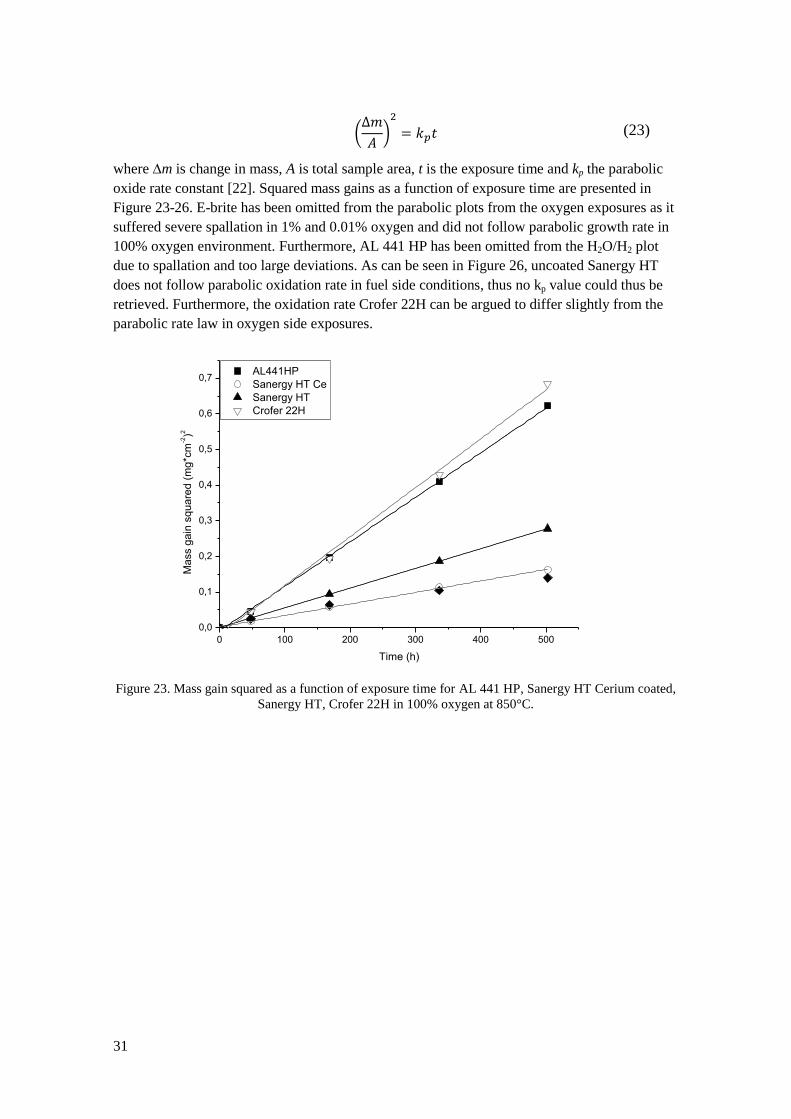
31
(23)
where ∆m is change in mass, A is total sample area, t is the exposure time and kp the parabolic
oxide rate constant [22]. Squared mass gains as a function of exposure time are presented in
Figure 23-26. E-brite has been omitted from the parabolic plots from the oxygen exposures as it
suffered severe spallation in 1% and 0.01% oxygen and did not follow parabolic growth rate in
100% oxygen environment. Furthermore, AL 441 HP has been omitted from the H2O/H2 plot
due to spallation and too large deviations. As can be seen in Figure 26, uncoated Sanergy HT
does not follow parabolic oxidation rate in fuel side conditions, thus no kp value could thus be
retrieved. Furthermore, the oxidation rate Crofer 22H can be argued to differ slightly from the
parabolic rate law in oxygen side exposures.
0 100 200 300 400 500
0,0
0,1
0,2
0,3
0,4
0,5
0,6
0,7 AL441HP
Sanergy HT Ce
Sanergy HT
Crofer 22H
Ma
ss g
ain
sq
ua
red
(m
g*c
m-2)2
Time (h)
Figure 23. Mass gain squared as a function of exposure time for AL 441 HP, Sanergy HT Cerium coated,
Sanergy HT, Crofer 22H in 100% oxygen at 850°C.
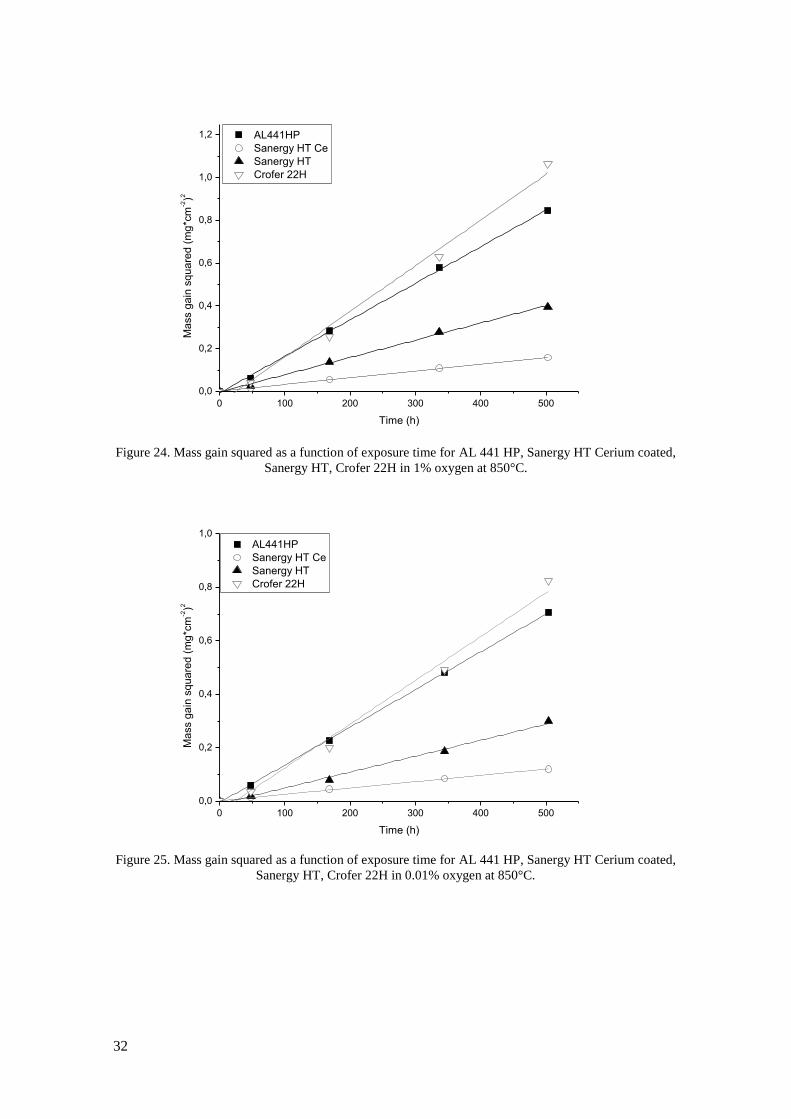
32
0 100 200 300 400 500
0,0
0,2
0,4
0,6
0,8
1,0
1,2 AL441HP
Sanergy HT Ce
Sanergy HT
Crofer 22HM
ass g
ain
sq
ua
red
(m
g*c
m-2)2
Time (h)
Figure 24. Mass gain squared as a function of exposure time for AL 441 HP, Sanergy HT Cerium coated,
Sanergy HT, Crofer 22H in 1% oxygen at 850°C.
0 100 200 300 400 500
0,0
0,2
0,4
0,6
0,8
1,0 AL441HP
Sanergy HT Ce
Sanergy HT
Crofer 22H
Ma
ss g
ain
sq
ua
red
(m
g*c
m-2)2
Time (h)
Figure 25. Mass gain squared as a function of exposure time for AL 441 HP, Sanergy HT Cerium coated,
Sanergy HT, Crofer 22H in 0.01% oxygen at 850°C.
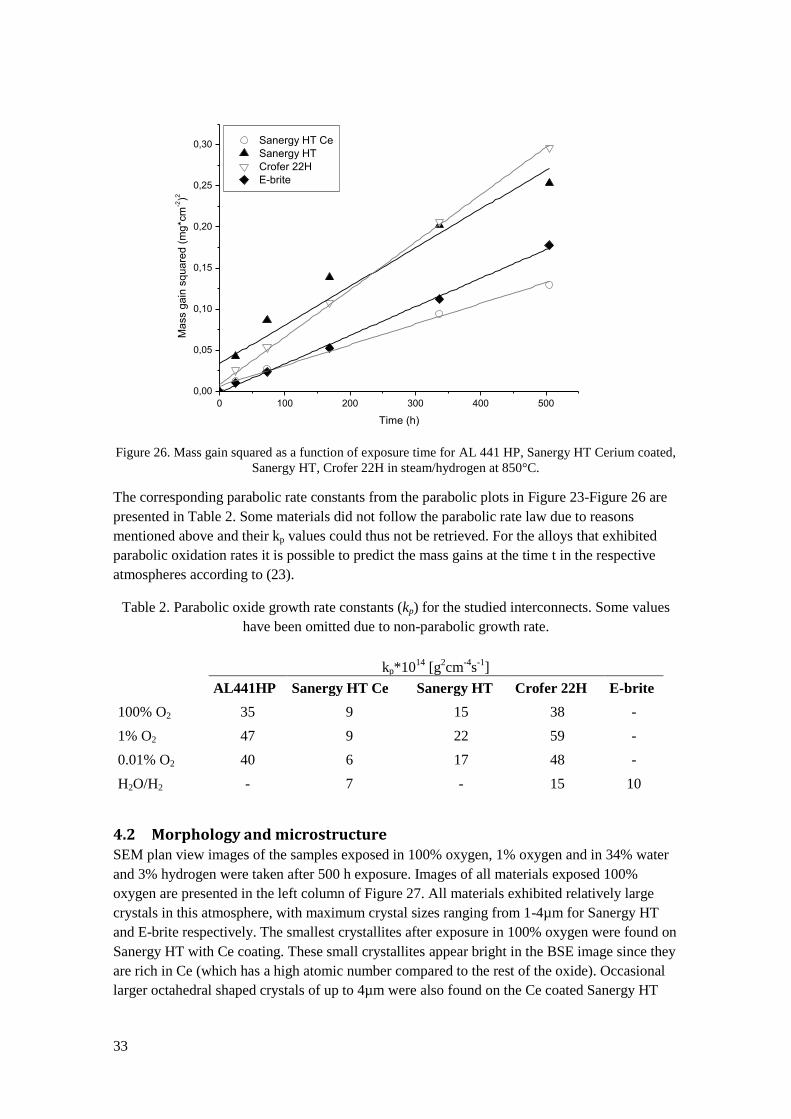
33
0 100 200 300 400 500
0,00
0,05
0,10
0,15
0,20
0,25
0,30 Sanergy HT Ce
Sanergy HT
Crofer 22H
E-briteM
ass g
ain
sq
ua
red
(m
g*c
m-2)2
Time (h)
Figure 26. Mass gain squared as a function of exposure time for AL 441 HP, Sanergy HT Cerium coated,
Sanergy HT, Crofer 22H in steam/hydrogen at 850°C.
The corresponding parabolic rate constants from the parabolic plots in Figure 23-Figure 26 are
presented in Table 2. Some materials did not follow the parabolic rate law due to reasons
mentioned above and their kp values could thus not be retrieved. For the alloys that exhibited
parabolic oxidation rates it is possible to predict the mass gains at the time t in the respective
atmospheres according to (23).
Table 2. Parabolic oxide growth rate constants (kp) for the studied interconnects. Some values
have been omitted due to non-parabolic growth rate.
kp*1014
[g2cm
-4s
-1]
AL441HP Sanergy HT Ce Sanergy HT Crofer 22H E-brite
100% O2 35 9 15 38 -
1% O2 47 9 22 59 -
0.01% O2 40 6 17 48 -
H2O/H2 - 7 - 15 10
4.2 Morphology and microstructure SEM plan view images of the samples exposed in 100% oxygen, 1% oxygen and in 34% water
and 3% hydrogen were taken after 500 h exposure. Images of all materials exposed 100%
oxygen are presented in the left column of Figure 27. All materials exhibited relatively large
crystals in this atmosphere, with maximum crystal sizes ranging from 1-4µm for Sanergy HT
and E-brite respectively. The smallest crystallites after exposure in 100% oxygen were found on
Sanergy HT with Ce coating. These small crystallites appear bright in the BSE image since they
are rich in Ce (which has a high atomic number compared to the rest of the oxide). Occasional
larger octahedral shaped crystals of up to 4µm were also found on the Ce coated Sanergy HT
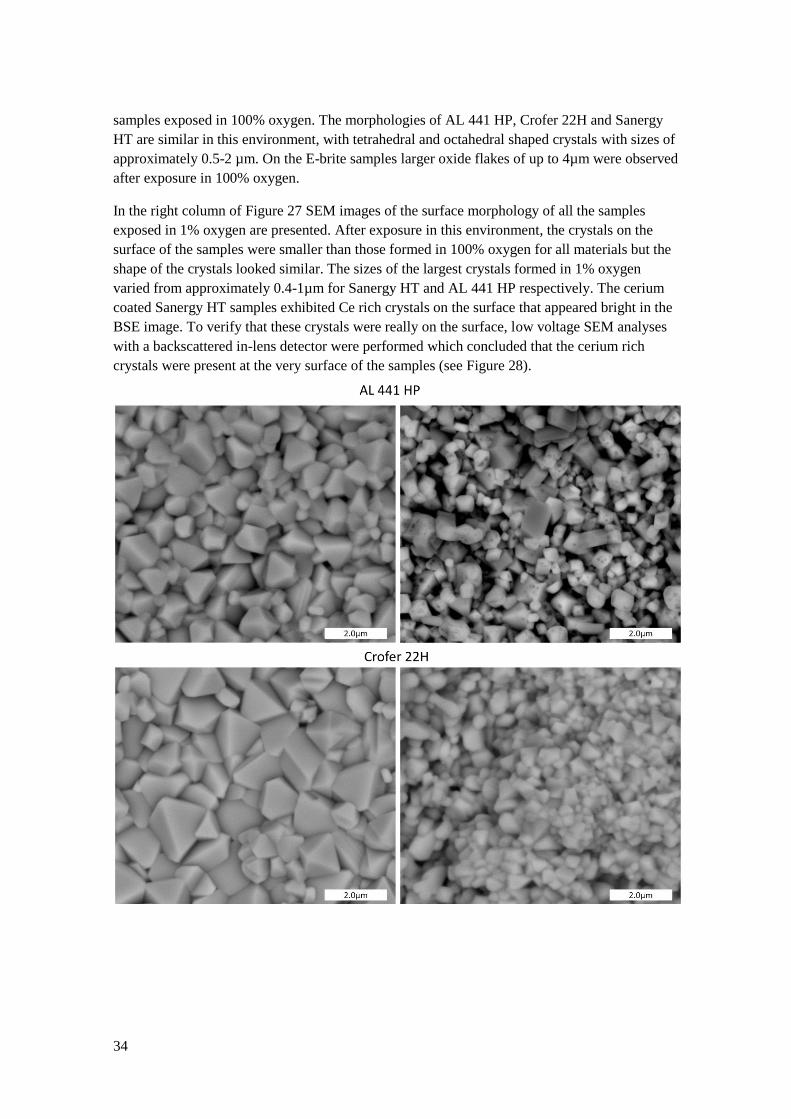
34
samples exposed in 100% oxygen. The morphologies of AL 441 HP, Crofer 22H and Sanergy
HT are similar in this environment, with tetrahedral and octahedral shaped crystals with sizes of
approximately 0.5-2 µm. On the E-brite samples larger oxide flakes of up to 4µm were observed
after exposure in 100% oxygen.
In the right column of Figure 27 SEM images of the surface morphology of all the samples
exposed in 1% oxygen are presented. After exposure in this environment, the crystals on the
surface of the samples were smaller than those formed in 100% oxygen for all materials but the
shape of the crystals looked similar. The sizes of the largest crystals formed in 1% oxygen
varied from approximately 0.4-1µm for Sanergy HT and AL 441 HP respectively. The cerium
coated Sanergy HT samples exhibited Ce rich crystals on the surface that appeared bright in the
BSE image. To verify that these crystals were really on the surface, low voltage SEM analyses
with a backscattered in-lens detector were performed which concluded that the cerium rich
crystals were present at the very surface of the samples (see Figure 28).
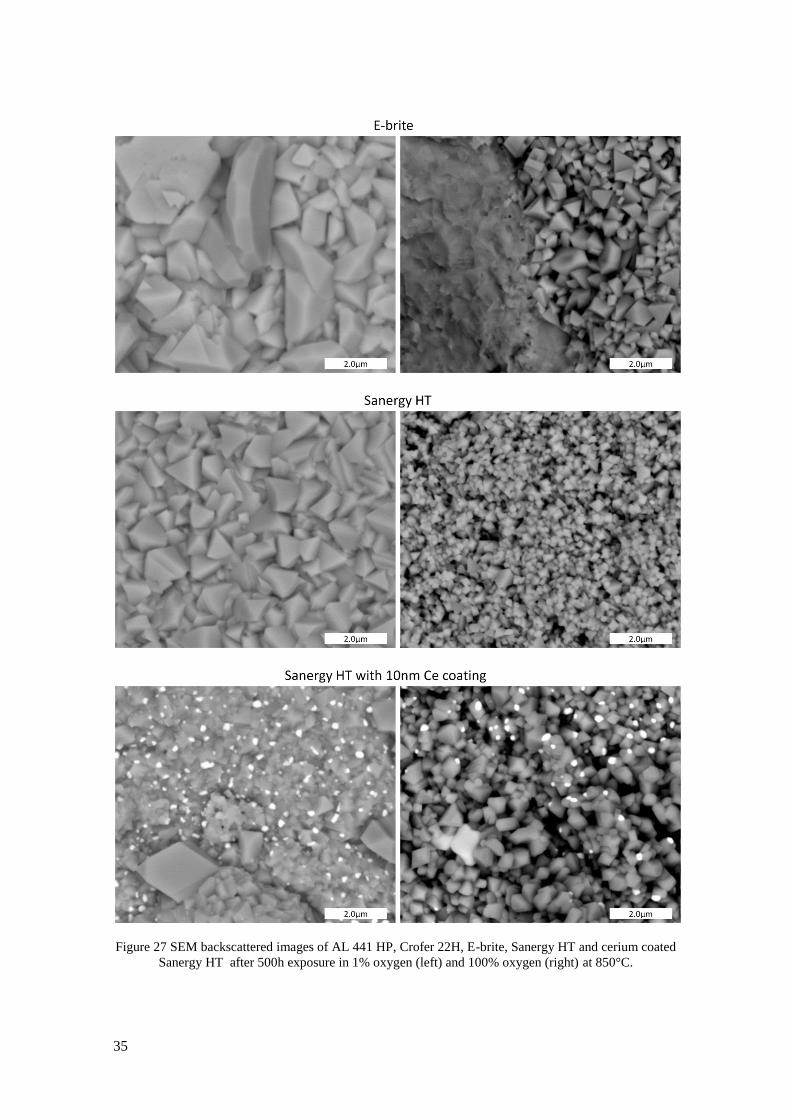
35
Figure 27 SEM backscattered images of AL 441 HP, Crofer 22H, E-brite, Sanergy HT and cerium coated
Sanergy HT after 500h exposure in 1% oxygen (left) and 100% oxygen (right) at 850°C.
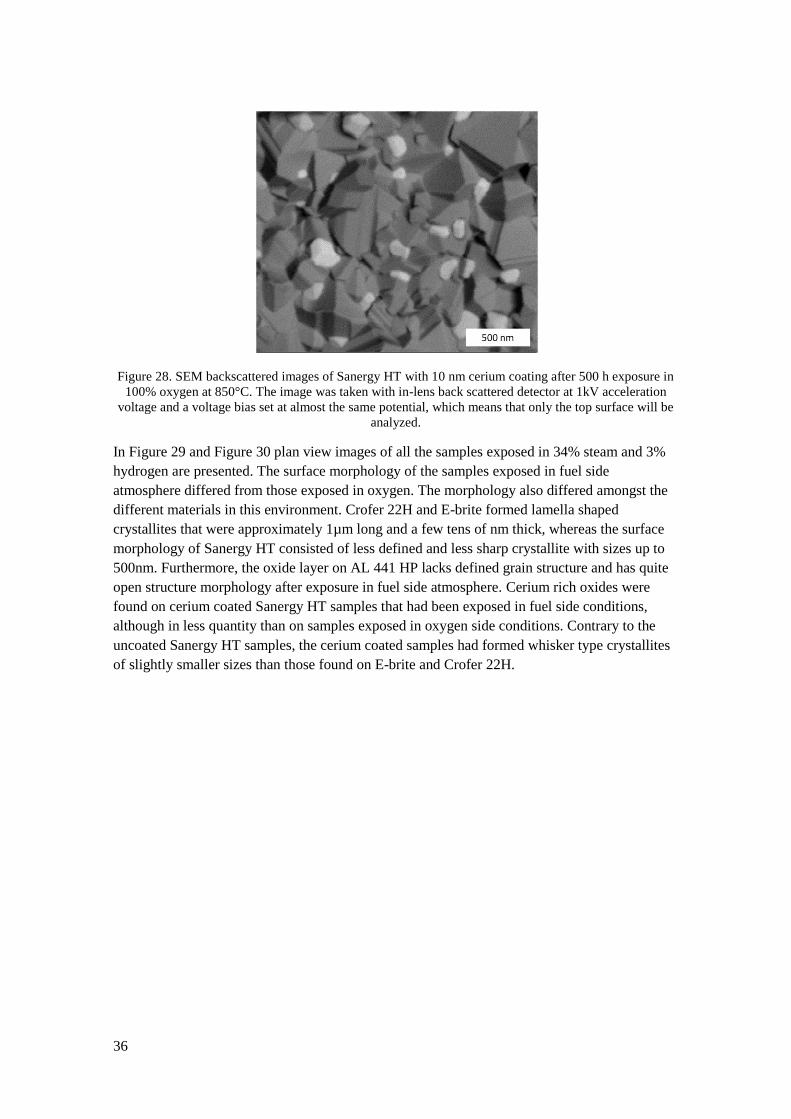
36
Figure 28. SEM backscattered images of Sanergy HT with 10 nm cerium coating after 500 h exposure in
100% oxygen at 850°C. The image was taken with in-lens back scattered detector at 1kV acceleration
voltage and a voltage bias set at almost the same potential, which means that only the top surface will be
analyzed.
In Figure 29 and Figure 30 plan view images of all the samples exposed in 34% steam and 3%
hydrogen are presented. The surface morphology of the samples exposed in fuel side
atmosphere differed from those exposed in oxygen. The morphology also differed amongst the
different materials in this environment. Crofer 22H and E-brite formed lamella shaped
crystallites that were approximately 1µm long and a few tens of nm thick, whereas the surface
morphology of Sanergy HT consisted of less defined and less sharp crystallite with sizes up to
500nm. Furthermore, the oxide layer on AL 441 HP lacks defined grain structure and has quite
open structure morphology after exposure in fuel side atmosphere. Cerium rich oxides were
found on cerium coated Sanergy HT samples that had been exposed in fuel side conditions,
although in less quantity than on samples exposed in oxygen side conditions. Contrary to the
uncoated Sanergy HT samples, the cerium coated samples had formed whisker type crystallites
of slightly smaller sizes than those found on E-brite and Crofer 22H.
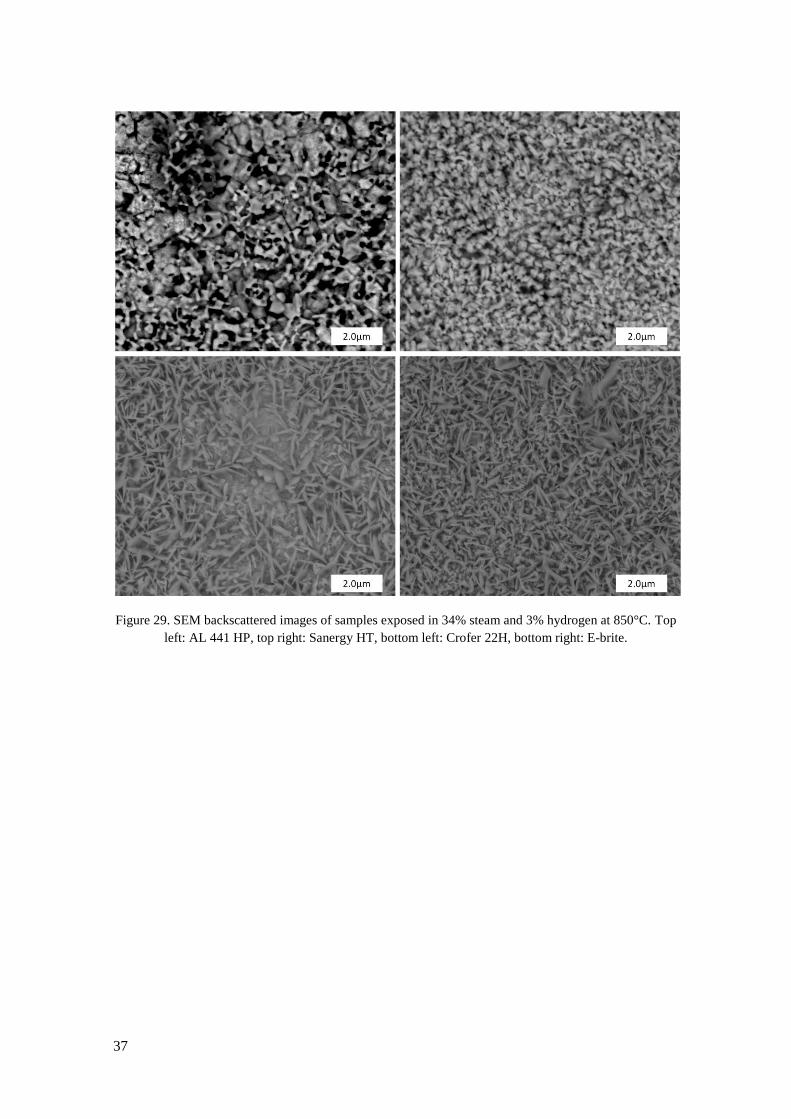
37
Figure 29. SEM backscattered images of samples exposed in 34% steam and 3% hydrogen at 850°C. Top
left: AL 441 HP, top right: Sanergy HT, bottom left: Crofer 22H, bottom right: E-brite.
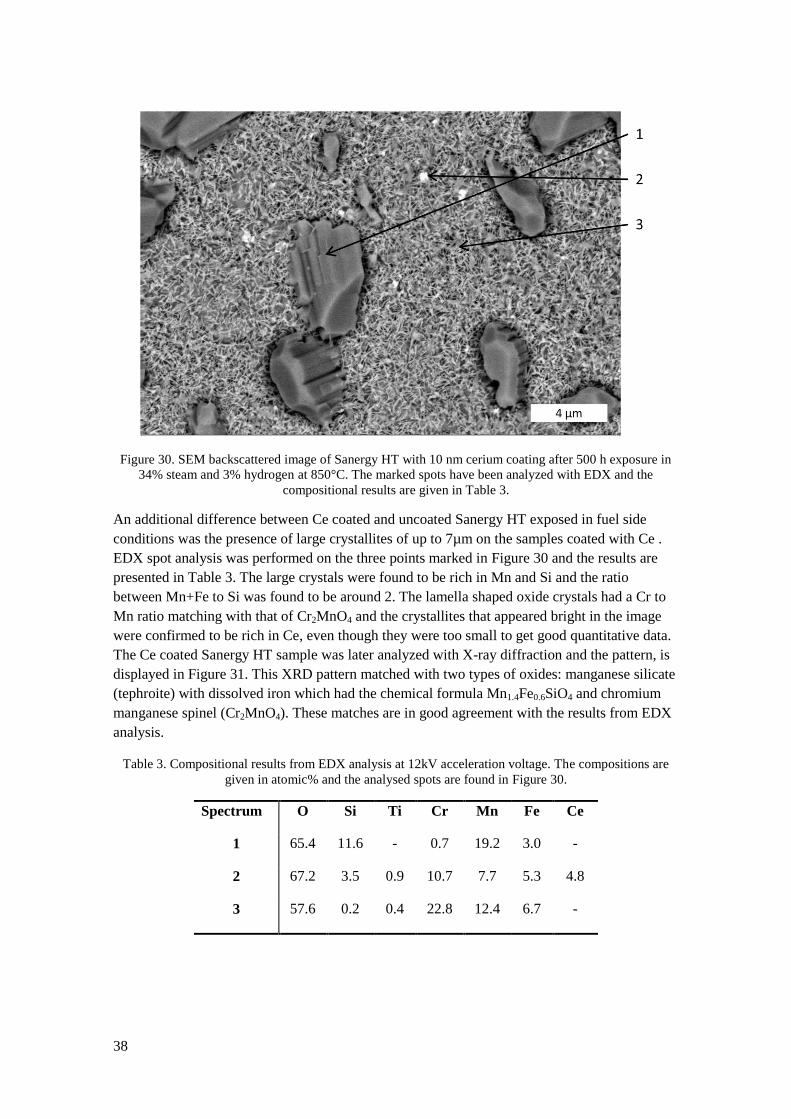
38
Figure 30. SEM backscattered image of Sanergy HT with 10 nm cerium coating after 500 h exposure in
34% steam and 3% hydrogen at 850°C. The marked spots have been analyzed with EDX and the
compositional results are given in Table 3.
An additional difference between Ce coated and uncoated Sanergy HT exposed in fuel side
conditions was the presence of large crystallites of up to 7µm on the samples coated with Ce .
EDX spot analysis was performed on the three points marked in Figure 30 and the results are
presented in Table 3. The large crystals were found to be rich in Mn and Si and the ratio
between Mn+Fe to Si was found to be around 2. The lamella shaped oxide crystals had a Cr to
Mn ratio matching with that of Cr2MnO4 and the crystallites that appeared bright in the image
were confirmed to be rich in Ce, even though they were too small to get good quantitative data.
The Ce coated Sanergy HT sample was later analyzed with X-ray diffraction and the pattern, is
displayed in Figure 31. This XRD pattern matched with two types of oxides: manganese silicate
(tephroite) with dissolved iron which had the chemical formula Mn1.4Fe0.6SiO4 and chromium
manganese spinel (Cr2MnO4). These matches are in good agreement with the results from EDX
analysis.
Table 3. Compositional results from EDX analysis at 12kV acceleration voltage. The compositions are
given in atomic% and the analysed spots are found in Figure 30.
Spectrum O Si Ti Cr Mn Fe Ce
1 65.4 11.6 - 0.7 19.2 3.0 -
2 67.2 3.5 0.9 10.7 7.7 5.3 4.8
3 57.6 0.2 0.4 22.8 12.4 6.7 -
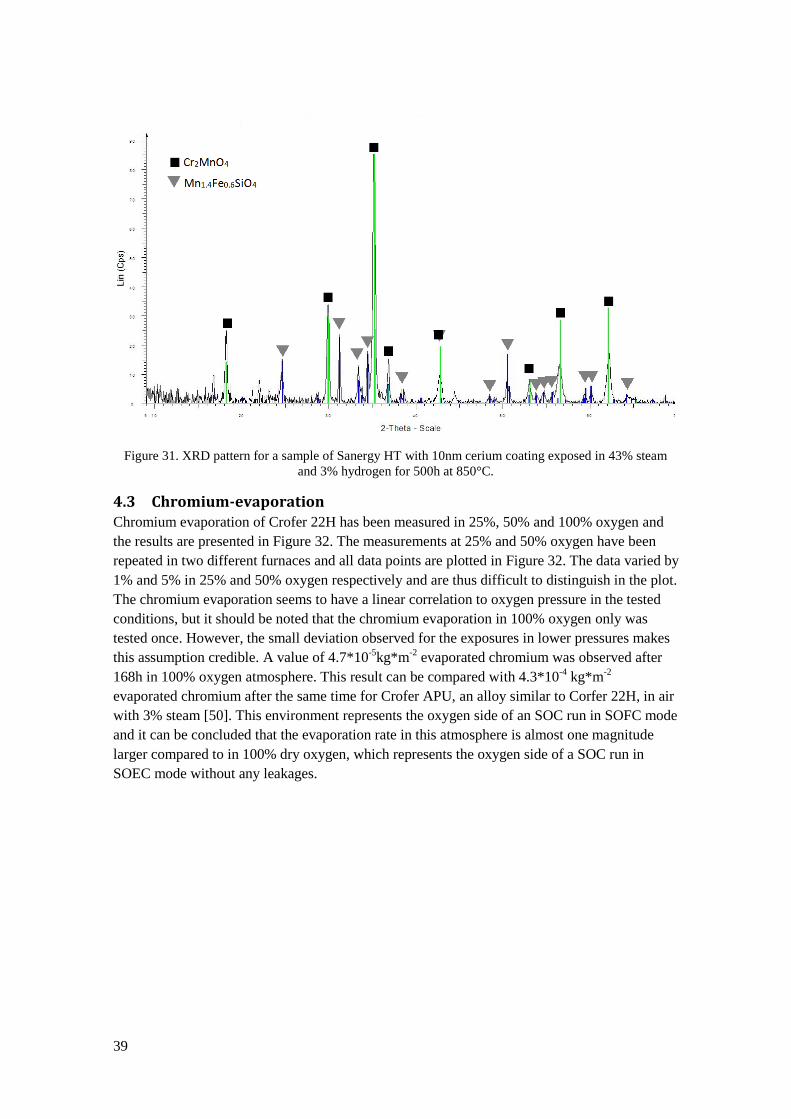
39
Figure 31. XRD pattern for a sample of Sanergy HT with 10nm cerium coating exposed in 43% steam
and 3% hydrogen for 500h at 850°C.
4.3 Chromium-evaporation Chromium evaporation of Crofer 22H has been measured in 25%, 50% and 100% oxygen and
the results are presented in Figure 32. The measurements at 25% and 50% oxygen have been
repeated in two different furnaces and all data points are plotted in Figure 32. The data varied by
1% and 5% in 25% and 50% oxygen respectively and are thus difficult to distinguish in the plot.
The chromium evaporation seems to have a linear correlation to oxygen pressure in the tested
conditions, but it should be noted that the chromium evaporation in 100% oxygen only was
tested once. However, the small deviation observed for the exposures in lower pressures makes
this assumption credible. A value of 4.7*10-5
kg*m-2
evaporated chromium was observed after
168h in 100% oxygen atmosphere. This result can be compared with 4.3*10-4
kg*m-2
evaporated chromium after the same time for Crofer APU, an alloy similar to Corfer 22H, in air
with 3% steam [50]. This environment represents the oxygen side of an SOC run in SOFC mode
and it can be concluded that the evaporation rate in this atmosphere is almost one magnitude
larger compared to in 100% dry oxygen, which represents the oxygen side of a SOC run in
SOEC mode without any leakages.
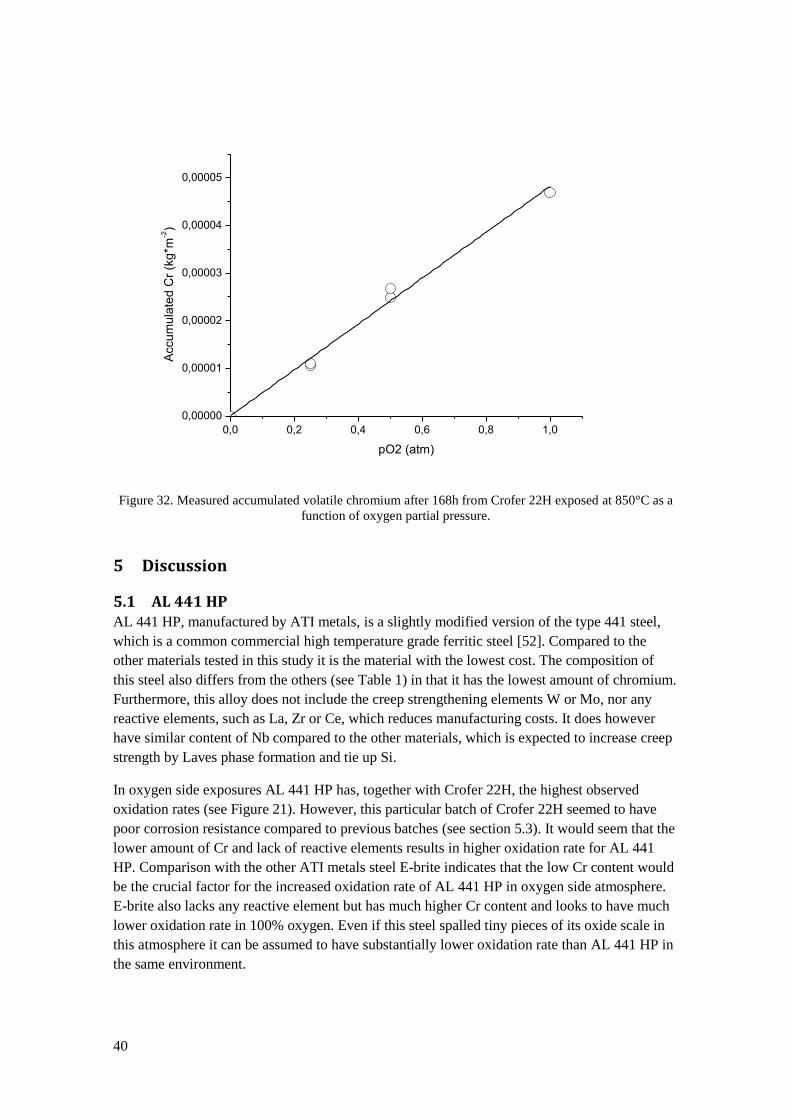
40
0,0 0,2 0,4 0,6 0,8 1,0
0,00000
0,00001
0,00002
0,00003
0,00004
0,00005A
ccu
mu
late
d C
r (k
g*m
-2)
pO2 (atm)
Figure 32. Measured accumulated volatile chromium after 168h from Crofer 22H exposed at 850°C as a
function of oxygen partial pressure.
5 Discussion
5.1 AL 441 HP AL 441 HP, manufactured by ATI metals, is a slightly modified version of the type 441 steel,
which is a common commercial high temperature grade ferritic steel [52]. Compared to the
other materials tested in this study it is the material with the lowest cost. The composition of
this steel also differs from the others (see Table 1) in that it has the lowest amount of chromium.
Furthermore, this alloy does not include the creep strengthening elements W or Mo, nor any
reactive elements, such as La, Zr or Ce, which reduces manufacturing costs. It does however
have similar content of Nb compared to the other materials, which is expected to increase creep
strength by Laves phase formation and tie up Si.
In oxygen side exposures AL 441 HP has, together with Crofer 22H, the highest observed
oxidation rates (see Figure 21). However, this particular batch of Crofer 22H seemed to have
poor corrosion resistance compared to previous batches (see section 5.3). It would seem that the
lower amount of Cr and lack of reactive elements results in higher oxidation rate for AL 441
HP. Comparison with the other ATI metals steel E-brite indicates that the low Cr content would
be the crucial factor for the increased oxidation rate of AL 441 HP in oxygen side atmosphere.
E-brite also lacks any reactive element but has much higher Cr content and looks to have much
lower oxidation rate in 100% oxygen. Even if this steel spalled tiny pieces of its oxide scale in
this atmosphere it can be assumed to have substantially lower oxidation rate than AL 441 HP in
the same environment.
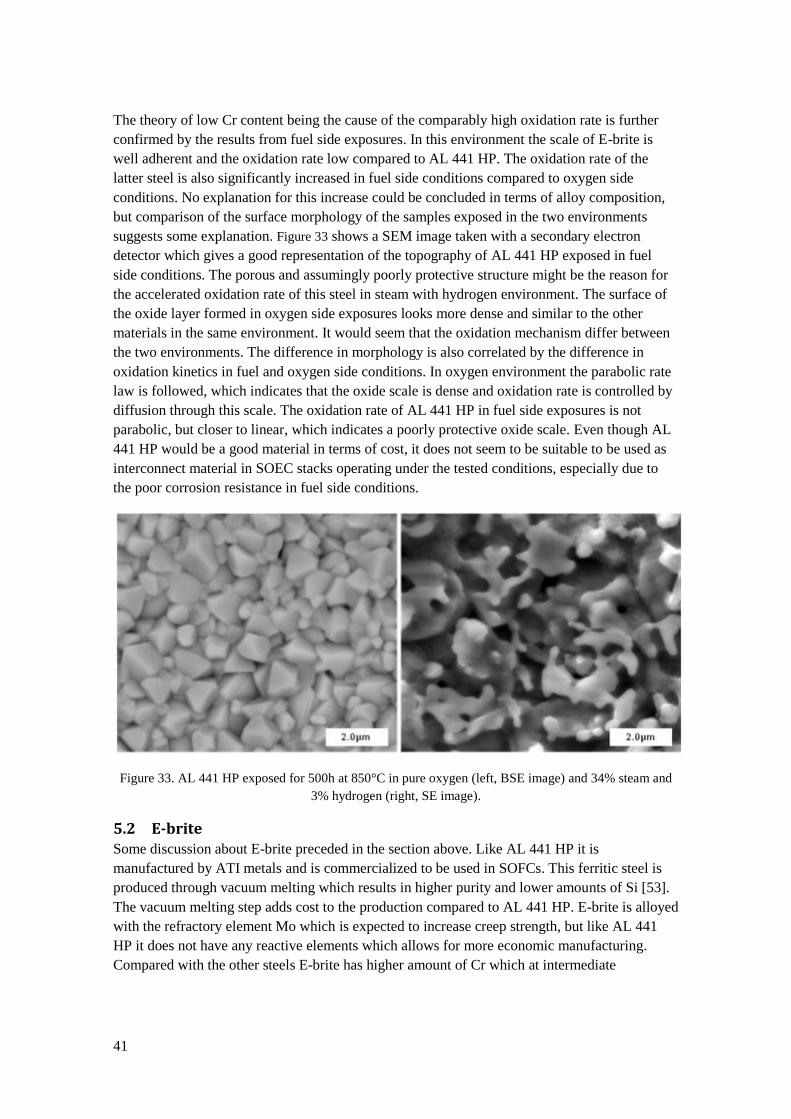
41
The theory of low Cr content being the cause of the comparably high oxidation rate is further
confirmed by the results from fuel side exposures. In this environment the scale of E-brite is
well adherent and the oxidation rate low compared to AL 441 HP. The oxidation rate of the
latter steel is also significantly increased in fuel side conditions compared to oxygen side
conditions. No explanation for this increase could be concluded in terms of alloy composition,
but comparison of the surface morphology of the samples exposed in the two environments
suggests some explanation. Figure 33 shows a SEM image taken with a secondary electron
detector which gives a good representation of the topography of AL 441 HP exposed in fuel
side conditions. The porous and assumingly poorly protective structure might be the reason for
the accelerated oxidation rate of this steel in steam with hydrogen environment. The surface of
the oxide layer formed in oxygen side exposures looks more dense and similar to the other
materials in the same environment. It would seem that the oxidation mechanism differ between
the two environments. The difference in morphology is also correlated by the difference in
oxidation kinetics in fuel and oxygen side conditions. In oxygen environment the parabolic rate
law is followed, which indicates that the oxide scale is dense and oxidation rate is controlled by
diffusion through this scale. The oxidation rate of AL 441 HP in fuel side exposures is not
parabolic, but closer to linear, which indicates a poorly protective oxide scale. Even though AL
441 HP would be a good material in terms of cost, it does not seem to be suitable to be used as
interconnect material in SOEC stacks operating under the tested conditions, especially due to
the poor corrosion resistance in fuel side conditions.
Figure 33. AL 441 HP exposed for 500h at 850°C in pure oxygen (left, BSE image) and 34% steam and
3% hydrogen (right, SE image).
5.2 E-brite Some discussion about E-brite preceded in the section above. Like AL 441 HP it is
manufactured by ATI metals and is commercialized to be used in SOFCs. This ferritic steel is
produced through vacuum melting which results in higher purity and lower amounts of Si [53].
The vacuum melting step adds cost to the production compared to AL 441 HP. E-brite is alloyed
with the refractory element Mo which is expected to increase creep strength, but like AL 441
HP it does not have any reactive elements which allows for more economic manufacturing.
Compared with the other steels E-brite has higher amount of Cr which at intermediate
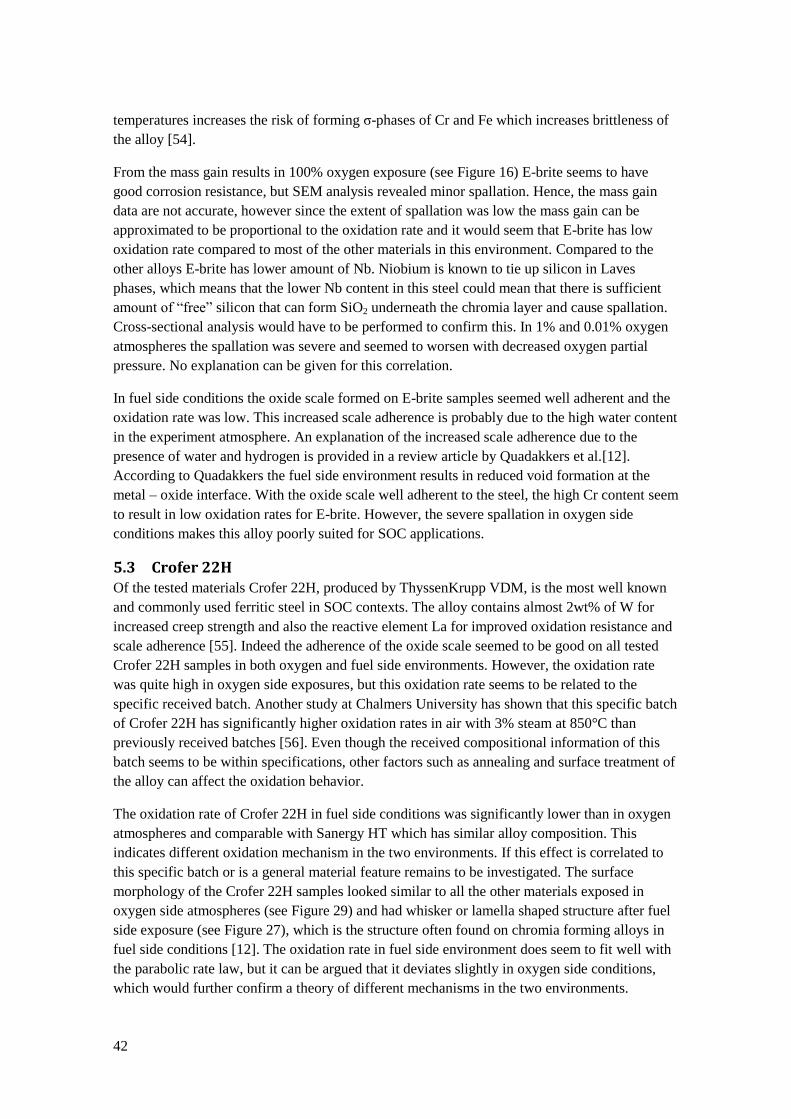
42
temperatures increases the risk of forming σ-phases of Cr and Fe which increases brittleness of
the alloy [54].
From the mass gain results in 100% oxygen exposure (see Figure 16) E-brite seems to have
good corrosion resistance, but SEM analysis revealed minor spallation. Hence, the mass gain
data are not accurate, however since the extent of spallation was low the mass gain can be
approximated to be proportional to the oxidation rate and it would seem that E-brite has low
oxidation rate compared to most of the other materials in this environment. Compared to the
other alloys E-brite has lower amount of Nb. Niobium is known to tie up silicon in Laves
phases, which means that the lower Nb content in this steel could mean that there is sufficient
amount of “free” silicon that can form SiO2 underneath the chromia layer and cause spallation.
Cross-sectional analysis would have to be performed to confirm this. In 1% and 0.01% oxygen
atmospheres the spallation was severe and seemed to worsen with decreased oxygen partial
pressure. No explanation can be given for this correlation.
In fuel side conditions the oxide scale formed on E-brite samples seemed well adherent and the
oxidation rate was low. This increased scale adherence is probably due to the high water content
in the experiment atmosphere. An explanation of the increased scale adherence due to the
presence of water and hydrogen is provided in a review article by Quadakkers et al.[12].
According to Quadakkers the fuel side environment results in reduced void formation at the
metal – oxide interface. With the oxide scale well adherent to the steel, the high Cr content seem
to result in low oxidation rates for E-brite. However, the severe spallation in oxygen side
conditions makes this alloy poorly suited for SOC applications.
5.3 Crofer 22H Of the tested materials Crofer 22H, produced by ThyssenKrupp VDM, is the most well known
and commonly used ferritic steel in SOC contexts. The alloy contains almost 2wt% of W for
increased creep strength and also the reactive element La for improved oxidation resistance and
scale adherence [55]. Indeed the adherence of the oxide scale seemed to be good on all tested
Crofer 22H samples in both oxygen and fuel side environments. However, the oxidation rate
was quite high in oxygen side exposures, but this oxidation rate seems to be related to the
specific received batch. Another study at Chalmers University has shown that this specific batch
of Crofer 22H has significantly higher oxidation rates in air with 3% steam at 850°C than
previously received batches [56]. Even though the received compositional information of this
batch seems to be within specifications, other factors such as annealing and surface treatment of
the alloy can affect the oxidation behavior.
The oxidation rate of Crofer 22H in fuel side conditions was significantly lower than in oxygen
atmospheres and comparable with Sanergy HT which has similar alloy composition. This
indicates different oxidation mechanism in the two environments. If this effect is correlated to
this specific batch or is a general material feature remains to be investigated. The surface
morphology of the Crofer 22H samples looked similar to all the other materials exposed in
oxygen side atmospheres (see Figure 29) and had whisker or lamella shaped structure after fuel
side exposure (see Figure 27), which is the structure often found on chromia forming alloys in
fuel side conditions [12]. The oxidation rate in fuel side environment does seem to fit well with
the parabolic rate law, but it can be argued that it deviates slightly in oxygen side conditions,
which would further confirm a theory of different mechanisms in the two environments.
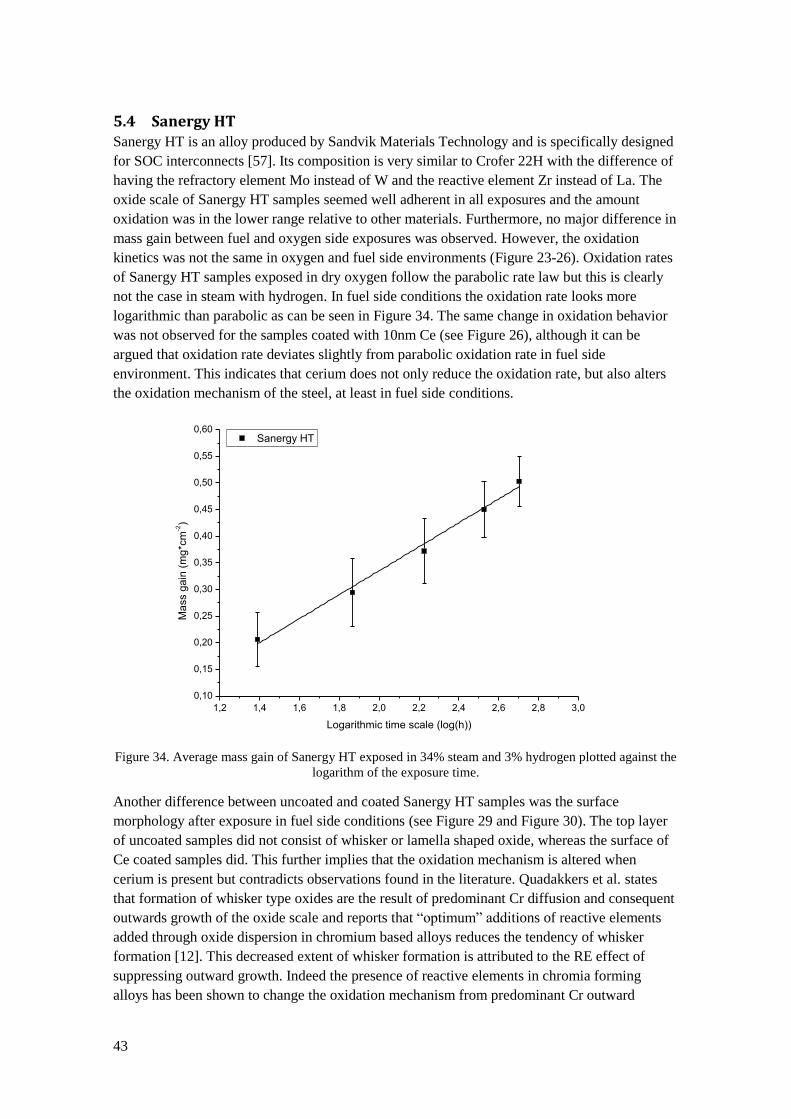
43
5.4 Sanergy HT Sanergy HT is an alloy produced by Sandvik Materials Technology and is specifically designed
for SOC interconnects [57]. Its composition is very similar to Crofer 22H with the difference of
having the refractory element Mo instead of W and the reactive element Zr instead of La. The
oxide scale of Sanergy HT samples seemed well adherent in all exposures and the amount
oxidation was in the lower range relative to other materials. Furthermore, no major difference in
mass gain between fuel and oxygen side exposures was observed. However, the oxidation
kinetics was not the same in oxygen and fuel side environments (Figure 23-26). Oxidation rates
of Sanergy HT samples exposed in dry oxygen follow the parabolic rate law but this is clearly
not the case in steam with hydrogen. In fuel side conditions the oxidation rate looks more
logarithmic than parabolic as can be seen in Figure 34. The same change in oxidation behavior
was not observed for the samples coated with 10nm Ce (see Figure 26), although it can be
argued that oxidation rate deviates slightly from parabolic oxidation rate in fuel side
environment. This indicates that cerium does not only reduce the oxidation rate, but also alters
the oxidation mechanism of the steel, at least in fuel side conditions.
1,2 1,4 1,6 1,8 2,0 2,2 2,4 2,6 2,8 3,0
0,10
0,15
0,20
0,25
0,30
0,35
0,40
0,45
0,50
0,55
0,60 Sanergy HT
Ma
ss g
ain
(m
g*c
m-2)
Logarithmic time scale (log(h))
Figure 34. Average mass gain of Sanergy HT exposed in 34% steam and 3% hydrogen plotted against the
logarithm of the exposure time.
Another difference between uncoated and coated Sanergy HT samples was the surface
morphology after exposure in fuel side conditions (see Figure 29 and Figure 30). The top layer
of uncoated samples did not consist of whisker or lamella shaped oxide, whereas the surface of
Ce coated samples did. This further implies that the oxidation mechanism is altered when
cerium is present but contradicts observations found in the literature. Quadakkers et al. states
that formation of whisker type oxides are the result of predominant Cr diffusion and consequent
outwards growth of the oxide scale and reports that “optimum” additions of reactive elements
added through oxide dispersion in chromium based alloys reduces the tendency of whisker
formation [12]. This decreased extent of whisker formation is attributed to the RE effect of
suppressing outward growth. Indeed the presence of reactive elements in chromia forming
alloys has been shown to change the oxidation mechanism from predominant Cr outward
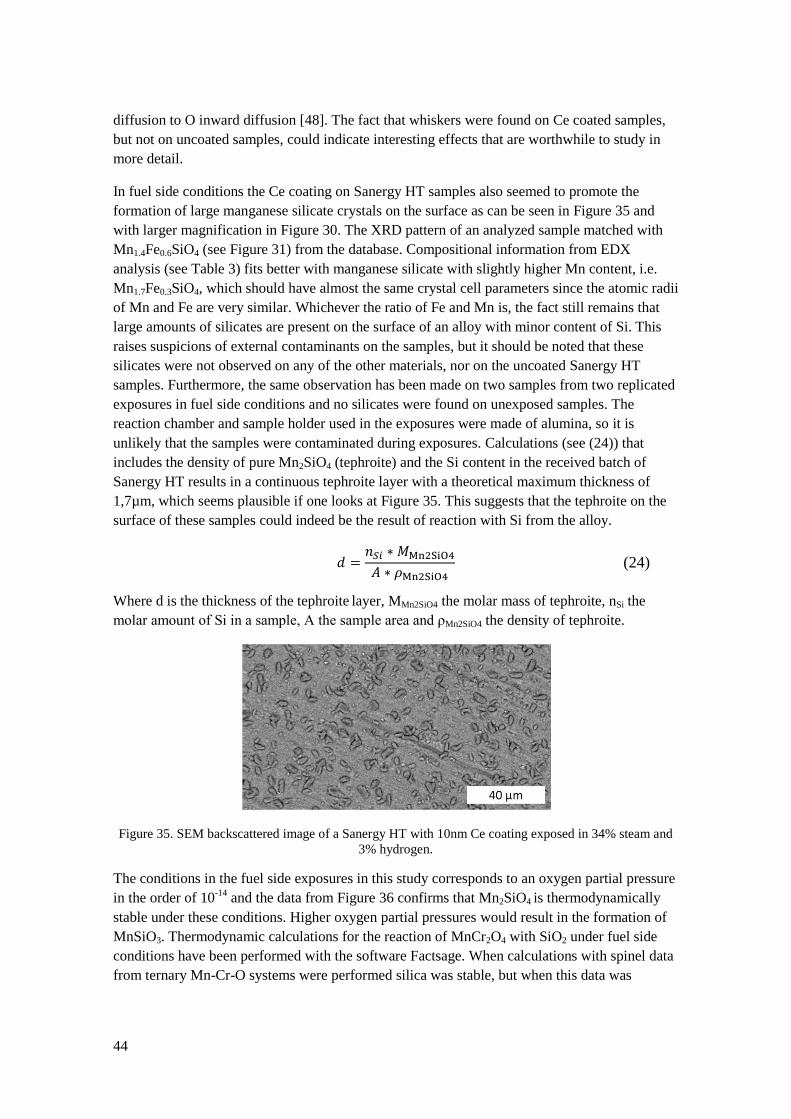
44
diffusion to O inward diffusion [48]. The fact that whiskers were found on Ce coated samples,
but not on uncoated samples, could indicate interesting effects that are worthwhile to study in
more detail.
In fuel side conditions the Ce coating on Sanergy HT samples also seemed to promote the
formation of large manganese silicate crystals on the surface as can be seen in Figure 35 and
with larger magnification in Figure 30. The XRD pattern of an analyzed sample matched with
Mn1.4Fe0.6SiO4 (see Figure 31) from the database. Compositional information from EDX
analysis (see Table 3) fits better with manganese silicate with slightly higher Mn content, i.e.
Mn1.7Fe0.3SiO4, which should have almost the same crystal cell parameters since the atomic radii
of Mn and Fe are very similar. Whichever the ratio of Fe and Mn is, the fact still remains that
large amounts of silicates are present on the surface of an alloy with minor content of Si. This
raises suspicions of external contaminants on the samples, but it should be noted that these
silicates were not observed on any of the other materials, nor on the uncoated Sanergy HT
samples. Furthermore, the same observation has been made on two samples from two replicated
exposures in fuel side conditions and no silicates were found on unexposed samples. The
reaction chamber and sample holder used in the exposures were made of alumina, so it is
unlikely that the samples were contaminated during exposures. Calculations (see (24)) that
includes the density of pure Mn2SiO4 (tephroite) and the Si content in the received batch of
Sanergy HT results in a continuous tephroite layer with a theoretical maximum thickness of
1,7µm, which seems plausible if one looks at Figure 35. This suggests that the tephroite on the
surface of these samples could indeed be the result of reaction with Si from the alloy.
(24)
Where d is the thickness of the tephroite layer, MMn2SiO4 the molar mass of tephroite, nSi the
molar amount of Si in a sample, A the sample area and ρMn2SiO4 the density of tephroite.
Figure 35. SEM backscattered image of a Sanergy HT with 10nm Ce coating exposed in 34% steam and
3% hydrogen.
The conditions in the fuel side exposures in this study corresponds to an oxygen partial pressure
in the order of 10-14
and the data from Figure 36 confirms that Mn2SiO4 is thermodynamically
stable under these conditions. Higher oxygen partial pressures would result in the formation of
MnSiO3. Thermodynamic calculations for the reaction of MnCr2O4 with SiO2 under fuel side
conditions have been performed with the software Factsage. When calculations with spinel data
from ternary Mn-Cr-O systems were performed silica was stable, but when this data was
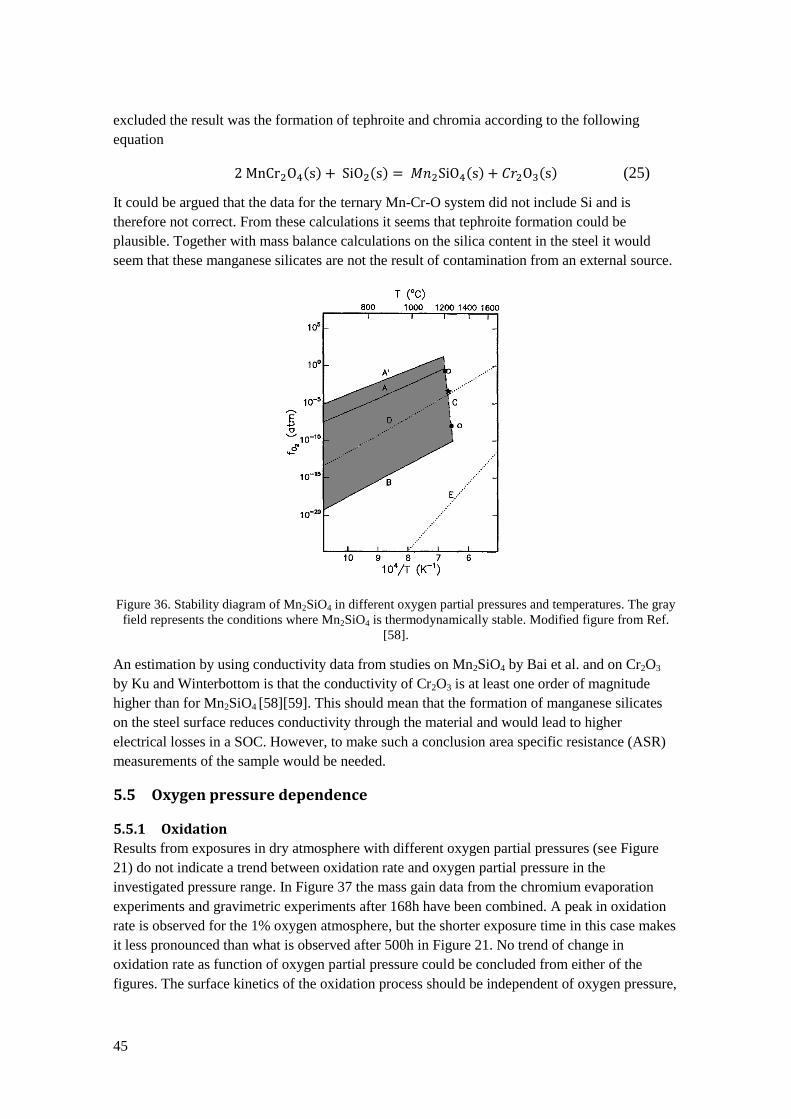
45
excluded the result was the formation of tephroite and chromia according to the following
equation
(25)
It could be argued that the data for the ternary Mn-Cr-O system did not include Si and is
therefore not correct. From these calculations it seems that tephroite formation could be
plausible. Together with mass balance calculations on the silica content in the steel it would
seem that these manganese silicates are not the result of contamination from an external source.
Figure 36. Stability diagram of Mn2SiO4 in different oxygen partial pressures and temperatures. The gray
field represents the conditions where Mn2SiO4 is thermodynamically stable. Modified figure from Ref.
[58].
An estimation by using conductivity data from studies on Mn2SiO4 by Bai et al. and on Cr2O3
by Ku and Winterbottom is that the conductivity of Cr2O3 is at least one order of magnitude
higher than for Mn2SiO4 [58][59]. This should mean that the formation of manganese silicates
on the steel surface reduces conductivity through the material and would lead to higher
electrical losses in a SOC. However, to make such a conclusion area specific resistance (ASR)
measurements of the sample would be needed.
5.5 Oxygen pressure dependence
5.5.1 Oxidation
Results from exposures in dry atmosphere with different oxygen partial pressures (see Figure
21) do not indicate a trend between oxidation rate and oxygen partial pressure in the
investigated pressure range. In Figure 37 the mass gain data from the chromium evaporation
experiments and gravimetric experiments after 168h have been combined. A peak in oxidation
rate is observed for the 1% oxygen atmosphere, but the shorter exposure time in this case makes
it less pronounced than what is observed after 500h in Figure 21. No trend of change in
oxidation rate as function of oxygen partial pressure could be concluded from either of the
figures. The surface kinetics of the oxidation process should be independent of oxygen pressure,
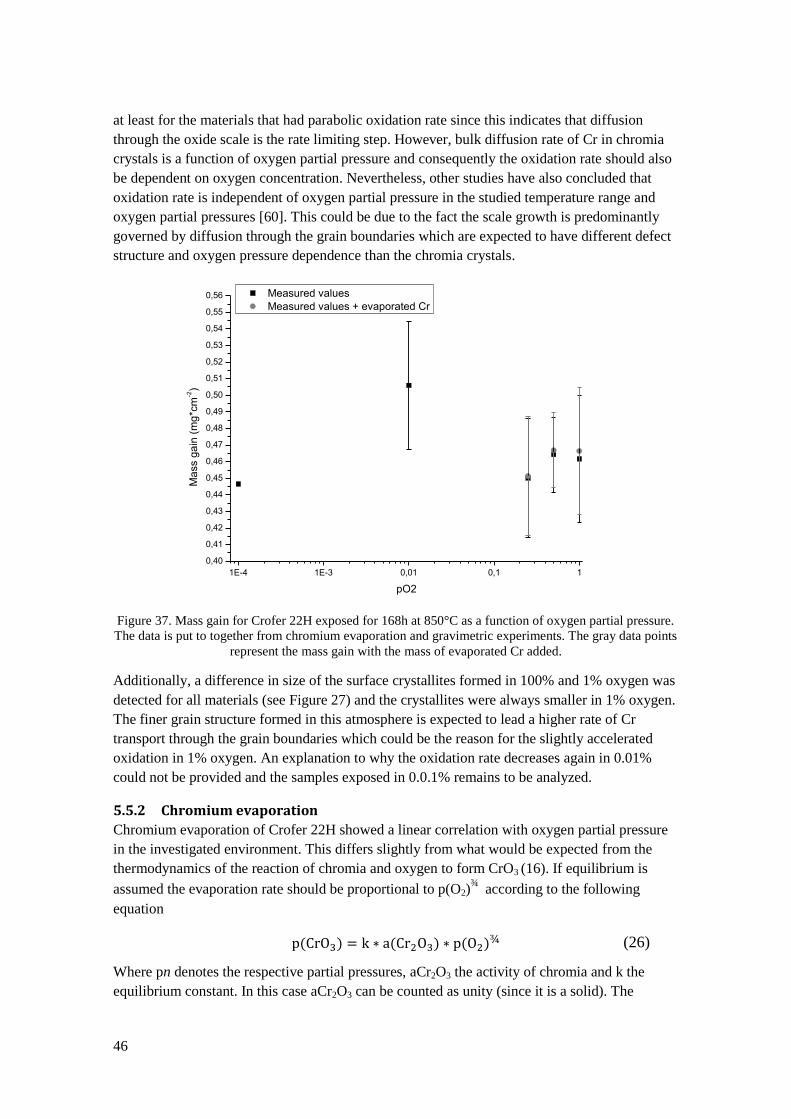
46
at least for the materials that had parabolic oxidation rate since this indicates that diffusion
through the oxide scale is the rate limiting step. However, bulk diffusion rate of Cr in chromia
crystals is a function of oxygen partial pressure and consequently the oxidation rate should also
be dependent on oxygen concentration. Nevertheless, other studies have also concluded that
oxidation rate is independent of oxygen partial pressure in the studied temperature range and
oxygen partial pressures [60]. This could be due to the fact the scale growth is predominantly
governed by diffusion through the grain boundaries which are expected to have different defect
structure and oxygen pressure dependence than the chromia crystals.
1E-4 1E-3 0,01 0,1 1
0,40
0,41
0,42
0,43
0,44
0,45
0,46
0,47
0,48
0,49
0,50
0,51
0,52
0,53
0,54
0,55
0,56 Measured values
Measured values + evaporated Cr
Ma
ss g
ain
(m
g*c
m-2)
pO2
Figure 37. Mass gain for Crofer 22H exposed for 168h at 850°C as a function of oxygen partial pressure.
The data is put to together from chromium evaporation and gravimetric experiments. The gray data points
represent the mass gain with the mass of evaporated Cr added.
Additionally, a difference in size of the surface crystallites formed in 100% and 1% oxygen was
detected for all materials (see Figure 27) and the crystallites were always smaller in 1% oxygen.
The finer grain structure formed in this atmosphere is expected to lead a higher rate of Cr
transport through the grain boundaries which could be the reason for the slightly accelerated
oxidation in 1% oxygen. An explanation to why the oxidation rate decreases again in 0.01%
could not be provided and the samples exposed in 0.0.1% remains to be analyzed.
5.5.2 Chromium evaporation
Chromium evaporation of Crofer 22H showed a linear correlation with oxygen partial pressure
in the investigated environment. This differs slightly from what would be expected from the
thermodynamics of the reaction of chromia and oxygen to form CrO3 (16). If equilibrium is
assumed the evaporation rate should be proportional to p(O2)¾ according to the following
equation
(26)
Where pn denotes the respective partial pressures, aCr2O3 the activity of chromia and k the
equilibrium constant. In this case aCr2O3 can be counted as unity (since it is a solid). The
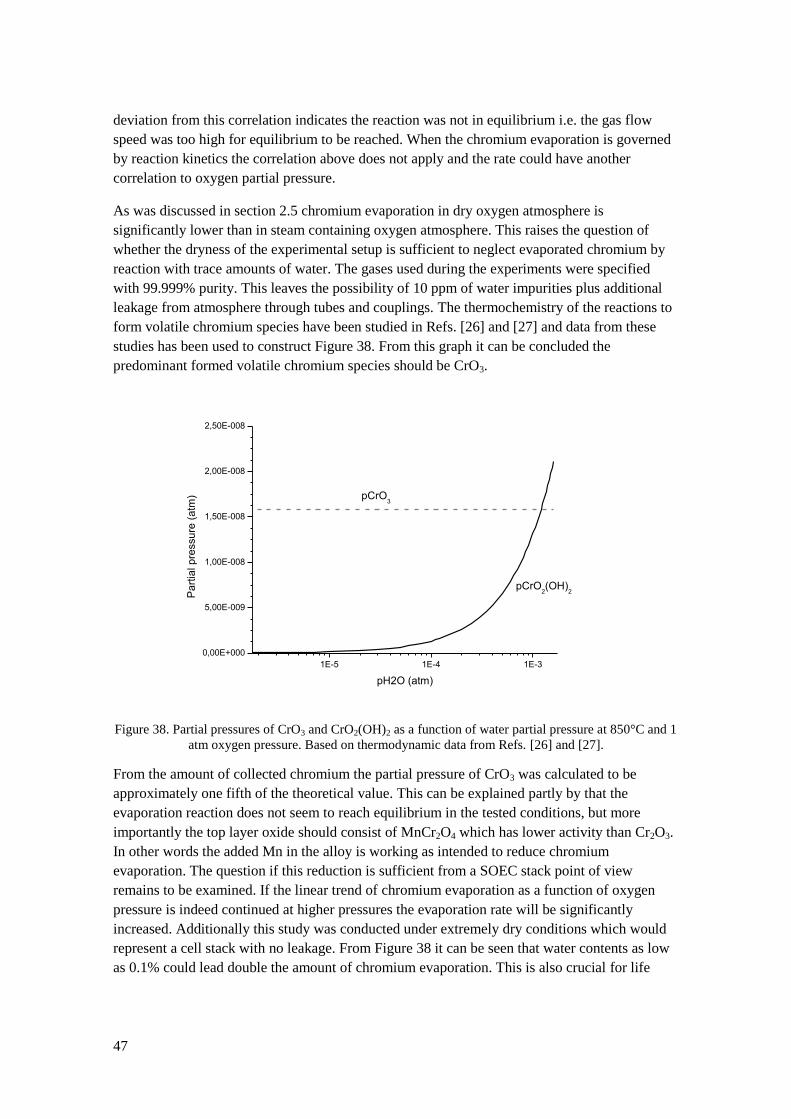
47
deviation from this correlation indicates the reaction was not in equilibrium i.e. the gas flow
speed was too high for equilibrium to be reached. When the chromium evaporation is governed
by reaction kinetics the correlation above does not apply and the rate could have another
correlation to oxygen partial pressure.
As was discussed in section 2.5 chromium evaporation in dry oxygen atmosphere is
significantly lower than in steam containing oxygen atmosphere. This raises the question of
whether the dryness of the experimental setup is sufficient to neglect evaporated chromium by
reaction with trace amounts of water. The gases used during the experiments were specified
with 99.999% purity. This leaves the possibility of 10 ppm of water impurities plus additional
leakage from atmosphere through tubes and couplings. The thermochemistry of the reactions to
form volatile chromium species have been studied in Refs. [26] and [27] and data from these
studies has been used to construct Figure 38. From this graph it can be concluded the
predominant formed volatile chromium species should be CrO3.
1E-5 1E-4 1E-3
0,00E+000
5,00E-009
1,00E-008
1,50E-008
2,00E-008
2,50E-008
pCrO2(OH)
2Pa
rtia
l p
ressu
re (
atm
)
pH2O (atm)
pCrO3
Figure 38. Partial pressures of CrO3 and CrO2(OH)2 as a function of water partial pressure at 850°C and 1
atm oxygen pressure. Based on thermodynamic data from Refs. [26] and [27].
From the amount of collected chromium the partial pressure of CrO3 was calculated to be
approximately one fifth of the theoretical value. This can be explained partly by that the
evaporation reaction does not seem to reach equilibrium in the tested conditions, but more
importantly the top layer oxide should consist of MnCr2O4 which has lower activity than Cr2O3.
In other words the added Mn in the alloy is working as intended to reduce chromium
evaporation. The question if this reduction is sufficient from a SOEC stack point of view
remains to be examined. If the linear trend of chromium evaporation as a function of oxygen
pressure is indeed continued at higher pressures the evaporation rate will be significantly
increased. Additionally this study was conducted under extremely dry conditions which would
represent a cell stack with no leakage. From Figure 38 it can be seen that water contents as low
as 0.1% could lead double the amount of chromium evaporation. This is also crucial for life
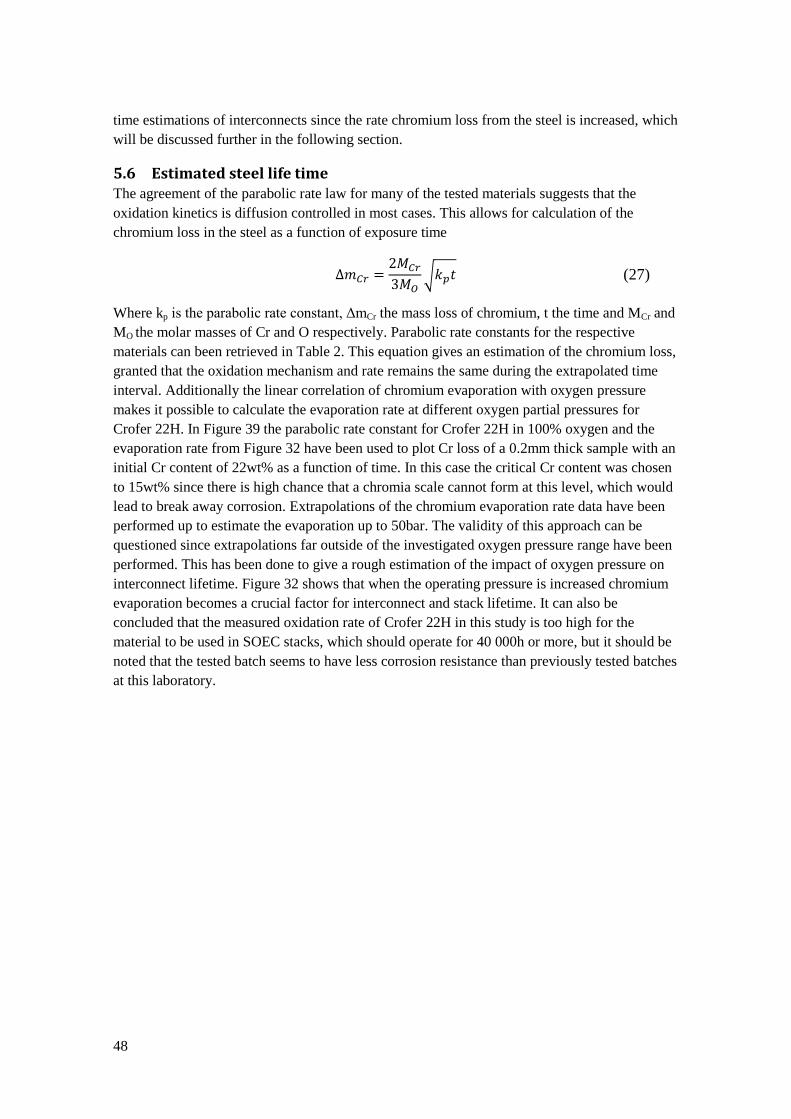
48
time estimations of interconnects since the rate chromium loss from the steel is increased, which
will be discussed further in the following section.
5.6 Estimated steel life time The agreement of the parabolic rate law for many of the tested materials suggests that the
oxidation kinetics is diffusion controlled in most cases. This allows for calculation of the
chromium loss in the steel as a function of exposure time
(27)
Where kp is the parabolic rate constant, ΔmCr the mass loss of chromium, t the time and MCr and
MO the molar masses of Cr and O respectively. Parabolic rate constants for the respective
materials can been retrieved in Table 2. This equation gives an estimation of the chromium loss,
granted that the oxidation mechanism and rate remains the same during the extrapolated time
interval. Additionally the linear correlation of chromium evaporation with oxygen pressure
makes it possible to calculate the evaporation rate at different oxygen partial pressures for
Crofer 22H. In Figure 39 the parabolic rate constant for Crofer 22H in 100% oxygen and the
evaporation rate from Figure 32 have been used to plot Cr loss of a 0.2mm thick sample with an
initial Cr content of 22wt% as a function of time. In this case the critical Cr content was chosen
to 15wt% since there is high chance that a chromia scale cannot form at this level, which would
lead to break away corrosion. Extrapolations of the chromium evaporation rate data have been
performed up to estimate the evaporation up to 50bar. The validity of this approach can be
questioned since extrapolations far outside of the investigated oxygen pressure range have been
performed. This has been done to give a rough estimation of the impact of oxygen pressure on
interconnect lifetime. Figure 32 shows that when the operating pressure is increased chromium
evaporation becomes a crucial factor for interconnect and stack lifetime. It can also be
concluded that the measured oxidation rate of Crofer 22H in this study is too high for the
material to be used in SOEC stacks, which should operate for 40 000h or more, but it should be
noted that the tested batch seems to have less corrosion resistance than previously tested batches
at this laboratory.
49
0 1000 2000 3000 4000 5000
0,000
0,005
0,010
0,015
0,020
0,025
Cr
loss (
g)
time (h)
w/o Cr evaporation
1atm
10atm
25atm
50atm
Critical Cr loss
Figure 39. Calculated loss of chromium as a function of time for Crofer 22H in different oxygen pressures
under the conditions used in this study, i.e. 850°C and 3.8cm/s gas flow rate.
6 Conclusions The present work showed that the degradation behavior of the investigated steels varied
substantially although the compositions were relatively similar. Most of the investigated
materials showed parabolic oxidation rate in the tested atmospheres which indicates that
oxidation rate is limited by solid state diffusion. A few materials deviated from parabolic
oxidation, especially so in fuel side conditions. Exposure to fuel side environment seemed to
change the oxidation mechanisms for some materials compared to oxygen environments.
One material that exhibited low corrosion rates in all investigated environments was Sanergy
HT. A Ce coated version of the same material performed even better, however the formation of
(Mn,Fe)2SiO4 was observed in fuel side conditions, which might be detrimental. E-brite suffered
from extensive spallation in dry oxygen atmospheres, which makes this material less suitable to
be used for interconnects in SOEC applications. The suitability of AL 441 HP in SOECs is also
questionable due to the poor corrosion performance and spallation in fuel side conditions.
Small variations in oxidation rate were observed in different partial pressures of dry oxygen,
however no apparent correlation could be observed. It is suggested that the oxidation rate can be
approximated as independent of oxygen partial pressure within the investigated pressure range.
The adhesion of the oxide scale of E-brite was strongly affected by the oxygen partial pressure
in the dry atmospheres. Chromium evaporation had a linear correlation to oxygen pressure in
the investigated pressure range. This means that chromium evaporation is expected to be of
more concern when operating SOECs under high pressures.
50
Chromium evaporation in dry O2 at atmospheric pressure is substantially lower than in a typical
SOFC oxygen side environment (3% H2O) and not expected to have a major impact on
interconnect lifetime. However, the presence of H2O on the oxygen side of a SOEC, e.g. due to
leakage, as well as operation under elevated pressure is expected to accelerate Cr evaporation
significantly and would thus make Cr evaporation a major lifetime limiting factor.
6.1 Restrictions In an actual cell stack the interconnect is exposed to fuel gases on one side and oxygen on the
other. Some reports indicate that this dual atmosphere can result in slightly different oxidation
mechanisms of the interconnect steel than in single atmosphere exposure [61][62]. Additionally
the interconnects inherently have applied potential and consequently current flowing through
them, which theoretically should affect the oxidation [22]. Neither dual atmosphere nor applied
current experiments have been performed due to limitations both with apparatus and the time
scale of a master’s thesis.
6.2 Suggestions for future work Cross sectional analysis of the oxide scales with SEM and EDX would hopefully help in trying
to find out the reasons for some of the changes in oxidation behavior seen on some samples
between different exposure environments. Additional testing of chromium evaporation and
oxidation rate in high and low oxygen partial pressure respectively is recommended to get more
statistics which would increase credibility in extrapolation of the suggested correlations to
higher oxygen pressures. The next step of this study could be to build systems where exposures
at a few bar pressure could be performed safely. To further investigate the oxygen dependence
and reaction kinetics of chromium evaporation studies with varied flow rates could be
performed.
7 References
[1] M. Balat, "Possible methods for hydrogen production," Energy Sources, vol. 30:1, no. Part
A: Recovery, Utilization, and Environmental Effects, pp. 39-50, 2009.
[2] M. Laguna-Bercero, "Recent advances in high temperature electrolysis using solid oxide
fuel cells: A review," Journal of Power Sources, vol. 203, pp. 4-16, 2012.
[3] Y. Bo et al., "Advance in highly efficient hydrogen production by high temperature steam
electrolysis," Science in China Series B: Chemistry, vol. 51, no. 4, pp. 289-304, 2008.
[4] S. D. Ebbesen and M. Mogensen, "Electrolysis of carbon dioxide in Solid Oxide
Electrolysis Cells," Journal of Power Sources, vol. 193, no. 1, pp. 349-358, 2009.
[5] S. H. Jensen, X. Sun, S. D. Ebbesen and R. Knibbe, "Hydrogen and synthetic fuel
production using pressurized oxide electrolyis cells," International journal of hydrogen
energy, vol. 35, no. 18, p. 9544–9549, 2010.
51
[6] C. Stoots, J. O'brien and J. Hartvigsen, "Results Of Recent High Temperature Co-
Electrolysis Studies At The Idaho National Laboratory," International Journal of Hydrogen
Energy, vol. 34, no. 9, p. 4208–4215, 2009.
[7] N. J. Maskalick, "High Temperature Electrolysis Cell Performance," International Journal
of Hydrogen Energy, vol. 11, no. 9, p. 563–570, 1986.
[8] G. Schiller, A. Ansar, M. Lang and O. Patz, "High temperature water electrolysis using
metal supported solid oxide electrolyser cells (SOEC)," Journal of Applied
Electrochemistry, vol. 39, no. 2, pp. 293-301, 2009.
[9] F. Lefebvre-Joud, A. Brisse, J. Bowen and P. Ouweltjes, "Durability and Effciency of High
Temperature Steam Electrolysis as Studied in the RelHy Project," in WHEC, Essen,
Germany, 2010.
[10] J. S. Herring, J. E. O’Brien, C. M. Stoots, G. Hawkes, J. J. Hartvigsen and M. Shahnam,
"Progress in high-temperature electrolysis for hydrogen production using planar SOFC
technology," International Journal of Hydrogen Energy, vol. 32, no. 4, p. 440–450, 2007.
[11] J. A. Turner, "Sustainable hydrogen production," Science, vol. 305, no. 5686, pp. 972-974,
2004.
[12] W. Quadakkers, J. Piron-Abellan, V. Shemet and L. Singheiser, "Metallic interconnectors
for solid oxide fuel cells - a review," Materials at High Temperatures, vol. 20, no. 2, pp.
115-127, 2003.
[13] P. Atkins and L. Jones, "Electrochemistry," in Chemical Principles The Quest for Insight,
New York, W. H. Freeman and Company, 2008, pp. 483-528.
[14] J. McMurry and R. C. Fay, "Electrochemistry," in Chemistry, New Jersey, Prentice Hall,
2001, pp. 759-810.
[15] [Online]. Available:
http://upload.wikimedia.org/wikipedia/commons/3/37/Hofmann_voltameter_fr.svg.
[16] P. Atkins, J. de Paula and R. Friedman, "Chemical Equilibrium," in Quanta, Matter and
Change: A molecular approach to physical chemistry, Oxford, Oxford University Press,
2009, pp. 558-587.
[17] M. Shen, N. Bennett, D. Yulong and K. Scott, "A concise model for evaluating water
electrolysis," International Journal of Hydrogen Energy, vol. 36, no. 22, pp. 14335-14341,
2010.
[18] M. Ni, M. K. Leung and D. Y. Leung, "Technological development of hydrogen
production by solid oxide electrolyzer cell (SOEC)," International Journal of Hydrogen
Energy, vol. 33, no. 9, p. 2337 – 2354, 2008.
52
[19] K. K. Subhash C. Singhal, High Temperature Solid Oxide Fuel Cells: Fundamentals,
Design and Applications, Amsterdam, The Netherlands: Elsevier, 2003.
[20] A. D. James Larminie, Fuel Cell Systems Exlpained, Chichester, England: John Wiley &
Sons Ltd., 2003.
[21] N. Birks, G. H. Meier and F. S. Pettit, Introduction to the High Temperature Oxidation of
Metals, 2nd ed., Cambridge: Cambridge University Press, 2006, pp. 144-149.
[22] P. Kofstad, High temperature corrosion, Barking, England: Elsivier Applied Science
Publishers Ltd., 1988.
[23] L. E. Smart and E. A. Moore, Solid State Chemistry: An Introduction, 3rd ed., Boca Raton:
CRC Press, 2005.
[24] N. Pilling and R. Bedworth, "The Oxidation of Metals at High Temperatures," Journal
Institute of Metals, vol. 29, pp. 529-591, 1923.
[25] J. Froitzheim, "Ferritic Steel Interconnectors and heir Interactions with Ni Base Anodes in
Solid Oxide Fuel Cells (SOFC)," RWTH Aachen, Jülich, 2008.
[26] E. J. Opila, D. L. Myers, N. S. Jacobson, I. B. Nielsen, D. F. Johnson, J. K. Olminsky and
M. D. Allendorg, "Theoretical and Experimental Investigation of the Thermochemistry of
CrO2(OH)2(g)," The Journal of Physical Chemistry A, vol. 111, no. 10, p. 1971–1980,
2007.
[27] B. B. Ebbinghaus, "Thermodynamics of gas phase chromium species: The chromium
oxides, the chromium oxyhydroxides, and volatility calculations in waste incineration
processes," Combustion and Flame, vol. 93, no. 1-2, pp. 119-137, 1993.
[28] W. Zhu and S. Deevi, "Development of interconnect materials for solid oxide fuel cells,"
Materials Science and Engineering: A, vol. 348, no. 1-2, pp. 227-243, 2003.
[29] W. Zhu and S. Deevi, "Opportunity of metallic interconnects for solid oxide fuel cells: a
status on contact resistance," Materials Research Bulletin, vol. 38, no. 6, pp. 957-972,
2003.
[30] B. Church, T. Sanders, R. Speyer and J. Cochran, "Thermal expansion matching and
oxidation resistance of Fe–Ni–Cr interconnect alloys," Materials Science and Engineering:
A, Vols. 452-453, pp. 334-340, 2007.
[31] J. W. Fergus, "Metallic interconnects for solid oxide fuel cells," Materials Science and
Engineering: A, vol. 397, no. 1-2, pp. 271-283, 2005.
[32] L. Niewolak, E. Wessel, L. Singheiser and W. Quadakkers, "Potential suitability of ferritic
and austenitic steels as interconnect materials for solid oxide fuel cells operating at 600
53
°C," Journal of Power Sources, vol. 195, no. 22, pp. 7600-7608, 2010.
[33] J. Wu and X. Liu, "Recent Developement of SOFC Interconnect," Journal of Material
Science Technology, vol. 26, no. 4, pp. 293-305, 2010.
[34] G. Y. Lau et al., "Chromium transport by solid state diffusion on solid oxide fuel cell
cathode," Journal of Power Sources, vol. 195, no. 22, pp. 7540-7547, 2010.
[35] T. Horita et al., "Chromium Poisoning and Degradation at (La, Sr)MnO3 and (La,Sr)FeO3
Cathodes for Solid Oxide Fuel Cells," Journal of The Electrochemical Society, vol. 157,
pp. B614-B620, 2010.
[36] J. Froitzheim and J. Svensson, "Nanocoatings for SOFC interconnects - Mitigating
chromium volatilization and improving corrosion properties," Materials Science Forum,
vol. 696, pp. 412-416, 2011.
[37] P. Huczowski and W. Quadakkers, "Effect of geometry and composition of Cr steels on
oxide scale properties relevant for interconnector applications in Solid Oxide Fuel Cells
(SOFCs)," Research Center Jülich, Energy Technology 65, Jülich, 2007.
[38] C. Johnsson et al., "The effect of coating crystallization and substrate impurities on
magnetron sputtered doped LaCrO3 coatings for metallic solid oxide fuel cell
interconnects," International Journal of Hydrogen Energy, vol. 34, no. 5, pp. 2408-2415,
2009.
[39] K. Yamamoto, Y. Kimura, F.-G. Wei and Y. Mishima, "Design of Laves phase
strengthened ferritic heat resisting steels in the Fe–Cr–Nb(–Ni) system," Materials Science
and Engineering, Vols. 329-331, p. 249–254, 2002.
[40] N. Nabiran, S. Weber and W. Theisen, "Influence of Intermetallic Precipitates and Heat
Treatment on the Mechanical Properties of High-Temperature Corrosion Resistant Ferritic
Steels," Procedia Engineering, vol. 10, pp. 1651-1656, 2011.
[41] J. Froitzheim, G. Meier, L. Niewolak, P. Ennis, H. Hattendorf, L. Singheiser and W.
Quadakkers, "Development of high strength ferritic steel for interconnect application in
SOFCs," Journal of Power Sources, vol. 178, no. 1, pp. 163-173, 2008.
[42] Z. Yang, G.-G. Xia, C.-M. Wang, Z. Nie, J. Templeton, J. W. Stevenson and P. Singh,
"Investigation of iron–chromium–niobium–titanium ferritic stainless steel for solid oxide
fuel cell interconnect applications," Journal of Power Sources, vol. 183, no. 2, p. 660–667,
2008.
[43] A. Holt and P. Kofstad, "Electrical conductivity Cr2O3 doped with TiO2," Solid State
Ionics, vol. 117, no. 7-8, pp. 21-25, 1999.
[44] F. Pirón Abellán and W. Quadakkers, "Developement of Ferritic Steels for Applications as
Interconnect Materials for Intermediate Temperature Solid Oxide Fuel Cells (SOFCs),"
54
Forschungszentrums Jülich, Jülich, 2005.
[45] M. Stanislowski, J. Froitzheim, L. Niewolak, W. Quadakkers, K. Hilpert, T. Markus and L.
Singheiser, "Reduction of chromium vaporization from SOFC interconnectors by highly
effective coatings," Journal of Power Sources, vol. 164, no. 2, pp. 578-589, 2007.
[46] Z. Lu and J. Zhu, "Electrical Conductivity of the Manganese Chromite Spinel Solid
Solution," Journal of the American Ceramic Society, vol. 88, no. 4, pp. 1050-1053, 2005.
[47] P. Y. Hou, "The Reactive Element Effect - Past, Present and Future," Materials Science
Forum, vol. 696, pp. 39-44, 2011.
[48] P. Hou, I. Browna and J. Stringerb, "Study of the effect of reactive-element addition by
implanting metal ions in a preformed oxide layer," Nuclear Instruments and Methods in
Physics Research Section B: Beam Interactions with Materials and Atoms, Vols. 59-60, no.
2, pp. 1345-1349, 1991.
[49] M. S. Sohal et al., "Critical Causes of Degradation in Integrated Laboratory Scale Cells
During High Temperature Electrolysis," U.S. Department of Energy, 2009.
[50] J. Froitzheim, H. Ravash, E. Larsson, J. E. Svensson and L. G. Johansson, " Investigation
of Chromium Volatilization from FeCr Interconnects by a Denuder Technique," Journal of
the Electrochemical Society, vol. 157, no. 9, pp. B1295-B1300, 2010.
[51] M.-C. Fournier-Salaün and P. Salaün, "Quantitative determination of hexavalent chromium
in aqueous solutions by UV-Vis spectrophotometer," Central European Journal of
Chemistry, vol. 5, no. 4, pp. 1084-1093, 2007.
[52] ATI Metals, [Online]. Available: http://www.atimetals.com/Documents/ati_e-
brite_tds_en.pdf. [Accessed May 2012].
[53] ATI Metals, [Online]. Available:
http://www.atimetals.com/Documents/ati_441_tds_en.pdf. [Accessed May 2012].
[54] J. e. a. Hammer, "The Oxidation of Ferritic Stainless Steels in Simulated Solid-Oxide Fuel-
Cell Atmospheres," Oxidation of Metals, vol. 67, no. 1, pp. 1-38, 2006.
[55] ThyssenKrupp, [Online]. Available: www.thyssenkrupp.com. [Accessed 24 10 2012].
[56] R. Sachitanad, Unpublished results, Chalmers University of Technology.
[57] Sandvik Materials Technology, [Online]. Available: http://www.smt.sandvik.com.
[Accessed 24 10 2012].
[58] Q. Bai, Z.-C. Wang and K. D.L., "Manganese Olivine I: Electrical conductivity," Physics
and Chemistry of Minerals, vol. 22, pp. 489-503, 1995.
55
[59] R. C. Ku and W. L. Winterbottom, "Electrical Conductivity in Sputter Deposited
Chromium Oxide Coatings," Electronics and Optics, vol. 127, pp. 241-256, 1985.
[60] E. A. Polman, T. Fransent and P. J. Gellings, "The reactive element effect; ionic processes
of grain-boundary segregation and diffusion in chromium oxide scales," Journal of
Physics: Condensed Matter, vol. 1, pp. 4497-4510, 1989.
[61] Z. G. Yang, G. Xia and J. Stevenson, "Advanced SOFC Interconnect Development at
PNNL," ECS Transactions, vol. 5, no. 1, pp. 347-356, 2007.
[62] A. W. B. Skilbred and R. Haugsrud, "The effect of dual atmosphere conditions on the
corrosion of Sandvik Sanergy HT," Internation Journal of Hydrogen Energy, vol. 37, no. 9,
p. 8095–8101, 2012.
[63] [Online]. Available:
http://upload.wikimedia.org/wikipedia/commons/3/37/Hofmann_voltameter_fr.svg.
[Accessed February 2012].


![Databaseforahighperformanceandstability demanding command ...publications.lib.chalmers.se/records/fulltext/127516.pdf · Chapter 1 Introduction TraditionallySaab[3]hasstoredapplicationdatainadistributeddatastructure](https://img.pdfslide.us/doc/110x75/5f283e290d51ca22422dad96/databaseforahighperformanceandstability-demanding-command-chapter-1-introduction.jpg)