Embed Size (px)
Citation preview
Microencapsulation for controlling biocide release from protective coatings Master of Science Thesis [Master Degree Program in Chemistry and Bioscience]
NGA YING ALBERTA MOK
Department of Chemical and Biological Engineering Division of Applied Surface Chemistry
CHALMERS UNIVERSITY OF TECHNOLOGY Göteborg, Sweden, 2010

THESIS FOR THE DEGREE OF MASTER OF SCIENCE
Microencapsulation for controlling biocide release from protective coatings
Nga Ying Alberta MOK
Supervised by Magnus Nydén
Department of Chemical and Biological Engineering CHALMERS UNIVERSITY OF TECHNOLOGY
Göteborg, Sweden 2010
Microencapsulation for controlling biocide release from protective coatings © Nga Ying Alberta MOK, 2010. Department of Chemical and Biological Engineering Chalmers University of Technology SE-412 96 Göteborg Sweden Telephone + 46 (0)31-772 1000 Department of Chemical and Biological Engineering Göteborg, Sweden 2010

Microencapsulation technique for controlling biocide release from
protective coatings
Alberta Mok
Applied Surface Chemistry, Chalmers University of Technology
ABSTRACT
The Marine Paint Program performs research and development of novel anti-fouling marine paints.
The program’s goal is to prolong the protective life-time of marine coatings with the aim to improve
the marine environment.
The hypothesis in this work is that the release of biocides from marine coatings can be controlled by
encapsulating the biocide with a microcapsule. The goal of microencapsulation is to optimize the
paint’s anti-fouling properties, by ensuring that sufficient biocide concentrations are present in the
paint to inhibit the growth of microorganisms, without affecting the mechanical properties of either
the paint or the final coating. By using this technique, we aim to minimize the biocide's
environmental impact by reducing the biocide release rate into the environment. Consequently, the
decrease in biocide concentration will improve the marine environment.
The biocides studied in this project were medetomidine, irgarol, seanine, and tolyfluanid. They were
encapsulated individually using the solvent extraction / evaporation technique. The encapsulated
biocides were then formulated into marine paints, coated on a surface, and exposed to a release
medium (artificial sea-water) for an extended period of time. To determine the release rate of each
biocide, the biocide concentration in the release medium was measured using either a scintillation
counter or high-pressure liquid chromatography equipped with a diode array ultraviolet detector.
The medetomidine release profile was successfully characterized, but the release profiles for
seanine, irgarol, and tolyfluanid were not conclusive because of the problem with chemical
degradation. The release rate correlates with the polarity of the biocides but seems not to correlate
to either the biocide solubility or molecular weight. Finally, the semi-polished paint used in this
project was more effective at slowing down the release of the biocides.
Key words: Microencapsulation, Controlled Release, Slow Release, Marine Coatings, Release
Measurements, Biocides


TABLE OF CONTENTS
ABBREVIATIONS, SYMBOLS AND DEFINITIONS ....................................................................
LIST OF TABLES ..................................................................................................................................
LIST OF FIGURES ................................................................................................................................
1. INTRODUCTION ........................................................................................................................ 1
1.1. Aims and Objectives ............................................................................................................................ 1
1.2. Significance .......................................................................................................................................... 1
1.3. Applications ......................................................................................................................................... 1
2. BACKGROUND ........................................................................................................................... 2
2.1. Biocides ............................................................................................................................................... 2 2.1.1. Medetomidine ................................................................................................................................... 2 2.1.2. Seanine .............................................................................................................................................. 2 2.1.3. Irgarol ................................................................................................................................................ 3 2.1.4. Tolyfluanid ......................................................................................................................................... 3
2.2. Microparticles ...................................................................................................................................... 3
2.3. Paint systems ....................................................................................................................................... 4 2.3.1. Hard paint .......................................................................................................................................... 4 2.3.2. Semi-polished paint ........................................................................................................................... 5
2.4. Instrumentations ................................................................................................................................. 5 2.4.1. Light Microscopy ............................................................................................................................... 5 2.4.2. Liquid Scintillation Counter ............................................................................................................... 5 2.4.3. High-performance liquid chromatography coupled with a diode array ultraviolet detector ........... 6
3. MATERIALS AND METHODOLOGIES ................................................................................ 8
3.1. Materials ............................................................................................................................................. 8
3.2. Encapsulation ...................................................................................................................................... 8
3.3. Release measurement ......................................................................................................................... 9 3.3.1. Release measurement preparation ................................................................................................... 9
3.3.1.1. Paint formulation ........................................................................................................................ 10 3.3.1.2. Surface coating ........................................................................................................................... 10 3.3.1.3. Release medium.......................................................................................................................... 10
3.3.2. Sampling .......................................................................................................................................... 11 3.3.3. Measurement .................................................................................................................................. 11
3.3.3.1. Liquid scintillation counter ......................................................................................................... 11 3.3.3.1.1. Sample preparation .............................................................................................................. 11 3.3.3.1.2. Radioactivity measurement .................................................................................................. 11
3.3.3.2. High-performance liquid chromatography coupled with a diode array ultraviolet detector ..... 12 3.3.3.2.1. Sample preparation .............................................................................................................. 12 3.3.3.2.2. Concentration measurement ............................................................................................... 12
3.4. Reliability........................................................................................................................................... 12 3.4.1. Error measurement ......................................................................................................................... 13 3.4.2. Detector efficiency .......................................................................................................................... 13 3.4.3. Triplet sample .................................................................................................................................. 13
4. RESULTS AND ANALYSIS .................................................................................................... 14
4.1. Size distribution ................................................................................................................................. 14
4.2. Biocide release patterns .................................................................................................................... 15 4.2.1. Medetomidine ................................................................................................................................. 15 4.2.2. Seanine ............................................................................................................................................ 17 4.2.3. Irgarol .............................................................................................................................................. 17 4.2.4. Tolyfluanid ....................................................................................................................................... 18 4.2.5. Summaries and comparisons .......................................................................................................... 19
5. CONCLUSIONS AND FURTHER WORK ........................................................................... 21
ACKNOWLEDGEMENT ................................................................................................................. 23
REFERENCES ................................................................................................................................... 24
APPENDIX ........................................................................................................................................ 26


ABBREVIATIONS, SYMBOLS AND DEFINITIONS
DCM Dichloromethane
HPLCDAD High-performance liquid chromatography coupled with a diode array
ultraviolet detector
Irgarol 2-(tert-Butylamino)-4-(cyclopropylamino)-6-(methylthio)-s-triazine
LSC Liquid scintillation counter
Medetomidine 4-[1-(2,3-Dimethylphenyl)ethyl]-1H-imidazole
PMMA Poly (methyl 2-methylpropenoate)
PMT Photomultiplier tube
PP Poly(propylene)
PTFE Polytetrafluoroethylene
PVA Polyvinyl alcohol
rpm Rotations per minute
Seanine 4,5-dichloro-2-n-octyl-4-isothiazolino-3-one
Tolyfluanid N-dichlorfluormetyltio-N’,N’-dimetyl-N-p-tolylsulfamid
UV Ultraviolet

LIST OF TABLES
Table 1 Average size of the microspheres created for each biocide.
Table 2 A list of the partition coefficient, solubility, and molecular weight for seanine, irgarol,
tolyfluanid, and medetomidine. The compounds are ordered in the table from the
fastest to the slowest theoretical release rate and are ranked in column 5 from the
fastest to the slowest measured release rate.
LIST OF FIGURES
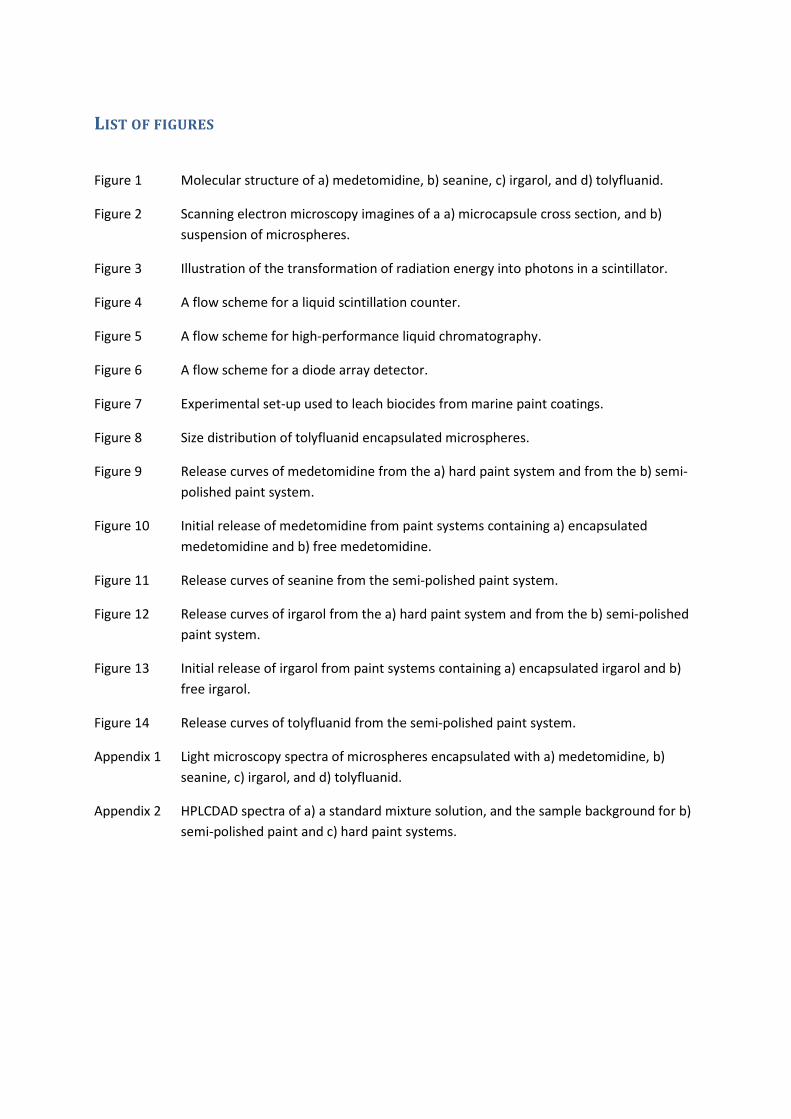
Figure 1 Molecular structure of a) medetomidine, b) seanine, c) irgarol, and d) tolyfluanid.
Figure 2 Scanning electron microscopy imagines of a a) microcapsule cross section, and b)
suspension of microspheres.
Figure 3 Illustration of the transformation of radiation energy into photons in a scintillator.
Figure 4 A flow scheme for a liquid scintillation counter.
Figure 5 A flow scheme for high-performance liquid chromatography.
Figure 6 A flow scheme for a diode array detector.
Figure 7 Experimental set-up used to leach biocides from marine paint coatings.
Figure 8 Size distribution of tolyfluanid encapsulated microspheres.
Figure 9 Release curves of medetomidine from the a) hard paint system and from the b) semi-
polished paint system.
Figure 10 Initial release of medetomidine from paint systems containing a) encapsulated
medetomidine and b) free medetomidine.
Figure 11 Release curves of seanine from the semi-polished paint system.
Figure 12 Release curves of irgarol from the a) hard paint system and from the b) semi-polished
paint system.
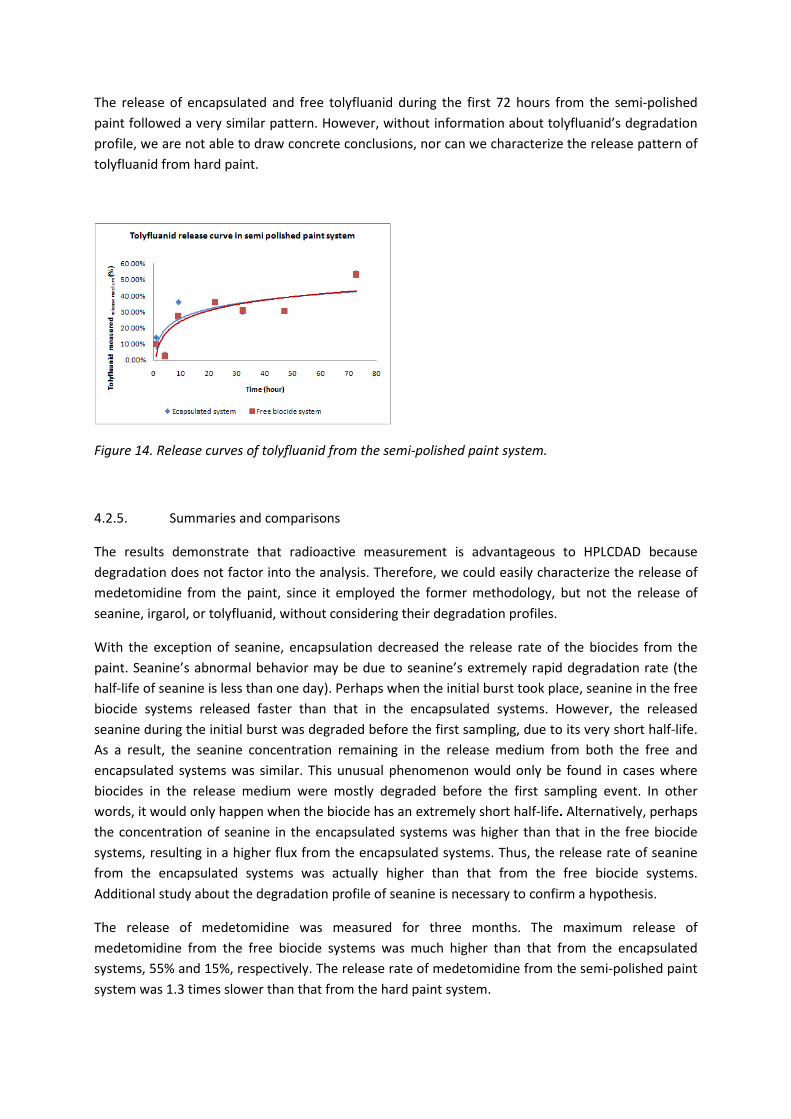
Figure 13 Initial release of irgarol from paint systems containing a) encapsulated irgarol and b)
free irgarol.
Figure 14 Release curves of tolyfluanid from the semi-polished paint system.
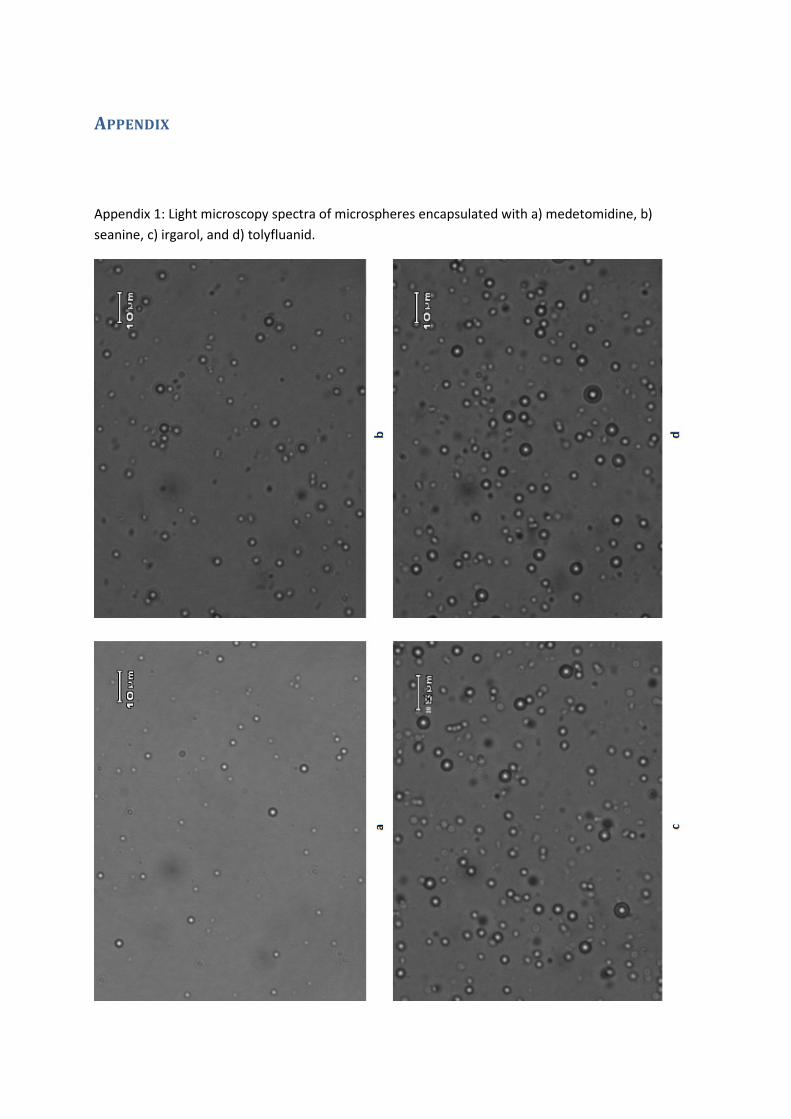
Appendix 1 Light microscopy spectra of microspheres encapsulated with a) medetomidine, b)
seanine, c) irgarol, and d) tolyfluanid.
Appendix 2 HPLCDAD spectra of a) a standard mixture solution, and the sample background for b)
semi-polished paint and c) hard paint systems.

1. INTRODUCTION
1.1. Aims and Objectives
This project is part of the larger societal goals of moving towards a more energy-independent
economy and reducing pollution in the environment. Anti-fouling paints reduce fossil fuel use by 20%
a year, when compared to the fuel consumption of a middle-size ship with fouling problems.1 By
encapsulating biocides using microencapsulation, we aim to (1) maximize the anti-fouling function of
the paint by preventing the biocides from reacting with the paint matrix and (2) control and reduce
the amount of biocide released from marine paint coatings. By reducing the amount of biocide
released, we can minimize the environmental impact of these biocides. In addition, we aim to
characterize the release pattern of different biocides.
1.2. Significance
Biocide release differs with the properties of the paint matrix and the release medium. In this study,
the release medium was a standard artificial sea-water. The goal was to obtain information about the
concentration of the biocides on the surface of the coating, for environmental concentration
estimation. In addition, we measured the biocide release rate to correlate the results to a biological
field test.
1.3. Applications
Microencapsulation is an efficient way to protect biocides from the unstable chemical environment
of the paint matrix and to control biocide release from the paint coating. With this technique, the
biocide life-time in the paint matrix is lengthened and thus, the anti-fouling function of the paint is
prolonged.
2. BACKGROUND
2.1. Biocides
Biocides inhibit the growth of microorganisms. Biocides are usually organic compounds. The biocides
studied in this project were “booster biocides.” These biocides are either specific to a microorganism,
or they inhibit the growth of a broad spectrum of microorganisms. All of the biocides tested are
small, which is both an advantage and a challenge for obtaining an optimum release. Each biocide
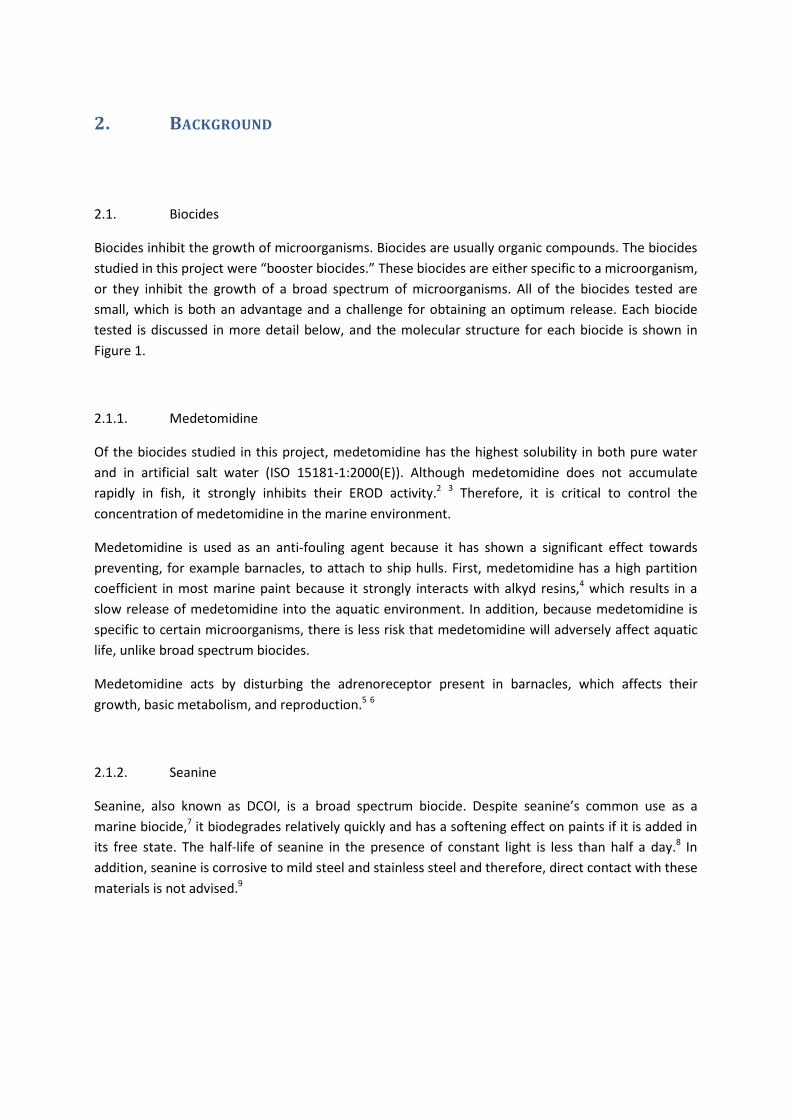
tested is discussed in more detail below, and the molecular structure for each biocide is shown in
Figure 1.
2.1.1. Medetomidine
Of the biocides studied in this project, medetomidine has the highest solubility in both pure water
and in artificial salt water (ISO 15181-1:2000(E)). Although medetomidine does not accumulate
rapidly in fish, it strongly inhibits their EROD activity.2 3 Therefore, it is critical to control the
concentration of medetomidine in the marine environment.
Medetomidine is used as an anti-fouling agent because it has shown a significant effect towards
preventing, for example barnacles, to attach to ship hulls. First, medetomidine has a high partition
coefficient in most marine paint because it strongly interacts with alkyd resins,4 which results in a
slow release of medetomidine into the aquatic environment. In addition, because medetomidine is
specific to certain microorganisms, there is less risk that medetomidine will adversely affect aquatic
life, unlike broad spectrum biocides.
Medetomidine acts by disturbing the adrenoreceptor present in barnacles, which affects their
growth, basic metabolism, and reproduction.5 6
2.1.2. Seanine
Seanine, also known as DCOI, is a broad spectrum biocide. Despite seanine’s common use as a
marine biocide,7 it biodegrades relatively quickly and has a softening effect on paints if it is added in
its free state. The half-life of seanine in the presence of constant light is less than half a day.8 In
addition, seanine is corrosive to mild steel and stainless steel and therefore, direct contact with these
materials is not advised.9
2.1.3. Irgarol
Irgarol, a commonly used algaecide, inhibits photosynthesis, and is therefore considered a low-risk
biocide to animals.10 Irgarol degrades within approximately 100 days in the open ocean.11
Photodegradation is the primary mode of irgarol degradation, forming 2-methylthio-4-tert-
butylamino-6-amino-s-triazine, which is also known as M1 or GS26575. However, irgarol degrades
even more rapidly in sediment through oxidation.12 Although the toxicity of both degradation
products is much lower than the parent chemical, both are persistent in the aquatic environment.13 14
2.1.4. Tolyfluanid
Tolyfluanid is very biodegradable and will hydrolyze to dimethylaminosulphotoluidide (DMST) in one
week at pH 7.15 Although the toxicity and the UV absorption range of the degradation product are
similar to tolyfluanid, DMST has a much higher solubility in water than tolyfluanid.16 17 Therefore, it
has a high tendency to partition in the aquatic environment.
Figure 1. Molecular structure of a) medetomidine, b) seanine, c) irgarol, and d) tolyfluanid.
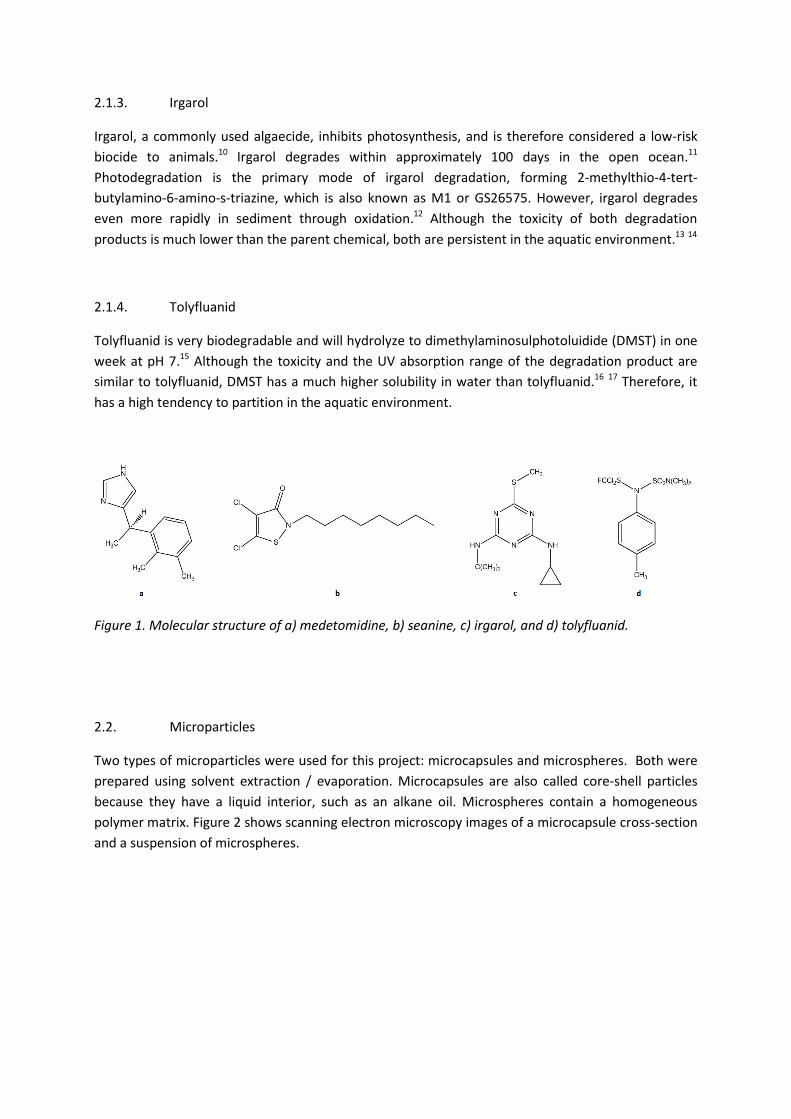
2.2. Microparticles
Two types of microparticles were used for this project: microcapsules and microspheres. Both were
prepared using solvent extraction / evaporation. Microcapsules are also called core-shell particles
because they have a liquid interior, such as an alkane oil. Microspheres contain a homogeneous
polymer matrix. Figure 2 shows scanning electron microscopy images of a microcapsule cross-section
and a suspension of microspheres.
Figure 2. Scanning electron microscopy imagines of a a) microcapsule cross section and b) suspension
of microspheres.
After the microparticles are formed, the biocide is loaded inside the polymer shell. If the particle is a
microcapsule, the biocide is deposited in the central core. Alternatively, if the particle is a
microsphere, the biocide may be molecularly dispersed within the polymer matrix. The encapsulated
biocide then diffuses through, and finally leaches out, from the polymeric matrix. Due to the
protective nature of the particle surrounding the biocides, the biocides are protected from
potentially unstable chemical environments surrounding the particles.
2.3. Paint systems
Paints form protective polymeric coatings, which are used to isolate a surface from humidity, or from
oxidative or corrosive environments. Paints normally consist of pigments, binders, solvents, and
additives. The paint systems studied in this project were organic solvent-based marine paints. The
paints were specially made for the project, were biocide- and metal-free, and were designed for the
Baltic Ocean.
2.3.1. Hard paint
Hard paint was the first type of paint introduced by the paint industry. Rather than the paint
degrading as a function of time, the biocides diffuse through the paint. As a result, after a period of
time, a gradient in biocide concentration exists within the paint matrix.

2.3.2. Semi-polished paint
Semi-polished paint is a rather newly invented formula and is also known as a semi-polished coating
(SPC). Hydrolysis slowly occurs between the paint coating and the water interface, such that the
surface layer is constantly reforming. This results in a constant biocide concentration at the surface.
There is no gradient in biocide concentration within the paint matrix.
2.4. Instrumentations
Instruments were used to determine the size of the synthesized microparticles and to characterize
the release profiles of different biocides from different paints.
2.4.1. Light Microscopy
Light microscopy is a simple and fast method for measuring the shape and size of microparticles.
Light microscopy is commonly used in the biological field to study the basic structure of
microorganisms or cellular interaction because its standard magnification range is between 40 and
1,000, under normal temperature and pressure.18
2.4.2. Liquid Scintillation Counter
Scintillation counters consist of a scintillator coupled with a photomultiplier tube (PMT), which is
connected to a voltage detector. The wavelength of the emitted energy determines the type of PMT
used for the measurements. The mechanism for the transformation of radiation energy into photons
is illustrated in Figure 3. Depending on the type of scintillator, α-, β-, and γ-radiation can be
measured. In all cases, the scintillator should be transparent to the emitted wavelength, to prevent
self-absorption of the emitted energy.19
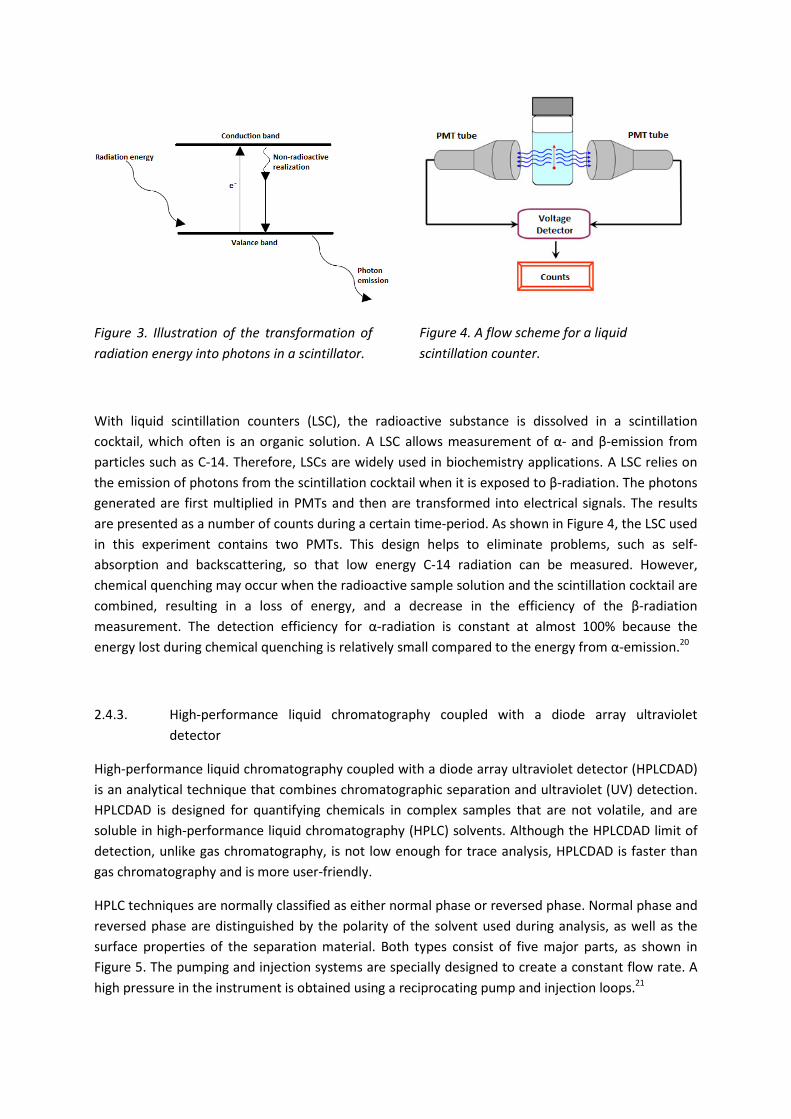
Figure 3. Illustration of the transformation of
radiation energy into photons in a scintillator.
Figure 4. A flow scheme for a liquid
scintillation counter.
With liquid scintillation counters (LSC), the radioactive substance is dissolved in a scintillation
cocktail, which often is an organic solution. A LSC allows measurement of α- and β-emission from
particles such as C-14. Therefore, LSCs are widely used in biochemistry applications. A LSC relies on
the emission of photons from the scintillation cocktail when it is exposed to β-radiation. The photons
generated are first multiplied in PMTs and then are transformed into electrical signals. The results
are presented as a number of counts during a certain time-period. As shown in Figure 4, the LSC used
in this experiment contains two PMTs. This design helps to eliminate problems, such as self-
absorption and backscattering, so that low energy C-14 radiation can be measured. However,
chemical quenching may occur when the radioactive sample solution and the scintillation cocktail are
combined, resulting in a loss of energy, and a decrease in the efficiency of the β-radiation
measurement. The detection efficiency for α-radiation is constant at almost 100% because the
energy lost during chemical quenching is relatively small compared to the energy from α-emission.20
2.4.3. High-performance liquid chromatography coupled with a diode array ultraviolet
detector
High-performance liquid chromatography coupled with a diode array ultraviolet detector (HPLCDAD)
is an analytical technique that combines chromatographic separation and ultraviolet (UV) detection.
HPLCDAD is designed for quantifying chemicals in complex samples that are not volatile, and are
soluble in high-performance liquid chromatography (HPLC) solvents. Although the HPLCDAD limit of
detection, unlike gas chromatography, is not low enough for trace analysis, HPLCDAD is faster than
gas chromatography and is more user-friendly.
HPLC techniques are normally classified as either normal phase or reversed phase. Normal phase and
reversed phase are distinguished by the polarity of the solvent used during analysis, as well as the
surface properties of the separation material. Both types consist of five major parts, as shown in
Figure 5. The pumping and injection systems are specially designed to create a constant flow rate. A
high pressure in the instrument is obtained using a reciprocating pump and injection loops.21
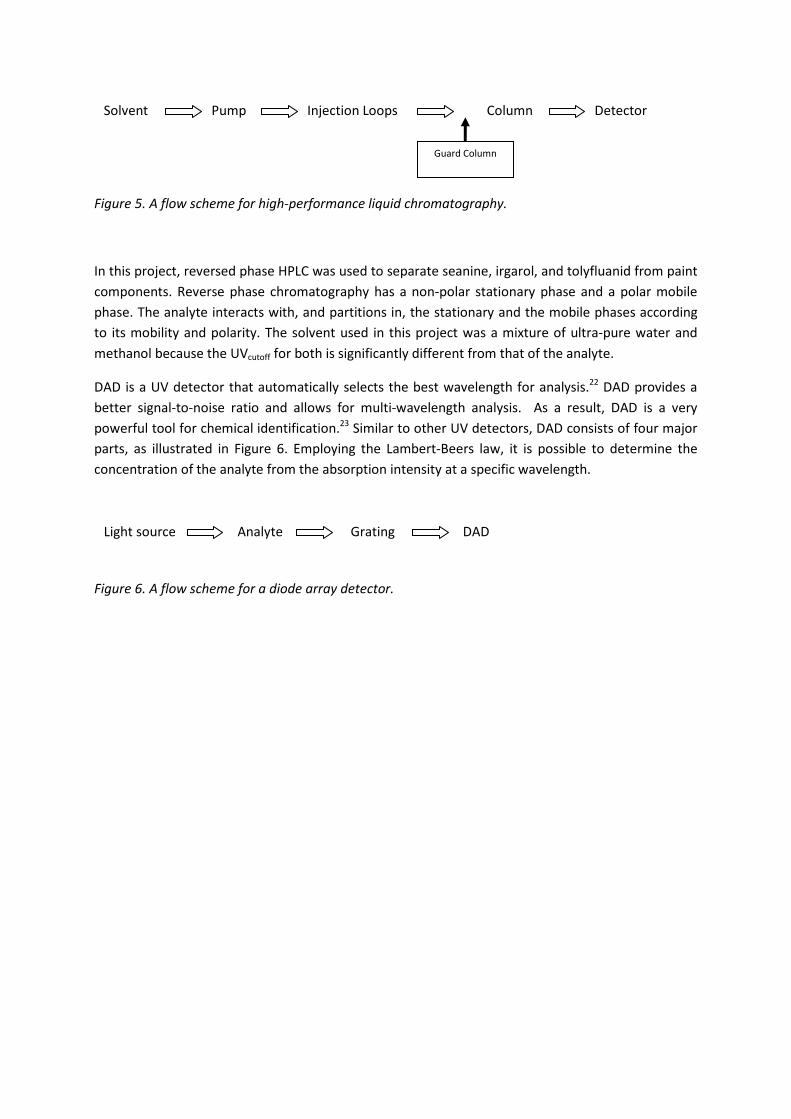
Figure 5. A flow scheme for high-performance liquid chromatography.
In this project, reversed phase HPLC was used to separate seanine, irgarol, and tolyfluanid from paint
components. Reverse phase chromatography has a non-polar stationary phase and a polar mobile
phase. The analyte interacts with, and partitions in, the stationary and the mobile phases according
to its mobility and polarity. The solvent used in this project was a mixture of ultra-pure water and
methanol because the UVcutoff for both is significantly different from that of the analyte.
DAD is a UV detector that automatically selects the best wavelength for analysis.22 DAD provides a
better signal-to-noise ratio and allows for multi-wavelength analysis. As a result, DAD is a very
powerful tool for chemical identification.23 Similar to other UV detectors, DAD consists of four major
parts, as illustrated in Figure 6. Employing the Lambert-Beers law, it is possible to determine the
concentration of the analyte from the absorption intensity at a specific wavelength.
Figure 6. A flow scheme for a diode array detector.
Solvent Pump Column Detector
Guard Column
Injection Loops
Light source Analyte DAD Grating

3. MATERIALS AND METHODOLOGIES
3.1. Materials
Solvents, polymers, and oils used during encapsulation and elution were purchased from Sigma
Aldrich. The molecular weight of poly (methyl 2-methylpropenoate) (PMMA) and polyvinyl alcohol
(PVA) is 350,000 and 95,000, respectively. The PVA used was hydrolyzed to 95%. Solvents and buffer
solutions used for HPLCDAD were purchased from Merck. These chemicals were either ACS reagent
or HPLC grade, with a purity of over 99%. The salts and pH buffers used to make artificial salt water
were purchased from VWR.
The internal standard for HPLCDAD measurement, 98.9% atrazine powder, was purchased from
Supelco. Ultima Gold high flash-point LSC cocktail, which was used as the scintillation cocktail for the
LSC, was purchased from PerkinElmer.
Paints, Lotrec Mark 5 hard paint and Lotrec TF semi-polished paint, were provided by Lefant and
were formulated specially without biocides.
C-14 labeled medetomidine in ethanol was purchased from IZOTOP, with a concentration of 4.14 g/L
and a radioactivity of 4,831.8 MBq/g. The non-radioactive biocides were in powder form. 99%
medetomidine was obtained from the Marine Paint program and was originally a gift from I-TECH AB.
Seanine was purchased from Rohm & Haas. Irgarol and tolyfluanid were provided by the Marine
Paint Group.
3.2. Encapsulation
The essential steps of microencapsulation were the preparation of solutions, emulsion
homogenization, and solvent evaporation.
To prepare the oil phase, 0.75g of biocide was dissolved together with 4g of PMMA, 57ml of DCM
and 3.8ml of acetone, while stirring at 250 rpm. Each oil phase contained only one type of biocide.
The oil phase was mixed with 80ml of 2% PVA solution, by stirring with a Heidolph Silent Crusher M,
at 10,000 rpm for 55 minutes, to form an oil-in-water emulsion. The 2% PVA solution was prepared
by dissolving 4g of PVA in 200ml of Milli-Q water, while stirring at 250 rpm, and while maintaining a
temperature of 90°C.
The mixture was added to 120ml of 2% PVA solution, and was stirred at 250 rpm with a magnetic
stirrer overnight. Microspheres were then formed after solvent evaporation. The microsphere size

distribution was then measured using light microscopy. The microsphere images obtained from light
microscopy were processed using SigmaScan, MATLAB, and Origin.
The microsphere suspension was centrifuged at 2,000 rpm for 15 minutes. The concentrated layer of
the microsphere suspension was stored in a glass vial, in the dark.
3.3. Release measurement
The experimental set-up is shown in Figure 7. We applied two methods to determine the biocide
concentration in the release medium.
Figure 7. Experimental set-up used to leach biocides from marine paint coatings.
3.3.1. Release measurement preparation
The experimental set-up was checked for accuracy by a set of “nill” experiments. First, the saturation
concentration of each biocide in the release medium was measured by adding biocide in excess to
10ml of artificial salt water under sonication for three days. The biocide solution was then filtered
with a 200nm filter. The biocide concentration was then calculated using a HP 8453 UV-Visible
Spectrophotometer and a calibration curve. This experiment was used to calculate the maximum
allowable amount of biocide in the coating, as well as the amount of release medium required to
ensure that the biocide concentration would never approach saturation. The maximum allowed
concentration in the water phase was decided to be 10% of the saturation concentration.
Second, the density of, and percentage of solvent in, the paints was analyzed by air-drying a
controlled volume of wet paint in a fume hood for one week, and then measuring the weight
difference.
Third, the detection limits of each analytical instrument used in this project were determined by
diluting known concentrations of biocide solutions.
The last “nill” experiment was to test the maximum allowable microparticle concentration in the
paint formulation. Microspheres were added to hard and semi-polished paint to obtain a
microsphere concentration of 1%, 5%, and 10%. These coatings were then placed into the release
medium under test conditions. After ten days, a scratch experiment was conducted to determine the
mechanical toughness of the surface. The maximum percentage of microspheres that could be added
to the paints (1% of microspheres) was subsequently used for all the experiments. Next, we ensured
that non-encapsulated biocides could be added to the formulation, and the maximum allowable
concentration was determined to be 0.2%.
3.3.1.1. Paint formulation
0.1g of a concentrated microsphere suspension was added to 5g of paint (to achieve a microsphere
concentration of 1%). The microsphere concentration was verified by determining its dry weight.
Throughout the project, we assumed that the concentrated suspension contained 50% microspheres.
In the paint systems with free biocide, 0.0075g of biocide was added to 5g of paint (to achieve a
biocide concentration of 0.2%). Each formulation was mixed manually to obtain a finely dispersed
system.
The radiolabeled paint samples were prepared with C-14 labeled biocide using the same method
described above.
3.3.1.2. Surface coating
The paint formulations were coated onto separate poly(propylene) (PP) plates, which have a defined
thickness and a controlled wet volume. For each experiment, the paint was applied as triplicate on
one side of the smooth PP surface using a paint applicator (5cmx5cmx50µm). The paint was air-dried
in a fume hood for two days. The dry content of the formulated paint on each plate was calculated by
assuming that the applied paint volume on each plate was accurate and constant.
Blanks were prepared, using paints without biocide, and were applied using the same procedure
described above.
3.3.1.3. Release medium
The release medium was prepared according to ISO 15181-1:2000(E). Sodium chloride was added to
Milli-Q water, to obtain a salinity between 33 and 34 psu. The salinity was measured with a MeterLab
CDM210 conductivity meter. The acidity of the artificial salt water was measured with a Metrohm
744 pH meter, and was adjusted with 0.1M hydrochloric acid solution and 0.1M sodium hydrogen
carbonate solution to obtain a pH between 7.9 and 8.1.
The dried coated plates were put into individual glass breakers, filled with 350ml artificial salt water
(500ml for systems containing medetomidine) under a slow circular motion of 50 rpm. Each beaker
was sealed with parafilm. The release measurement was conducted in a 25°C temperature controlled
room.
If the biocide concentration in the release medium exceeded the saturation concentration, the
release medium was replaced with fresh artificial salt water.
3.3.2. Sampling
Sampling was conducted frequently during the first ten days, and was continued for three and a half
months. For each sampling event, 20ml of release medium (5ml for samples containing
medetomidine) was removed and 20ml of fresh artificial salt water (5ml for samples containing
medetomidine) was added back into the breakers. Samples were stored at -20°C.
3.3.3. Measurement
Two different analytical methods were employed to determine the biocide concentration in each
sample. Both methods gave reliable results, which correlated to each another.
3.3.3.1. Liquid scintillation counter
The LSC used in this project was located in the Nuclear Chemistry Department at Chalmers University
of Technology. The LSC was used to analyze samples containing medetomidine.
3.3.3.1.1. Sample preparation
The samples were thawed for 30 minutes and the scintillation cocktail was removed from the fridge
three hours before use. A 2ml sample was added to 18ml of scintillation cocktail in a 20ml plastic
scintillation vial. The mixture was shaken until it was visibly clear. The mixtures were stored at 4°C
prior to measurement.
3.3.3.1.2. Radioactivity measurement
The activity of the C-14 labeled medetomidine in each sample was detected for 600s. The measured
net sample count rate (distintegrations per minute (dpm)) was compared to the activity of the
original C-14 labeled medetomidine solution, to calculate the amount of labeled medetomidine in
each sample.
3.3.3.2. High-performance liquid chromatography coupled with a diode array ultraviolet
detector
The HPLCDAD (Waters Acquity UPLC Console) used in this project was suited at the Norwegian
Institute for Water Research, and was equipped with an ACQUITY UPLC BEH C18 1.7µm, 2.1 x 50mm
column. The HPLCDAD was used to analyze samples containing seanine, irgarol, and tolyfluanid.
3.3.3.2.1. Sample preparation
The samples were thawed for 30 minutes and then were loaded into individual activated Waters
OASIS HLB cartridges (6cc/150mg 60µm).
The cartridges were activated using one cartridge volume of methanol, followed by two cartridge
volumes of Milli-Q water. Samples were then loaded into a separated cartridge together with 100ng
of atrazine at a rate of approximately 4ml/min. Another cartridge volume of Milli-Q water was added
to flush out the sodium chloride in the sample. The cartridges were completely dried, wrapped in
aluminum foil, and were frozen at -20°C before sample elution.
Prior to sample elution, the cartridges were thawed for 30 minutes, then 1ml methanol was added,
and the methanol was allowed to soak into the sorbent for 5 minutes. One column volume of
methanol was introduced to elute the sample at a rate of approximately 4ml/min. The eluted sample
was dried completely under nitrogen and was re-dissolved in 0.5ml of methanol. The concentrated
sample was then transferred to a 2ml HPLC vial. A screw cap with a polytetrafluoroethylene (PTFE)
liner was put on the vials and the vials were frozen at -20°C before measurement.
3.3.3.2.2. Concentration measurement
The prepared samples were thawed for 30 minutes before measurement.
The HPLC solvents were 60% buffered water solution and 40% buffered methanol solution. The
buffer consisted of 10mM ammonium acetate and 1% acetic acid. The washing solution was 50%
methanol. The sample flow rate was 0.6ml/min at 50°C and the sample injection volume was 7µl.
The biocide concentration in each sample was automatically calculated using a calibration curve
created from a series of mixed biocide stock solutions.
3.4. Reliability
The experimental procedures were reliable but the overall protocol could not be published because
the degradation rates of the biocides were not measured and any changes in the release medium
during the release measurement were not quantified.

However, the set-up and the results from this project could be used as fundamental information for
further studies on the release patterns of anti-fouling biocides.
3.4.1. Error measurement
Two assumptions were made while designing the experimental set-up. First, the dry content of the
concentrated microsphere suspension was assumed to be 50%. We arrived at this value after
measuring the dry content of ten replicates, which gave an average dry content of 50.25%, with an
error range of ±1%.
Second, the painted area and the painted volume on each coated surface were assumed to be
constant. This was confirmed by measuring the size of the painted area of ten replicates using
MATLAB, and by calculating the painted volume using the density of the paint and the percentage of
the dry content of the paint. The difference between the actual and the theoretical painted area was
within ±5%. The standard error of the difference between the calculated painted volume and the
theoretical painted volume was 0.89%.
3.4.2. Detector efficiency
Data collected from the LSC had units of disintegrations per minute (dpm) instead of counts per
minute (cpm). Thus, the counting efficiency was unimportant, and this set-up was perfect for
measuring nuclei with low energy emission, such as C-14.
For the HPLCDAD, the cartridge recovery was investigated. By studying the recovery of atrazine (the
internal standard), the average recovery of the solid phase separation process was calculated to be
100.67%. The difference in recovery between samples was considered when the data was analyzed.
The detection efficiency of the HPLCDAD was determined by injecting an atrazine spike. The
efficiency was found to be 110.9%. This abnormal efficiency could have resulted from a failure to
subtract the background. However, since the coefficient of determination (R2) of the calibration
curves were over 97%, the background noise in each measurement was stable and could be averaged
out.
3.4.3. Triplet sample
Each paint formulation was coated onto surfaces in triplicate, which lead to results with good
statistical accuracy.
4. RESULTS AND ANALYSIS
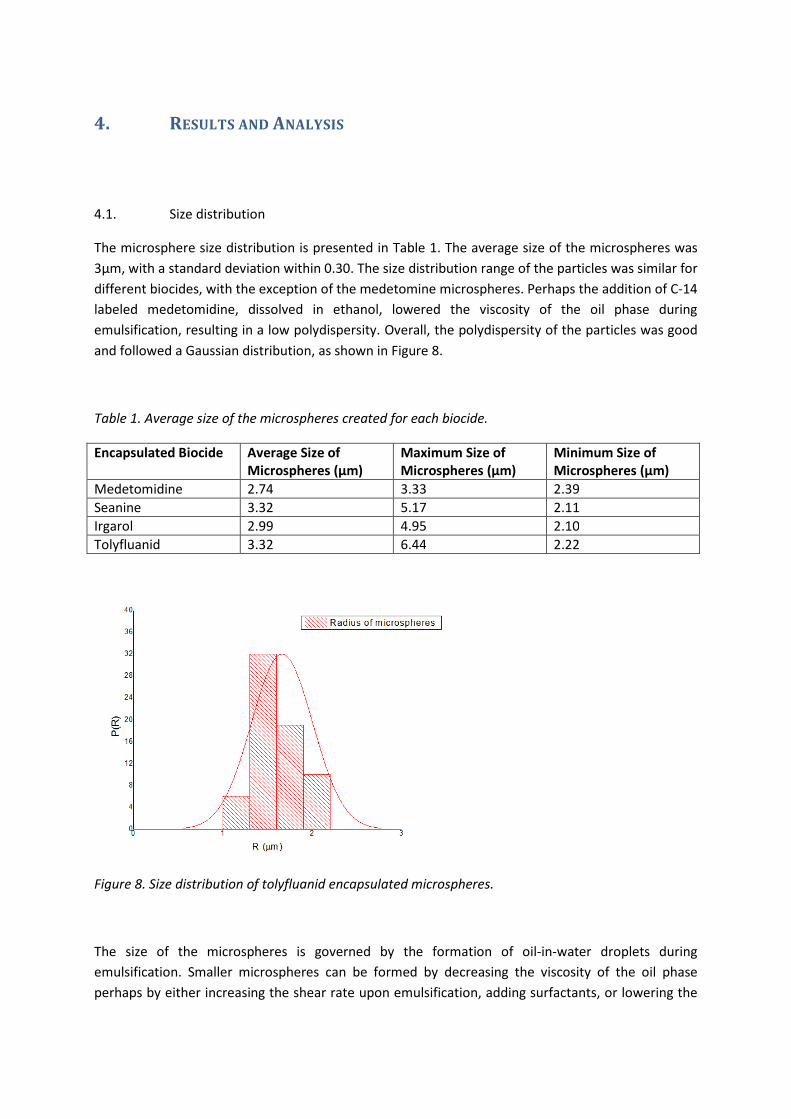
4.1. Size distribution
The microsphere size distribution is presented in Table 1. The average size of the microspheres was
3µm, with a standard deviation within 0.30. The size distribution range of the particles was similar for
different biocides, with the exception of the medetomine microspheres. Perhaps the addition of C-14
labeled medetomidine, dissolved in ethanol, lowered the viscosity of the oil phase during
emulsification, resulting in a low polydispersity. Overall, the polydispersity of the particles was good
and followed a Gaussian distribution, as shown in Figure 8.
Table 1. Average size of the microspheres created for each biocide.
Encapsulated Biocide Average Size of
Microspheres (µm)
Maximum Size of
Microspheres (µm)
Minimum Size of
Microspheres (µm)
Medetomidine 2.74 3.33 2.39 Seanine 3.32 5.17 2.11 Irgarol 2.99 4.95 2.10 Tolyfluanid 3.32 6.44 2.22
Figure 8. Size distribution of tolyfluanid encapsulated microspheres.
The size of the microspheres is governed by the formation of oil-in-water droplets during
emulsification. Smaller microspheres can be formed by decreasing the viscosity of the oil phase
perhaps by either increasing the shear rate upon emulsification, adding surfactants, or lowering the
molecular weight of the shell material. The smallest microparticles currently synthesized range in size
from 20nm to 100nm.
Theoretically, paint systems containing smaller microspheres will release the active component
faster, because the total surface area of the microspheres is comparatively large. Most studies have
found that the optimum microparticle size for releasing compounds from paint coatings ranges from
3µm to 5µm.
4.2. Biocide release patterns
The biocide release patterns were developed using individual scatter plots of released biocide
concentration versus time.
Each biocide had a particular release behavior, which changed with the paint matrix. Because the
percentage of biocide loaded in each formulated paint, and the initial release environment for each
paint system were similar, we conclude that the permeability of the biocide significantly affected the
release rate. As can be seen in the equation below, the flux of the biocide from the paint matrix is
dependent upon the biocide concentration and its permeability through the paint matrix.
Flux (mol/s) = c Ƥ
In the equation above, c represents biocide concentration and Ƥ represents permeability.
Based on the results, biocides with a higher polarity may diffuse faster from the microsphere to the
artificial release medium. For biocides with a similar polarity, those with a higher molecular weight
and a longer linear carbon chain had a slower diffusion rate. The results also showed that some
encapsulated biocides may leach out from the microspheres during the paint formulation step. It is
possible that these biocides were highly soluble in the organic solvents used in the paint. This issue
will be discussed further in section 4.2.5.
4.2.1. Medetomidine
The medetomidine release pattern was observed with radioactive measurement. The degradation of
medetomidine was neglected because radioactive C-14 has a long half-life. The release of
encapsulated medetomidine from both hard paint and semi-polished paint was a factor of four lower
than that of free medetomidine at all time-points, as shown in Figure 9. The maximum release of
encapsulated medetomidine from both paints was 15%, while the maximum release of free
medetomidine was 55%. These results confirm that medetomidine partitions in PMMA, which results
in a longer diffusion time through the paint matrix into the release medium, and a prolonged biocide
protection.
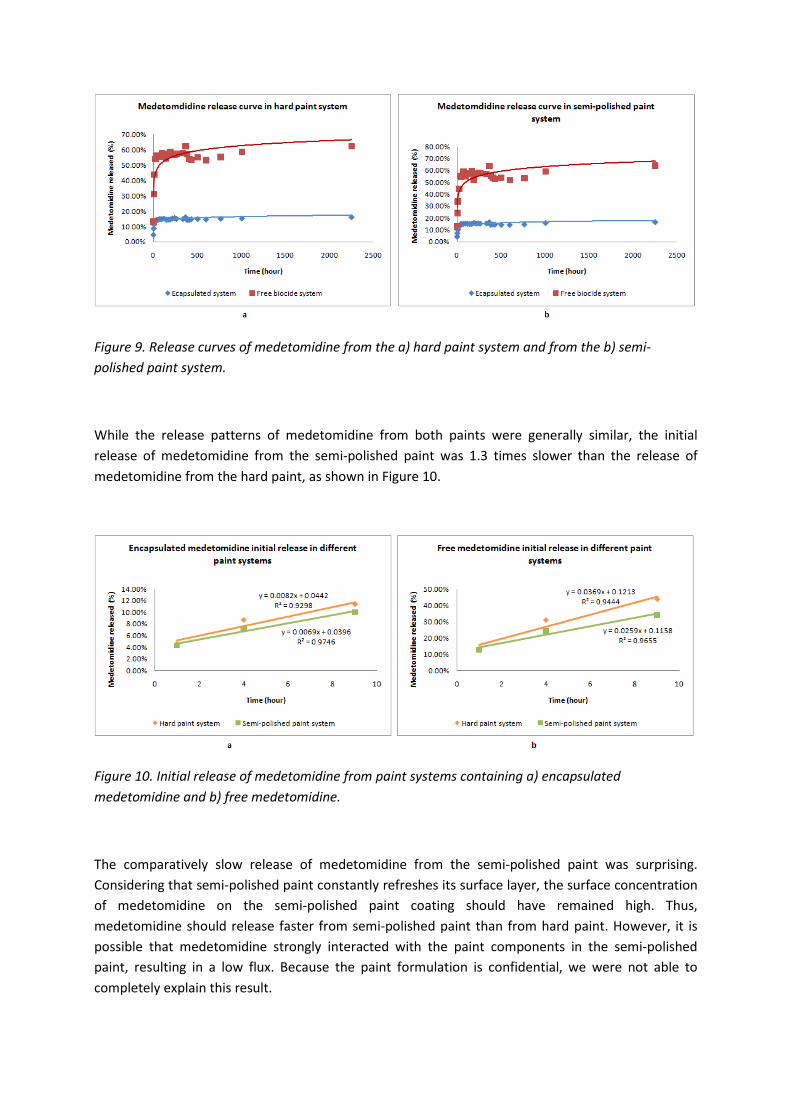
Figure 9. Release curves of medetomidine from the a) hard paint system and from the b) semi-
polished paint system.
While the release patterns of medetomidine from both paints were generally similar, the initial
release of medetomidine from the semi-polished paint was 1.3 times slower than the release of
medetomidine from the hard paint, as shown in Figure 10.
Figure 10. Initial release of medetomidine from paint systems containing a) encapsulated
medetomidine and b) free medetomidine.
The comparatively slow release of medetomidine from the semi-polished paint was surprising.
Considering that semi-polished paint constantly refreshes its surface layer, the surface concentration
of medetomidine on the semi-polished paint coating should have remained high. Thus,
medetomidine should release faster from semi-polished paint than from hard paint. However, it is
possible that medetomidine strongly interacted with the paint components in the semi-polished
paint, resulting in a low flux. Because the paint formulation is confidential, we were not able to
completely explain this result.
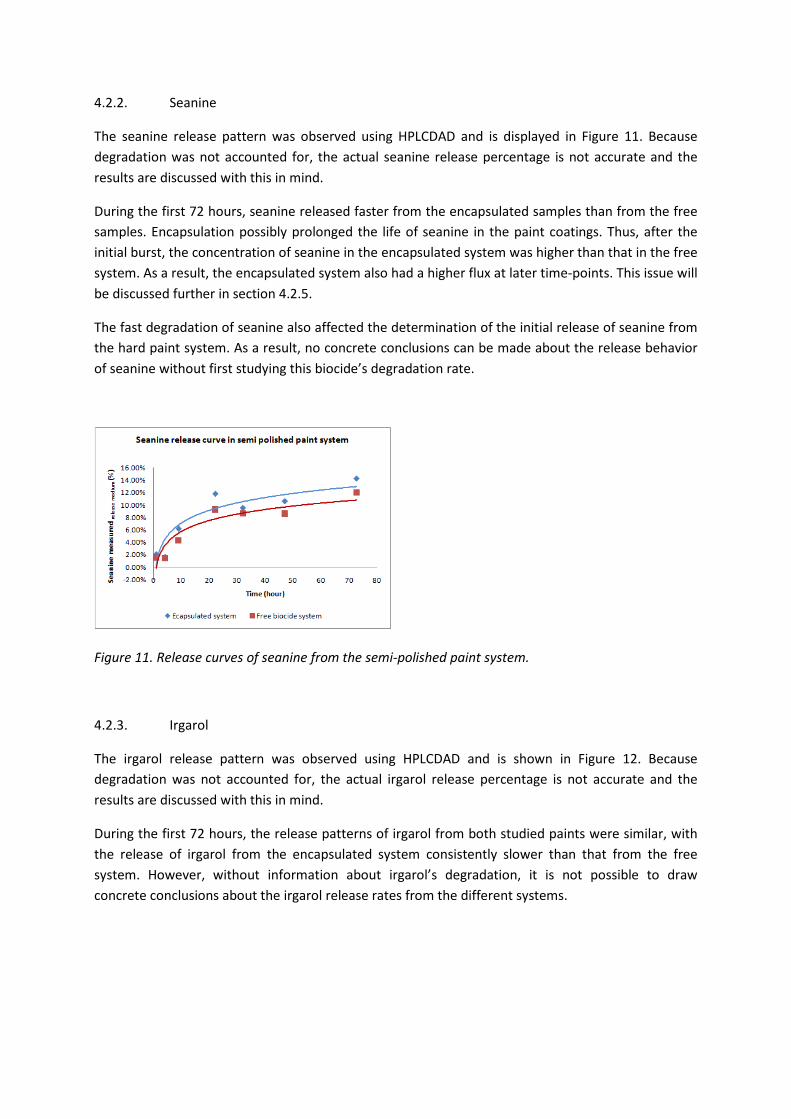
4.2.2. Seanine
The seanine release pattern was observed using HPLCDAD and is displayed in Figure 11. Because
degradation was not accounted for, the actual seanine release percentage is not accurate and the
results are discussed with this in mind.
During the first 72 hours, seanine released faster from the encapsulated samples than from the free
samples. Encapsulation possibly prolonged the life of seanine in the paint coatings. Thus, after the
initial burst, the concentration of seanine in the encapsulated system was higher than that in the free
system. As a result, the encapsulated system also had a higher flux at later time-points. This issue will
be discussed further in section 4.2.5.
The fast degradation of seanine also affected the determination of the initial release of seanine from
the hard paint system. As a result, no concrete conclusions can be made about the release behavior
of seanine without first studying this biocide’s degradation rate.
Figure 11. Release curves of seanine from the semi-polished paint system.
4.2.3. Irgarol
The irgarol release pattern was observed using HPLCDAD and is shown in Figure 12. Because
degradation was not accounted for, the actual irgarol release percentage is not accurate and the
results are discussed with this in mind.
During the first 72 hours, the release patterns of irgarol from both studied paints were similar, with
the release of irgarol from the encapsulated system consistently slower than that from the free
system. However, without information about irgarol’s degradation, it is not possible to draw
concrete conclusions about the irgarol release rates from the different systems.
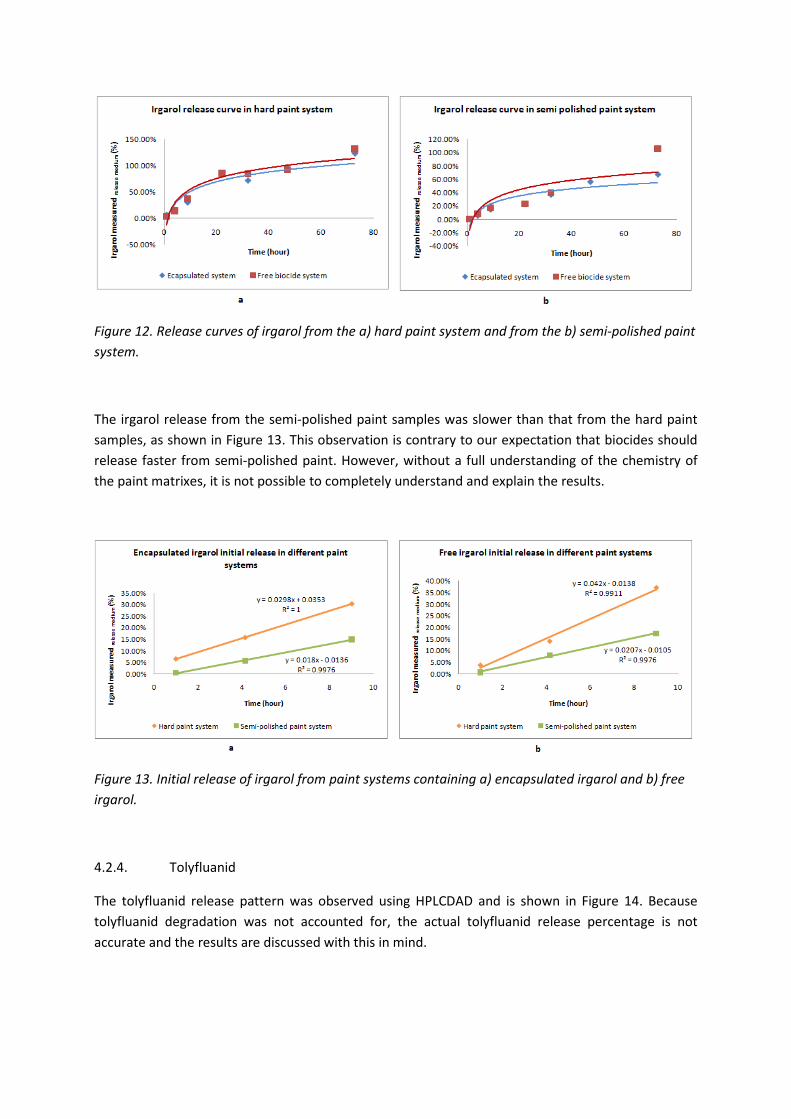
Figure 12. Release curves of irgarol from the a) hard paint system and from the b) semi-polished paint
system.
The irgarol release from the semi-polished paint samples was slower than that from the hard paint
samples, as shown in Figure 13. This observation is contrary to our expectation that biocides should
release faster from semi-polished paint. However, without a full understanding of the chemistry of
the paint matrixes, it is not possible to completely understand and explain the results.
Figure 13. Initial release of irgarol from paint systems containing a) encapsulated irgarol and b) free
irgarol.
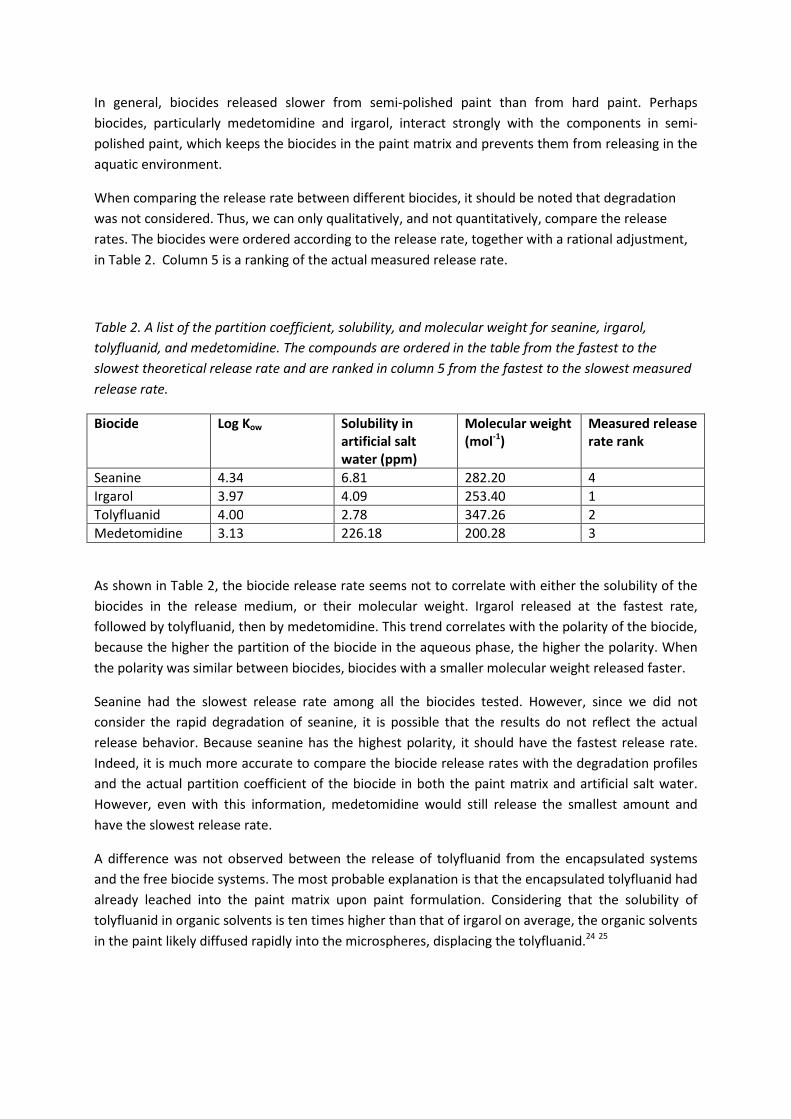
4.2.4. Tolyfluanid
The tolyfluanid release pattern was observed using HPLCDAD and is shown in Figure 14. Because
tolyfluanid degradation was not accounted for, the actual tolyfluanid release percentage is not
accurate and the results are discussed with this in mind.
The release of encapsulated and free tolyfluanid during the first 72 hours from the semi-polished
paint followed a very similar pattern. However, without information about tolyfluanid’s degradation
profile, we are not able to draw concrete conclusions, nor can we characterize the release pattern of
tolyfluanid from hard paint.
Figure 14. Release curves of tolyfluanid from the semi-polished paint system.
4.2.5. Summaries and comparisons
The results demonstrate that radioactive measurement is advantageous to HPLCDAD because
degradation does not factor into the analysis. Therefore, we could easily characterize the release of
medetomidine from the paint, since it employed the former methodology, but not the release of
seanine, irgarol, or tolyfluanid, without considering their degradation profiles.
With the exception of seanine, encapsulation decreased the release rate of the biocides from the
paint. Seanine’s abnormal behavior may be due to seanine’s extremely rapid degradation rate (the
half-life of seanine is less than one day). Perhaps when the initial burst took place, seanine in the free
biocide systems released faster than that in the encapsulated systems. However, the released
seanine during the initial burst was degraded before the first sampling, due to its very short half-life.
As a result, the seanine concentration remaining in the release medium from both the free and
encapsulated systems was similar. This unusual phenomenon would only be found in cases where
biocides in the release medium were mostly degraded before the first sampling event. In other
words, it would only happen when the biocide has an extremely short half-life. Alternatively, perhaps
the concentration of seanine in the encapsulated systems was higher than that in the free biocide
systems, resulting in a higher flux from the encapsulated systems. Thus, the release rate of seanine
from the encapsulated systems was actually higher than that from the free biocide systems.
Additional study about the degradation profile of seanine is necessary to confirm a hypothesis.
The release of medetomidine was measured for three months. The maximum release of
medetomidine from the free biocide systems was much higher than that from the encapsulated
systems, 55% and 15%, respectively. The release rate of medetomidine from the semi-polished paint
system was 1.3 times slower than that from the hard paint system.
In general, biocides released slower from semi-polished paint than from hard paint. Perhaps
biocides, particularly medetomidine and irgarol, interact strongly with the components in semi-
polished paint, which keeps the biocides in the paint matrix and prevents them from releasing in the
aquatic environment.
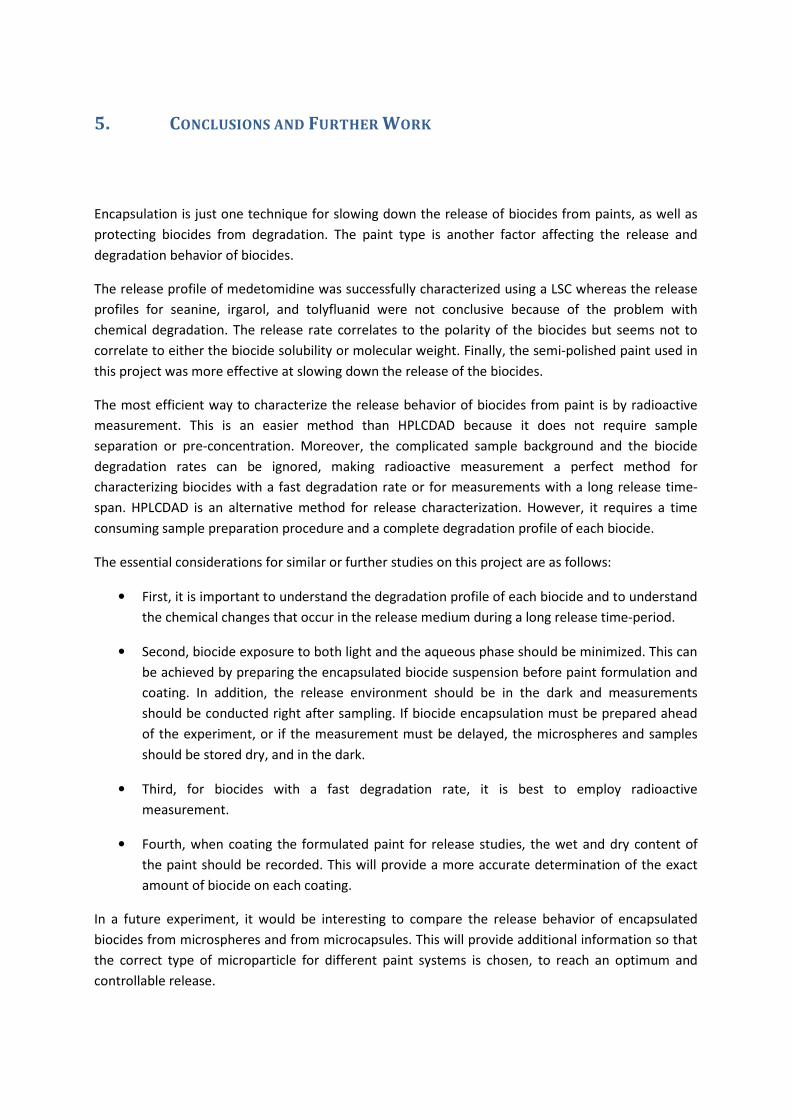
When comparing the release rate between different biocides, it should be noted that degradation
was not considered. Thus, we can only qualitatively, and not quantitatively, compare the release
rates. The biocides were ordered according to the release rate, together with a rational adjustment,
in Table 2. Column 5 is a ranking of the actual measured release rate.
Table 2. A list of the partition coefficient, solubility, and molecular weight for seanine, irgarol,
tolyfluanid, and medetomidine. The compounds are ordered in the table from the fastest to the
slowest theoretical release rate and are ranked in column 5 from the fastest to the slowest measured
release rate.
Biocide Log Kow Solubility in
artificial salt
water (ppm)
Molecular weight
(mol-1
)
Measured release
rate rank
Seanine 4.34 6.81 282.20 4 Irgarol 3.97 4.09 253.40 1 Tolyfluanid 4.00 2.78 347.26 2 Medetomidine 3.13 226.18 200.28 3
As shown in Table 2, the biocide release rate seems not to correlate with either the solubility of the
biocides in the release medium, or their molecular weight. Irgarol released at the fastest rate,
followed by tolyfluanid, then by medetomidine. This trend correlates with the polarity of the biocide,
because the higher the partition of the biocide in the aqueous phase, the higher the polarity. When
the polarity was similar between biocides, biocides with a smaller molecular weight released faster.
Seanine had the slowest release rate among all the biocides tested. However, since we did not
consider the rapid degradation of seanine, it is possible that the results do not reflect the actual
release behavior. Because seanine has the highest polarity, it should have the fastest release rate.
Indeed, it is much more accurate to compare the biocide release rates with the degradation profiles
and the actual partition coefficient of the biocide in both the paint matrix and artificial salt water.
However, even with this information, medetomidine would still release the smallest amount and
have the slowest release rate.
A difference was not observed between the release of tolyfluanid from the encapsulated systems
and the free biocide systems. The most probable explanation is that the encapsulated tolyfluanid had
already leached into the paint matrix upon paint formulation. Considering that the solubility of
tolyfluanid in organic solvents is ten times higher than that of irgarol on average, the organic solvents
in the paint likely diffused rapidly into the microspheres, displacing the tolyfluanid.24 25
5. CONCLUSIONS AND FURTHER WORK
Encapsulation is just one technique for slowing down the release of biocides from paints, as well as
protecting biocides from degradation. The paint type is another factor affecting the release and
degradation behavior of biocides.
The release profile of medetomidine was successfully characterized using a LSC whereas the release
profiles for seanine, irgarol, and tolyfluanid were not conclusive because of the problem with
chemical degradation. The release rate correlates to the polarity of the biocides but seems not to
correlate to either the biocide solubility or molecular weight. Finally, the semi-polished paint used in
this project was more effective at slowing down the release of the biocides.
The most efficient way to characterize the release behavior of biocides from paint is by radioactive
measurement. This is an easier method than HPLCDAD because it does not require sample
separation or pre-concentration. Moreover, the complicated sample background and the biocide
degradation rates can be ignored, making radioactive measurement a perfect method for
characterizing biocides with a fast degradation rate or for measurements with a long release time-
span. HPLCDAD is an alternative method for release characterization. However, it requires a time
consuming sample preparation procedure and a complete degradation profile of each biocide.
The essential considerations for similar or further studies on this project are as follows:
• First, it is important to understand the degradation profile of each biocide and to understand
the chemical changes that occur in the release medium during a long release time-period.
• Second, biocide exposure to both light and the aqueous phase should be minimized. This can
be achieved by preparing the encapsulated biocide suspension before paint formulation and
coating. In addition, the release environment should be in the dark and measurements
should be conducted right after sampling. If biocide encapsulation must be prepared ahead
of the experiment, or if the measurement must be delayed, the microspheres and samples
should be stored dry, and in the dark.
• Third, for biocides with a fast degradation rate, it is best to employ radioactive
measurement.
• Fourth, when coating the formulated paint for release studies, the wet and dry content of
the paint should be recorded. This will provide a more accurate determination of the exact
amount of biocide on each coating.
In a future experiment, it would be interesting to compare the release behavior of encapsulated
biocides from microspheres and from microcapsules. This will provide additional information so that
the correct type of microparticle for different paint systems is chosen, to reach an optimum and
controllable release.

Finally, encapsulation of pyrithion salt is the next step of the project. Among all anti-fouling biocides,
copper pyrithion is one of the most efficient chemicals at inhibiting the growth of most marine
organisms. However, it is too bipolar to be encapsulated, thus characterizing the release pattern of
this broad spectrum biocide has always been a challenge. We propose to start with encapsulation of
sodium pyrithion, with addition of amine as a co-solvent to create a less hydrophilic oil phase.
ACKNOWLEDGEMENT
First, I would like to thank Dr. Björn Dahlbäck and Professor Magnus Nydén for giving me a chance to
join this project. It has been a terrific experience to be involved with such interesting particle
research.
Throughout the whole project, my supervisor, Professor Magnus Nydén, has given me a lot of
opportunities, has been constantly inspiring, and I have learnt much from him.
I also want to thank Professor Krister Holmberg for being my examiner and for providing a good
research environment in the Applied Surface Chemistry Department at Chalmers University of
Technology.
During this year, I met many excellent people, who have helped me in different ways. I’m very
thankful for to all of you.
In TYK at Chalmers University of Technology, A. Professor Lars Nordstierna helped me design the
experiments and provided ideas on the calculations. Adele Khavari spent time helping me understand
different concepts, and offered generous help with everything. Ali Reza Movahedi, Markus
Andersson, Mariam Masuda, Dr. Chrystelle Ganachaud, and Dr. Romain Bordes shared their brilliant
thoughts during discussions about instrumentations. Ann Jakobsson created a pleasant working
environment and helped me with paperwork.
In the Nuclear Chemistry Department at Chalmers University of Technology, Professor Gunnar
Skarnemark, Dr. Stefan Allard, and Hanna Hedström kindly helped me with the radioactive
measurements.
At the Norwegian Institute for Water Research, Professor Kevin V. Thomas, Malcolm Reid, and
Katherine Langford supplied me with a lot of information about HPLCDAD and release
measurements, in addition to giving me full access to the instrument.
In the marine paint group at Chalmers University of Technology and Göteborg University, everyone
supported me with their expertise and ideas, and also helped me with the chemical materials.
Last but not least, a big thanks to my family and my friends for their endless care and
encouragements.

REFERENCES
1“Marine Paint Annual Report 2007.” Marine Paint. 20 September 2009. <www.marinepaint.se>
2 Anna Lennquist, Malin Celander, Lars Förlin. “Effects of medetomidine on hepatic EROD activity in three
species of fish.” Ecotoxicity and Enviromental Safety. 69.1. January 2008: 74-79.
3 Annelie Hilvarsson and et al. “Bioaccumulation of the new antifoulant medetomidine in marine organisms.”
Marine Environmental Research. 68.1. July 2009: 19-24.
4 Liubov S. Shtykova and et al. “NMR diffusometry and FTIR in the study of the interaction between
antifouling agent and binder in marine paints.” Progress in Organic Coatings. 51. 26 February 2004: 125-133.
5 C. Petersson and et al. “Medetomidine - effects on physiology, community structure and functional diversity
in algal and bacterial communities.” Environmental Science in a Global Society. 2 October 2009.
<http://abstracts.co.allenpress.com/pweb/setac2005/index.html>
6 Annelie Hilvarsson, Halldór Pálmar Halldórsson, Åke Granmo. “Medetomidine as a candidate antifoulant:
Sublethal effects on juvenile turbot (Psetta maxima L.).” Aquatic Toxicology. 83. 28April 2007: 238-246.
7 “Seanine.” Wikipedia. 2 October 2009. <http://www.wikipedia.org>
8 Kevin V. Thomas and et al. “Increased persistence of antifouling paint biocides when associated with paint
particles.” Environmental Pollution. 123. 16 August 2002: 153-161.
9 “SeanineTM
211N marine antifouling agent.” Rohm Haas. December 2006.
<http://www.dow.com/products/product_detail.page?display-mode=tds&product=1010157>
10 Björn Dahl, Hans Blanck. “Toxic effects of the antifouling agent irgarol 1051 on periphyton communities in
coastal water microcosms.” Marine Pollution Bulletin. 32.4. 1996: 342-350.
11Kevin V. Thomas and et al. “Increased persistence of antifouling paint biocides when associated with paint
particles.” Environmental Pollution. 123. 16 August 2002: 153-161.
12 Hideo Okamura, Yuko Sugiyama. “Photosensitized degradation of Irgarol 1051 in water.” Faculty of
Maritime Sciences, Kobe University, Japan. 2004.
13 Naoto Ogawa and et al. “Degradation of the antifouling compound Irgarol 1051 by manganese peroxidase
from the white rot fungus Phanerochaete chrysosporium.” Chemosphere. 55. 4 November 2003: 487-491
14Lenwood W. Hall Jr., Piero Gardinali. “Ecological Risk Assessment for Irgarol 1051 and Its Major Metabolite
in United States Surface Waters.” Human and Ecological Risk Assessment: An International Journal. 10.3. June
2004: 525-542.
15 Cecilia Andersson and et al. “Kontrollerad frisättning av biocider för båtbottenfärger.” Chalmers University,
Sweden. 20 May 2009.
16 Mette Rabolle and et al. “Determination of fungicide residues in field-grown strawberries following
different fungicide strategies against gray mold (botrytis cinerea).” Journal of Agricultural and Food
Chemistry. 54. 2006: 900-908.
17 Cecilia Andersson and et al. “Kontrollerad frisättning av biocider för båtbottenfärger.” Chalmers University,
Sweden. 20 May 2009.
18 Stephen M. Wolniak. “Principles of microscopy.” Department of Cell Biology and Molecular Genetics,
Univeristy of Maryland, U.S.. 23 July 2010.
<http://www.life.umd.edu/cbmg/faculty/wolniak/wolniakmicro.html>
19 Kathleen Hunt. “Carbon-14 in coal depositis.” The TalkOrigins Archive. 22 May 2002. 25 July 2010.
<http://www.talkorigins.org/faqs/c14.html>
20 Gregory Choppin, Jan Rydberg, Jan-Olov Likjenzin. Radiochemistry and Nuclear Chemistry (Third Edition). UK:
Butterworth Heinemann, 2002. pp 218-221.
21 F. W .Fifield and P .J. Haines. Environmental Analytical Chemistry (2nd Ed.). United States: Blackwell Science,
2000.
22 Yuri Kazakevich, Rosario LoBrutto. HPLC for Pharmaceutical Scientists. New York: John Wiley & Sons, 2007.
23Patrick Kaltenbach. “A high-sensitivity diode array detector for on-column detection in capillary
electrophoresis.” Hewlett-Packard Journal. June 1995.
24 “Irgarol 1051.” Ciba Specialty Chemicals. 7 December 2004.
25“Tolyfluanid.” Chemical Product Assessment Section, Department of Health and Ageing, Australia. 2002:
1301-1387.
APPENDIX
Appendix 1: Light microscopy spectra of microspheres encapsulated with a) medetomidine, b)
seanine, c) irgarol, and d) tolyfluanid.

Appendix 2: HPLCDAD spectra of a) a standard mixture solution, and the sample background for b)
semi-polished paint and c) hard paint systems.