Embed Size (px)
Citation preview

Overview of Current Trade in
TEXTILES & CLOTHING
Presentation at COA Meeting29th March, 2019
1

OUTLINE
World Trade in Textiles & Clothing
India’s Export Performance during 2017-2018 and 2018-2019
US Imports of Textiles & Clothing
EU28 Imports of Textiles & Clothing
Top Importers of Cotton Yarn, Fabricsand Madeups
2

World Trade in Textiles & Clothing - EXPORT
World Export Statistics of Textiles & Clothing
Million United States Dollars
Rank CountryJanuary - December % Change
2017
% Share
2017
January - September % Change
2018
% Share
20182016 2017 2017 2018
World 730,229 759,529 4.01 100.00 565,804 602,489 6.48 100.00
1 China 257316 258456 0.44 34.03 192440 200178 4.02 33.23
2 Bangladesh 34042 34910 2.55 4.60 26833 29918 11.50 4.97
3 Germany 30716 35090 14.24 4.62 25893 29610 14.36 4.91
4 India 35,529 37,442 5.38 4.93 29,213 28,332 -3.02 4.70
5 Vietnam 29837 33055 10.78 4.35 24475 27872 13.88 4.63
6 Italy 32170 33992 5.66 4.48 25264 27445 8.63 4.56
7 USA 23609 25885 9.64 3.41 19827 21073 6.28 3.50
8 Turkey 26192 26834 2.45 3.53 19788 20846 5.35 3.46
9 Hong Kong 22797 21314 -6.51 2.81 15888 15394 -3.11 2.56
10 Spain 16526 18643 12.81 2.45 13587 14636 7.73 2.43
3
World export trade in T&C increased by 6.48% from US $ 565.80 Bn during Jan-Sep 2017 toUS $ 602.48 Bn during Jan-Sep 2018.
Amongst the top ten markets, Germany reported the highest growth with growth rate of14.36% during Jan-Sep 2018.
India reported a decline of (-) 3.02% with exports decreasing from US$ 29.21 Bn inJan-Sep 2017 to US$ 28.33 Bn in Jan-Sep 2018.
China being the largest exporter with US $ 200.17 Bn showed an growth of 4.02% in Jan-Sep 2018 followed by Bangladesh, Vietnam, Italy, USA, Turkey and Spain.
Source: GTA

World Trade in Textiles & Clothing - IMPORT
Source: GTA
World Import Statistics of Textiles & Clothing
Million United States Dollars
Rank CountryJanuary - December % Change
2017
% Share
2017
January - September % Change
2018
% Share
20182016 2017 2017 2018
World 633,677 663,025 4.63 100.00 493,441 533,303 8.08 100.00
1 USA 109460 109858 0.36 16.57 82851 86035 3.84 16.13
2 Germany 49026 52239 6.55 7.88 39086 42238 8.06 7.92
3 Japan 34817 35067 0.72 5.29 25964 27742 6.85 5.20
4 China 28514 31030 8.82 4.68 22939 25904 12.93 4.86
5 France 28487 29785 4.56 4.49 22125 23926 8.14 4.49
6 UK 31396 30172 -3.90 4.55 22224 23122 4.04 4.34
7 Italy 24034 25093 4.41 3.78 18926 20592 8.81 3.86
8 Vietnam 21857 24197 10.71 3.65 17256 20299 17.63 3.81
9 Spain 21717 23034 6.07 3.47 17235 18243 5.85 3.42
10 Netherlands 19801 20955 5.83 3.16 15632 17774 13.70 3.33
4
World import trade in T&C increased by 8.08% from US $ 493.44 Bn during Jan-Sep 2017 toUS $ 533.30 Bn during Jan-Sep 2018.
During the period Jan-Sep 2018, USA is the largest importer of T&C with US $ 86.03 Bn.
China, 4th largest importer have reported a growth of 12.93% during this period Jan-Sep2018. Vietnam 8th largest imported showed highest growth of 17.63% in Jan-Sep 2018.
Germany, Japan, France, UK, Italy, Spain and Netherlands have showed positive growthduring the period Jan-Sep 2018.
TOP TEN IMPORTERS OF TEXTILES
Source: GTA
World Import Statistics of Textiles
Million United States Dollars
Rank CountryJanuary - December % Change
2017
% Share
2017
January - September % Change
2018
% Share
20182016 2017 2017 2018
World 263,704 279,602 6.03 100.00 207,728 225,150 8.39 100.00
1 USA 28128 29024 3.19 10.38 21692 23021 6.13 10.22
2 China 22413 24433 9.01 8.74 18018 20275 12.53 9.00
3 Vietnam 19201 20752 8.07 7.42 14993 17147 14.37 7.62
4 Germany 14064 14677 4.36 5.25 10964 11788 7.51 5.24
5 Bangladesh 9735 10922 12.19 3.91 7989 9449 18.27 4.20
6 Italy 9352 9845 5.27 3.52 7461 7851 5.23 3.49
7 Turkey 8442 9768 15.71 3.49 7416 7159 -3.46 3.18
8 Indonesia 7749 8227 6.16 2.94 6049 6777 12.05 3.01
9 Japan 8464 8683 2.59 3.11 6389 6733 5.39 2.99
10 UK 7592 7491 -1.32 2.68 5560 5868 5.54 2.61
5
World Import trade in Textiles increased by 8.39% from US $ 207.72 Bn during Jan-Sep 2017to US $ 225.15 Bn during Jan-Sep 2018.
United States the largest importer of textiles has increased by 6.13% from US $ 21.69 Bnduring Jan-Sep 2017 to US $ 23.02 Bn during Jan-Sep 2018.
Bangladesh, 5th largest importer reported highest growth of 18.27% during Jan-Sep 2018.
China, Vietnam, Germany, Italy, Indonesia, Japan and UK have reported positive growth duringthis period.

TOP TEN EXPORTERS OF TEXTILES
Source: GTA
World Export Statistics of Textiles
Million United States Dollars
Rank CountryJanuary - December % Change
2017
% Share
2017
January - September % Change
2018
% Share
20182016 2017 2017 2018
World 312,556 329,288 5.35 100.00 243,475 263,388 8.18 100.00
1 China 107885 112426 4.21 34.14 82587 90997 10.18 34.55
2 USA 18660 20900 12.00 6.35 16190 17269 6.67 6.56
3 India 18,554 20,008 7.83 6.08 14,984 16,281 8.65 6.18
4 Germany 14182 14765 4.11 4.48 11013 11956 8.56 4.54
5 Italy 12147 12543 3.26 3.81 9210 10005 8.63 3.80
6 Turkey 11426 12037 5.34 3.66 8779 9319 6.16 3.54
7 South Korea 11388 11423 0.30 3.47 8591 8721 1.51 3.31
8 Taiwan 9335 9499 1.77 2.88 7116 7179 0.89 2.73
9 Pakistan 7807 8023 2.77 2.44 5949 6184 3.94 2.35
10 Vietnam 5754 6752 17.35 2.05 4954 5701 15.09 2.16
6
World export trade in textiles increased by 8.18% from US $ 243.47 Bn during Jan-Sep 2017to US $ 263.38 Bn during Jan-Sep 2018.
China, being the leading exporter, reported a growth of 10.18% during Jan-Sep 2018, India(3rd largest exporter) reported a growth of 8.65% during Jan-Sep 2018.
United States (2nd largest exporter) reported a growth of 6.67% during Jan-Sep 2018.
Vietnam (10th largest exporter) reported a highest growth of 15.09% during Jan-Sep 2018.
Germany, Italy, Turkey, S.Korea, Taiwan & Pakistan reported positive growth during 2018.
TOP TEN EXPORTERS OF RMG CLOTHING
Source: GTA
World Export Statistics of RMG Clothing
Million United States Dollars
Rank CountryJanuary - December % Change
2017
% Share
2017
January - September % Change
2018
% Share
20182016 2017 2017 2018
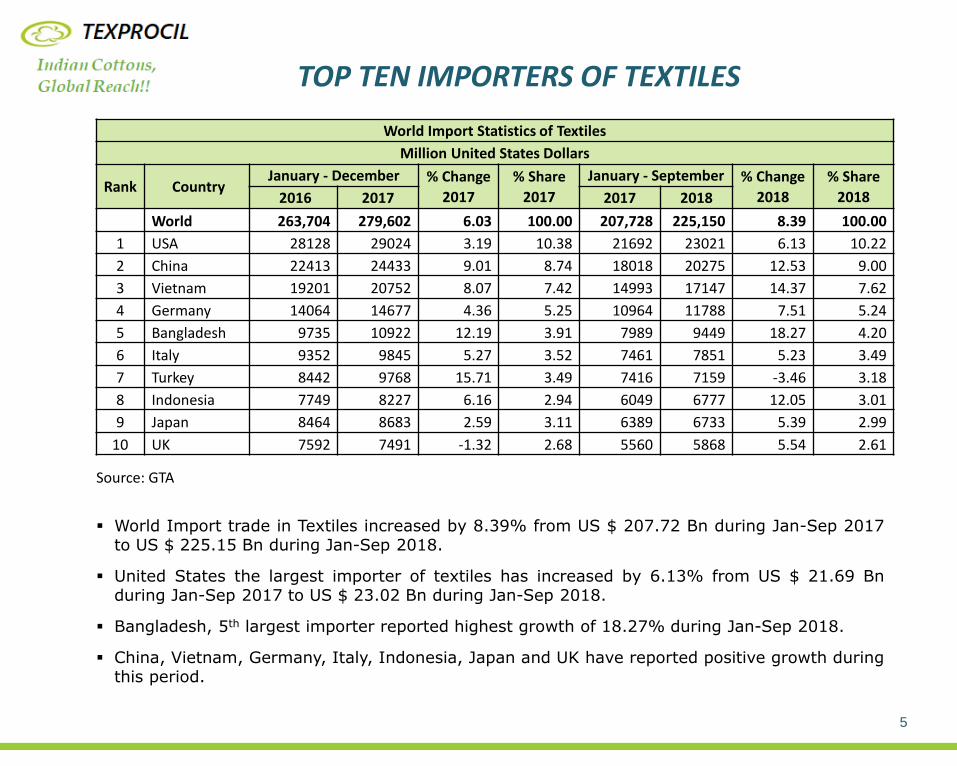
World 417,673 430,241 3.01 100.00 322,329 339,101 5.20 100.00
1 China 149431 146030 -2.28 33.94 109853 109182 -0.61 32.20
2 Bangladesh 32211 32968 2.35 7.66 25391 28462 12.10 8.39
3 Vietnam 24083 26302 9.22 6.11 19521 22171 13.58 6.54
4 Germany 16534 20325 22.93 4.72 14880 17654 18.65 5.21
5 Italy 20023 21449 7.12 4.99 16054 17440 8.63 5.14
6 India 16,975 17,434 2.70 4.05 14,229 12,052 -15.30 3.55
7 Turkey 14766 14798 0.22 3.44 11009 11527 4.70 3.40
8 Spain 12225 13824 13.09 3.21 10007 10804 7.96 3.19
9 Hong Kong 14916 13732 -7.94 3.19 10183 9763 -4.12 2.88
10 France 10048 10748 6.97 2.50 7845 8913 13.61 2.63
7
World export trade in clothing increased by 5.20% from US $ 322.32 Bn during Jan-Sep 2017 to US $ 339.10 Bn during Jan-Sep 2018.
Amongst the top ten suppliers, China (largest exporter) showed a slight decline of (-) 0.61%. Bangladesh (2nd largest exporter) reported a growth of 12.10%. Vietnam (3rd largest exporter) reported a growth of 13.58% during Jan-Sep 2018.
Germany being the 4th largest exporter reported highest growth of 18.65%.
India (6th) have declined by (-) 15.30% during Jan-Sep 2018.
Italy, Turkey, Spain and France have reported positive growth during Jan-Sep 2018.

US Trade in Textiles & Clothing - IMPORTS
Source: GTA
8
Overall imports of T&C into USA have reported a growth of 4.75% to a level of US $ 115.07Bn during Jan-Dec 2018.
India remains the third largest supplier of T&C to USA during Jan-Dec 2018, recording agrowth of 3.85% after China and Vietnam. Imports from China reported a growth of 3.91%in Jan-Dec 2018, while Vietnam (the second largest supplier) reported a growth of 6.55%in Jan-Dec 2018.
Bangladesh (4th) reported a growth of 6.77% during the period Jan-Dec 2018.
Pakistan, Honduras, Cambodia and Italy reported positive growth during Jan-Dec 2018.
Mexico & Indonesia have declined during Jan-Dec 2018.
United States Import Statistics of Textiles & Clothing
Million United States Dollars
Rank CountryJanuary - December % Share % Change
20182016 2017 2018 2016 2017 2018
World 109,460 109,858 115,072 100.00 100.00 100.00 4.75
1 China 39470 38979 40501 36.06 35.48 35.20 3.91
2 Vietnam 11067 11853 12629 10.11 10.79 10.97 6.55
3 India 7,589 7,822 8,124 6.93 7.12 7.06 3.85
4 Bangladesh 5365 5142 5490 4.90 4.68 4.77 6.77
5 Mexico 5163 5448 5404 4.72 4.96 4.70 -0.80
6 Indonesia 4965 4785 4726 4.54 4.36 4.11 -1.24
7 Pakistan 2747 2796 2909 2.51 2.55 2.53 4.03
8 Honduras 2672 2588 2714 2.44 2.36 2.36 4.87
9 Cambodia 2177 2197 2482 1.99 2.00 2.16 13.00
10 Italy 1906 1938 2142 1.74 1.76 1.86 10.54

US Trade in Textiles - IMPORTS
Source: GTA
9
The overall US imports of Textiles reported a growth of 7.38% to a level of US $ 31.16 Bnduring Jan-Dec of 2018.
India remains the second largest supplier of Textiles to USA and have reported growth of3.73% during Jan-Dec 2018.
Imports from China reported a growth of 9.49% in Jan-Dec 2018, while Mexico (the thirdlargest supplier) reported growth of 6.82% in Jan-Dec 2018.
Pakistan (4th) reported a growth of 1.06% in Jan-Dec 2018.
Turkey, South Korea, Germany, Japan & Italy reported positive growth during the period ofJan-Dec 2018.
United States Import Statistics of Textiles
Million United States Dollars
Rank CountryJanuary - December % Share % Change
20182016 2017 2018 2016 2017 2018
World 28,128 29,024 31,166 100.00 100.00 100.00 7.38
1 China 11225 11696 12806 39.91 40.30 41.09 9.49
2 India 3,919 4,113 4,267 13.93 14.17 13.69 3.73
3 Mexico 1648 1770 1891 5.86 6.10 6.07 6.82
4 Pakistan 1462 1499 1514 5.20 5.16 4.86 1.06
5 Canada 1335 1253 1245 4.75 4.32 4.00 -0.61
6 Turkey 951 1084 1211 3.38 3.73 3.89 11.70
7 South Korea 970 945 1033 3.45 3.25 3.32 9.39
8 Germany 603 639 718 2.14 2.20 2.30 12.37
9 Japan 605 615 638 2.15 2.12 2.05 3.72
10 Italy 596 589 608 2.12 2.03 1.95 3.23

US Trade in RMG Clothing - IMPORTS
Source: GTA
10
The overall US imports of Clothing reported a growth of 3.80% to a level of US $ 83.90 Bnduring Jan-Dec of 2018.
India remains the fifth largest supplier of Clothing to USA during Jan-Dec 2018, recording agrowth of 4%. Imports from China reported a growth of 1.51% in Jan-Dec 2018, whileVietnam (the second largest supplier) reported a growth of 6.35% during this period.
Bangladesh (3rd) largest supplier reported a growth of 7.12 in Jan-Dec 2018.
Cambodia (8th) recorded highest growth of 12.94% during Jan-Dec 2018.
Sri Lanka (10th) reported a decline of (-) 10.86% during Jan-Dec 2018.
United States Import Statistics of RMG Clothing
Million United States Dollars
Rank CountryJanuary - December % Share % Change
20182016 2017 2018 2016 2017 2018
World 81,333 80,834 83,906 100.00 100.00 100.00 3.80
1 China 28244 27283 27696 34.73 33.75 33.01 1.51
2 Vietnam 10703 11467 12195 13.16 14.19 14.53 6.35
3 Bangladesh 5136 4895 5243 6.31 6.05 6.25 7.12
4 Indonesia 4747 4595 4528 5.84 5.68 5.40 -1.47
5 India 3,670 3,709 3,857 4.51 4.59 4.60 4.00
6 Mexico 3516 3677 3513 4.32 4.55 4.19 -4.47
7 Honduras 2622 2542 2671 3.22 3.15 3.18 5.05
8 Cambodia 2148 2166 2446 2.64 2.68 2.92 12.94
9 El Salvador 1941 1921 1930 2.39 2.38 2.30 0.44
10 Sri Lanka 1979 1965 1752 2.43 2.43 2.09 -10.86
EU28 Trade in Textiles & Clothing - IMPORTS
Source: GTA
11
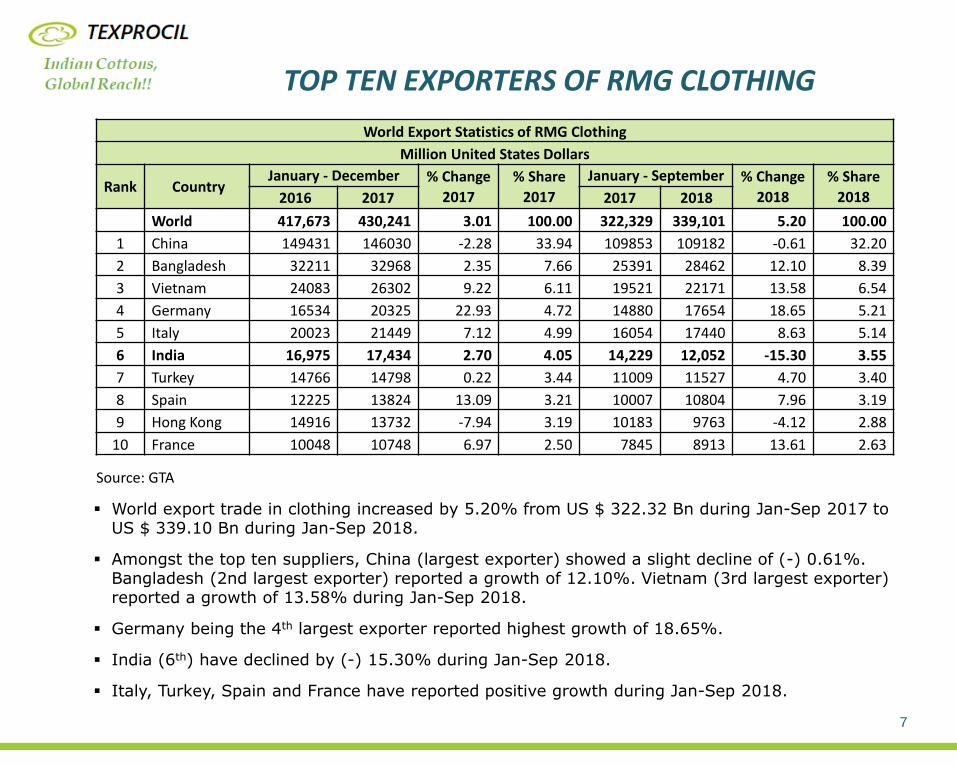
Overall imports of T&C into EU(28) have reported a growth of 6.48% to a level of US $135.45 Bn during Jan-Dec of 2018.
Import from leading supplier China have reported a growth of 3.79% in Jan-Dec 2018,while Bangladesh reported a growth of 10. 29% during the period Jan-Dec 2018.
India (4th largest supplier) reported a growth of 3.64% in Jan-Dec 2018.
Turkey, Pakistan, Cambodia, Vietnam, Morocco, Tunisia and Myanmar recorded positive growth in Jan-Dec 2018.
EU28 Import Statistics of Textiles & Clothing
Million United States Dollars
Rank CountryJanuary - December % Share % Change
20182016 2017 2018 2016 2017 2018
World 122,261 127,214 135,451 100.00 100.00 100.00 6.48
1 China 41842 42424 44033 34.22 33.35 32.51 3.79
2 Bangladesh 17039 17857 19807 13.94 14.04 14.62 10.92
3 Turkey 15999 16414 17285 13.09 12.90 12.76 5.31
4 India 8,644 8,843 9,165 7.07 6.95 6.77 3.64
5 Pakistan 5404 5943 6206 4.42 4.67 4.58 4.43
6 Cambodia 3818 4258 4679 3.12 3.35 3.45 9.90
7 Vietnam 3714 3997 4393 3.04 3.14 3.24 9.91
8 Morocco 3082 3284 3522 2.52 2.58 2.60 7.26
9 Tunisia 2466 2515 2740 2.02 1.98 2.02 8.97
10 Myanmar 765 1286 2004 0.63 1.01 1.48 55.81
EU28 Trade in Textiles - IMPORTS
Source: GTA
12
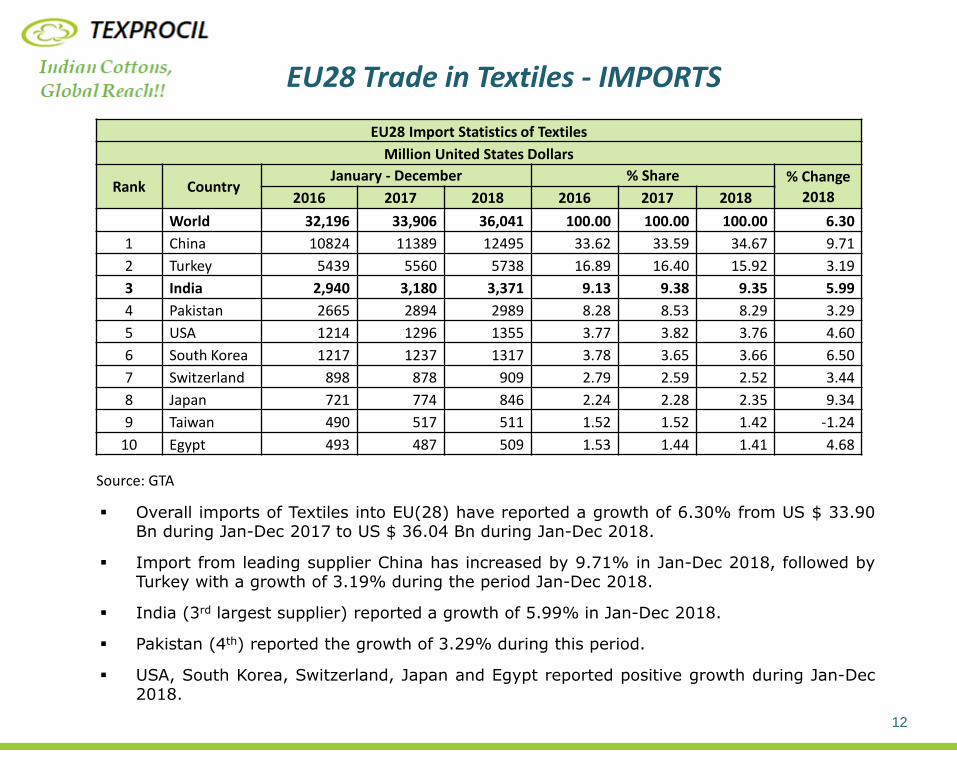
Overall imports of Textiles into EU(28) have reported a growth of 6.30% from US $ 33.90Bn during Jan-Dec 2017 to US $ 36.04 Bn during Jan-Dec 2018.
Import from leading supplier China has increased by 9.71% in Jan-Dec 2018, followed byTurkey with a growth of 3.19% during the period Jan-Dec 2018.
India (3rd largest supplier) reported a growth of 5.99% in Jan-Dec 2018.
Pakistan (4th) reported the growth of 3.29% during this period.
USA, South Korea, Switzerland, Japan and Egypt reported positive growth during Jan-Dec2018.
EU28 Import Statistics of Textiles
Million United States Dollars
Rank CountryJanuary - December % Share % Change
20182016 2017 2018 2016 2017 2018
World 32,196 33,906 36,041 100.00 100.00 100.00 6.30
1 China 10824 11389 12495 33.62 33.59 34.67 9.71
2 Turkey 5439 5560 5738 16.89 16.40 15.92 3.19
3 India 2,940 3,180 3,371 9.13 9.38 9.35 5.99
4 Pakistan 2665 2894 2989 8.28 8.53 8.29 3.29
5 USA 1214 1296 1355 3.77 3.82 3.76 4.60
6 South Korea 1217 1237 1317 3.78 3.65 3.66 6.50
7 Switzerland 898 878 909 2.79 2.59 2.52 3.44
8 Japan 721 774 846 2.24 2.28 2.35 9.34
9 Taiwan 490 517 511 1.52 1.52 1.42 -1.24
10 Egypt 493 487 509 1.53 1.44 1.41 4.68

EU28 Trade in RMG Clothing - IMPORTS
Source: GTA
13
Overall imports of clothing into EU(28) have reported a growth of 6.54% from US $ 93.30 Bnduring Jan-Dec 2017 to US $ 99.41 Bn during Jan-Dec 2018.
Leading supplier China reported a growth of 1.62% in Jan-Dec 2018, while Bangladeshreported a growth of 11.12% during Jan-Dec 2018.
Turkey recorded growth of 6.39% during this period.
India (4th largest supplier) reported a growth of 2.33% in Jan-Dec 2018.
Cambodia, Vietnam, Morocco, Pakistan, Tunisia and Myanmar recorded positive growth during this period.
EU28 Import Statistics of RMG Clothing
Million United States Dollars
Rank CountryJanuary - December % Share % Change
20182016 2017 2018 2016 2017 2018
World 90,065 93,307 99,410 100.00 100.00 100.00 6.54
1 China 31018 31034 31538 34.44 33.26 31.73 1.62
2 Bangladesh 16615 17384 19317 18.45 18.63 19.43 11.12
3 Turkey 10560 10854 11548 11.72 11.63 11.62 6.39
4 India 5,704 5,663 5,794 6.33 6.07 5.83 2.33
5 Cambodia 3798 4234 4649 4.22 4.54 4.68 9.80
6 Vietnam 3336 3578 3925 3.70 3.83 3.95 9.70
7 Morocco 2801 2991 3231 3.11 3.21 3.25 7.99
8 Pakistan 2739 3049 3217 3.04 3.27 3.24 5.52
9 Tunisia 2165 2231 2433 2.40 2.39 2.45 9.05
10 Myanmar 761 1280 1999 0.84 1.37 2.01 56.15
MAJOR IMPORTERS OF COTTON TEXTILES
Source: GTA
World Import Statistics of Cotton Textiles
Million United States Dollars
Rank CountryJanuary - December % Change
2017
% Share
2017
January - September % Change
2018
% Share
20182016 2017 2017 2018
World 93,115 97,313 4.51 100.00 71,924 77,075 7.16 100.00
1 USA 13723 14210 3.55 14.60 10727 11047 2.98 14.33
2 China 8378 8735 4.26 8.98 6370 7047 10.64 9.14
3 Vietnam 5691 5920 4.03 6.08 4313 5032 16.68 6.53
4 Bangladesh 5130 5220 1.75 5.36 3860 4530 17.36 5.88
5 Germany 4721 4894 3.67 5.03 3621 3800 4.94 4.93
6 Japan 3508 3580 2.05 3.68 2618 2717 3.78 3.53
7 Hong Kong 3598 3448 -4.15 3.54 2586 2626 1.57 3.41
8 France 2657 2813 5.91 2.89 2060 2187 6.18 2.84
9 Italy 2708 2782 2.75 2.86 2111 2135 1.13 2.77
10 Mexico 2368 2362 -0.29 2.43 1729 1837 6.30 2.38
14
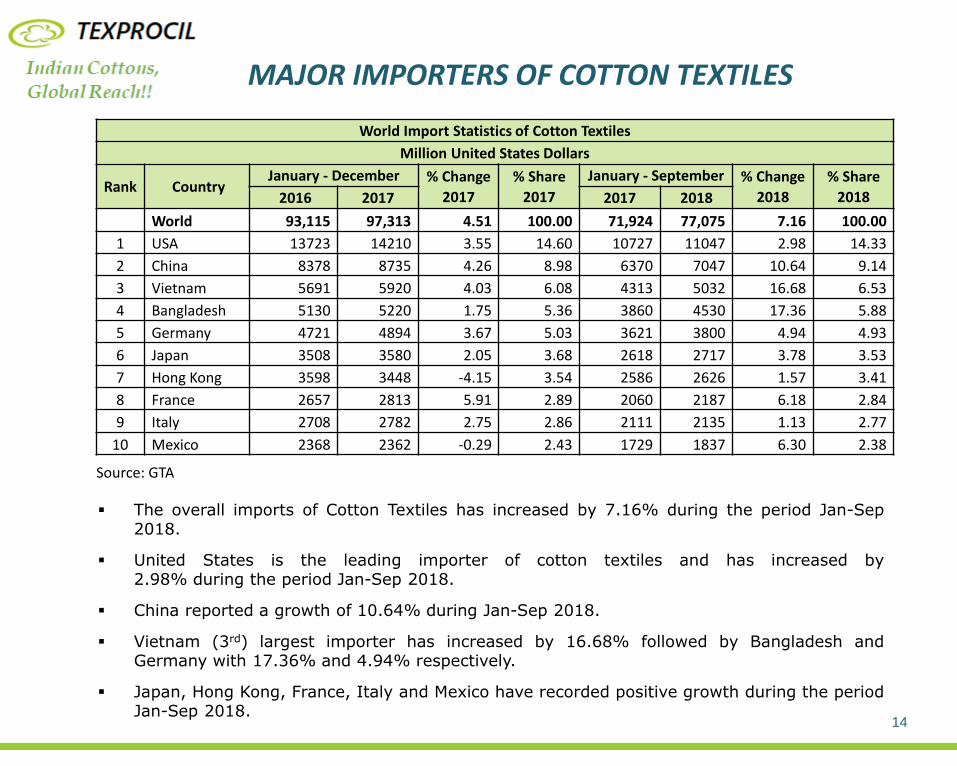
The overall imports of Cotton Textiles has increased by 7.16% during the period Jan-Sep2018.
United States is the leading importer of cotton textiles and has increased by2.98% during the period Jan-Sep 2018.
China reported a growth of 10.64% during Jan-Sep 2018.
Vietnam (3rd) largest importer has increased by 16.68% followed by Bangladesh andGermany with 17.36% and 4.94% respectively.
Japan, Hong Kong, France, Italy and Mexico have recorded positive growth during the periodJan-Sep 2018.

US Trade in Cotton Textiles - IMPORTS
Source: GTA
15
The overall US imports of Cotton Textiles during Jan-Dec 2018 reported a positive growth of4.75%.
China being the top supplier reported a growth of 7.17% in Jan-Dec 2018, followed by Indiawith a growth of 1.28% in Jan-Dec 2018.
Pakistan and Mexico recorded growth of 1.67% and 7.83% in Jan-Dec 2018.
South Korea (6th rank) recorded growth of 4.30% in Jan-Dec 2018.
Vietnam (8th rank) recorded highest growth of 6% during this period.
United States Import Statistics of Cotton Textiles
Million United States Dollars
Rank CountryJanuary - December % Share % Change
20182016 2017 2018 2016 2017 2018
World 13,723 14,210 14,884 100.00 100.00 100.00 4.75
1 China 5781 6047 6480 42.12 42.55 43.54 7.17
2 India 2,586 2,728 2,763 18.84 19.20 18.57 1.28
3 Pakistan 1328 1368 1390 9.68 9.62 9.34 1.67
4 Mexico 660 675 728 4.81 4.75 4.89 7.83
5 Canada 513 503 506 3.74 3.54 3.40 0.70
6 South Korea 308 294 307 2.25 2.07 2.06 4.30
7 Turkey 298 297 289 2.17 2.09 1.94 -2.71
8 Vietnam 235 240 254 1.71 1.69 1.71 6.00
9 Italy 238 231 236 1.73 1.62 1.58 2.24
10 Japan 223 217 216 1.63 1.53 1.45 -0.30

EU28 Trade in Cotton Textiles - IMPORTS
Source: GTA
16
The overall EU imports of Cotton Textiles has increased by 2.97% during the period Jan-Dec 2018.
Import from China has increased by 6.02% during the period Jan-Dec 2018.
Pakistan (3rd) reported a growth of 4.32% during this period.
India as the 4th largest supplier grew slightly by 0.62% during Jan-Dec 2018.
Switzerland and Vietnam have reported positive growth in Jan-Dec 2018.
EU28 Import Statistics of Cotton Textiles
Million United States Dollars
Rank CountryJanuary - December % Share % Change
20182016 2017 2018 2016 2017 2018
World 12,544 13,191 13,583 100.00 100.00 100.00 2.97
1 China 3777 3928 4165 30.11 29.78 30.66 6.02
2 Turkey 2359 2377 2382 18.81 18.02 17.54 0.22
3 Pakistan 1965 2188 2283 15.66 16.59 16.81 4.32
4 India 1,479 1,581 1,590 11.79 11.98 11.71 0.62
5 Switzerland 424 420 445 3.38 3.19 3.28 5.90
6 USA 306 326 324 2.44 2.47 2.38 -0.64
7 Bangladesh 281 323 319 2.24 2.45 2.35 -1.12
8 Egypt 266 258 257 2.12 1.96 1.89 -0.40
9 Vietnam 225 251 254 1.79 1.91 1.87 1.03
10 Korea South 235 249 246 1.87 1.89 1.81 -1.26
MAJOR IMPORTERS OF COTTON YARN
Source: GTA
World Import Statistics of Cotton Yarn
Million United States Dollars
Rank CountryJanuary - December % Change
2017
% Share
2017
January - September % Change
2018
% Share
20182016 2017 2017 2018
World 12,210 12,989 6.38 100.00 9,605 10,753 11.95 100.00
1 China 5129 5460 6.46 42.04 3940 4590 16.48 42.68
2 Bangladesh 963 1019 5.81 7.84 798 932 16.72 8.66
3 Hong Kong 779 684 -12.16 5.26 525 481 -8.32 4.48
4 Turkey 509 652 28.14 5.02 492 443 -9.87 4.12
5 South Korea 457 419 -8.28 3.23 320 413 29.00 3.84
6 Vietnam 254 308 21.13 2.37 217 337 55.08 3.13
7 Portugal 307 367 19.52 2.83 279 298 6.88 2.77
8 Italy 355 369 3.98 2.84 279 263 -5.83 2.44
9 Russia 266 304 14.39 2.34 225 250 11.11 2.32
10 Germany 215 236 9.95 1.82 179 181 1.03 1.68
17
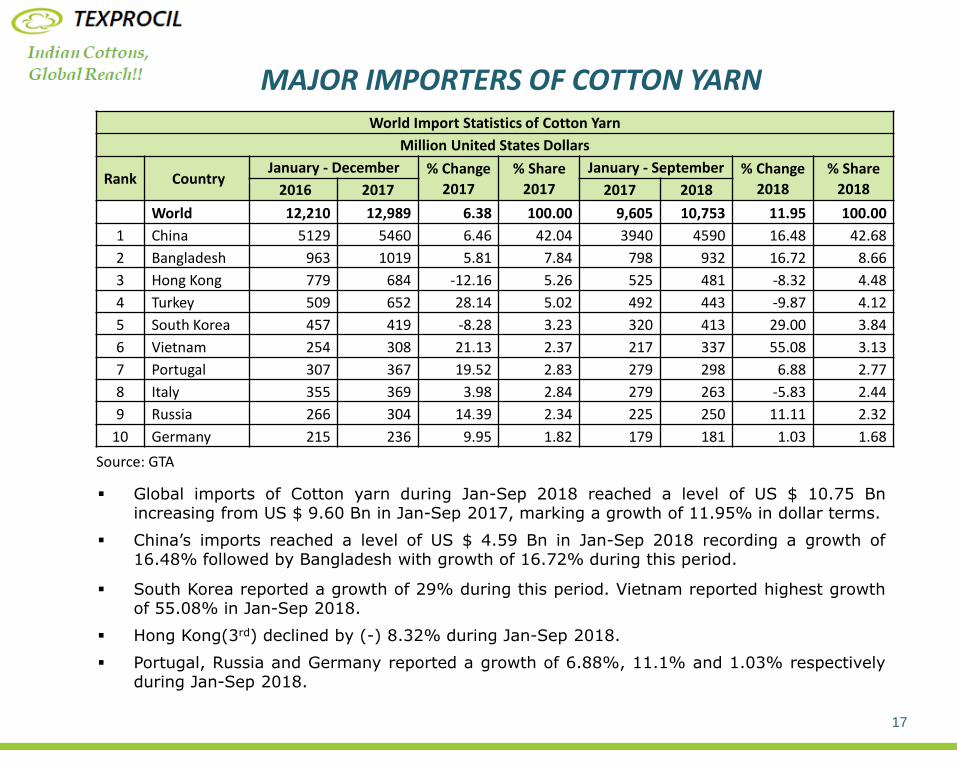
Global imports of Cotton yarn during Jan-Sep 2018 reached a level of US $ 10.75 Bnincreasing from US $ 9.60 Bn in Jan-Sep 2017, marking a growth of 11.95% in dollar terms.
China’s imports reached a level of US $ 4.59 Bn in Jan-Sep 2018 recording a growth of16.48% followed by Bangladesh with growth of 16.72% during this period.
South Korea reported a growth of 29% during this period. Vietnam reported highest growthof 55.08% in Jan-Sep 2018.
Hong Kong(3rd) declined by (-) 8.32% during Jan-Sep 2018.
Portugal, Russia and Germany reported a growth of 6.88%, 11.1% and 1.03% respectivelyduring Jan-Sep 2018.
MAJOR EXPORTERS OF COTTON YARN
Source: GTA
World Export Statistics of Cotton Yarn
Million United States Dollars
Rank CountryJanuary - December % Change
2017
% Share
2017
January - September % Change
2018
% Share
20182016 2017 2017 2018
World 12,828 13,806 7.62 100.00 10,160 11,325 11.47 100.00
1 India 3,220 3,452 7.21 25.00 2,466 3,040 23.29 26.84
2 Vietnam 2009 2489 23.92 18.03 1841 1990 8.08 17.57
3 China 1538 1637 6.42 11.86 1227 1376 12.11 12.15
4 Pakistan 1220 1247 2.22 9.03 907 1022 12.70 9.02
5 USA 1193 1253 5.01 9.07 944 939 -0.55 8.29
6 Hong Kong 807 698 -13.52 5.06 553 508 -8.29 4.48
7 Indonesia 523 592 13.13 4.29 416 478 15.07 4.22
8 Turkey 446 506 13.42 3.66 380 446 17.35 3.94
9 Taiwan 259 260 0.39 1.89 189 230 22.09 2.03
10 Italy 212 220 3.72 1.59 157 169 7.23 1.49
18
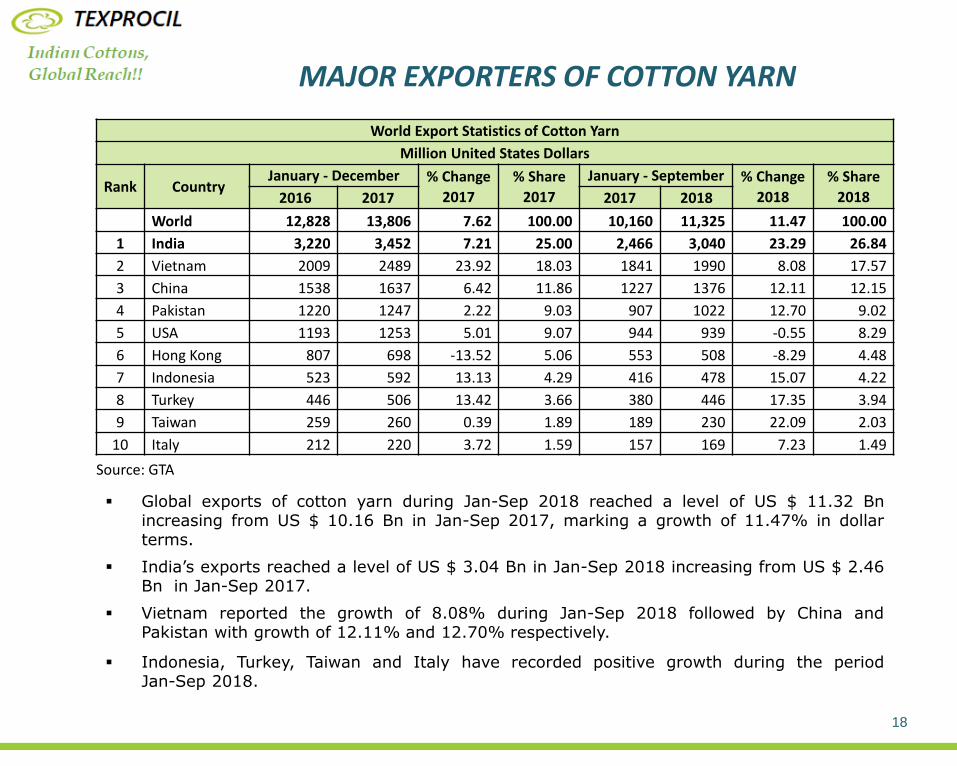
Global exports of cotton yarn during Jan-Sep 2018 reached a level of US $ 11.32 Bnincreasing from US $ 10.16 Bn in Jan-Sep 2017, marking a growth of 11.47% in dollarterms.
India’s exports reached a level of US $ 3.04 Bn in Jan-Sep 2018 increasing from US $ 2.46Bn in Jan-Sep 2017.
Vietnam reported the growth of 8.08% during Jan-Sep 2018 followed by China andPakistan with growth of 12.11% and 12.70% respectively.
Indonesia, Turkey, Taiwan and Italy have recorded positive growth during the periodJan-Sep 2018.

MAJOR IMPORTERS OF COTTON FABRICS
Source: GTA
World Import Statistics of Cotton Fabrics
Million United States Dollars
Rank CountryJanuary - December % Change
2017
% Share
2017
January - September % Change
2018
% Share
20182016 2017 2017 2018
World 43,181 44,906 3.99 100.00 33,200 35,545 7.06 100.00
1 Vietnam 4978 5125 2.95 11.41 3748 4293 14.54 12.08
2 Bangladesh 4023 4066 1.05 9.05 2959 3468 17.21 9.76
3 USA 2709 2807 3.61 6.25 2103 2225 5.81 6.26
4 China 2698 2638 -2.23 5.87 1948 1999 2.64 5.63
5 Hong Kong 2331 2298 -1.38 5.12 1717 1770 3.10 4.98
6 Indonesia 1817 1896 4.38 4.22 1378 1483 7.60 4.17
7 Cambodia 1398 1681 20.17 3.74 1239 1407 13.62 3.96
8 Mexico 1680 1643 -2.21 3.66 1203 1273 5.75 3.58
9 Germany 1436 1444 0.58 3.22 1065 1083 1.68 3.05
10 Italy 1284 1334 3.91 2.97 1017 1002 -1.48 2.82
11 India 853 978 14.57 2.18 714 838 17.41 2.36
19
The overall imports of Cotton Fabrics has increased by 7.06% during the period Jan-Sep 2018.
Vietnam reported a growth of 14.54% during the period Jan-Sep 2018.
Bangladesh showed growth by 17.21% during the period Jan-Sep 2018.
United States grew by 5.81% during this period.
Hong Kong, Indonesia, Cambodia, Mexico and Germany recorded positive growth during theperiod Jan-Sep 2018.
India (11th) has recorded highest growth of 17.41% during the period Jan-Sep 2018.

MAJOR IMPORTERS OF COTTON MADEUPS
Source: GTA
World Import Statistics of Cotton Madeups
Million United States Dollars
Rank CountryJanuary - December % Change
2017
% Share
2017
January - September % Change
2018
% Share
20182016 2017 2017 2018
World 39122 41099 5.05 100.00 30358 32185 6.02 100.00
1 USA 10873 11269 3.65 27.42 8523 8710 2.19 27.06
2 Germany 3070 3213 4.67 7.82 2377 2536 6.70 7.88
3 Japan 2669 2748 2.97 6.69 1995 2074 3.97 6.44
4 France 1886 2026 7.40 4.93 1479 1585 7.19 4.92
5 UK 1673 1653 -1.23 4.02 1202 1261 4.89 3.92
6 Netherlands 1252 1343 7.23 3.27 1004 1105 10.07 3.43
7 Italy 1068 1079 0.95 2.62 815 870 6.77 2.70
8 Canada 1001 1031 3.03 2.51 780 796 2.01 2.47
9 Australia 878 909 3.47 2.21 665 699 5.16 2.17
10 Poland 865 885 2.29 2.15 625 662 5.84 2.06
20
World Import trade in cotton Madeups has increased by 6.02% from US $ 30.35 Bn duringJan-Sep 2017 to US $ 32.18 Bn during Jan-Sep 2018.
USA major importer reported a growth of 2.19% during Jan-Sep 2018.
Netherlands reported highest growth of 10.07% during the period Jan-Sep 2018.
Germany, Japan, France, UK, Italy, Canada, Australia and Poland have showed positive growth during this period.

The Cotton Textiles Export Promotion Council
(Sponsored by Government of INDIA)Engineering Centre 5th Floor, 9 Mathew Road, MUMBAI – 400 004, INDIA
Tel: (91-22) 2363 2910 to 12 Fax: (91-22) 2363 2914
E-mail: [email protected] Website: www.texprocil.org
Thank YouFor your attention !
21