Embed Size (px)
Citation preview
Analyzing Atmospheric Variables and Baseball Statistics at Turner Field
Steve GreggEAS 4480 Data Analysis
April 24th, 2014
Overview
• Motivation• Data and Sources• Methods• Results• Summary
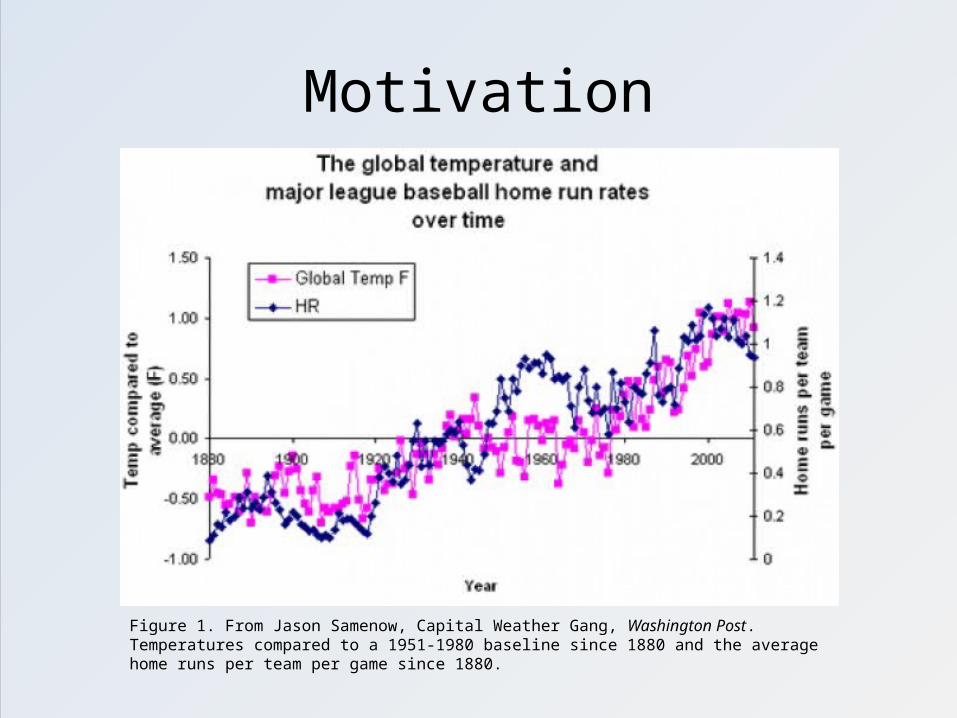
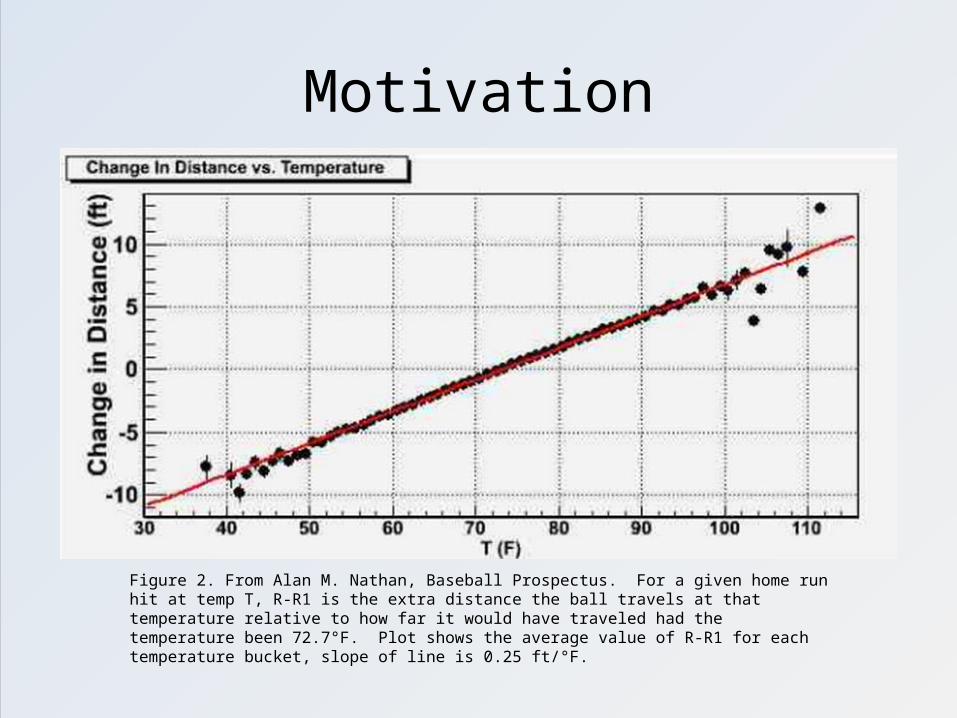
Motivation
Figure 1. From Jason Samenow, Capital Weather Gang, Washington Post. Temperatures compared to a 1951-1980 baseline since 1880 and the average home runs per team per game since 1880.
Motivation
Figure 2. From Alan M. Nathan, Baseball Prospectus. For a given home run hit at temp T, R-R1 is the extra distance the ball travels at that temperature relative to how far it would have traveled had the temperature been 72.7°F. Plot shows the average value of R-R1 for each temperature bucket, slope of line is 0.25 ft/°F.
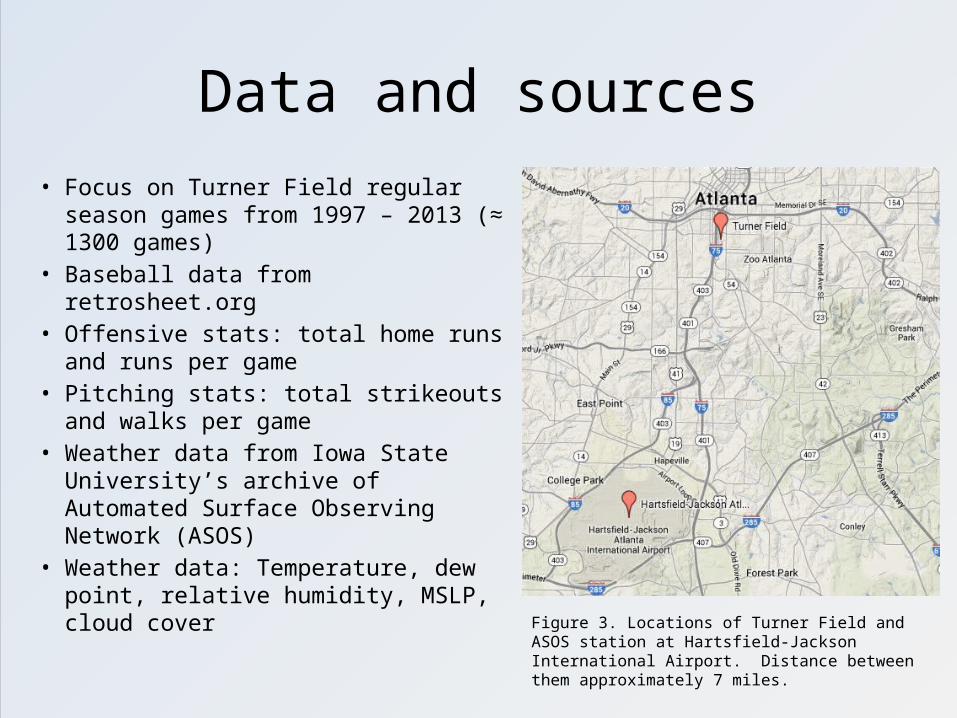
Data and sources• Focus on Turner Field regular season
games from 1997 – 2013 (≈ 1300 games)
• Baseball data from retrosheet.org• Offensive stats: total home runs and
runs per game• Pitching stats: total strikeouts and
walks per game• Weather data from Iowa State
University’s archive of Automated Surface Observing Network (ASOS)
• Weather data: Temperature, dew point, relative humidity, MSLP, cloud cover
Figure 3. Locations of Turner Field and ASOS station at Hartsfield-Jackson International Airport. Distance between them approximately 7 miles.
Methods
• Correlation coefficients calculated to determine a statistically significant relationship
• Regression analysis used to identify whether least squares, RMA, or PC best for data.
• Bootstrap done for LSR slope and correlation coefficient.
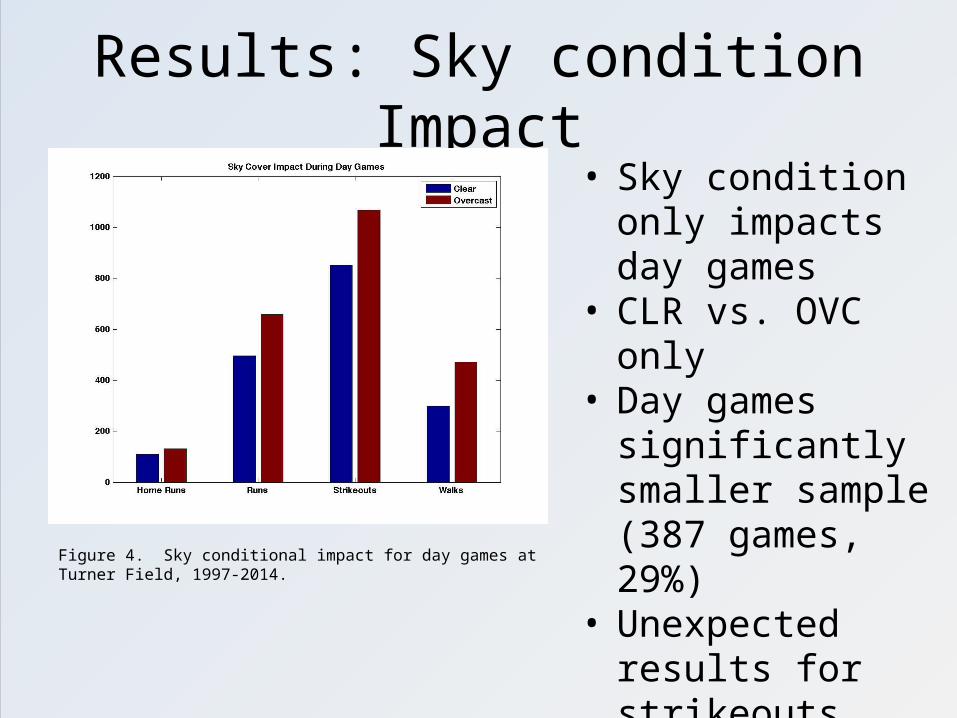
Results: Sky condition Impact• Sky condition only
impacts day games• CLR vs. OVC only• Day games
significantly smaller sample (387 games, 29%)
• Unexpected results for strikeouts, compared to Kent and Sheridan, 2011
Figure 4. Sky conditional impact for day games at Turner Field, 1997-2014.
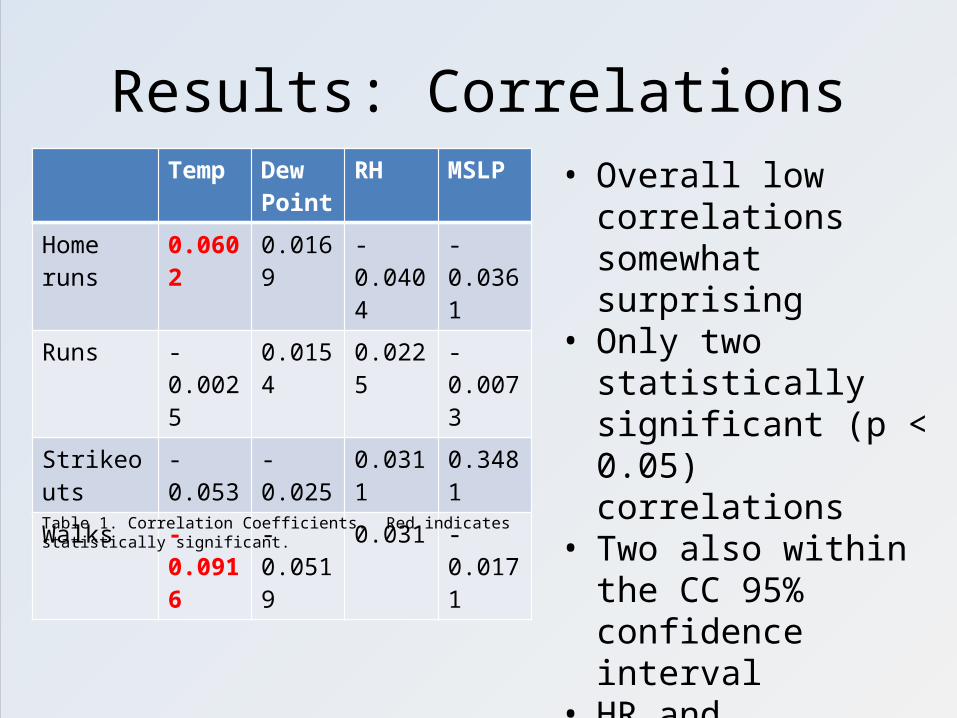
Results: CorrelationsTemp Dew
PointRH MSLP
Home runs
0.0602 0.0169 -0.0404 -0.0361
Runs -0.0025
0.0154 0.0225 -0.0073
Strikeouts -0.053 -0.025 0.0311 0.3481
Walks -0.0916
-0.0519
0.031 -0.0171
• Overall low correlations somewhat surprising
• Only two statistically significant (p < 0.05) correlations
• Two also within the CC 95% confidence interval
• HR and temperature p = 0.032 (CI: 0.0051 to
0.1149)• Walks and temperature
p = 0.001(CI: -0.146 to -
0.037)
Table 1. Correlation Coefficients. Red indicates statistically significant.
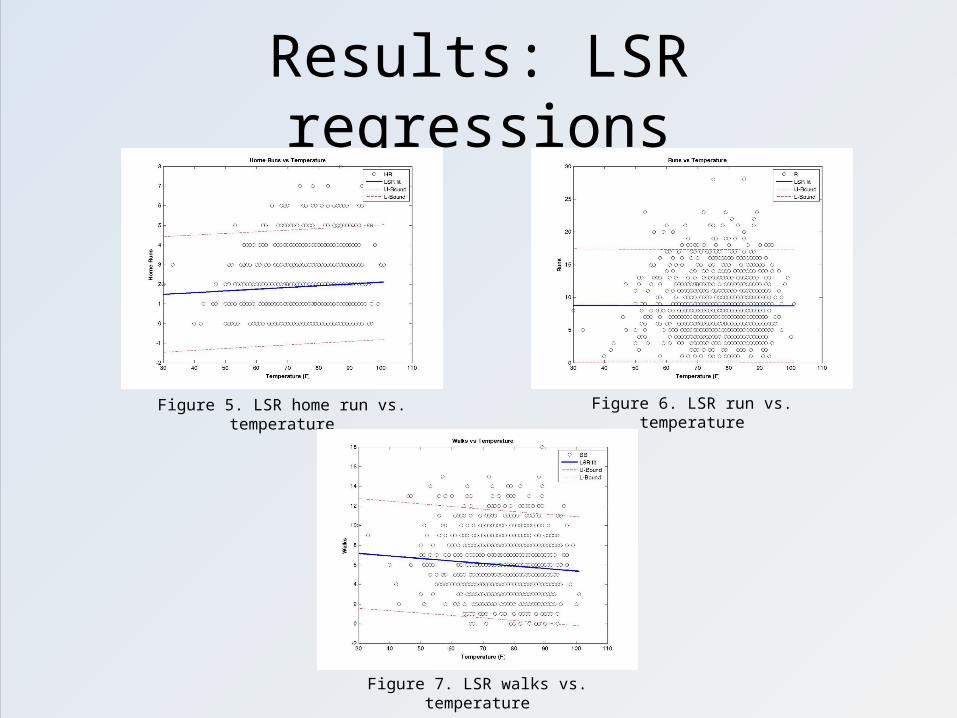
Results: LSR regressions
Figure 5. LSR home run vs. temperature Figure 6. LSR run vs. temperature
Figure 7. LSR walks vs. temperature
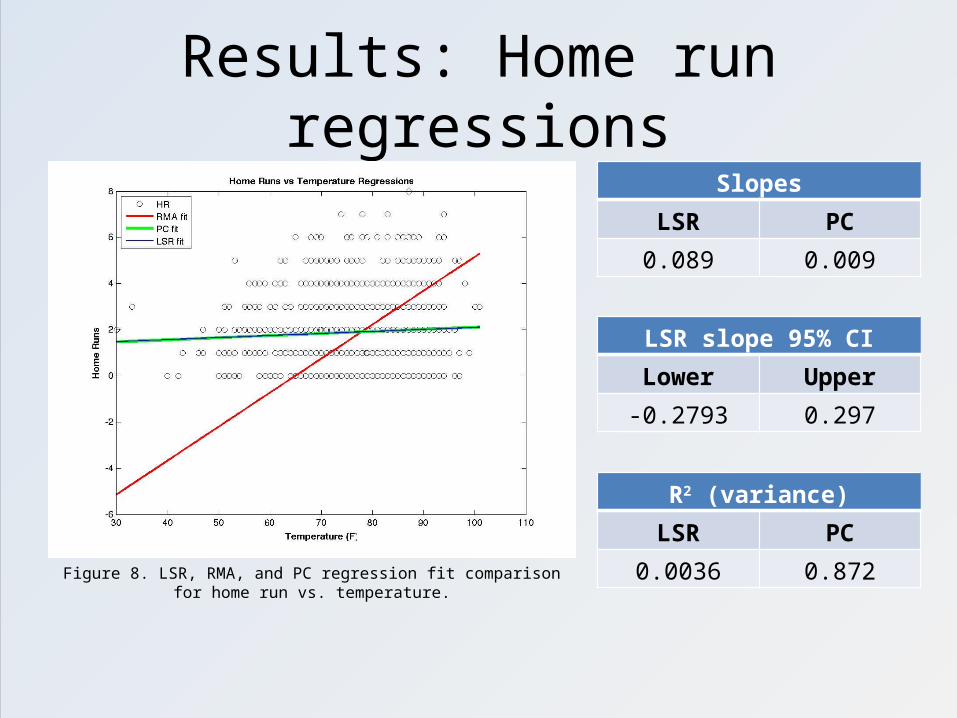
Results: Home run regressions
Figure 8. LSR, RMA, and PC regression fit comparison for home run vs. temperature.
Slopes
LSR PC
0.089 0.009
LSR slope 95% CI
Lower Upper
-0.2793 0.297
R2 (variance)
LSR PC
0.0036 0.872
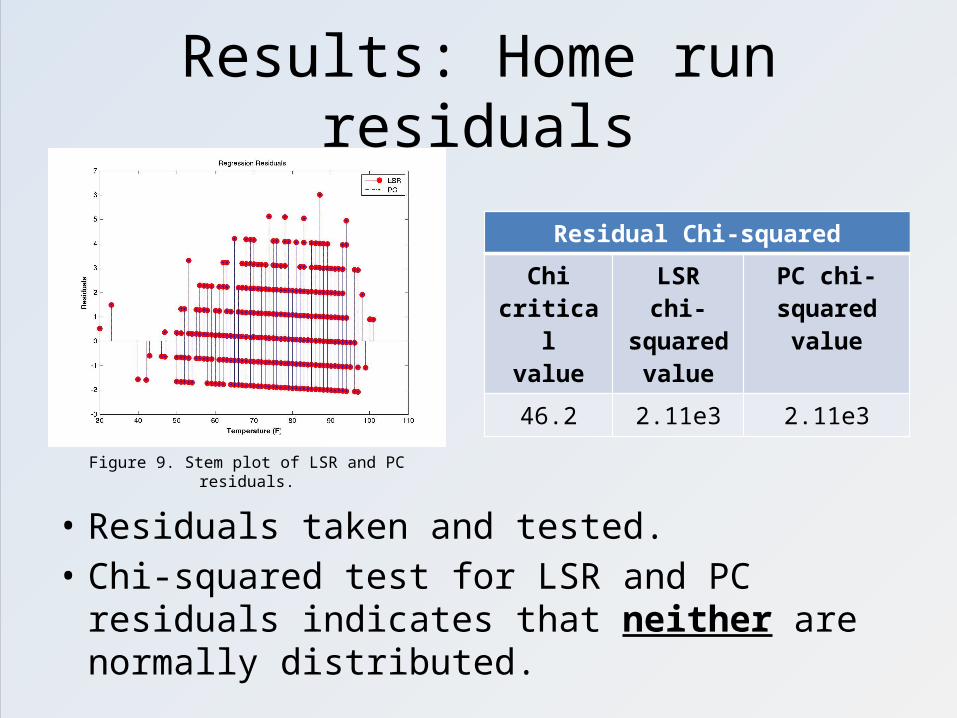
Results: Home run residuals
• Residuals taken and tested.• Chi-squared test for LSR and PC residuals indicates
that neither are normally distributed.
Residual Chi-squaredChi critical
valueLSR chi-squared
value
PC chi-squared value
46.2 2.11e3 2.11e3
Figure 9. Stem plot of LSR and PC residuals.
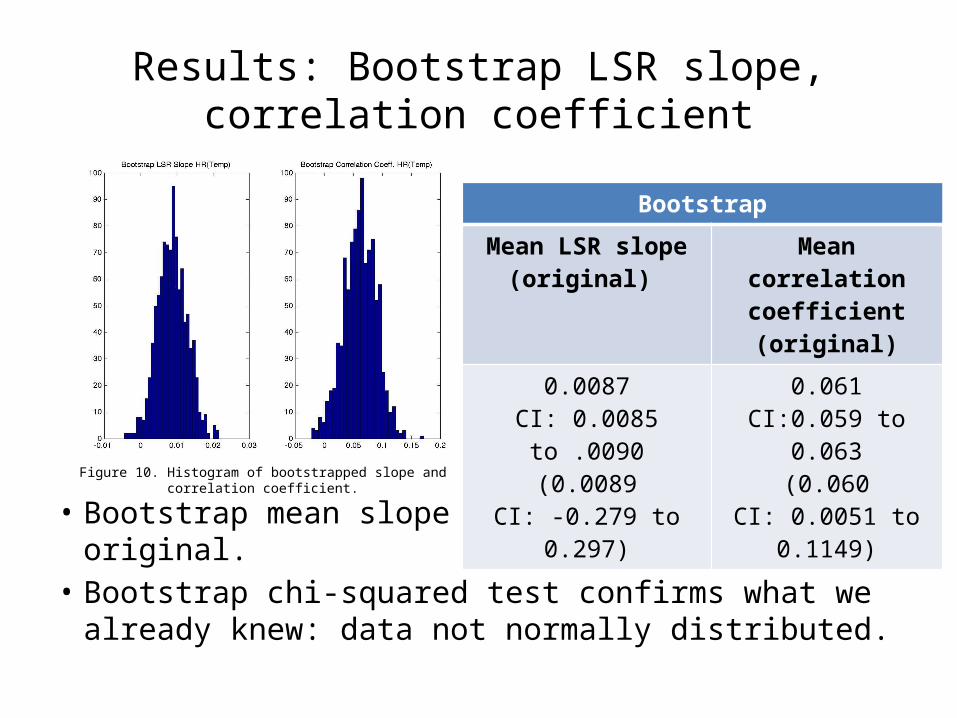
Results: Bootstrap LSR slope, correlation coefficient
• Bootstrap mean slope and mean CC similar to original.
• Bootstrap chi-squared test confirms what we already knew: data not normally distributed.
BootstrapMean LSR slope
(original) Mean correlation
coefficient(original)
0.0087CI: 0.0085 to .0090
(0.0089CI: -0.279 to 0.297)
0.061CI:0.059 to 0.063
(0.060CI: 0.0051 to 0.1149)
Figure 10. Histogram of bootstrapped slope and correlation coefficient.
Summary
• Physics of baseball tell us that temperature, dew point, and other variables should have impact on ball flight (batters) and ball movement (pitchers).
• Correlation of temperature and home runs and walks at Turner Field not high but it is statistically significant.
• Too many other non atmospheric factors: baseball is a “game of inches”.
• Non-normality of data does call into question confidence intervals for regression analysis.