Embed Size (px)
Citation preview

2019O V E R V I E W


2019O V E R V I E W

WHO/DAD/2019.1
© World Health Organization 2019
Some rights reserved. This work is available under the Creative Commons Attribution-Non Commercial-ShareAlike 3.0 IGO licence (CC BY-NC-SA 3.0 IGO; https://creativecommons.org/licenses/by-nc-sa/3.0/igo).
Under the terms of this licence, you may copy, redistribute and adapt the work for non-commercial purposes, provided the work is appropriately cited, as indicated below. In any use of this work, there should be no suggestion that WHO endorses any specific organization, products or services. The use of the WHO logo is not permitted. If you adapt the work, then you must license your work under the same or equivalent Creative Commons licence. If you create a translation of this work, you should add the following disclaimer along with the suggested citation: “This translation was not created by the World Health Organization (WHO). WHO is not responsible for the content or accuracy of this translation. The original English edition shall be the binding and authentic edition”.
Any mediation relating to disputes arising under the licence shall be conducted in accordance with the mediation rules of the World Intellectual Property Organization.
Suggested citation. World health statistics overview 2019: monitoring health for the SDGs, sustainable development goals. Geneva: World Health Organization; 2019 (WHO/DAD/2019.1). Licence: CC BY-NC-SA 3.0 IGO.
Cataloguing-in-Publication (CIP) data. CIP data are available at https://apps.who.int/iris.
Sales, rights and licensing. To purchase WHO publications, see https://apps.who.int/bookorders. To submit requests for commercial use and queries on rights and licensing, see https://www.who.int/about/licensing.
Third-party materials. If you wish to reuse material from this work that is attributed to a third party, such as tables, figures or images, it is your responsibility to determine whether permission is needed for that reuse and to obtain permission from the copyright holder. The risk of claims resulting from infringement of any third-party-owned component in the work rests solely with the user.
General disclaimers. The designations employed and the presentation of the material in this publication do not imply the expression of any opinion whatsoever on the part of WHO concerning the legal status of any country, territory, city or area or of its authorities, or concerning the delimitation of its frontiers or boundaries. Dotted and dashed lines on maps represent approximate border lines for which there may not yet be full agreement.
The mention of specific companies or of certain manufacturers’ products does not imply that they are endorsed or recommended by WHO in preference to others of a similar nature that are not mentioned. Errors and omissions excepted, the names of proprietary products are distinguished by initial capital letters.
All reasonable precautions have been taken by WHO to verify the information contained in this publication. However, the published material is being distributed without warranty of any kind, either expressed or implied. The responsibility for the interpretation and use of the material lies with the reader. In no event shall WHO be liable for damages arising from its use.
Design & layout by L’IV Com Sàrl
Printed in Switzerland

CONTENTS
Foreword . . . . . . . . . . . . . . . . . . . . . . . . . . . . . . . . . . . . . . . . . . . . . . . . . . . . . . . . . . . . . . . . . . . . . . . . . . . . . . v
Abbreviations . . . . . . . . . . . . . . . . . . . . . . . . . . . . . . . . . . . . . . . . . . . . . . . . . . . . . . . . . . . . . . . . . . . . . . . . . vi
1. Introduction . . . . . . . . . . . . . . . . . . . . . . . . . . . . . . . . . . . . . . . . . . . . . . . . . . . . . . . . . . . . . . . . . . . . . . . . 1
2. Life expectancy and cause of death . . . . . . . . . . . . . . . . . . . . . . . . . . . . . . . . . . . . . . . . . . . . . . . . . . . . 2
3. Health-related SDG indicators . . . . . . . . . . . . . . . . . . . . . . . . . . . . . . . . . . . . . . . . . . . . . . . . . . . . . . . . 63.1 Global trends . . . . . . . . . . . . . . . . . . . . . . . . . . . . . . . . . . . . . . . . . . . . . . . . . . . . . . . . . . . . . . . . . . . . 6
3.2 Differences among countries . . . . . . . . . . . . . . . . . . . . . . . . . . . . . . . . . . . . . . . . . . . . . . . . . . . . . . . . 7
3.3 Differences between females and males . . . . . . . . . . . . . . . . . . . . . . . . . . . . . . . . . . . . . . . . . . . . . . . . 9
4. Data for tracking the health-related SDGs . . . . . . . . . . . . . . . . . . . . . . . . . . . . . . . . . . . . . . . . . . . . . . 12
5. Findings . . . . . . . . . . . . . . . . . . . . . . . . . . . . . . . . . . . . . . . . . . . . . . . . . . . . . . . . . . . . . . . . . . . . . . . . . . 14
6. Ways forward . . . . . . . . . . . . . . . . . . . . . . . . . . . . . . . . . . . . . . . . . . . . . . . . . . . . . . . . . . . . . . . . . . . . . . 15
References . . . . . . . . . . . . . . . . . . . . . . . . . . . . . . . . . . . . . . . . . . . . . . . . . . . . . . . . . . . . . . . . . . . . . . . . . . . . 16
iiiMONITORING HEALTH FOR THE SDGs


Dr Tedros Adhanom Ghebreyesus Director-GeneralWorld Health Organization
FOREWORD
For 71 years, the World Health Organization (WHO) has had one vision: the highest attainable standard of health for all people in all countries. Reliable data are vital for assessing whether we are making progress towards that vision, for highlighting areas of progress and for exposing where we need to change course.
Health trends are constantly evolving, and so are health systems. No health system is perfect, and all countries have people who are left behind. It is therefore important to accurately document the state of global health and how it is changing.
The World health statistics, published annually since 2005, is WHO’s annual snapshot of the state of the world’s health. Since 2016, the World Health Statistics series has focused on monitoring progress toward the Sustainable Development Goals (SDGs), and the 2019 edition contains the latest available data for the health-related SDG indicators.
The SDGs address inequality wherever it exists. The 2019 edition reports on trends over time and disaggregates data by WHO region, World Bank income group, and sex to identify key inequalities. The report reveals that in low-income countries, health is frequently compromised by diseases and conditions that are preventable or treatable. Many premature deaths are associated with environmental factors or the leading underlying causes of death, such as tobacco use, unhealthy diet, physical inactivity and unhealthy consumption of alcohol.
Although the World health statistics 2019 tells its story with numbers, the consequences are human. In low-income countries, one woman in 41 dies from maternal causes, and each maternal death greatly affects the health of surviving family members and the resilience of the community. Not only are the risks of maternal deaths elevated by poverty, but their occurrence perpetuates the cycle of poverty in poor communities from one generation to the next.
We must be relentless in our pursuit of solutions to such human tragedies, and our responses must be informed by robust, reliable data on health risks, access to services and health outcomes. At present, many countries lack the health information systems they need to accurately monitor health trends and inform decision-making. That is why WHO is creating an entirely new process for strategic policy dialogue with countries, using evidence and information strategically to drive change.
We will continue to work with countries to strengthen their information systems for health and generate better data. We will also build a modern data backbone that allows sharing and analysis of data among the three levels of WHO and countries. And we will make investments to strengthen analytical capacity at all levels, to identify trends, make projections and support acceleration of progress toward achieving health targets.
Behind every number in these pages is a person, a family, a community and a nation. My hope is that governments, health providers, academics, civil society organizations, the media and others use these numbers to promote health, keep the world safe and serve the vulnerable.
vMONITORING HEALTH FOR THE SDGs

AFR WHO African Region
AIDS acquired immunodeficiency syndrome
AMR WHO Region of the Americas
CRD chronic respiratory disease
CVD cardiovascular disease
DTP3 diphtheria-tetanus-pertussis third dose
EMR WHO Eastern Mediterranean Region
EUR WHO European Region
GGE general government expenditure
HALE healthy life expectancy
HI high income
HIV human immunodeficiency virus
IHR International Health Regulations
LI low income
LMI lower-middle income
M/F male to female (ratio)
MCV2 measles-containing vaccine second dose
NCD noncommunicable disease
NTD neglected tropical disease
ODA official development assistance
PCV3 pneumococcal conjugate vaccine third dose
SDG Sustainable Development Goal
SEAR WHO South-East Asia Region
TB tuberculosis
UHC universal health coverage
UMI upper-middle income
WASH water, sanitation and hygiene for all
WHO World Health Organization
WPR WHO Western Pacific Region
ABBREVIATIONS
vi WORLD HEALTH STATISTICS: 2019 • OVERVIEW

1MONITORING HEALTH FOR THE SDGs
INTRODUCTION1The World Health Statistics series is the World Health Organization’s (WHO’s) annual compilation of health statistics for its 194 Member States. The series is produced by WHO’s Division for Data, Analytics and Delivery, in collaboration with WHO technical departments and regional offices.
World health statistics 2019 summarizes recent trends and levels in life expectancy and causes of death, and reports on the health and health-related Sustainable Development Goals (SDGs) and associated targets. Where possible, the 2019 report disaggregates data by WHO region, World Bank income group, and sex; it also discusses differences in health status and access to preventive and curative services, particularly in relation to differences between men and
women. Where possible, it indicates the roles of sex as a biological determinant, and of gender as a social construct, in accounting for the observed differences (Table 1).
The analyses presented are not exhaustive; nevertheless, it is hoped that the report will raise awareness of some critical sex and gender differences in health outcomes, highlight the importance of those differences in the attainment of the SDGs, and encourage the roles of sex and gender to be systematically taken into account when collecting data, analysing health situations, formulating policies and designing health programmes.
This overview summarizes the principal findings of the World health statistics 2019 (1).
Table 1Definitions of sex and gender
Sex Gender
Sex refers to the biological characteristics that define humans as female or male. These sets of biological characteristics are not mutually exclusive, because there are individuals who are born with physical or biological sex characteristics who do not fit the traditional definitions of female or male (intersex).
Gender refers to the socially constructed norms, roles and relations of and among women, men, boys and girls. Gender also refers to expressions and identities of women, men, boys, girls and gender-diverse people. Gender is inextricable from other social and structural determinants shaping health and equity and can vary across time and place.
Sex differences can be observed at the level of chromosomes, gene expression, hormones, immune system and anatomy (e.g. body size, and sexual and reproductive anatomy).
Gender differences and inequalities influence exposure to risk factors, health-seeking and risk-taking behaviours, access to and use of health information; promotive, preventive, curative, rehabilitative and palliative health services; and experience with health care, including in terms of access to and control over resources and power relations.
Examples of sex-specific conditions: • cervical cancer (women);• prostate cancer (men); and• X-linked immune regulators may enhance immune responses in
female children.
Examples of gender-related factors resulting in differential health outcomes:• early pregnancy, including as a result of child marriage, increases girls’ risk of adverse health
outcomes; • due to the gender-based division of labour, men and women may be exposed to different risks for work-
related injuries or illnesses;• gender norms related to masculinity promote smoking and alcohol use among men, while gender
norms associating smoking with women’s freedom and liberation are being targeted to young women by the tobacco industry;
• women’s access to health services may be limited by lack of access to and control of household financial resources, caregiving roles, and restrictions on their mobility; whereas men’s use of health services may be influenced by masculinity norms in which seeking health care is not seen as manly; and
• in addition to gender norms and roles, intersecting discrimination based on gender identity contributes to transgender people experiencing high rates of stigma and discrimination including in health care settings, and a lack of appropriate services responding to their needs.

2 WORLD HEALTH STATISTICS: 2019 • OVERVIEW
LIFE EXPECTANCY AND CAUSE OF DEATH2
Women live longer than men, but the additional years are not always healthy
In 2019, more than 141 million children will be born: 73 million boys and 68 million girls (2). Based on recent mortality risks the boys will live, on average, 69.8 years and the girls 74.2 years – a difference of 4.4 years. Life expectancy at age 60 years is also greater for women than men: 21.9 versus 19.0 years.
Between 2000 and 2016, global life expectancy at birth, for both sexes combined, increased by 5.5 years, from 66.5 to 72.0 years. The number of years lived in full health – that is, healthy life expectancy (HALE) – also increased over that period, from 58.5 years in 2000 to 63.3 years in 2016 (Fig. 1). HALE is greater in women than men at birth (64.8 versus 62.0 years) and at age 60 years (16.8 versus 14.8 years). However, the number of equivalent years of full health lost through living in poor health from birth is also greater in women than in men (9.5 versus 7.8 years).
Fig. 1Global life expectancy and healthy life expectancy, 2000–2016
At birthMales Females
2000
2005
2010
2015
2016
2000
2005
2010
2015
2016
0
20
40
60
Year
s
At age 60 yearsMales Females
2000
2005
2010
2015
2016
2000
2005
2010
2015
2016
0
5
10
15
20
Lost HALE HALE
Source: WHO (2018) (3).

3MONITORING HEALTH FOR THE SDGs
The ratio of the number of men alive to the number of women alive changes through the life-course
Globally, the sex ratio at birth has been in the range of 105–110 males to every 100 females; however, mortality rates are higher in males, so the ratio changes as the population ages. Thus, in 2016, there were 100 men for every 100 women in the age group 50–54 years, and 95 men for every 100 women in the age group 60–64 years, with the sex ratio falling sharply thereafter (Fig. 2). Because the incidence of different diseases varies with age, and women live longer than men, some diseases can be more common in women; for example, the lifetime risk for Alzheimer disease is greater in women than in men, partly because more women survive to ages at which the disease most commonly occurs, although in some locations women also appear to be more susceptible to Alzheimer disease (4).
Fig. 2Global male to female (M/F) sex ratio by age, 2016
Birth 1–
4
5–9
10–1
4
15–1
9
20–2
4
25–2
9
30–3
4
35–3
9
40–4
4
45–4
9
50–5
4
55–5
9
60–6
4
65–6
9
70–7
4
75–7
9
80–8
4
85–8
9
90–9
4
95–9
9
100+
0.0
0.2
0.4
0.6
0.8
1.0
M/F
sex r
atio
Age group (years)
Source: World population prospects 2017 (2).
Several conditions contribute to differences in life expectancy between men and women
The reduced life expectancy of males compared with that of females is not due to a single or a small number of causes. Of the 40 leading causes of death, 33 contribute more to reduced life expectancy in males than in females (Fig. 3). The main causes of death that contribute to a lower life expectancy in males than in females are ischaemic heart disease (0.84 years), road injuries (0.47), lung cancers (0.40), chronic obstructive pulmonary disease (0.36), stroke (0.32), cirrhosis of the liver (0.27), tuberculosis (TB) (0.23), prostate cancer (0.22) and interpersonal violence (0.21).
Fig. 3Causes of death that most contribute to differences in life expectancy at birth globally for men and women, 2016
Source: WHO (2018) (3), and see (6) for decomposition of life expectancy.
Cause of death
-0.8 -0.4 0.0 0.2 0.4 0.6 0.8
Ischaemic heart disease
Road injury
Trachea, bronchus, lung cancers
COPD
Stroke
Breast cancer
Cirrhosis of the liver
Maternal conditions
Tuberculosis
Prostate cancer
Interpersonal violence
Liver cancer
Cervix uteri cancer
Stomach cancer
Lower respiratory infections
Self-harm
Alzheimer's
Oesophagus cancer
HIV/AIDS
Kidney diseases
(Years)
Cause of death
Male life expectancy reduced more than female Female life expectancy reduced more than male
Breast cancer (0.30 years), maternal conditions (0.23) and cervical cancer (0.15) are the causes of death that most reduce female rather than male global life expectancy.
Some of the differences in mortality rates and life expectancy are due to biological sex differences between females and males. For example, X-linked immune regulators may enhance immune responses in female children, resulting in reduced mortality among girls aged under 5 years. Others are linked to gender norms and inequalities; that is, the socially constructed roles, norms, behaviours, activities and attributes that a given society considers appropriate for men, women, boys and girls. For example, child marriage increases the risks related to early pregnancy among girls, whereas higher rates of male employment in the transport industry expose men to higher risks of death on the roads. The exact contributions that sex and gender roles make to health status are often difficult to determine because they do not operate independently (5).
Chronic obstructive pulmonary disease
Alzheimer

4 WORLD HEALTH STATISTICS: 2019 • OVERVIEW
Life expectancy and age of death varies greatly by country income group
Life expectancy at birth in low-income countries (62.7 years) is 18.1 years lower than in high-income countries (80.8 years) (Table 2). In high-income countries, most of the people who die are old; however, in low-income countries almost one in three deaths are of children aged under 5 years (Fig. 4).
Table 2Life expectancy and HALE by sex, WHO region and World Bank income group, 2016
Life expectancy HALE Life
expectancy HALE
At birth (years) At 60 years (years)
Global Male 69.8 62.0 19.0 14.8
Female 74.2 64.8 21.9 16.8
Both sexes 72.0 63.3 20.5 15.8
WHO region(both sexes)
AFR 61.2 53.8 16.6 12.5
AMR 76.8 67.5 22.7 17.6
SEAR 69.5 60.4 18.2 13.3
EUR 77.5 68.4 22.3 17.4
EMR 69.1 59.7 18.2 13.3
WPR 76.9 68.9 21.0 16.6
World Bank income group (both sexes)
LI 62.7 54.9 17.1 12.9
LMI 67.9 59.1 18.0 13.2
UMI 75.2 67.0 20.2 15.8
HI 80.8 71.2 24.3 19.0
Darker shading represents lower values of life expectancy.Source: WHO (2018) (3).
Differences in life expectancy between men and women are greater in higher-income countries
The differences in life expectancy between females and males are smaller in low-income countries than in high-income countries. Communicable diseases, injuries and maternal conditions contribute most to differences in life expectancy between females and males in low-income countries, whereas noncommunicable diseases (NCDs) contribute most to life expectancy differences in high-income countries (Fig. 5).
Maternal deaths contribute more than any other cause to differences in life expectancy at birth between men and women. Maternal deaths are concentrated in low-income countries, being related primarily to lack of access to essential health services. The life expectancy of men is lower than that of women due to higher mortality rates from most causes, particularly in higher-income countries; in low-income countries, the net effect of maternal conditions, breast and cervical cancer reduces the differences in life expectancy between men and women compared with high-income countries.
Fig. 4Proportion of deaths by age and World Bank income group, 2016 (%)
Age group(years) Low income Lower-middle income Upper-middle income High income
04080
Males
0 40 80
Females
04080
Males
0 40 80
Females
04080
Males
0 40 80
Females
04080
Males
0 40 80
Females
70+60–6950–5930–4915–295–14
<5
(%)Source: WHO (2018) (3).

5MONITORING HEALTH FOR THE SDGs
The responses to differences in health status will vary according to the circumstances of countries
In low-income countries, differences in life expectancy between males and females are due to causes that are frequently preventable, or treatable through access to basic health services. In higher-income countries, premature deaths are frequently associated with environmental factors or unhealthy lifestyle (Fig. 6).
Fig. 5Causes of death responsible for differences in life expectancy between men and women and World Bank income group, 2016
Source: WHO (2018) (3), and see (6) for decomposition of life expectancy.
World Bank income group
-6 -4 -2 0 0 2 4 6
Low income
Lower-middle income
Upper-middle income
High income
(Years)
Cause of deathCommunicable, perinatal and nutritional conditionsMaternal conditionsBreast cancerCervix uteri cancerIschaemic heart disease
Trachea, bronchus, lung cancersNoncommunicable diseasesRoad injuryInjuries
Male life expectancy reduced more than female
Female life expectancy reduced
more than male
Where there are differences in health outcomes between men, women, boys and girls, responses that aim to influence differences in exposure to risk factors or to increase access to health services may help to both minimize differences in health outcomes and maximize health gains.
Many of the factors that influence exposure to risks and access to health services are beyond the traditional remit of ministries of health. They require a multisectoral approach that addresses the underlying causes of gender and socioeconomic inequalities.
Fig. 6Concentration of deaths according to national income of countries and sex, 2016
Points represent the 40 leading causes of death globally, with their areas being proportional to the number of deaths in 2016. Selected causes are labelled; space does not permit labelling of all causes. The concentration index is used to summarize the extent to which deaths from a disease are concentrated in high- or low-income countries, or in males or females. The index ranges from –1 to 1: a value of 0 indicates no association with national income or sex, and a value of –1 or 1 indicates that a disease occurs exclusively in males or females or in low-income or high-income countries (e.g. maternal deaths occur exclusively in women and are concentrated in low-income countries, whereas lung cancer is concentrated in high-income countries and occurs more in males).
-1.5
-0.5
0.5
1.5
-1.0 -0.5 0.0 0.5 1.0
Injuries and violenceNoncommunicable diseasesCommunicable, maternal, perinatal and nutritional conditions
nd nutritional conditionsMale
Female
High incomeLow income
Breast cancerMaternal deaths
Cervical cancer
Road injuries
Interpersonal violence
TB Lung cancer
Prostate cancer
Malaria
Diarrhoea
Alzheimer's
Number of deaths
10 000 000
1 000 000
100 000
Source: WHO 2018 (3), and see (7) for calculation of concentration index. World Bank classification of economies July 2017.

6 WORLD HEALTH STATISTICS: 2019 • OVERVIEW
HEALTH-RELATED SDG INDICATORS3
3.1. Global trendsGlobally, there have been improvements in most of the health-related SDG indicators
Recent years have seen improvements in 24 (56%) of the 43 health-related SDG indicators tracked in World health statistics 20191 (Table 3). However, at a global level, progress has stalled or trends are in the wrong direction for five of those 43 indicators: road traffic mortality, children overweight, malaria incidence, alcohol consumption, water
1 Four of the health-related SDG indicators in the official list of SDG indicators (8) have more than one component (Indicators 2.2.2, 3.8.2, 3.b.1, 3.c.1). Where this is the case, each component is treated as a separate indicator in World health statistics 2019. The 43 indicators tracked have 36 unique indicator numbers in the official list of SDG indicators.
Table 3Trends in health-related SDG indicators
SDG indicators with explicit targets for 2030
Progress stalled or trend in wrong direction
3.6.1 Road traffic mortality
Progress made but too slow to meet target
3.1.1 Maternal mortality
3.4.1 NCD mortality
3.4.2 Suicide mortality
6.1.1 Safe drinking-water coverage
6.2.1 Safe sanitation coverage
7.1.2 Clean energy coverage
Progress fast enough to attain target
3.2.1 Under-5 mortality
3.2.2 Neonatal mortality
SDG indicators with no explicit targets for 2030
Progress stalled or trend in wrong direction
2.2.2 Children overweight
3.3.3 Malaria incidence
3.5.2 Alcohol consumption
6.a.1 Water sector ODA
Progress made
3.1.2 Skilled birth attendance
3.7.1 Met need for family planning
3.7.2 Adolescent birth rate
2.2.1 Stunting in children
3.b.1 DTP3 coverage
MCV2 coverage
PCV3 coverage
3.3.1 New HIV infections
3.3.2 Tuberculosis incidence
3.3.4 Hepatitis B prevalence
3.3.5 Need for NTD interventions
3.a.1 Tobacco use in persons ≥15 years
16.1.1 Homicide
3.9.3 Poisoning mortality
3.b.2 ODA medical research & basic health sectors
1.a.2 Domestic government health expenditure
Programme area Reproductive, maternal and child health Infectious and noncommunicable diseases Injuries, violence and environmental risks Health systems and financing
Trend not yet reported
2.2.2 Wasting in children
3.9.1 Air pollution mortality
3.9.2 Unsafe water and sanitation mortality
5.2.1 Intimate partner violence
11.6.2 Fine particulate matter in urban areas
3.8.1 UHC service coverage index
3.c.1 Medical doctor density
Nurse/midwife density
Dentist density
Pharmacist density
3.d.1 International Health Regulations capacity
3.8.2 Household health expenditures >10%
Household health expenditures >25%
17.9.2 Completeness of cause-of-death data
7MONITORING HEALTH FOR THE SDGs
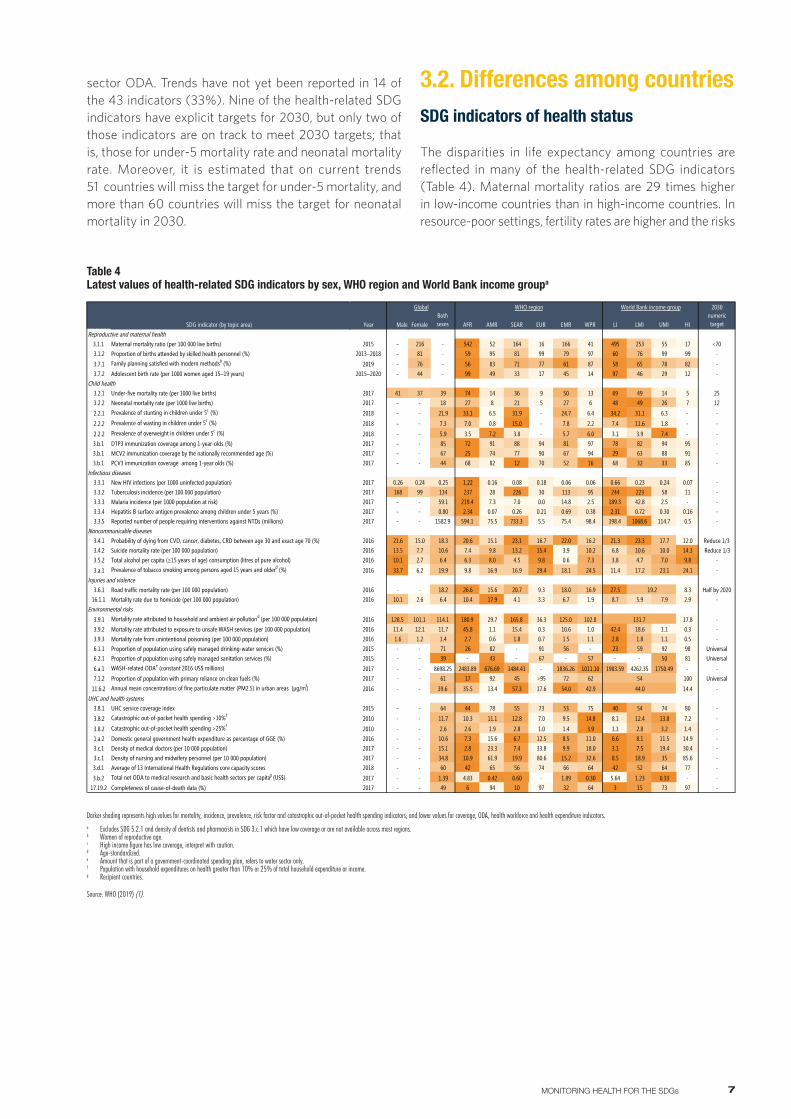
3.2. Differences among countriesSDG indicators of health status
The disparities in life expectancy among countries are reflected in many of the health-related SDG indicators (Table 4). Maternal mortality ratios are 29 times higher in low-income countries than in high-income countries. In resource-poor settings, fertility rates are higher and the risks
sector ODA. Trends have not yet been reported in 14 of the 43 indicators (33%). Nine of the health-related SDG indicators have explicit targets for 2030, but only two of those indicators are on track to meet 2030 targets; that is, those for under-5 mortality rate and neonatal mortality rate. Moreover, it is estimated that on current trends 51 countries will miss the target for under-5 mortality, and more than 60 countries will miss the target for neonatal mortality in 2030.
Table 4Latest values of health-related SDG indicators by sex, WHO region and World Bank income groupa
2030
Year Male FemaleBoth sexes AFR AMR SEAR EUR EMR WPR LI LMI UMI HI
numerictarget
Reproductive and maternal health 2 3 4 5 6 7 8 9 10 11 12 13 14 15 163.1.1 Maternal mortality ratio (per 100 000 live births) 2015 - 216 - 542 52 164 16 166 41 495 253 55 17 <703.1.2 Proportion of births attended by skilled health personnel (%) 2013–2018 - 81 - 59 95 81 99 79 97 60 76 99 99 -
3.7.1 Family planning satisfied with modern methodsb (%) 2019 - 76 - 56 83 71 77 61 87 58 65 78 82 -3.7.2 Adolescent birth rate (per 1000 women aged 15–19 years) 2015–2020 - 44 - 99 49 33 17 45 14 97 46 29 12 -
Child health3.2.1 Under-five mortality rate (per 1000 live births) 2017 41 37 39 74 14 36 9 50 13 69 49 14 5 253.2.2 Neonatal mortality rate (per 1000 live births) 2017 - - 18 27 8 21 5 27 6 48 49 26 7 12
2.2.1 Prevalence of stunting in children under 5c (%) 2018 - - 21.9 33.1 6.5 31.9 - 24.7 6.4 34.2 31.1 6.3 - -
2.2.2 Prevalence of wasting in children under 5c (%) 2018 - - 7.3 7.0 0.8 15.0 - 7.8 2.2 7.4 11.6 1.8 - -
2.2.2 Prevalence of overweight in children under 5c (%) 2018 - - 5.9 3.5 7.2 3.8 - 5.7 6.0 3.1 3.9 7.4 - -3.b.1 DTP3 immunization coverage among 1-year-olds (%) 2017 - - 85 72 91 88 94 81 97 78 82 94 95 -3.b.1 MCV2 immunization coverage by the nationally recommended age (%) 2017 - - 67 25 74 77 90 67 94 29 63 88 91 -3.b.1 PCV3 immunization coverage among 1-year olds (%) 2017 - - 44 68 82 12 70 52 16 68 32 33 85 -
Infectious diseases3.3.1 New HIV infections (per 1000 uninfected population) 2017 0.26 0.24 0.25 1.22 0.16 0.08 0.18 0.06 0.06 0.66 0.23 0.24 0.07 -3.3.2 Tuberculosis incidence (per 100 000 population) 2017 168 99 134 237 28 226 30 113 95 244 223 58 11 -3.3.3 Malaria incidence (per 1000 population at risk) 2017 - - 59.1 219.4 7.3 7.0 0.0 14.8 2.5 189.3 42.8 2.5 - -3.3.4 Hepatitis B surface antigen prevalence among children under 5 years (%) 2017 - - 0.80 2.34 0.07 0.26 0.21 0.69 0.38 2.31 0.72 0.30 0.16 -3.3.5 Reported number of people requiring interventions against NTDs (millions) 2017 - - 1582.9 594.1 75.5 733.3 5.5 75.4 98.4 398.4 1068.6 114.7 0.5 -
Noncommunicable diseases3.4.1 Probability of dying from CVD, cancer, diabetes, CRD between age 30 and exact age 70 (%) 2016 21.6 15.0 18.3 20.6 15.1 23.1 16.7 22.0 16.2 21.3 23.3 17.7 12.0 Reduce 1/33.4.2 Suicide mortality rate (per 100 000 population) 2016 13.5 7.7 10.6 7.4 9.8 13.2 15.4 3.9 10.2 6.8 10.6 10.0 14.3 Reduce 1/33.5.2 Total alcohol per capita (≥15 years of age) consumption (litres of pure alcohol) 2016 10.1 2.7 6.4 6.3 8.0 4.5 9.8 0.6 7.3 3.8 4.7 7.0 9.8 -
3.a.1 Prevalence of tobacco smoking among persons aged 15 years and olderd (%) 2016 33.7 6.2 19.9 9.8 16.9 16.9 29.4 18.1 24.5 11.4 17.2 23.1 24.1 -Injuries and violence
3.6.1 Road traffic mortality rate (per 100 000 population) 2016 - - 18.2 26.6 15.6 20.7 9.3 18.0 16.9 27.5 8.3 Half by 202016.1.1 Mortality rate due to homicide (per 100 000 population) 2016 10.1 2.6 6.4 10.4 17.9 4.1 3.3 6.7 1.9 8.7 5.9 7.9 2.9 -
Environmental risks3.9.1 Mortality rate attributed to household and ambient air pollutiond (per 100 000 population) 2016 128.5 101.1 114.1 180.9 29.7 165.8 36.3 125.0 102.8 17.8 -3.9.2 Mortality rate attributed to exposure to unsafe WASH services (per 100 000 population) 2016 11.4 12.1 11.7 45.8 1.1 15.4 0.3 10.6 1.0 42.4 18.6 1.1 0.3 -3.9.3 Mortality rate from unintentional poisoning (per 100 000 population) 2016 1.6 1.2 1.4 2.7 0.6 1.8 0.7 1.5 1.1 2.8 1.8 1.1 0.5 -6.1.1 Proportion of population using safely managed drinking-water services (%) 2015 - - 71 26 82 - 91 56 - 23 59 92 98 Universal6.2.1 Proportion of population using safely managed sanitation services (%) 2015 - - 39 - 43 - 67 - 57 - - 50 81 Universal
6.a.1 WASH-related ODAe (constant 2016 US$ millions) 2017 - - 8698.25 2483.89 676.69 1484.41 - 1836.26 1011.10 1983.59 4262.35 1750.49 - -7.1.2 Proportion of population with primary reliance on clean fuels (%) 2017 - - 61 17 92 45 >95 72 62 100 Universal
11.6.2 Annual mean concentrations of fine particulate matter (PM2.5) in urban areas (µg/m3) 2016 - - 39.6 35.5 13.4 57.3 17.6 54.0 42.9 14.4 -UHC and health systems
3.8.1 UHC service coverage index 2015 - - 64 44 78 55 73 53 75 40 54 74 80 -
3.8.2 Catastrophic out-of-pocket health spending >10%f 2010 - - 11.7 10.3 11.1 12.8 7.0 9.5 14.8 8.1 12.4 13.8 7.2 -
3.8.2 Catastrophic out-of-pocket health spending >25%f 2010 - - 2.6 2.6 1.9 2.8 1.0 1.4 3.9 1.1 2.8 3.2 1.4 -1.a.2 Domestic general government health expenditure as percentage of GGE (%) 2016 - - 10.6 7.3 15.6 6.7 12.5 8.5 11.0 6.6 8.1 11.5 14.9 -3.c.1 Density of medical doctors (per 10 000 population) 2017 - - 15.1 2.8 23.3 7.4 33.8 9.9 18.0 3.1 7.5 19.4 30.4 -3.c.1 Density of nursing and midwifery personnel (per 10 000 population) 2017 - - 34.8 10.9 61.9 19.9 80.6 15.2 32.6 8.5 18.9 35 85.6 -3.d.1 Average of 13 International Health Regulations core capacity scores 2018 - - 60 42 65 56 74 66 64 42 52 64 77 -
3.b.2 Total net ODA to medical research and basic health sectors per capitag (US$) 2017 - - 1.39 4.83 0.42 0.60 - 1.89 0.30 5.64 1.23 0.33 - -17.19.2 Completeness of cause-of-death data (%) 2017 - - 49 6 94 10 97 32 64 3 15 73 97 -
SDG indicator (by topic area)
19.2
131.7
54
44.0
Global WHO region World Bank income group
Darker shading represents high values for mortality, incidence, prevalence, risk factor and catastrophic out-of-pocket health spending indicators; and lower values for coverage, ODA, health workforce and health expenditure indicators.a Excludes SDG 5.2.1 and density of dentists and pharmacists in SDG 3.c.1 which have low coverage or are not available across most regions.b Women of reproductive age.c High income figure has low coverage, interpret with caution.d Age-standardized.e Amount that is part of a government-coordinated spending plan, refers to water sector only.f Population with household expenditures on health greater than 10% or 25% of total household expenditure or income.g Recipient countries.
Source: WHO (2019) (1).

8 WORLD HEALTH STATISTICS: 2019 • OVERVIEW
of dying in labour greater, so the lifetime risk of maternal death is greatly amplified; in low-income countries, one woman out of 41 dies from maternal causes (Fig. 7).
Fig. 7Lifetime risk of dying from maternal causes by World Bank income group and WHO region, 2015
The lifetime risk of dying from maternal causes is the probability of a 15-year-old girl eventually dying from a maternal cause, assuming that she is subjected throughout her lifetime to the fertility and maternal mortality risks, as estimated for 2015.Source: WHO 2015 (9).
In low-income countries, about a third of children are stunted (i.e. short for their age), reflecting long-term nutritional deprivation, and one child out of 14 will die before his or her fifth birthday. Adolescent birth rates are eight times higher in low-income countries than in high-income countries. The burden of infectious diseases, including HIV, TB, malaria, hepatitis B and neglected tropical diseases (NTDs) is higher in low-income countries than in high-income countries. Mortality rates attributed to unsafe water, unsafe sanitation and lack of hygiene are also highest in low-income countries, as are mortality rates for road traffic injuries and unintentional poisoning. Although NCDs are often associated with a more prosperous lifestyle, the probability of dying prematurely from cardiovascular disease (CVD), cancer, diabetes and chronic respiratory disease is highest in low- and lower-middle-income countries.
There are some exceptions to poor health being primarily associated with low-income countries. Highest wasting rates are observed in the WHO South-East Asia Region (15.0%) and Eastern Mediterranean Region (7.8%). Mortality rates from homicide are highest in the WHO Region of the Americas. Suicide mortality rates are highest in the WHO European Region, and lowest in the Eastern Mediterranean Region.
SDG indicators of health service coverage and financing
Populations in low-income countries generally have less access to essential health services; values of the universal health coverage (UHC) service coverage index are lower, as are indicators such as skilled birth attendance, women who have their need for family planning satisfied with modern methods of contraception, and immunization coverage. Low-income countries also experience greater shortages of health care professionals (Fig. 8), and domestic government health expenditure as a proportion of total general government expenditures is lower (despite lower absolute levels of general government expenditure and greater health needs). The proportion of the population that suffer catastrophic health expenditures (>10% or >25% of total household expenditures or income) is higher in middle-income countries than in low- or high-income countries. However, at all income levels people can suffer catastrophic health expenditures, even in high-income countries and in countries where most of the out-of-pocket health spending is due to medicines.
Fig. 8Percentage of countries with insufficient health care professionals, 2013–2018
Source: Global Health Workforce Statistics (10).
|0%
|100%
Percentage of countries
AFR
AMR
SEAR
EUR
EMR
WPR
Low income
Lower-middle income
Upper-middle income
High income
|20%
|40%
|60%
|80%
Fewer than 10 medical doctors per 10 000 population Fewer than 40 nursing and midwifery personnel per 10 000 population
SDG indicators of exposure to risk factors
Populations in lower-income countries are less likely to use safely managed drinking-water, and clean fuels and technology; also, they have greater exposure to fine particulate matter in cities. In contrast, tobacco use and alcohol consumption are highest in high-income countries.
|0%
|1%
|3%
EMR 1 in 170
AFR 1 in 37
AMR 1 in 920
|2%
EUR 1 in 3400
SEAR 1 in 240
WPR 1 in 1400
Low income 1 in 41
Lower-middle income 1 in 130
Upper-middle income 1 in 970
High income 1 in 3300
Lifetime risk of dying of maternal causes (%)

9MONITORING HEALTH FOR THE SDGs
3.3. Differences between females and malesSDG indicators of health status
Differences between females and males are seen in most of the health-related SDG indicators for which sex disaggregation has been possible. In 2017, male children were 11% more likely to die than female children before the age of 5 years, compared with only 6% in 2000, indicating that the decline in under-5 mortality rate since 2000 has been faster in females than in males. Given that boys generally have a higher under-5 mortality rate than girls for biological reasons, the similarity of the under-5 mortality rate between boys and girls in the WHO South-East Asia Region is indicative of high rates of avoidable mortality among female children. Although global estimates are not available, household surveys indicate
that rates of stunting and wasting are generally higher in boys than in girls (Fig. 9). Similarly, the proportion of boys overweight is higher than the proportion of girls.
Globally in 2017, the incidence rate of new HIV infections was 1.09 times higher in men than in women. In sub-Saharan Africa, the incidence was 1.27 times higher in women than in men; however, in other parts of the world, the incidence was 1.7 times higher in men than women. The incidence rate of TB was 1.7 higher in men than in women globally in 2017. In 2016, the probability of a man aged 30 years dying from an NCD before 70 years of age was 1.44 times higher than for a woman aged 30 years (Fig. 10). Globally in 2016, suicide mortality rates were 1.75 times higher in men than in women.
Fig. 10Age-standardized rates of premature death from the four major NCDs covered by SDG Target 3.4, 2016
Source: WHO (2018) (3).
5 10 20 50 100 200
5
10
20
50
100
200
Females (aged 30−70 years) Age−standardized death rates per 100 000 population
Mal
es (a
ged
30−7
0 ye
ars)
A
ge−s
tand
ardi
zed
deat
h ra
tes
per 1
00 0
00 p
opul
atio
nAFR
AFRAFR
AFR
EMR
EMR
EMR
EMR
EUR
EUR
EUR
EUR
AMR
AMR
AMR
AMR
SEAR
SEAR
SEAR
SEAR
Global
Global
Global
GlobalWPR
WPR
WPR
WPR
CancerCardiovascular diseasesChronic respiratory diseasesDiabetes
Deaths rates from road injury are more than twice as high in men as in women from age 15 years (Fig. 11), and mortality rates due to homicide are four times higher in men than in women. One in five of all homicides is committed by an intimate partner or family member, with women making up most of the victims (12). Beyond mortality, violence against women, rooted in unequal power and status of women and girls, is not only widespread, but carries a high burden of morbidity and ill health. Worldwide, in 2013, it was estimated that 35% of women and girls aged 15–49 years reported physical or sexual intimate partner violence or non-partner sexual violence in their lifetime. Women and girls may also experience harmful practices, such as female genital mutilation (FGM) and early and forced marriage. As of 2017, at least 200 million girls and women had undergone FGM in the 30 countries where the practice is concentrated (13).
Fig. 9Malnutrition rates in female and male children: (a) stunting (low height for age), (b) wasting (low weight for height)
Each point represents latest survey values available for a county 2000–2017. Source: UNICEF/WHO/World Bank (2019) (11).
Low income Lower-middle income Upper-middle income High income
9 (a)
|60
|40
|20
|0
More girls stunted
More boys stunted
Propo
rtion o
f boy
s <5 s
tunted
(%)
0
60
40
20
Proportion of girls <5 stunted (%)
9 (b)
|30
|20
|10
|0
More girls wasted
More boys wasted
Propo
rtion o
f boy
s <5 w
asted
(%)
0
30
20
10
Proportion of girls <5 wasted (%)

10 WORLD HEALTH STATISTICS: 2019 • OVERVIEW
Globally, 21% of women aged between 20 and 24 years reported that they were married or in an informal union before age 18 years (14). Also, in 2015–2020, it is estimated that more than one in 25 adolescent girls aged 15–19 years will give birth (2).
Mortality rates attributed to household and ambient air pollution and unintentional poisoning are 1.27 times higher in men than in women. In contrast, the global mortality rate
attributed to unsafe water, unsafe sanitation and lack of hygiene is 1.06 higher in women than in men, although there is much regional variation.
SDG indicators of health service coverage
Access to many services for prevention or treatment of infectious diseases and NCDs is not part of the SDG monitoring framework, except as part of the UHC service coverage index, which cannot be sex-disaggregated using currently available data and methodologies. Nevertheless, some relevant observations have been made through other global health reports. Household surveys suggest that vaccination rates are similar in boys and girls. The risk of not using a condom during sex with a non-regular partner appears to be higher in women than in men. However, in countries with generalized HIV epidemics, men are less likely than women to take an HIV test and less likely to access antiretroviral therapy; also, men are more likely than women to die of an AIDS-related illness (15). Similarly, male TB patients appear to be less likely to seek care than female TB patients (16–19), as reflected in lower rates of case notification compared with the estimated total of cases (Fig. 12). Death rates for some NCDs may also be influenced by access to diagnosis and treatment; for example, cervical cancer mortality rates are higher in low-income countries that have poorer access to health services.
Fig. 12Estimated incidence of TB in comparison to case notification by World Bank income group, age and sex, 2017
Male notified Male not notified Female notified Female not notified
-400 -200 4000 200
Incidence per 100 000 population
65+
Low income
Lower-middle income
Upper-middle income
High income
55–64
45–54
35–44
25–34
15–24
5–14
0–4
Source: WHO (2018) (19).
<5 5–14 15–29 30–49 50–59 60–69 70+0
1
2
3
4
5
Ratio
Cause of deathHomicide Road traffic
Age group (years)
Source: WHO (2018) (3). Death rates for road traffic injury from this source may differ from figures presented elsewhere in this report, but are used in this graph for comparison with other causes of injury.
Fig. 11Ratio of global M/F crude death rates by age and cause, 2016
injury

11MONITORING HEALTH FOR THE SDGs
SDG indicators of exposure to risk factors
Age-standardized prevalence of tobacco smoking was five times higher in men than in women in 2016, with the largest M/F ratio observed in the WHO Eastern Mediterranean Region (Fig. 13). Globally, per capita alcohol consumption was almost 4 times higher in men than in women in 2016.
Fig. 13Among persons aged 15 years and older: (a) age-standardized prevalence of tobacco smoking, 2016, (b) alcohol consumption per capita, 2016
13 (a) 13 (b)
051015
Males
0 5 10 15
Females
Global
AFR
AMR
SEAR
EUR
EMR
WPR
Low income
Lower-middle income
Upper-middle income
High income
per capita consumption (litres of pure alcohol)
alcohol
02040
Males
0 20 40
Females
2016 AFR
AMR
SEAR
EUR
EMR
WPR
Low income
Lower-middle income
Upper-middle income
High income
(%)
Global 2000
2005
2010
2015
2016
tobacco
Source: WHO (2018) (20). Source: Global Information System on Alcohol and Health (21).
12 WORLD HEALTH STATISTICS: 2019 • OVERVIEW
DATA FOR TRACKING THE HEALTH-RELATED SDGS4
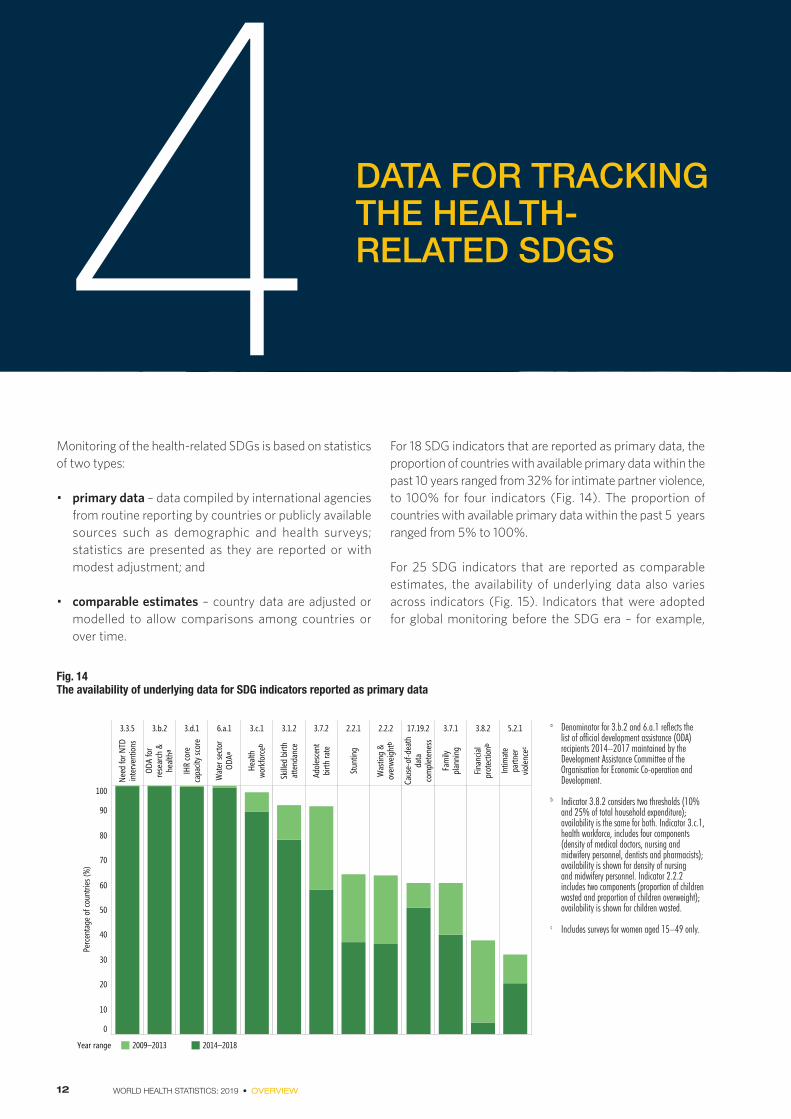
Monitoring of the health-related SDGs is based on statistics of two types:
• primary data – data compiled by international agencies from routine reporting by countries or publicly available sources such as demographic and health surveys; statistics are presented as they are reported or with modest adjustment; and
• comparable estimates – country data are adjusted or modelled to allow comparisons among countries or over time.
For 18 SDG indicators that are reported as primary data, the proportion of countries with available primary data within the past 10 years ranged from 32% for intimate partner violence, to 100% for four indicators (Fig. 14). The proportion of countries with available primary data within the past 5 years ranged from 5% to 100%.
For 25 SDG indicators that are reported as comparable estimates, the availability of underlying data also varies across indicators (Fig. 15). Indicators that were adopted for global monitoring before the SDG era – for example,
Fig. 14The availability of underlying data for SDG indicators reported as primary data
3.3.5
Need
for N
TDin
terv
entio
ns
3.b.2
ODA
for
rese
arch
&he
althᵃ
3.d.1
IHR
core
capa
city s
core
6.a.1
Wat
er se
ctor
ODAᵃ
3.c.1
Healt
hwo
rkfo
rceᵇ
3.1.2
Skille
d bi
rthat
tend
ance
3.7.2
Adol
esce
ntbi
rth ra
te
2.2.1
Stun
ting
2.2.2
Was
ting
&ov
erwe
ightᵇ
17.19.2
Caus
e-of
-dea
thda
taco
mpl
eten
ess
3.7.1
Fam
ilypl
anni
ng
3.8.2
Finan
cial
prot
ectio
nᵇ
5.2.1
Intim
ate
partn
ervio
lence
ᶜ
0
10
20
30
40
50
60
70
80
90
100
Perc
enta
ge o
f cou
ntrie
s (%
)
Year range 2009–2013 2014–2018
a Denominator for 3.b.2 and 6.a.1 reflects the list of official development assistance (ODA) recipients 2014–2017 maintained by the Development Assistance Committee of the Organisation for Economic Co-operation and Development.
b Indicator 3.8.2 considers two thresholds (10% and 25% of total household expenditure); availability is the same for both. Indicator 3.c.1, health workforce, includes four components (density of medical doctors, nursing and midwifery personnel, dentists and pharmacists); availability is shown for density of nursing and midwifery personnel. Indicator 2.2.2 includes two components (proportion of children wasted and proportion of children overweight); availability is shown for children wasted.
c Includes surveys for women aged 15–49 only.

13MONITORING HEALTH FOR THE SDGs
under-5 mortality rate, TB and HIV incidence, and vaccination coverage – tend to have relatively high availability of underlying data, even though such data may not be recent for all countries. In contrast, availability of underlying data is lower for new global indicators such as cause-specific mortality rates, and proportion of population using safely managed drinking-water and safely managed sanitation services. The average lag between the year of the estimate and the latest available year of underlying data ranged from 0 years for HIV, TB, malaria incidence and immunizations, to 5 years for hepatitis B prevalence.
Fig. 15The availability of underlying data for SDG 3 indicators reported as comparable estimates
3.1.1M
ater
nal m
orta
lity
ratio
3.2.1
Unde
r-five
mor
talit
yra
te
3.2.2
Neon
atal
mor
talit
y rat
e
3.3.1
New
HIV
infe
ction
s
3.3.2
Tube
rcul
osis
incid
ence
3.3.3
Mala
ria in
ciden
ceª
3.3.4
Hepa
titis
B p
reva
lence
3.4.1–2
NCD
& su
icide
mor
talit
y rat
es
3.5.2
Alco
hol c
onsu
mpt
ion
3.6.1
Road
traf
fic m
orta
lity
rate
3.8.1
UHC
serv
ice co
vera
gein
dexᵇ
3.9.1–3
Mor
talit
y due
toen
viron
men
tal f
acto
rsᶜ
3.a.1
Toba
cco
smok
ing
prev
alenc
e
3.b.1
DTP3
imm
uniza
tion
MCV
2 im
mun
izatio
n
PCV3
imm
uniza
tion
0
20
40
60
80
100
Perc
ent o
f cou
ntrie
s (%
)
0
1
2
3
4
5
Aver
age
lag (y
ears
)
Time lag between estimate and underlying dataNo underlying data since 2000 >4 years ≤4 years Average lag
a Denominator for Indicator 3.3.3 is the number of endemic countries in 2000 (107). b Grey bar indicates “low” data availability and purple bar indicates “medium” and “high” data availability (22). c Mortality attributed to household and ambient air pollution, unsafe WASH services and unintentional poisoning.
Table 5Availability of sex-disaggregated values of SDG indicators at global or regional levels
Programme area: Reproductive, maternal and child health Infectious and noncommunicable diseases Injuries, violence and environmental risks Health systems and financing
Of the 43 health and health-related SDG indicators reported in World health statistics 2019, sex disaggregation would potentially be informative for 28 indicators (Table 5). Sex disaggregation is not possible for the ten indicators for which data are collected at household or national level, or for five indicators that have female-specific numerators or denominators. For the 28 SDG indicators for which sex-disaggregated indicators could be informative, sex-disaggregated global and regional values are currently available for only 11 indicators (though sex-disaggregated values may be available at country level).
Sex disaggregated values reported
3.2.1 Under-5 mortality
3.3.1 New HIV infections
3.3.2 Tuberculosis incidence
3.4.1 NCD mortality
3.a.1 Tobacco use in persons ≥15 years
3.5.2 Alcohol consumption
3.4.2 Suicide mortality
16.1.1 Homicide
3.9.3 Poisoning mortality
3.9.1 Air pollution mortality
3.9.2 Unsafe water and sanitation mortality
Sex disaggregated values not currently reported
3.2.2 Neonatal mortality
2.2.1 Stunting in children
2.2.2 Wasting in children
2.2.2 Overweight children
3.b.1 DTP3 immunization coverage
MCV2 immunization coverage
PCV3 immunization coverage
3.3.3 Malaria incidence
3.3.4 Hepatitis B prevalence
3.3.5 Need for NTD interventions
3.6.1 Road traffic mortality
3.8.1 UHC service coverage index
3.c.1 Medical doctor density
Nurse/midwife density
Dentist density
Pharmacist density
17.9.2 Cause-of-death data completeness
Data collected at household or higher level
6.1.1 Safe drinking-water coverage
6.2.1 Safe sanitation coverage
6.a.1 Water sector ODA
7.1.2 Clean energy coverage
11.6.2 Fine particulate matter in urban areas
3.8.2 Household health expenditure >10%
Household health expenditure >25%
1.a.2 Domestic government health expenditure
3.b.2 ODA medical research & basic health sectors
3.d.1 International Health Regulations capacity
Female specific
3.7.1 Met need for family planning
3.7.2 Adolescent birth rate
3.1.1 Maternal mortality
3.1.2 Skilled attendance at birth
5.1.2 Intimate partner violence

14 WORLD HEALTH STATISTICS: 2019 • OVERVIEW
FINDINGS 5World health statistics 2019 reports on the latest values of 43 health-related SDG indicators. The key findings are summarized below.
What has improved• Global life expectancy increased by 5.5 years to
72.0 years between 2000 and 2016, and healthy life expectancy increased by 4.8 years to 63.3 years.
• Of 29 health-related SDG indicators for which global trends are reported, 24 have shown improvements in recent years. More births are attended by skilled health personnel, and women are less likely to die in childbirth. Global targets to reduce neonatal deaths and deaths in children aged under 5 years are on track, and childhood stunting is in decline. Nonetheless, it is estimated that 303 000 maternal deaths occurred globally in 2015 and that 5.4 million children aged under 5 years died in 2017.
• Vaccination coverage rates have increased while incidence rates for several infectious diseases, prevalence of tobacco smoking, exposure to environmental risks and premature NCD mortality have decreased at global level.
What has not improved• Progress has stalled or trends are in the wrong direction
for five of the 29 health-related SDG indicators for which trends are reported: the proportion of children aged under 5 years who are overweight, malaria incidence, harmful use of alcohol, deaths from road traffic injuries, and water-sector official development assistance.
Disparities in health outcomes• Life expectancy at birth in low-income countries is
18.1 years lower than in high-income countries. Much of this difference is attributable to preventable and treatable conditions.
• In low-income countries, one in 41 women die from maternal causes. Such deaths rarely occur in upper-middle and high-income countries. Maternal deaths
contribute more to differences in life expectancy in low-income countries between men and women than any other single cause.
• In low-income countries, more than a third of children are stunted (short for their age), reflecting long- term nutritional deprivation, and one child out of every 14 born will die before his or her fifth birthday.
• In 2016, life expectancy in men was 4.4 years lower than for women, with higher death rates for multiple causes, especially cardiovascular diseases, road injuries, lung cancer, chronic obstructive pulmonary disease and stroke. Men are generally exposed to increased occupational risks, and have higher prevalence of tobacco use and higher per capita consumption of alcohol. In many settings, men use health services less than women, even after taking into account reproductive-related consultations. The health gap between men and women is widest in high-income countries.
Data availabilityThe World health statistics 2019 report reviews, for the first time, the availability of country data for global SDG reporting. This review suggests that major improvements are needed to country data systems:• one in seven indicator country values included in the
report have had no underlying data since 2000; low- and lower-middle-income countries in particular lack underlying data;
• for around one third of countries, over half of the indicators have no recent underlying data;
• 11 health-related SDG indicators require cause-of-death data, yet only around half of countries are able to register more than 80% of adult deaths, and less than one third of countries have high-quality data on cause of death; and
• sex disaggregation is currently available for less than half (11/28) of relevant health-related SDG indicators at global level where it would be of interest.

15MONITORING HEALTH FOR THE SDGs
WAYS FORWARD 6Some key actions are suggested based on the findings of this report; these actions are outlined below.
1. Achieve universal health coverageFor many conditions, particularly in low-income countries, premature deaths can be averted by improving access to and use of preventive and curative health services. This may require a strengthened health workforce and increased provision of health facilities, equipment, medicines and vaccines. It will also require removing barriers to accessing services including economic barriers (as a consequence of out-of-pocket expenditures and insufficient public financing) and cultural barriers (where the workforce providing services does not have the necessary cultural sensitivity). Efforts in support of UHC must focus on reaching those whom services are not reaching, such as marginalized, stigmatized and geographically isolated people of all ages and genders. In some countries, health and social systems are strained by natural disasters or conflict, and the populations affected can account for a large proportion of unmet SDG need. Stronger and more resilient national health systems need to be backed by the regional and global alert and response mechanisms that will mitigate the impact of health emergencies.
2. Promote healthier populationsThe health of populations can also be improved by reducing exposure to risk factors such as unsafe water and sanitation, air pollution, violence, unsafe roads, tobacco use and alcohol consumption. The health sector has a key role to play in raising awareness and catalysing the development of multisectoral policies and programmes to reduce exposure to these risk factors.
3. Make health systems responsive to sex and gender
Health planning needs to allow for the different needs of men and women, including exposure to risk factors, barriers to access and health outcomes. In many circumstances, men experience poorer health outcomes than women do. Although some of these poorer health outcomes may have a biological basis, they may be amplified by gender roles. Gender analysis and health policies should consider women, men and gender-diverse population groups, to ensure equitable health outcomes. It is also necessary to formulate gender-responsive human-resource policies and regulations, ensure equal pay for work of equal value, and address barriers faced by women in progressing to leadership roles.
4. Invest in data systems for health, including disaggregated data
Progress in achieving the SDG goals is inhibited by incomplete or outdated information on several health-related indicators. The countries lacking underlying data are often those with limited resources and the greatest health need. Collecting, analysing and utilizing data of good quality is an important step to progressing health care, allowing better allocation of resources and timely interventions, and reducing costs while also improving the health care received. By ensuring that data can be disaggregated by sex, place of residence and other dimensions, there is potential to act to reduce inequality. Routine information systems, health facility or household surveys, and civil registration and vital statistics systems must be designed to provide relevant, timely and accurate data.

16 WORLD HEALTH STATISTICS: 2019 • OVERVIEW
REFERENCES
1. World Health Statistics 2019 (in press). Geneva: World Health Organization; 2019.
2. World population prospects: the 2017 revision. New York: United Nations, Department of Economic and Social Affairs, Population Division; 2017 (https://population.un.org/wpp/, accessed 31 March 2019).
3. Global health estimates 2016 (deaths by cause, age, sex, by country and by region, 2000–2016; and life expectancy, 2000–2016). Geneva: World Health Organization; 2018.Where figures include values by World Bank income group the World Bank classification of economies July 2017 are used.
4. Mielke MM, Ferretti MT, Iulita MF, Hayden K, Khachaturian AS. Sex and gender in Alzheimer’s disease – does it matter? Alzheimer’s & Dementia. 2018;14(9):1101 (https://www.ncbi.nlm.nih.gov/pubmed/30196887, accessed 26 March 2019).
5. Hawkes S, Buse K. Gender and global health: evidence, policy, and inconvenient truths. Lancet. 2013;381(9879):1783–7 (https://doi.org/10.1016/S0140-6736(13)60253-6, accessed 14 May 2019).
6. Beltran-Sanchez H, Preston SH, Canudas-Romo V. An integrated approach to cause-of-death analysis: cause-deleted life tables and decompositions of life expectancy. Demogr Res. 2008;19:1323 (https://www.ncbi.nlm.nih.gov/pubmed/20165568, accessed 31 April 2019).
7. O’Donnell O, Van Doorslaer E, Wagstaff A, Lindelow M. Analyzing health equity using household survey data: a guide to techniques and their implementation. The World Bank; 2007 (https://elibrary.worldbank.org/doi/abs/10.1596/978-0-8213-6933-3, accessed 22 April 2019).
8. SDG Indicators: Global indicator framework for the Sustainable Development Goals and targets of the 2030 Agenda for Sustainable Development [website]. New York; United Nations (https://unstats.un.org/sdgs/indicators/indicators-list/, accessed 31 March 2019).
9. Trends in maternal mortality: 1990 to 2015: estimates by WHO, UNICEF, UNFPA, World Bank Group and the United Nations Population Division. Geneva: World Health Organization; 2015 (https://apps.who.int/iris/bitstream/ handle/10665/194254/9789241565141_eng.pdf;jsessionid=4F32A9EABB0E2D5B373778396FEBC6EB?sequence=1, accessed 31 March 2019).
10. WHO Global Health Workforce Statistics [online database], Global Health Observatory (GHO) data. Geneva: World Health Organization (https://who.int/hrh/statistics/hwfstats/en/, accessed 15 March 2019). World Bank classification of economies July 2018.
11. Levels and trends in child malnutrition. UNICEF/WHO/World Bank Joint Child Malnutrition Estimates 2019 Edition, available at https://www.who.int/nutgrowthdb/estimates. World Bank classification of economies July 2018. World Bank classification of economies July 2018.
12. Global study on homicide; gender-related killing of women and girls. Vienna: United Nations Office on Drugs and Crime; 2018 (https://www.unodc.org/documents/data-and-analysis/GSH2018/GSH18_Gender-related_killing_of_ women_and_ girls.pdf, accessed 5 April 2019).
13. Female genital mutilation, in UNICEF Data [website]. New York; United Nations Children’s Fund; 2018 (https://data.unicef.org/ topic/child-protection/female-genital-mutilation/, accessed 5 April 2019).
14. Child marriage: latest trends and future prospects. New York; United Nations Children’s Fund; 2018 (https://data.unicef.org/wp-content/uploads/2018/07/Child-Marriage-Data-Brief.pdf, accessed 5 April 2019).
15. Blind spot: addressing a blind spot in the response to HIV. Geneva: Joint United Nations Programme on HIV/AIDS; 2017 (http://www.unaids.org/en/resources/documents/2017/blind_spot, accessed 17 March 2019).
16. Amere GA, Nayak P, Salindri AD, Narayan KMV, Magee MJ. Contribution of smoking to tuberculosis incidence and mortality in high-tuberculosis-burden countries. Am J Epidemiol. 2018;187(9):1846–55 (https://dx.doi.org/10.1093/ aje/kwy081, accessed 17 March 2019).
17. Narasimhan P, Wood J, MacIntyre CR, Mathai D. Risk factors for tuberculosis. J Pulm Med. 2013;2013:1–11 (https://dx.doi.org/10.1155/2013/828939, accessed 17 March 2019).
18. Horton KC, MacPherson P, Houben RMGJ, White RG, Corbett EL. Sex differences in tuberculosis burden and notifications in low- and middle-income countries: a systematic review and meta-analysis. PLOS Med. 2016;13(9):e1002119 (https://www.ncbi.nlm.nih.gov/pubmed/27598345, accessed 14 May 2019).
19. Global tuberculosis report 2018. Geneva: World Health Organization; 2018 (http://apps.who.int/iris/bitstream/handle/10665/274453/9789241565646-eng.pdf?ua=1, accessed 31 March 2019). World Bank classification of economies July 2018
20. WHO global report on trends in prevalence of tobacco smoking, 2nd edition. Geneva: World Health Organization; 2018 (https://www.who.int/tobacco/publications/surveillance/trends-tobacco-smoking-second-edition/en/, accessed 15 March 2019). World Bank classification of economies July 2017.
21. WHO Global Information System on Alcohol and Health (GISAH) [online database], Global Health Observatory (GHO) data. Geneva: World Health Organization (https://www.who.int/gho/alcohol/en/, accessed 15 March 2019). World Bank classification of economies July 2017.
22. Tracking universal health coverage: 2017 global monitoring report. Geneva and Washington (DC): World Health Organization and the International Bank for Reconstruction and Development/The World Bank; 2017 (https://apps.who.int/iris/bitstream/handle/10665/259817/9789241513555-eng.pdf?sequence=1, accessed 15 March 2019).

Notes. . . . . . . . . . . . . . . . . . . . . . . . . . . . . . . . . . . . . . . . . . . . . . . . . . . . . . . . . . . . . . . . . . . . . . . . . . . . . . . . . . . . . . . . . . . . . . . . . . . . .
. . . . . . . . . . . . . . . . . . . . . . . . . . . . . . . . . . . . . . . . . . . . . . . . . . . . . . . . . . . . . . . . . . . . . . . . . . . . . . . . . . . . . . . . . . . . . . . . . . . . .
. . . . . . . . . . . . . . . . . . . . . . . . . . . . . . . . . . . . . . . . . . . . . . . . . . . . . . . . . . . . . . . . . . . . . . . . . . . . . . . . . . . . . . . . . . . . . . . . . . . . .
. . . . . . . . . . . . . . . . . . . . . . . . . . . . . . . . . . . . . . . . . . . . . . . . . . . . . . . . . . . . . . . . . . . . . . . . . . . . . . . . . . . . . . . . . . . . . . . . . . . . .
. . . . . . . . . . . . . . . . . . . . . . . . . . . . . . . . . . . . . . . . . . . . . . . . . . . . . . . . . . . . . . . . . . . . . . . . . . . . . . . . . . . . . . . . . . . . . . . . . . . . .
. . . . . . . . . . . . . . . . . . . . . . . . . . . . . . . . . . . . . . . . . . . . . . . . . . . . . . . . . . . . . . . . . . . . . . . . . . . . . . . . . . . . . . . . . . . . . . . . . . . . .
. . . . . . . . . . . . . . . . . . . . . . . . . . . . . . . . . . . . . . . . . . . . . . . . . . . . . . . . . . . . . . . . . . . . . . . . . . . . . . . . . . . . . . . . . . . . . . . . . . . . .
. . . . . . . . . . . . . . . . . . . . . . . . . . . . . . . . . . . . . . . . . . . . . . . . . . . . . . . . . . . . . . . . . . . . . . . . . . . . . . . . . . . . . . . . . . . . . . . . . . . . .
. . . . . . . . . . . . . . . . . . . . . . . . . . . . . . . . . . . . . . . . . . . . . . . . . . . . . . . . . . . . . . . . . . . . . . . . . . . . . . . . . . . . . . . . . . . . . . . . . . . . .
. . . . . . . . . . . . . . . . . . . . . . . . . . . . . . . . . . . . . . . . . . . . . . . . . . . . . . . . . . . . . . . . . . . . . . . . . . . . . . . . . . . . . . . . . . . . . . . . . . . . .
. . . . . . . . . . . . . . . . . . . . . . . . . . . . . . . . . . . . . . . . . . . . . . . . . . . . . . . . . . . . . . . . . . . . . . . . . . . . . . . . . . . . . . . . . . . . . . . . . . . . .
. . . . . . . . . . . . . . . . . . . . . . . . . . . . . . . . . . . . . . . . . . . . . . . . . . . . . . . . . . . . . . . . . . . . . . . . . . . . . . . . . . . . . . . . . . . . . . . . . . . . .
. . . . . . . . . . . . . . . . . . . . . . . . . . . . . . . . . . . . . . . . . . . . . . . . . . . . . . . . . . . . . . . . . . . . . . . . . . . . . . . . . . . . . . . . . . . . . . . . . . . . .
. . . . . . . . . . . . . . . . . . . . . . . . . . . . . . . . . . . . . . . . . . . . . . . . . . . . . . . . . . . . . . . . . . . . . . . . . . . . . . . . . . . . . . . . . . . . . . . . . . . . .
. . . . . . . . . . . . . . . . . . . . . . . . . . . . . . . . . . . . . . . . . . . . . . . . . . . . . . . . . . . . . . . . . . . . . . . . . . . . . . . . . . . . . . . . . . . . . . . . . . . . .
. . . . . . . . . . . . . . . . . . . . . . . . . . . . . . . . . . . . . . . . . . . . . . . . . . . . . . . . . . . . . . . . . . . . . . . . . . . . . . . . . . . . . . . . . . . . . . . . . . . . .
. . . . . . . . . . . . . . . . . . . . . . . . . . . . . . . . . . . . . . . . . . . . . . . . . . . . . . . . . . . . . . . . . . . . . . . . . . . . . . . . . . . . . . . . . . . . . . . . . . . . .
. . . . . . . . . . . . . . . . . . . . . . . . . . . . . . . . . . . . . . . . . . . . . . . . . . . . . . . . . . . . . . . . . . . . . . . . . . . . . . . . . . . . . . . . . . . . . . . . . . . . .
. . . . . . . . . . . . . . . . . . . . . . . . . . . . . . . . . . . . . . . . . . . . . . . . . . . . . . . . . . . . . . . . . . . . . . . . . . . . . . . . . . . . . . . . . . . . . . . . . . . . .
. . . . . . . . . . . . . . . . . . . . . . . . . . . . . . . . . . . . . . . . . . . . . . . . . . . . . . . . . . . . . . . . . . . . . . . . . . . . . . . . . . . . . . . . . . . . . . . . . . . . .
. . . . . . . . . . . . . . . . . . . . . . . . . . . . . . . . . . . . . . . . . . . . . . . . . . . . . . . . . . . . . . . . . . . . . . . . . . . . . . . . . . . . . . . . . . . . . . . . . . . . .
. . . . . . . . . . . . . . . . . . . . . . . . . . . . . . . . . . . . . . . . . . . . . . . . . . . . . . . . . . . . . . . . . . . . . . . . . . . . . . . . . . . . . . . . . . . . . . . . . . . . .
. . . . . . . . . . . . . . . . . . . . . . . . . . . . . . . . . . . . . . . . . . . . . . . . . . . . . . . . . . . . . . . . . . . . . . . . . . . . . . . . . . . . . . . . . . . . . . . . . . . . .
. . . . . . . . . . . . . . . . . . . . . . . . . . . . . . . . . . . . . . . . . . . . . . . . . . . . . . . . . . . . . . . . . . . . . . . . . . . . . . . . . . . . . . . . . . . . . . . . . . . . .
. . . . . . . . . . . . . . . . . . . . . . . . . . . . . . . . . . . . . . . . . . . . . . . . . . . . . . . . . . . . . . . . . . . . . . . . . . . . . . . . . . . . . . . . . . . . . . . . . . . . .
. . . . . . . . . . . . . . . . . . . . . . . . . . . . . . . . . . . . . . . . . . . . . . . . . . . . . . . . . . . . . . . . . . . . . . . . . . . . . . . . . . . . . . . . . . . . . . . . . . . . .
. . . . . . . . . . . . . . . . . . . . . . . . . . . . . . . . . . . . . . . . . . . . . . . . . . . . . . . . . . . . . . . . . . . . . . . . . . . . . . . . . . . . . . . . . . . . . . . . . . . . .
. . . . . . . . . . . . . . . . . . . . . . . . . . . . . . . . . . . . . . . . . . . . . . . . . . . . . . . . . . . . . . . . . . . . . . . . . . . . . . . . . . . . . . . . . . . . . . . . . . . . .
. . . . . . . . . . . . . . . . . . . . . . . . . . . . . . . . . . . . . . . . . . . . . . . . . . . . . . . . . . . . . . . . . . . . . . . . . . . . . . . . . . . . . . . . . . . . . . . . . . . . .
. . . . . . . . . . . . . . . . . . . . . . . . . . . . . . . . . . . . . . . . . . . . . . . . . . . . . . . . . . . . . . . . . . . . . . . . . . . . . . . . . . . . . . . . . . . . . . . . . . . . .
. . . . . . . . . . . . . . . . . . . . . . . . . . . . . . . . . . . . . . . . . . . . . . . . . . . . . . . . . . . . . . . . . . . . . . . . . . . . . . . . . . . . . . . . . . . . . . . . . . . . .
. . . . . . . . . . . . . . . . . . . . . . . . . . . . . . . . . . . . . . . . . . . . . . . . . . . . . . . . . . . . . . . . . . . . . . . . . . . . . . . . . . . . . . . . . . . . . . . . . . . . .
. . . . . . . . . . . . . . . . . . . . . . . . . . . . . . . . . . . . . . . . . . . . . . . . . . . . . . . . . . . . . . . . . . . . . . . . . . . . . . . . . . . . . . . . . . . . . . . . . . . . .
. . . . . . . . . . . . . . . . . . . . . . . . . . . . . . . . . . . . . . . . . . . . . . . . . . . . . . . . . . . . . . . . . . . . . . . . . . . . . . . . . . . . . . . . . . . . . . . . . . . . .


![Untitled-3 [apps.who.int]](https://img.pdfslide.us/doc/110x75/6169cd7f11a7b741a34b87dd/untitled-3-appswhoint.jpg)