Embed Size (px)
Citation preview
Overnight Interbank Loan Markets
Selva Demiralp, Brian Preslopsky, and William Whitesell*
May 2004
Keywords: federal funds, Eurodollar, repo, arbitrage JEL classifications: E4, G1
* Staff of the Board of Governors of the Federal Reserve System. We have benefited from
discussions with Craig Furfine, James McAndrews, Jeffrey Stehm, Douglas Conover,
members of the Open Market Desk, the reserve managers of several large banks, and the
research assistance of Heather Wiggins and Shawn Liu. The views expressed are those of the
authors and not necessarily those of the Board of Governors of the Federal Reserve System
or others of its staff.
Overnight Interbank Loan Markets
Abstract
This paper investigates transactions and interest rates on brokered and direct trades in
federal funds, Eurodollar transactions, and repurchase agreements, all of which are used by
banks in overnight funding. We expand on earlier work on calendar-day effects in these
markets, investigating also volumes of funding in recent years. Our data include daily trades
in federal funds reported by major brokers and also records of uncollateralized transactions
over the wire transfer system operated by the Federal Reserve. We find that the share of the
overnight interbank loan market represented by brokered fed funds has decreased and is now
only about one-third of the total. We also show evidence of close but incomplete arbitrage
among the major segments of the overnight interbank market, though the specific calendar-
day patterns of spreads and volatilities have evolved relative to the literature using earlier
sample periods.
Overnight Interbank Loan Markets
I. Introduction
Depository institutions (hereafter, “banks”) typically process over $1 trillion of
payments per day through their accounts at Federal Reserve Banks. Opening positions and
the flow of payments over the day tend to leave some banks in deficit in their Fed account.
Other banks have a surplus in excess of their needs to meet reserve requirements and to hold
balances as a precaution against late postings that could cause costly overnight overdrafts. In
consequence, banks need a highly liquid market for overnight, same-day-settlement loans
among each other. Traditionally, the federal funds market met this need. In recent years,
however, overnight Eurodollars have increasingly provided a similar role. In principle,
interbank lending could also take place in the market for repurchase agreements, but in
trading among each other, banks typically prefer to forego the additional transaction costs
associated with handling collateral.
An earlier literature, including papers by Spindt and Hoffmeister (1988), Griffiths and
Winters (1995), and Hamilton (1996), had demonstrated that the brokered federal funds rate
exhibits calendar day effects associated with the maintenance period for reserve requirements
and also with holidays and quarter ends. More recently, Griffiths and Winters (1997) found
such effects in the interest rate on repurchase agreements on general Treasury collateral
(hereafter, “repo” rate). Using a 1984 to 1997 sample period, Lee (2003a) found that the
overnight Eurodollar bid rate exhibits day-of-the-maintenance-period effects similar to but
smaller in magnitude than those in the brokered federal funds rate. Cyree, Griffiths, and
Winters (2003) identified calendar day effects using the overnight London interbank offer
2
rate in the 1991 to 1995 period, but not in the previous five years when Eurodollar
borrowings were subject to a 3 percent reserve requirement.
In investigating interbank lending, all of the above papers use the effective federal
funds rate reported by the Federal Reserve. This interest rate is the volume-weighted average
rate reported to the Open Market Desk of the Federal Reserve Bank of New York by large
federal funds brokers and it is the rate targeted by the Federal Open Market Committee
(FOMC) in setting monetary policy. However, a large volume of federal funds trades occur
directly between banks, rather than through brokers. Furfine (e.g., 1999, 2003) has pioneered
work with a broader set of overnight loans identified from data on daily transactions over
Fedwire, the wire transfer system operated by the Federal Reserve System.
We investigate issues related to the identification of overnight loans on Fedwire by
assessing alternative algorithms for selecting candidate loan transactions. We also analyze
the extent to which such loans may be categorized as brokered fed funds, direct
(nonbrokered) trades of federal funds, Eurodollar transactions, or repo. Finally, we assess
the degree of arbitrage among these markets in recent years and contrast our findings with
the above studies that used earlier sample periods.
The plan of the paper is as follows. Section II discusses the institutional background
regarding overnight interbank markets and related sources of data that are available. Section
III analyzes the identification of individual overnight loans in Fedwire data. Section IV
reviews the properties of such loans in part by removing from the Fedwire data those
transactions that can be matched to a separate data set on trades of brokered federal funds.
Section V analyzes the extent of arbitrage between brokered fed funds, Eurodollars, and repo.
It also compares the properties of interest rates in these submarkets with the average interest
3
rate derived for Fedwire loans that are not brokered fed funds. In particular, we employ an
exponential GARCH model to investigate possible differential calendar effects in recent
years on the levels and volatility of each interest rate series.
II. Institutional Background
Fedwire
"Fedwire" is the name given to the Federal Reserve's facility for the electronic
transfer of funds between institutions with accounts at Federal Reserve Banks. Fedwire
distinguishes between two basic types of transactions––those with and those without an
associated transfer of securities. The Federal Reserve maintains a book-entry system for
Treasury and agency securities; transfers of such securities between banks, or between the
customers of different banks, take place on a delivery-versus-payment basis over what is
called the "securities wire." Fedwire transactions that do not involve an exchange of
securities are called "funds transfers;" these are the subject of our examination.
Most Fedwire funds transfers are payments for goods or services between the
customers of different banks. Distinguishing such payments from transfers associated with
overnight loans is a key focus of our paper.
Federal Funds Transactions
Federal funds are balances held at Federal Reserve Banks. Currently, around 7,800
institutions hold accounts at Reserve Banks. Nearly all of these are depository institutions,
but government agencies, official institutions, and "bankers' banks," such as the US Central
Credit Union, also hold accounts and are significant players in the funds market.
In concept, a trade in federal funds is an unsecured loan between two Federal Reserve
account holders when each is acting as a principal. However, a regulatory definition of
4
"federal funds transactions" differs from the above. The term originated in the early 1920s,
when New York banks lent funds by writing a check on an account at the Federal Reserve
Bank, which cleared the same day, in return for a check on the clearinghouse, which took at
least one day to clear (Goodfriend and Whelpley, 1993). By 1930, wire transfers of fed
funds had begun. The Federal Reserve ruled that such funds were not deposits subject to
reserve requirements under Regulation D. It did so to support the development of this market
as an alternative to reserve adjustments either through the call loan market (the market for
overnight bank loans to broker/dealers), which was seen as supporting stock market
speculation, or through heavy use of the discount window, which was subsidized. In
escaping classification as a demand deposit, fed funds transactions also avoided the
prohibition of interest payments on demand deposits under the Banking Acts of 1933 and
1935, enforced by Regulation Q. In 1964, the regulatory definition of fed funds was
broadened to allow a correspondent bank to reclassify the deposits of a respondent as fed
funds, even without any transfer of funds at a Reserve Bank. A Federal Reserve Board ruling
in 1970 limited the institutions that could lend fed funds for regulatory purposes to
commercial banks, savings banks, savings and loan associations, the National Credit Union
Administration, government agencies, and securities dealers, among others. A few
institutions with accounts at Federal Reserve Banks do not qualify for the "fed funds"
exceptions to regulations D and Q. In contrast, many depository institutions that do not have
Federal Reserve accounts may nevertheless classify deposits with correspondents as fed
funds on their balance sheets. Moreover, while nonbank securities dealers hold no accounts
5
at the Federal Reserve, their unsecured overnight loans to banks are also eligible to qualify as
fed funds for regulatory purposes.1
Market participants speak of three segments of the fed funds market at present. The
first is the well known brokered market, which is the source of the computed interest rate that
is targeted by the FOMC. Use of brokers is the most efficient means of completing large
trades, particularly late in the day, but brokers can also provide reserve managers useful
information about market conditions throughout the day. The second segment is the
nonbrokered, direct trade market, where loans are arranged in direct communications
between the funding desks of major banks. Completing a direct trade is more labor intensive
and time consuming, especially for larger transactions, but it saves on brokerage fees of a
little under 2 basis points at an annual rate. Banks generally conduct direct trades early in the
business day, and rely more exclusively on the brokered sub-market later on as time-
criticality increases and the number of active banks declines. The third segment of the fed
funds market is represented by correspondent re-bookings, where smaller banks that do not
have accounts at the Federal Reserve may have their deposits at larger correspondents re-
booked as overnight loans. The individual loans in this re-booking sub-market, which do not
involve transfers of funds over Fedwire, are considerably smaller than the brokered or direct
trade deals mentioned above, and–according to market participants–the interest rates tend to
be 1/4 percentage point or so below the funds rates quoted on brokers' screens.
1 This privilege was granted in part for fairness in treatment between bank and nonbank
securities dealers.
6
Brokered Federal Funds Data
Major brokers in the money market report their federal funds transactions to the
Federal Reserve Bank of New York on a daily basis. They report the interest rates on
unsecured loans of overnight funds for same-day settlement as well as the total value of
trades at each interest rate. No information on individual transactions or on the number of
transactions is provided.
Some of the fed funds trades going through brokers reportedly involve nonbank
securities dealers. Normally, dealers finance their positions through (collateralized)
repurchase agreement transactions early in the day. However, if they are unexpectedly short
or long cash at the end of the day, they may need to do unsecured transactions in the fed
funds market. Some of these transactions may be passed through brokers, and unless the
dealer's counterparty happens to be its own bank, a Fedwire funds transfer would presumably
be involved.
Eurodollar Transactions on Fedwire
Eurodollar transactions, which are defined by the creation of offshore dollar deposits,
are very close substitutes for trades in federal funds. While many Eurodollar trades are
settled over CHIPS, others are completed through Fedwire.2 A typical Fedwire-settled,
interbank Eurodollar transaction might involve the following scenario. Suppose a
corporation receives a large payment into its demand deposit account at a Chicago bank. The
bank then automatically "sweeps" these excess funds from the demand deposit account into a
non-reservable, interest-earning "Eurodollar" account at its Caribbean branch. This is
accomplished using accounting entries rather than any movement of funds, with the Chicago
2 CHIPS is the Clearing House Inter-bank Payment System operated by private banks.
7
office of the bank boosting the amount "due to" its Caribbean branch. However, the original
corporate deposit raised the reserve balances the bank holds at the Federal Reserve Bank of
Chicago. The bank thus tries to arrange an overnight loan of these excess reserves through
brokers. A New York bank takes the loan and books a receipt of funds by its Caribbean
branch from the Chicago bank's Caribbean branch. For this transaction, the funds are
transferred over Fedwire from the Chicago bank's account at the Federal Reserve Bank of
Chicago to the New York bank's account at the Federal Reserve Bank of New York. The
accounting is completed by an increase in the amount the New York bank holds "due to" its
Caribbean branch and a decrease in the same for the Chicago bank.
After European markets close, liquidity tends to diminish in the Eurodollar market.
However, Eurodollar transactions may also involve domestic interbank loans or the lending
of funds by money funds or corporations to banks or other market participants. Money funds
and corporations do not qualify for the federal funds exemptions from Regulations D and Q.
But they can earn interest on overnight loans to banks that are structured as Eurodollar
transactions, and since late 1990 the reserve requirements on the related due to amounts have
been eliminated. With the removal of reserve requirements, this market has become
increasingly important in overnight funding in recent years. Reserve managers of major
banks report that the volume of overnight trading in Eurodollars, both through brokers and
direct trades, now exceeds that in federal funds.
Although data on overnight Eurodollar transactions per se are unavailable, the
Federal Reserve does collect daily data from around 400 large domestically-chartered banks
on their positions relative to overseas offices. The gross amounts due to and due from related
foreign offices over the last 20 years are shown in Figure 1, along with the volume of
8
brokered federal funds transactions. The “due to” amounts would include overnight
Eurodollar borrowings, but also term maturities and sources of dollar funding other than
Eurodollar deposits. That said, however, the chart clearly indicates that the expansion of
funding through these sources has far outstripped the modest rise in the volume of brokered
fed funds transactions over the last two decades.
Repurchase Agreements
An overnight repurchase agreement (repo) is in effect a loan that is collateralized
typically by Treasury, agency, or mortgage-backed securities. The overall repo market is
reportedly far larger than the markets for federal funds and overnight interbank Eurodollars.
Repos that involve the transfer of a Treasury or agency security on the Federal Reserve's
book-entry system are segregated in the securities wire, as mentioned above. Banks often
borrow from nonbanks through repo because such borrowings allow avoidance of reserve
requirements and of the prohibition against interest payments on demand deposits.
Moreover, as noted above, nonbanks generally cannot make loans that qualify for the fed
funds exemption.
Two major clearing banks also warehouse securities for use in "tri-party" repo, a sub-
market that has grown rapidly in recent years. In some cases, the transfer of funds associated
with tri-party repo may occur over Fedwire. To the extent that tri-party repo are settled
across cash accounts held at the custodial clearing bank, however, no Fedwire transfers
would occur. Moreover, interviews with reserve managers at major banks indicated that tri-
party repo are not commonly used in interbank lending.
9
III. Identifying Overnight Loans on Fedwire
We now investigate alternative methods for distinguishing overnight loans from other
types of Fedwire funds transfers in preparation for assessing the degree of arbitrage among
the various overnight loan markets. Our Fedwire data include, for each funds transfer since
the beginning of 1998, the time and date, the sender’s American Bankers Association routing
number, the receiver’s routing number, and the amount transferred. By comparing one day's
record of transactions with the next, we identify originating transfers of funds between two
institutions that can be associated with a reverse transaction the following business day
involving a slightly larger amount of money. In order to qualify as an overnight loan, the
candidate transaction pairs must pass a set of criteria regarding loan origination and
repayment.
The first filter to be applied is for the original amount of the loan. Stigum (1990)
discusses fed funds trades in amounts as low as $50,000. We use that figure as our minimum
size criterion and also require candidate loans to involve a round lot increment of $50,000.3
We therefore allow some smaller size transactions than Furfine (1999) considered with his
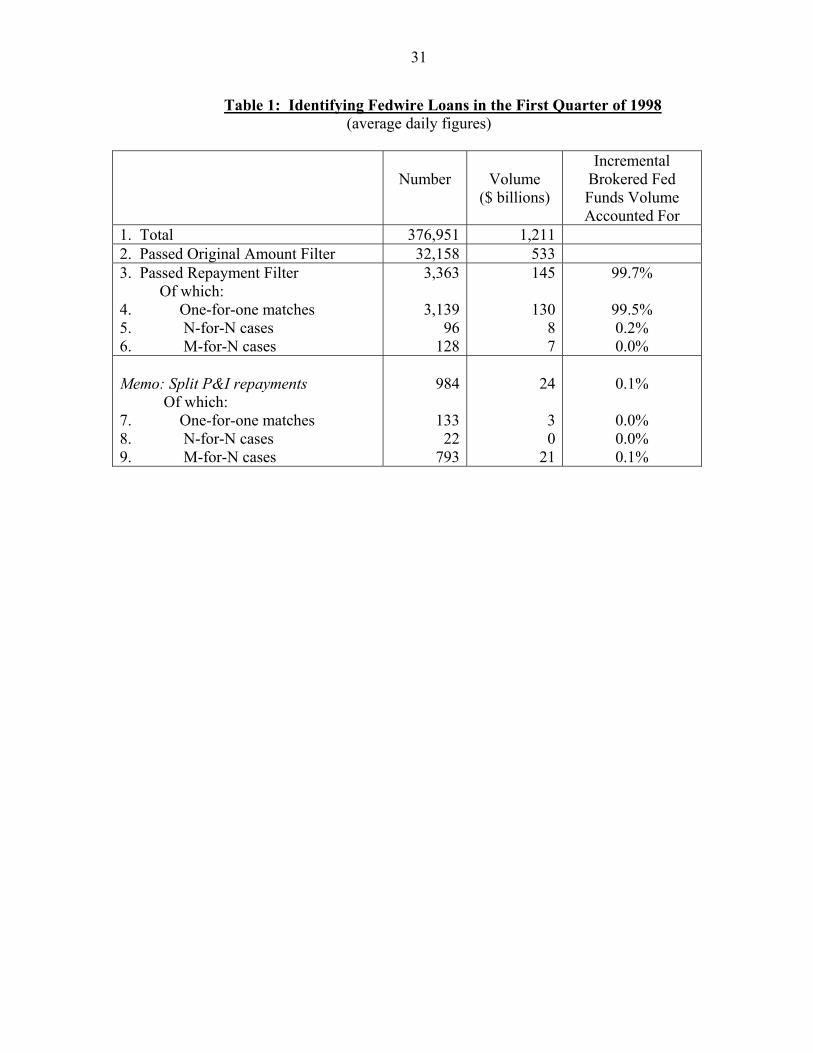
threshold of $1 million and round lot increment of $100,000. Table 1 facilitates comparison
of our results with those of Furfine, as it reports data for the first quarter of 1998, the sample
period he used. In that interval, we find that our loan amount filter, involving both the
minimum size and round lot criteria, pares the average daily number of candidate funds
transfers to 32,000 from the universe of 377,000. The filter cuts the average daily value of
3 Applying the round lot criterion means eliminating from consideration the "clean-up
transactions" that some sharp-penciled market participants use to try to drive their end-of-day
excess balances to zero.
10
funds transfers to $0.5 trillion from the total of $1.2 trillion. Most Fedwire funds transfers
are below our $50,000 threshold, as the median during the period was $35,000. (See
McAndrews (2000) and Coleman (2002) for supplementary information on the general
characteristics of Fedwire funds transfers.)
For transactions that pass the loan amount filter, we apply a series of criteria to
identify candidate repayments. The first test is whether the interest rate computed from the
repayment is within an acceptable range. (Market participants state that such repayments
would not be combined in the same wire with other types of interbank payments.) Furfine
used a range of 50 basis points below and above, respectively, the minimum and maximum
of four daily brokered federal funds rates: the 11:00 am rate, the closing rate, the effective
rate, and the FOMC's target rate. We use data on the minimum and maximum brokered
federal funds rates on each day and choose a wider interval. For a lower bound we subtract
100 basis points from the smaller of the minimum rate in the brokered market and the fed
funds target rate, or use 1/32 if this result is less than or equal to zero. For the upper limit we
add 100 basis points to the higher of the maximum brokered rate and the fed funds target.
The wider interval allows us to capture loans that potentially differ more noticeably from
brokered fed funds trades.
We employ another criterion for loan repayment that was not used by Furfine. We
examine whether the implied interest rate could have plausibly been a quoted rate in the
market. In particular, we filter out any repayments that do not correspond to a market quote
for interest rates in units of 1/32 percentage points or in whole basis points.4 Market
4 For example, consider a $50,000 loan with a repayment the next calendar day of
$50,001.48. The interest rate, on a quoted basis, is (1.48)(360)/50000 = 1.0656 percent,
11
participants indicate that quotes on federal funds have gradually become more refined.
While a tick was once one-sixteenth of a percentage point, quotes are now often made at the
level of basis points.
After applying both the loan amount and repayment filters, we identified 3,363
candidate transactions with a total value of $145 billion on average per day in the first quarter
of 1998. By contrast, Furfine's daily average of identified Fedwire loans was somewhat
smaller at 3,108, but the total value was similar at $144 billion. Thus, the lower size
threshold and the wider range of interest rates that we allowed with our algorithm, net of
some transactions rejected because of off-market quotes, did not have a material effect on the
overall value of transactions.
Our identification procedure implicitly embodies a trade-off between Type I and
Type II errors. With a null hypothesis that a Fedwire transfer is not an overnight loan, we
call false positive identifications Type I errors and false rejections of genuine loans Type II
errors. In the absence of a detailed survey of transaction data, the probabilities of making
such errors with our procedures cannot be quantified. Nevertheless, this error framework is
useful in making judgmental assessments of potential qualifying transactions.
We next partition culled transactions into several distinct groups. The largest class,
given in row 4, consists of transactions in which a unique loan amount between two
institutions was matched with a unique qualifying repayment. This class of "one-for-one"
which cannot be expressed in 1/32 percentage points or whole basis points. However, 1.0656
rounds to either 1-2/32 or 1.07. One day's interest on $50,000, at a quoted rate of 1-1/16
percent, rounds to the penny to $1.48, so this repayment would pass our "reasonable quote"
criterion.
12
transactions averaged $130 billion of loans per day, with a mean size of $41 million. The
dollar volume of transactions substantially exceeded that reported for brokered fed funds
transactions, which averaged $55 billion in the first quarter of 1998. Despite the relative
volumes, however, we found that these identified Fedwire loans could not account for all the
brokered fed funds trades. For each day, we calculated the total dollar volume of qualifying
Fedwire transactions at each interest rate and compared it with the brokered volume at that
rate. By this method, we found that 99.5 percent of brokered fed funds in the first quarter of
1998 could potentially be accounted for by the one-for-one Fedwire transactions, as indicated
in the last column of Table 1.
We believe that the probability of false positive identifications in the one-for-one
class of transactions is not particularly high. However, restricting identified loans to this
class would imply an unacceptably high probability of Type II errors in our judgment. The
second class of transactions we consider, in row 5, includes cases with more than one
qualifying loan of the same size between two institutions on the same day and an exactly
equal number of qualifying repayments for the loans of that size. We dub this class the "N-
for-N" transactions. Market participants report that such tranching of fed funds loans is not
uncommon. For instance, a lender may write multiple transaction "tickets" to diversify
operational risks or may place similar size offers at three different brokers that are taken up
by the same large buyer. Moreover, participants tend to spread their trading over the day,
refraining from attempts to close out their positions until some uncertainties related to
intraday payment flows become resolved.
The technological limit in the number of digits that Fedwire software can accept for a
single transaction does not appear to be a factor in the tranching of transactions. The limit
13
was a penny less than $1 billion until July 2002, when it was raised to a penny less than $10
billion. Daily interbank exposures often exceeded that limit. For instance, Furfine (2003)
reported that the maximum size of a daily fed funds transaction ranged from $3.8 billion to
$8.5 billion over February and March of 2003. However, while the average size of the N-
for-N class of transactions was larger than that for the one-for-one class, it was still too small,
at around $83 million, to suggest that this technological limit could account for them. Figure
2 plots the size of candidate Fedwire loans over our entire 1998-2002 sample period. As
shown, the N-for-N cases tend to involve larger and more variable transactions sizes than the
1-for-1 matches over the period. However, the mean size of these transactions remains well
below technological limits.
We believe that the possibility of Type I errors is only slightly higher with N-for-N
transactions than with one-for-one transactions. The matching of repayments with loan
amounts is admittedly ambiguous, and we use a first-in, first-out method. However, each
interest rate and the average loan duration for N-for-N cases would remain the same with
alternative allocation methods, as all the data would be used in any case. Only the dispersion
of loan durations could be affected by our choice of a first-in, first-out method, which
delivers the least diffuse set of loan durations. After allowing the one-for-one class to
account for as much of the brokered fed funds transactions as possible, the N-for-N class
could potentially account for only another 0.2 percent on average in the first quarter of 1998.
A third group of transactions, row 6 of Table 1, includes those in which the number of
same-size qualifying loans between two banks on the same day did not equal the number of
qualifying repayments on the next day, the M-for-N cases. In this class, our filters have
clearly captured some payments that are not legs of overnight loan transactions. The bulk of
14
these cases involved more qualifying repayments than loans, as might be expected, given the
stricter round lot criteria for loans. We selected among the possible matching repayments
based on interest rate and duration criteria. First, we gave preference to interest rates that had
been observed in the brokered market that day. Then, we selected repayments that were
closest to the average duration of loans in the one-for-one cases on that day.
This M-for-N class may include some mismatches of the return leg of some genuine
fed funds transactions and also, likely, a greater probability of false positive identifications of
loan originations than in the one-for-one and N-for-N cases. Our interest rate and duration
data therefore may be affected by Type I errors in selecting among possible repayments. For
this reason, we compare estimates of Fedwire loan statistics with and without the M-for-N
transactions. We believe inclusion of these transactions may importantly help reduce the
extent of Type II errors in the overall volume data. Moreover, our selection criteria are
designed to guard against the creation of outliers in interest rate and duration estimates when
including such transactions.
Furfine (1999) mentions another major category of Fedwire transactions in which the
repayment of principal occurs separately from the repayment of interest (these split principal
and interest–or “P&I”–repayments were actually not included in his reported data, however).
This category of transactions was suggested from the examination of underlying micro data
obtained from a survey of Fedwire participants conducted by the Federal Reserve Bank of
New York (1987). Some of the fed funds trades reported by participants in that survey
involved such split P&I repayments. More recently, in our telephone interviews, market
participants confirmed that at least one large bank did commonly use such split repayments
during our sample period. As indicated by lines 7-9 of Table 1, these split repayments were
15
predominantly M-for-N cases. Because most Fedwire funds transfers are rather small, we
often found a number of transfers that could qualify as potential interest payments.
Identifications of separated interest repayments were based on, first, whether the implied
interest rate corresponded to a reported interest rate in the brokered market and, second, the
closest match in time-of-day to the corresponding principal repayment. Selections among
any multiple potential principal repayments were based on the resulting loan duration that
most closely matched the average duration of the one-for-one combined payment
transactions.
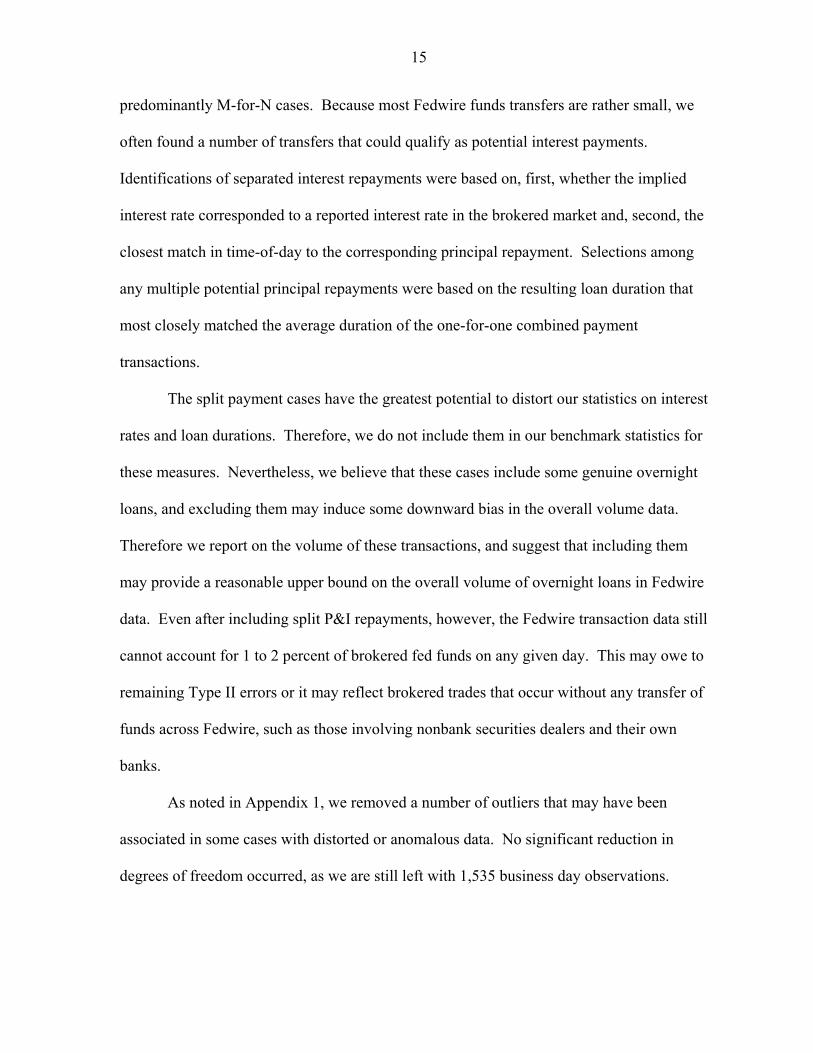
The split payment cases have the greatest potential to distort our statistics on interest
rates and loan durations. Therefore, we do not include them in our benchmark statistics for
these measures. Nevertheless, we believe that these cases include some genuine overnight
loans, and excluding them may induce some downward bias in the overall volume data.
Therefore we report on the volume of these transactions, and suggest that including them
may provide a reasonable upper bound on the overall volume of overnight loans in Fedwire
data. Even after including split P&I repayments, however, the Fedwire transaction data still
cannot account for 1 to 2 percent of brokered fed funds on any given day. This may owe to
remaining Type II errors or it may reflect brokered trades that occur without any transfer of
funds across Fedwire, such as those involving nonbank securities dealers and their own
banks.
As noted in Appendix 1, we removed a number of outliers that may have been
associated in some cases with distorted or anomalous data. No significant reduction in
degrees of freedom occurred, as we are still left with 1,535 business day observations.
16
IV. Brokered Fed Funds and Other Fedwire Loans
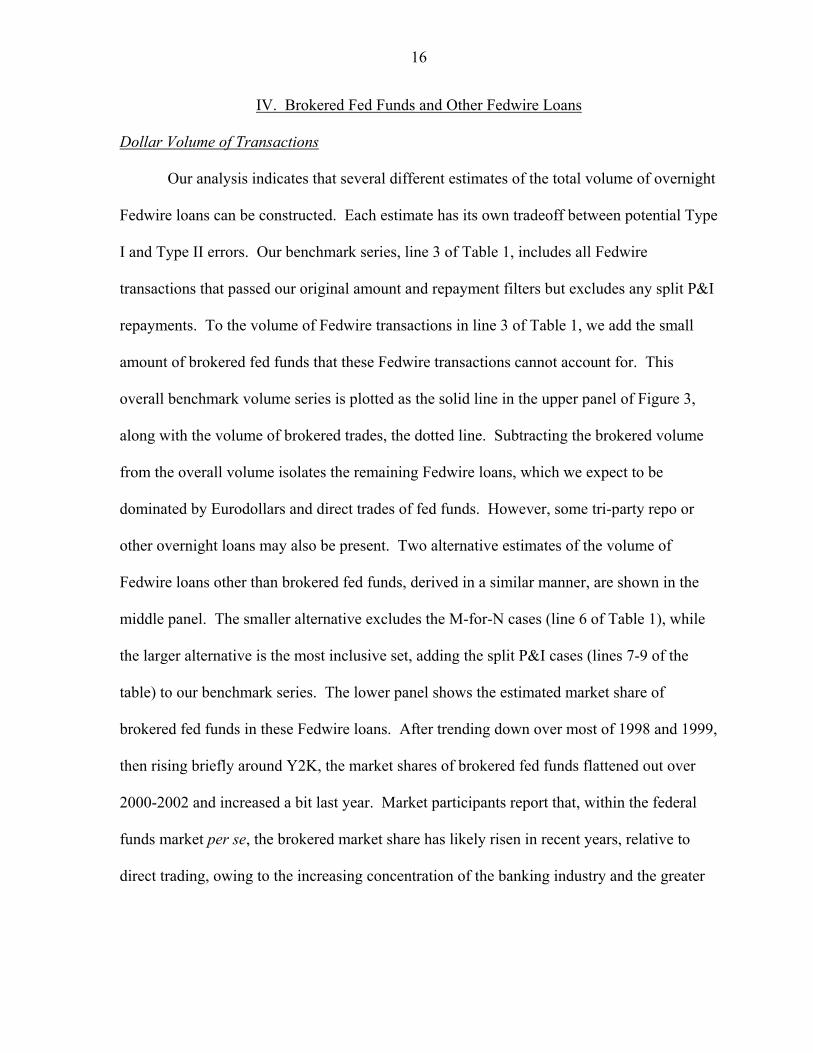
Dollar Volume of Transactions
Our analysis indicates that several different estimates of the total volume of overnight
Fedwire loans can be constructed. Each estimate has its own tradeoff between potential Type
I and Type II errors. Our benchmark series, line 3 of Table 1, includes all Fedwire
transactions that passed our original amount and repayment filters but excludes any split P&I
repayments. To the volume of Fedwire transactions in line 3 of Table 1, we add the small
amount of brokered fed funds that these Fedwire transactions cannot account for. This
overall benchmark volume series is plotted as the solid line in the upper panel of Figure 3,
along with the volume of brokered trades, the dotted line. Subtracting the brokered volume
from the overall volume isolates the remaining Fedwire loans, which we expect to be
dominated by Eurodollars and direct trades of fed funds. However, some tri-party repo or
other overnight loans may also be present. Two alternative estimates of the volume of
Fedwire loans other than brokered fed funds, derived in a similar manner, are shown in the
middle panel. The smaller alternative excludes the M-for-N cases (line 6 of Table 1), while
the larger alternative is the most inclusive set, adding the split P&I cases (lines 7-9 of the
table) to our benchmark series. The lower panel shows the estimated market share of
brokered fed funds in these Fedwire loans. After trending down over most of 1998 and 1999,
then rising briefly around Y2K, the market shares of brokered fed funds flattened out over
2000-2002 and increased a bit last year. Market participants report that, within the federal
funds market per se, the brokered market share has likely risen in recent years, relative to
direct trading, owing to the increasing concentration of the banking industry and the greater
17
use of brokers by large banks. An increasing share of overnight Eurodollar trades may
account for the downtrend early in our sample period.
The time series characteristics of the brokered fed funds volume are similar to those
of the three measures of other Fedwire loan volumes. Each has a positive trend and is trend
stationary. The series for other Fedwire loans are slightly more persistent, with first-order
autoregressive parameters between 0.78 and 0.81, versus 0.65 for brokered fed funds (the
differences relative to brokered fed funds are statistically significant). All volume series
exhibit similar volatility, with coefficients of variation around the trendline varying only
between 12 percent and 13-1/2 percent across the series.
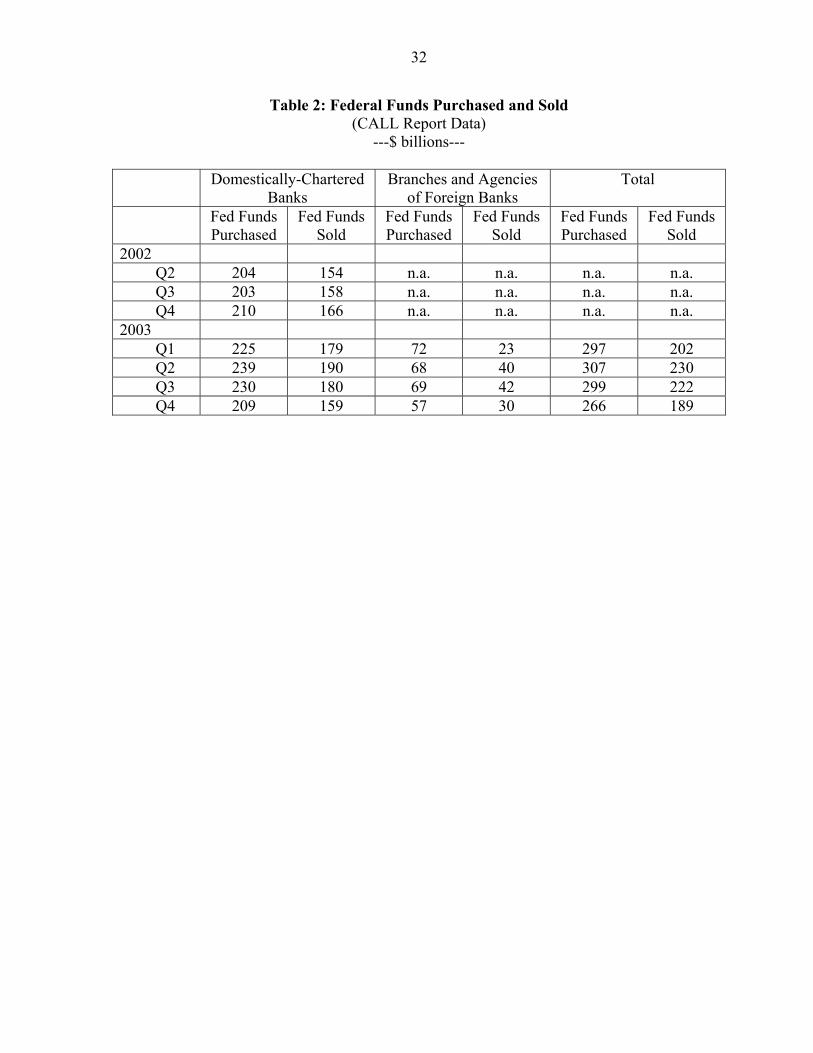
Recently, bank CALL reports have provided data on the volume of federal funds
purchases and sales. (Prior to 2002, such transactions were combined with repos.) Table 2
shows that the combined level of gross fed funds purchased by domestically-chartered banks
and branches and agencies of foreign banks, according to CALL reports, averaged $292
billion over the four quarter-ends of 2003. By contrast, the average volume of brokered fed
funds over those dates was only $84 billion, while identified overnight Fedwire loans
averaged $274 billion in our benchmark series and $331 billion in the series including split
repayments. However, the Fedwire data likely include a sizable amount of Eurodollar
transactions, which would not be included in the CALL report figures. On the other hand,
the CALL report data on fed funds purchased probably include a substantial volume of
rebookings of balances held at correspondent banks which do not involve Fedwire transfers.
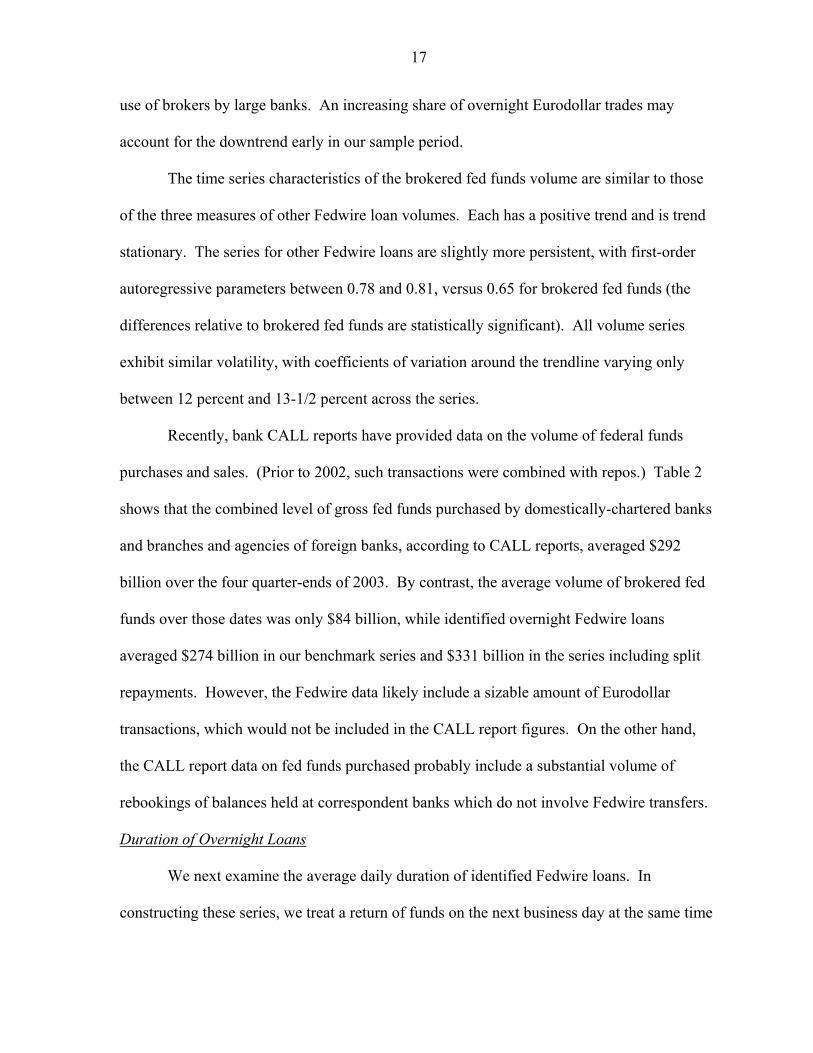
Duration of Overnight Loans
We next examine the average daily duration of identified Fedwire loans. In
constructing these series, we treat a return of funds on the next business day at the same time
18
of day as a 24-hour loan, even if a weekend or holiday intervenes between the day the loan
was extended and the day it was repaid. Figure 4 shows plots of four versions of the duration
series in order of increasing inclusiveness. The first panel shows only one-for-one matches
(line 4 of Table 1); the second panel includes one-for-one and N-for-N cases (lines 4 and 5 of
Table 1), next is our benchmark series, which includes also M-for-N cases (line 3 of Table
1), and the last panel also includes split P&I repayments. We did not expect to find
noticeable differences among these duration series and, indeed, we do not. As mentioned
above, the only categories where distortions to daily average durations might be expected
were the M-for-N and split repayment groups; however, proximity to the average duration of
one-for-one matches that day was one of the selection criteria in such cases. The duration
series are more volatile around year-ends and each measure is a little higher in the last two
years than over the previous four years on average. However, linear time trends are not
statistically significant. The average duration over the entire sample varies from 22.5 hours
for the least inclusive series to 22.7 hours for the most inclusive series.
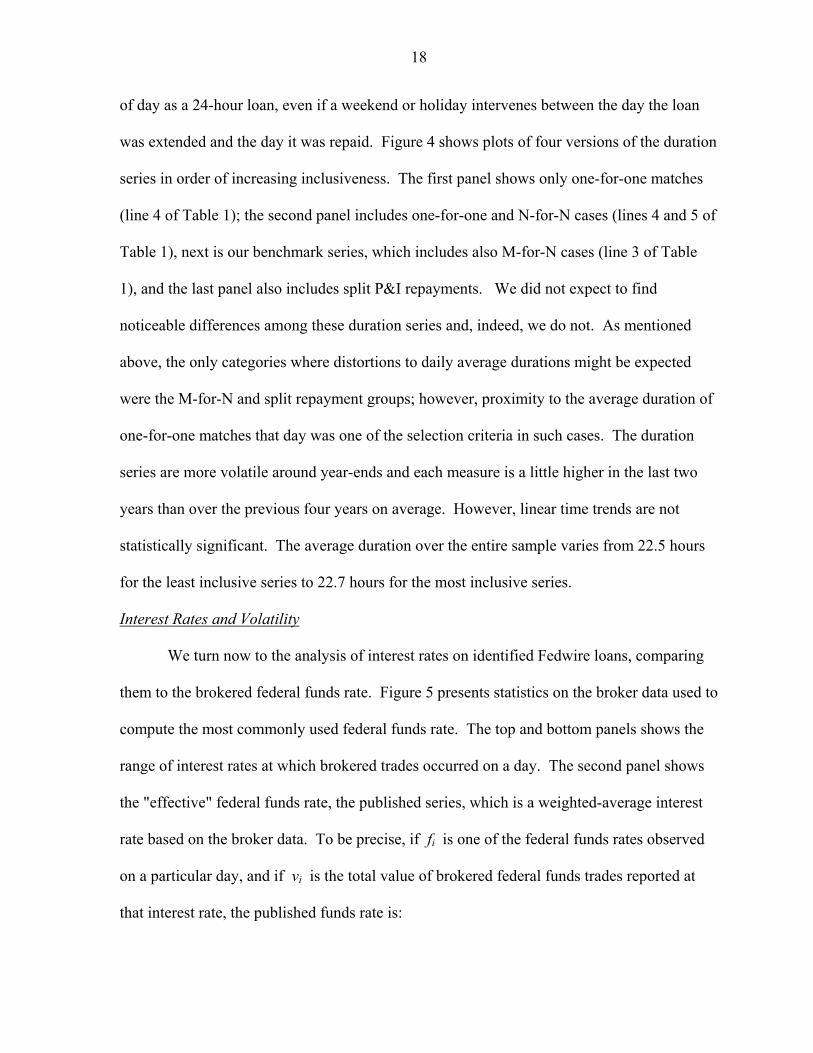
Interest Rates and Volatility
We turn now to the analysis of interest rates on identified Fedwire loans, comparing
them to the brokered federal funds rate. Figure 5 presents statistics on the broker data used to
compute the most commonly used federal funds rate. The top and bottom panels shows the
range of interest rates at which brokered trades occurred on a day. The second panel shows
the "effective" federal funds rate, the published series, which is a weighted-average interest
rate based on the broker data. To be precise, if fi is one of the federal funds rates observed
on a particular day, and if vi is the total value of brokered federal funds trades reported at
that interest rate, the published funds rate is:
19
Effective funds rate ≡ ∑∑ =≡i
ii
ii vvwheref
vvf , . (1)
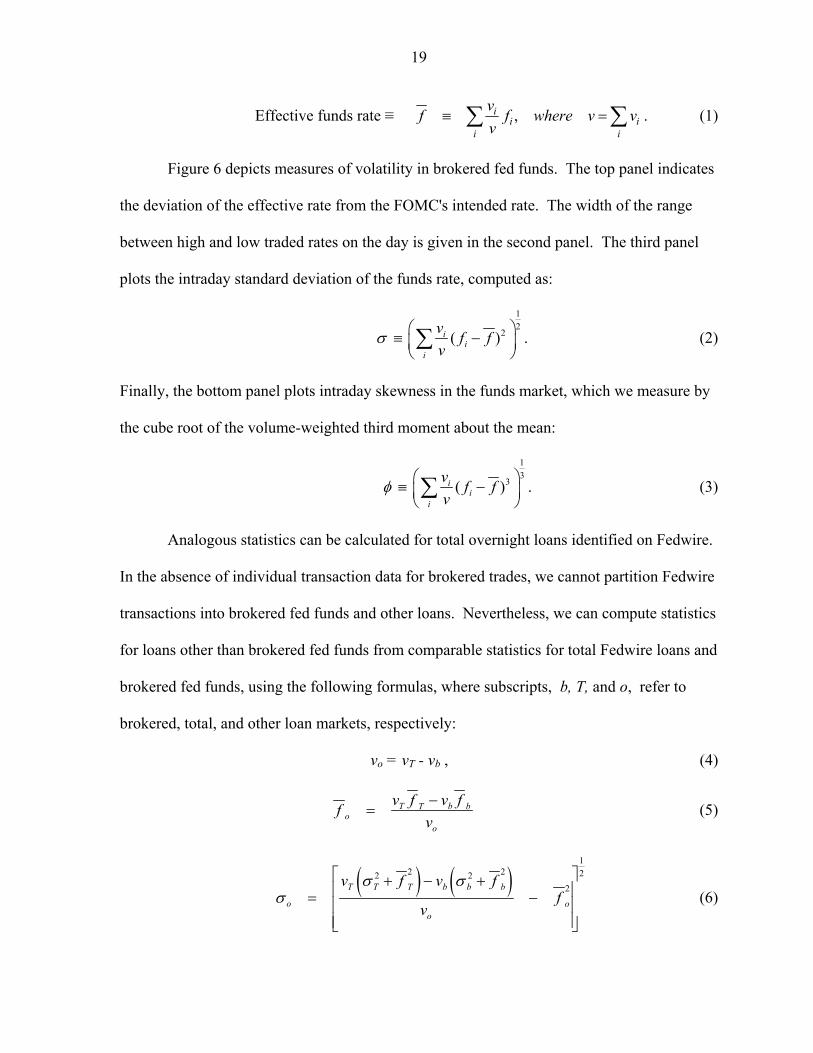
Figure 6 depicts measures of volatility in brokered fed funds. The top panel indicates
the deviation of the effective rate from the FOMC's intended rate. The width of the range
between high and low traded rates on the day is given in the second panel. The third panel
plots the intraday standard deviation of the funds rate, computed as:
12
2( )ii
i
v f fv
σ ≡ − ∑ . (2)
Finally, the bottom panel plots intraday skewness in the funds market, which we measure by
the cube root of the volume-weighted third moment about the mean:
13
3( )ii
i
v f fv
φ ≡ − ∑ . (3)
Analogous statistics can be calculated for total overnight loans identified on Fedwire.
In the absence of individual transaction data for brokered trades, we cannot partition Fedwire
transactions into brokered fed funds and other loans. Nevertheless, we can compute statistics
for loans other than brokered fed funds from comparable statistics for total Fedwire loans and
brokered fed funds, using the following formulas, where subscripts, b, T, and o, refer to
brokered, total, and other loan markets, respectively:
vo = vT - vb , (4)
T bT bo
o
v f v ffv−
= (5)
( ) ( )1
2 2 22 22T T b bT b
o oo
v f v ff
v
σ σσ
+ − + = −
(6)
20
13
3 3 __3 2 3 2 __32( 3 ) ( 3 ) 3T T T T b b b bT T b b
o o o oo
v f f v f f f fv
σ φ σ σ φ σφ σ
+ + − + + = − −
(7)
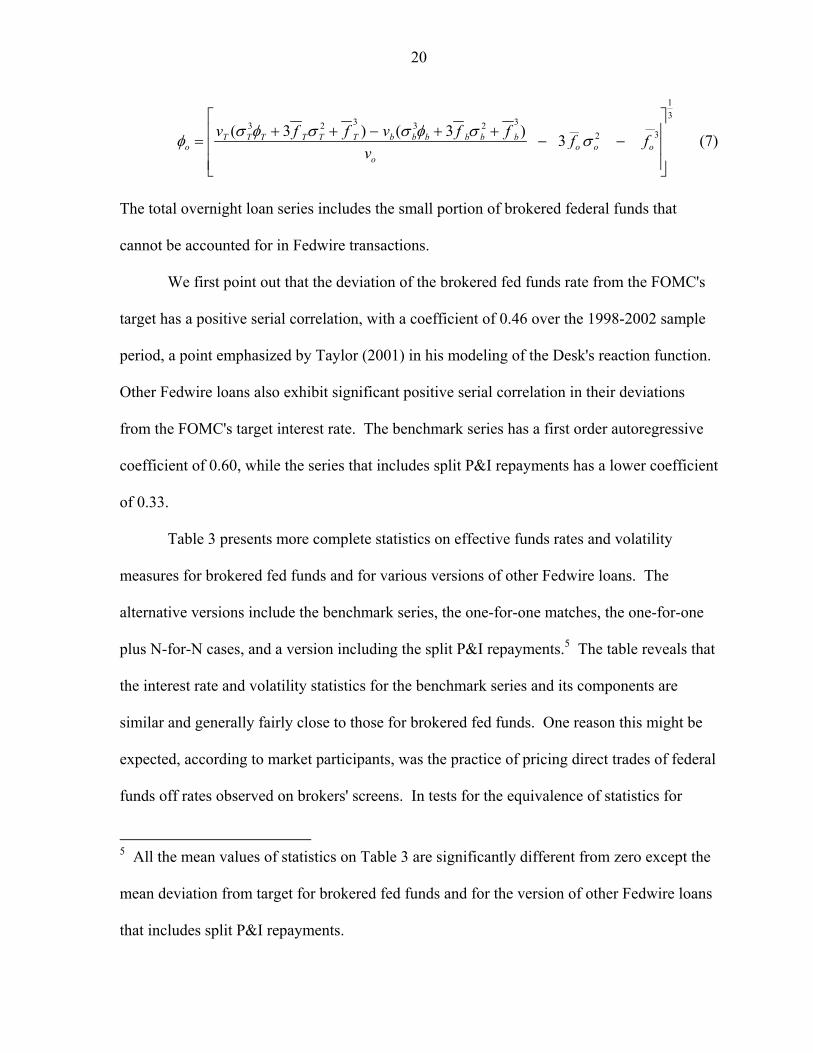
The total overnight loan series includes the small portion of brokered federal funds that
cannot be accounted for in Fedwire transactions.
We first point out that the deviation of the brokered fed funds rate from the FOMC's
target has a positive serial correlation, with a coefficient of 0.46 over the 1998-2002 sample
period, a point emphasized by Taylor (2001) in his modeling of the Desk's reaction function.
Other Fedwire loans also exhibit significant positive serial correlation in their deviations
from the FOMC's target interest rate. The benchmark series has a first order autoregressive
coefficient of 0.60, while the series that includes split P&I repayments has a lower coefficient
of 0.33.
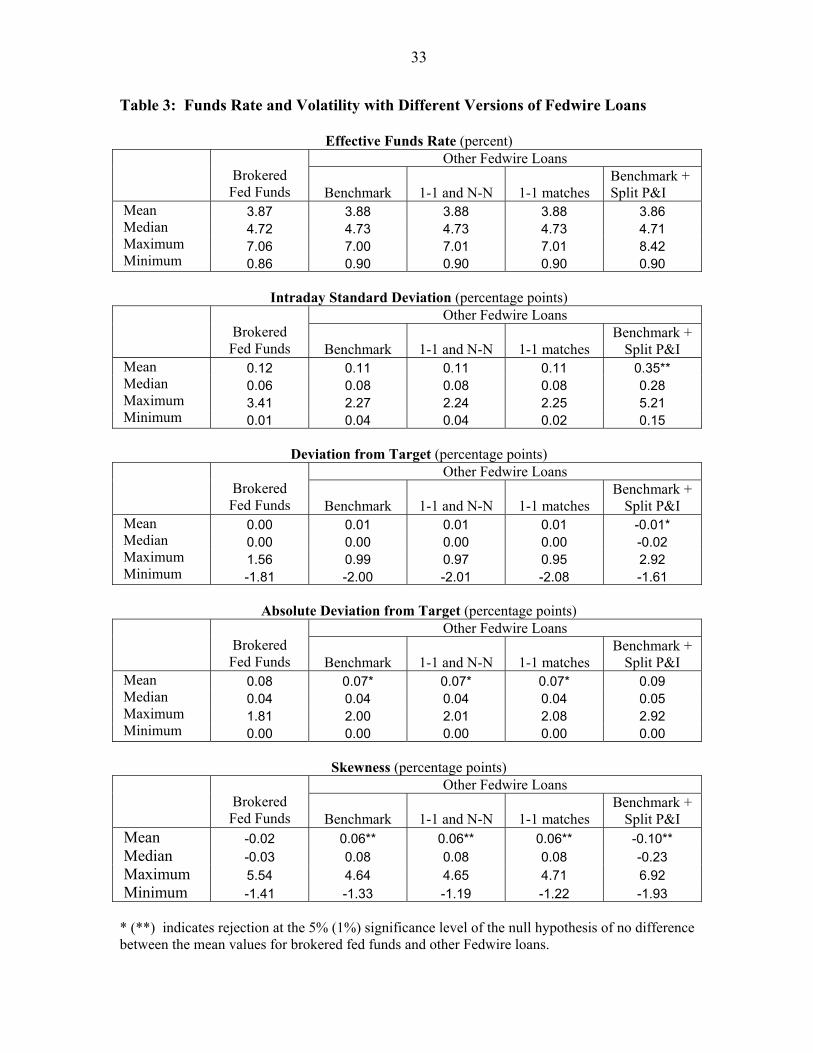
Table 3 presents more complete statistics on effective funds rates and volatility
measures for brokered fed funds and for various versions of other Fedwire loans. The
alternative versions include the benchmark series, the one-for-one matches, the one-for-one
plus N-for-N cases, and a version including the split P&I repayments.5 The table reveals that
the interest rate and volatility statistics for the benchmark series and its components are
similar and generally fairly close to those for brokered fed funds. One reason this might be
expected, according to market participants, was the practice of pricing direct trades of federal
funds off rates observed on brokers' screens. In tests for the equivalence of statistics for
5 All the mean values of statistics on Table 3 are significantly different from zero except the
mean deviation from target for brokered fed funds and for the version of other Fedwire loans
that includes split P&I repayments.
21
interest rates on brokered fed funds and benchmark other loans, significant differences are
found only in intraday standard deviations and in skewness, and even there, the differences
are small in terms of basis points. However, inclusion of the split P&I repayments induces a
large increase in the standard deviation of the other Fedwire interest rate series and reverses
the direction of average skewness. We believe these effects arise from the cross-sectional
heterogeneity of the other Fedwire loan series. For instance, one of the institutions reported
to employ a split repayment procedure is usually a large purchaser of fed funds, and often
directly from smaller banks at below market rates. This behavior could help account for the
fact that split repayment loans generally carry a lower interest rate, and when they are
included in the other loan series, they shift the skew to a negative average value. However,
because of the frequent presence in split repayments of multiple transfers that could
potentially qualify as separated repayments of interest, Type I errors in interest rate estimates
are likely to be more prevalent. For that reason, we limit further analysis of interest rate
behavior in other Fedwire loans to our benchmark series. Moreover, we omit further
references to subcomponents because of their similarity to the overall benchmark series.
Figure 7 depicts time series of overnight interest rates and measures of volatility for
the benchmark version of other Fedwire loans, which may be compared with similar series
for brokered fed funds shown in Figures 5 and 6. For the volatility measures, the vertical
axis scales are the same as those used for brokered fed funds. It would appear that the
dispersion and skewness of interest rates in both brokered fed funds and other overnight
loans on Fedwire have become more muted in recent years. Historical data on brokered
funds rates (not shown) suggest that the reduction in volatility during our sample period is a
continuation of a longer trend, which might be attributed to efforts of the Open Market Desk,
22
as well as improved information systems and reserve management at banks, as discussed in
Demiralp and Farley (2003). However, bank funding managers were not inclined to take
much credit for this development; rather, we heard complaints that there were now fewer
opportunities for profits from arbitraging volatile movements in overnight interest rates.
V. Arbitrage among Overnight Interbank Markets
In this section of the paper, we investigate the completeness of arbitrage across
overnight loan markets, and also compare our benchmark interest rate for other Fedwire
loans with Eurodollar and repo rates, as well as with brokered federal funds rates. First we
clean the data sets of several outlier values, as noted in Appendix 1. We then compute the
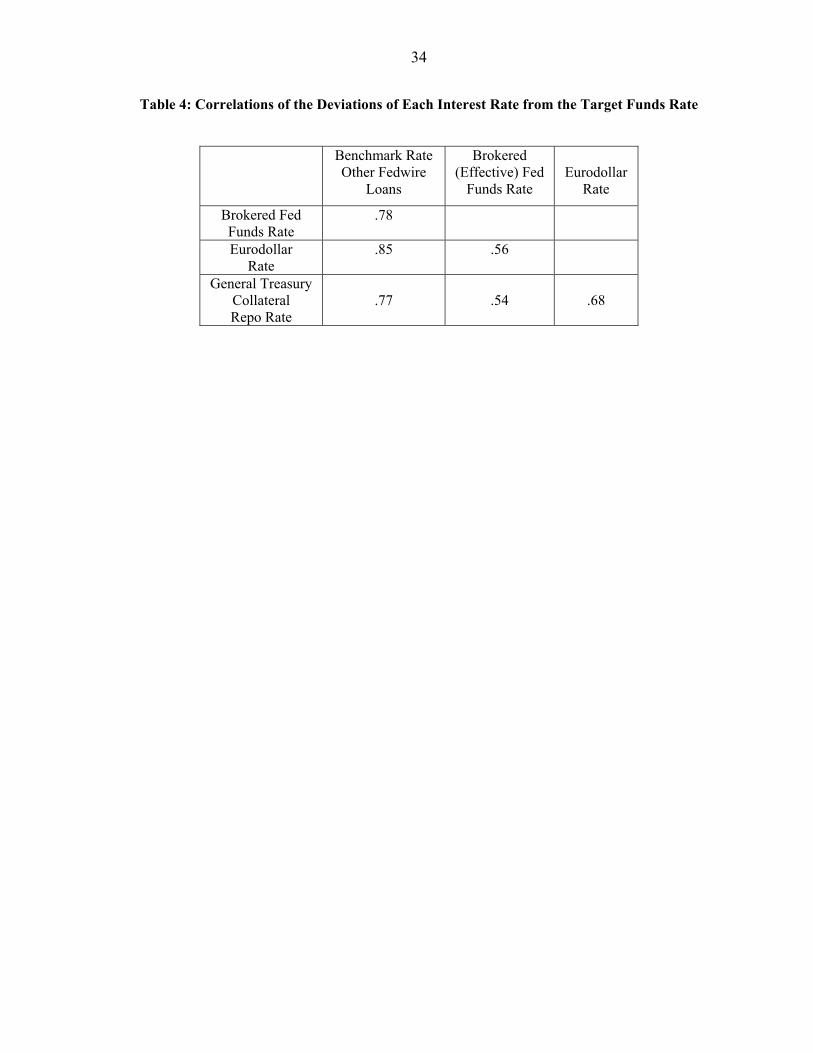
deviation of each of these interest rates from the FOMC’s target federal funds rate. Table 4
shows the matrix of contemporaneous daily correlations of these deviations from the
FOMC’s target rate over the 1998 through 2003 period. The benchmark rate deviations are
highly correlated with each of the market rate deviations, and those correlations are greater
than the correlations among the market rate deviations themselves.
To assess the degree of arbitrage among sub-markets, we regress each interest rate on
lags of itself and of each other interest rate, on the target funds rate, and on dummy variables
for the day of the maintenance period and for a variety of other calendar-specific days.
Based on Akaike and Schwartz information criteria, two lags of each interest rate were used,
except for the repo rate regression, where three lags were appropriate. Separate calendar-day
dummies are used for mid-month, quarter-end, and year-end effects, for before and after
holidays, and for Treasury settlement days. We also allowed for different coefficients on all
23
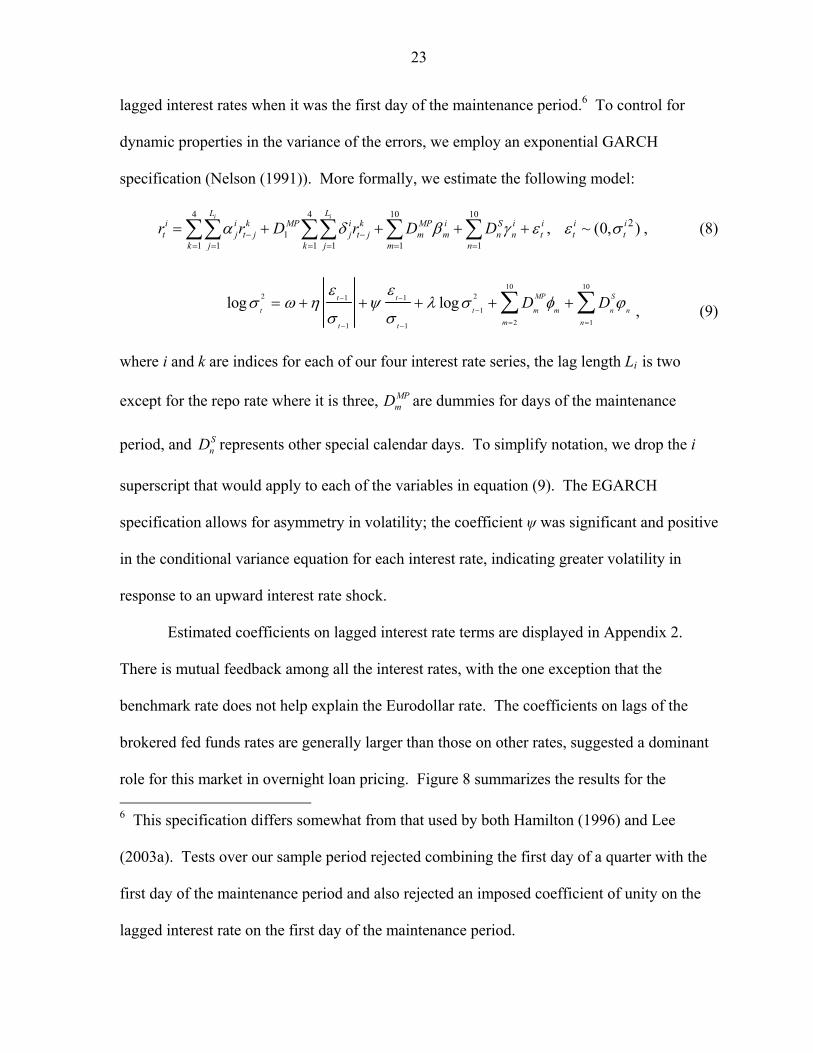
lagged interest rates when it was the first day of the maintenance period.6 To control for
dynamic properties in the variance of the errors, we employ an exponential GARCH
specification (Nelson (1991)). More formally, we estimate the following model:
4 4 10 10
11 1 1 1 1 1
i iL Li i k MP i k MP i S i i
t j t j j t j m m n n tk j k j m n
r r D r D Dα δ β γ ε− −= = = = = =
= + + + +∑∑ ∑∑ ∑ ∑ , 2~ (0, )i it tε σ , (8)
10 102 21 1
12 11 1
log log MP St t
t t m m n nm nt t
D Dε ε
σ ω η ψ λ σ φ ϕσ σ
− −
−
= =− −
= + + + + +∑ ∑ , (9)
where i and k are indices for each of our four interest rate series, the lag length Li is two
except for the repo rate where it is three, MPmD are dummies for days of the maintenance
period, and SnD represents other special calendar days. To simplify notation, we drop the i
superscript that would apply to each of the variables in equation (9). The EGARCH
specification allows for asymmetry in volatility; the coefficient ψ was significant and positive
in the conditional variance equation for each interest rate, indicating greater volatility in
response to an upward interest rate shock.
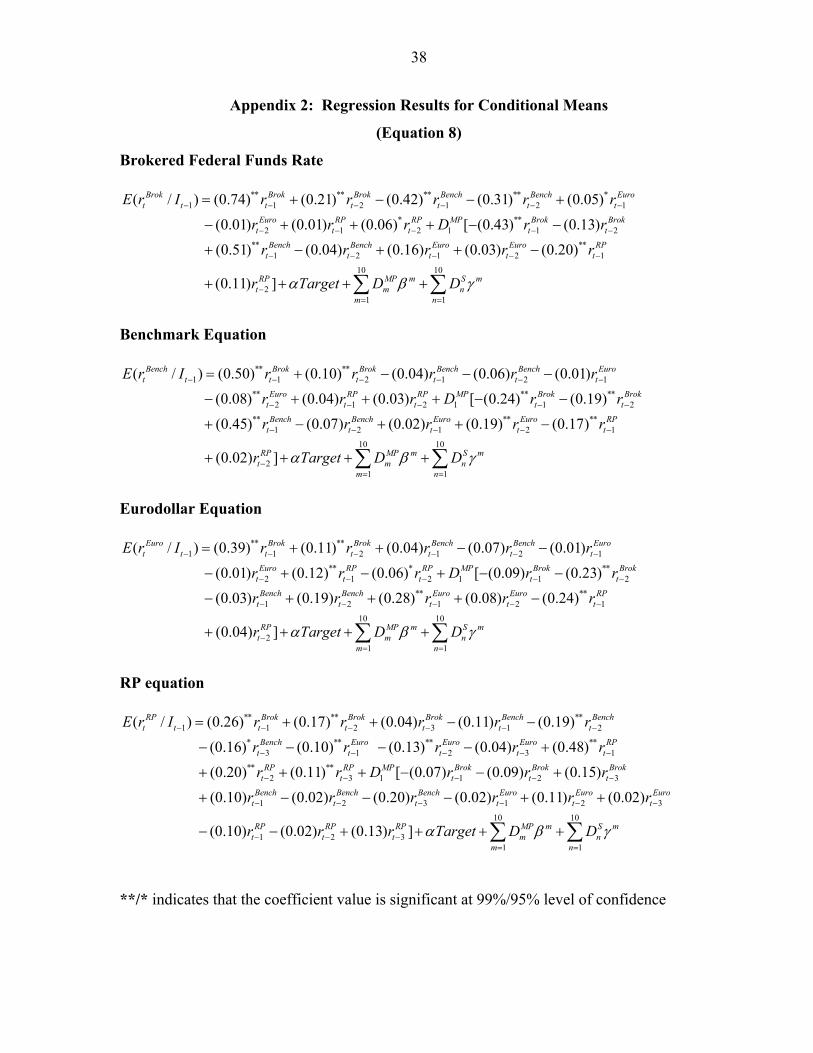
Estimated coefficients on lagged interest rate terms are displayed in Appendix 2.
There is mutual feedback among all the interest rates, with the one exception that the
benchmark rate does not help explain the Eurodollar rate. The coefficients on lags of the
brokered fed funds rates are generally larger than those on other rates, suggested a dominant
role for this market in overnight loan pricing. Figure 8 summarizes the results for the 6 This specification differs somewhat from that used by both Hamilton (1996) and Lee
(2003a). Tests over our sample period rejected combining the first day of a quarter with the
first day of the maintenance period and also rejected an imposed coefficient of unity on the
lagged interest rate on the first day of the maintenance period.
24
conditional mean across the days of the reserve maintenance period and other calendar days.
Most of the maintenance period effects are significantly different from zero. As in earlier
sample periods studied by Griffiths and Winters (1995), Hamilton (1996), and Lee (2003a),
we find that the funds rate tends to be soft on Fridays. Also, as in Griffiths and Winters
(1997), we find it is low on the second-to-last day of the maintenance period. Such effects
have been attributed in part to “lock-in” effects: Banks try to avoid large purchases of
reserves over the weekend and on the second Tuesday for fear of having an excess position
by settlement day, which they may find difficult to run off without incurring penalties for
overnight overdrafts. In addition, we find that rates on Mondays and on settlement
Wednesday tend to be high, particularly for the brokered fed funds and benchmark rates. In
contrast to the findings of Lee (2003a) for an earlier sample period, our data do not suggest
that maintenance-period effects in Eurodollars are on balance muted relative to fed funds.
Also, we do not observe the increasingly negative level effects over the first seven days of
the maintenance period, documented by Hamilton (1996).7
On other calendar-specific days, there is typically upward pressure on the funds rate,
as might be expected on days when the market has a lot of work to do to correct a starting
mal-distribution of reserves among banks. The exception to that principle has been the
tendency for the funds rate to trade well below target at year end, which is attributable to a
very generous supply of reserves by the Open Market Desk on such days in recent years.
7 We confirmed the absence of a cumulating downtrend over the maintenance period in our
sample period even with Hamilton’s (1996) univariate specification for the brokered funds
rate.
25
Figure 9 provides a similar overview of conditional variance results across the reserve
maintenance period and other calendar days. For all submarkets except Eurodollars,
volatility tends to increase over the last three days of the maintenance period. However, for
all interest rates aside from the brokered fed funds rate, the variances also tend to be high on
the first Friday of the period. Volatility is generally high on other special pressure days, with
year-end being a notable exception.
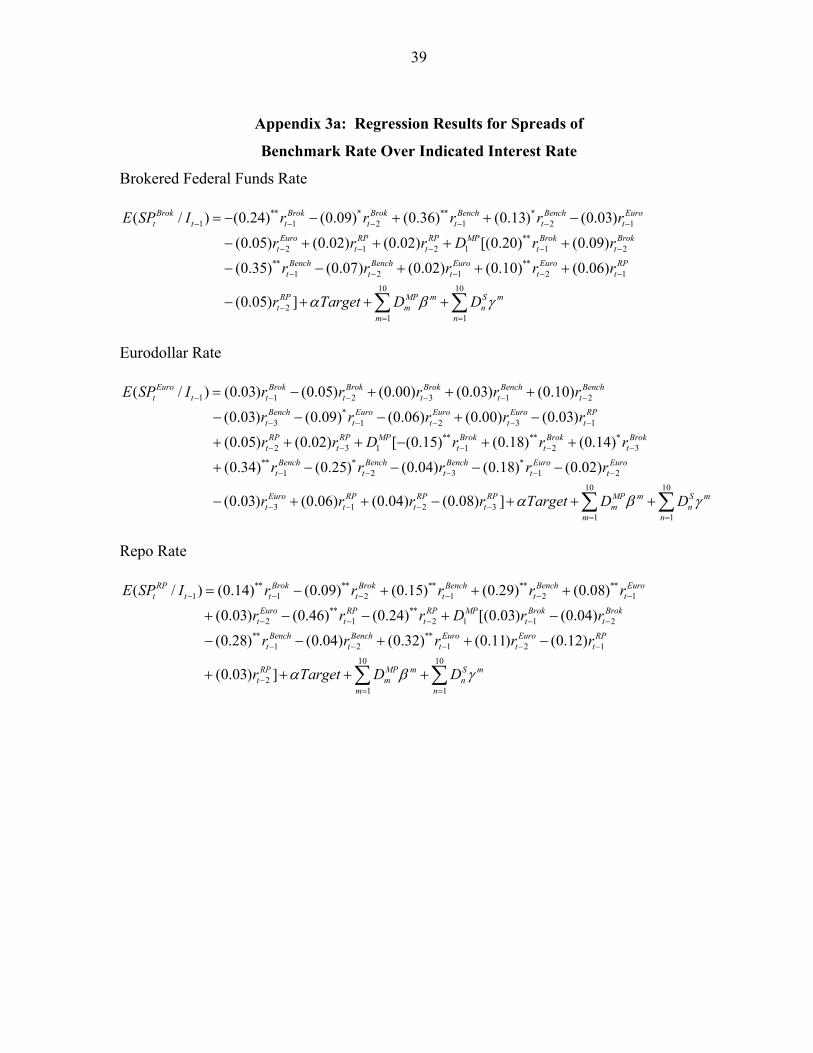
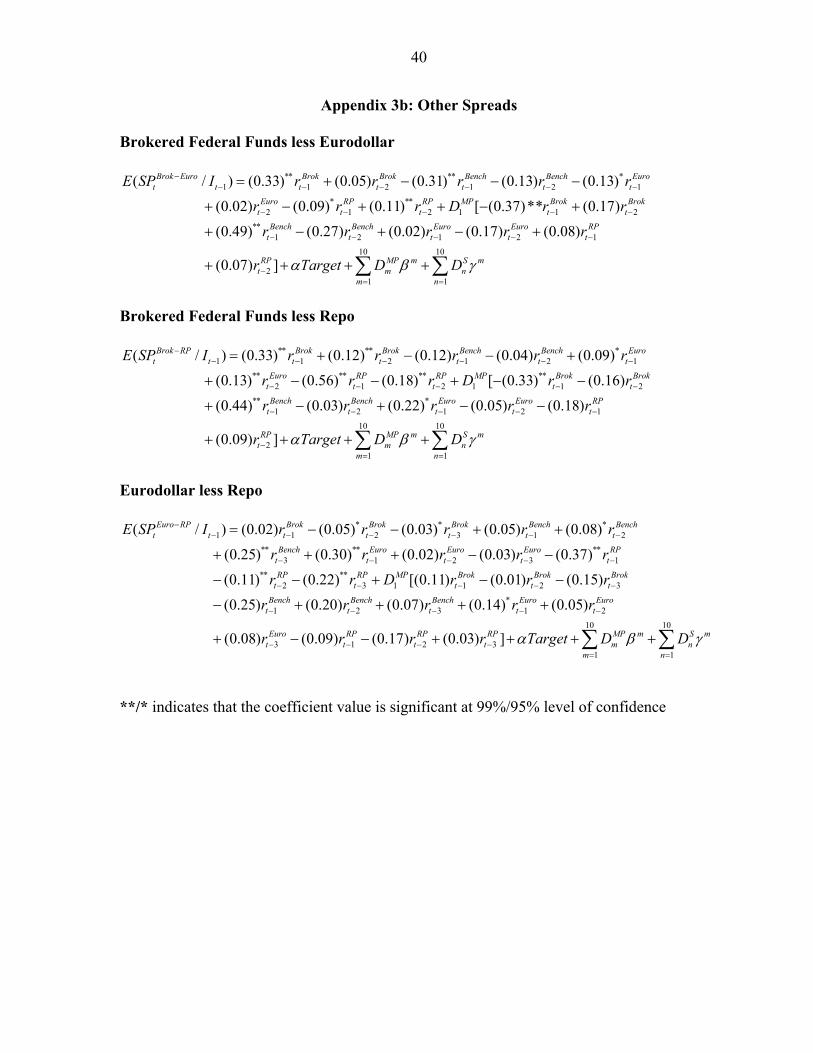
To test for significant differences between the benchmark rate and each of the market
interest rates, we regress the spread of the benchmark rate over each market interest rate on
all of the above variables (and again using an EGARCH model). As noted by Lee (2003a),
calendar effects are insignificant in explaining a spread between two interest rates if and only
if the associated coefficients in the regressions for the individual interest rates are
insignificantly different from each other. Appendix 3 presents the regression results
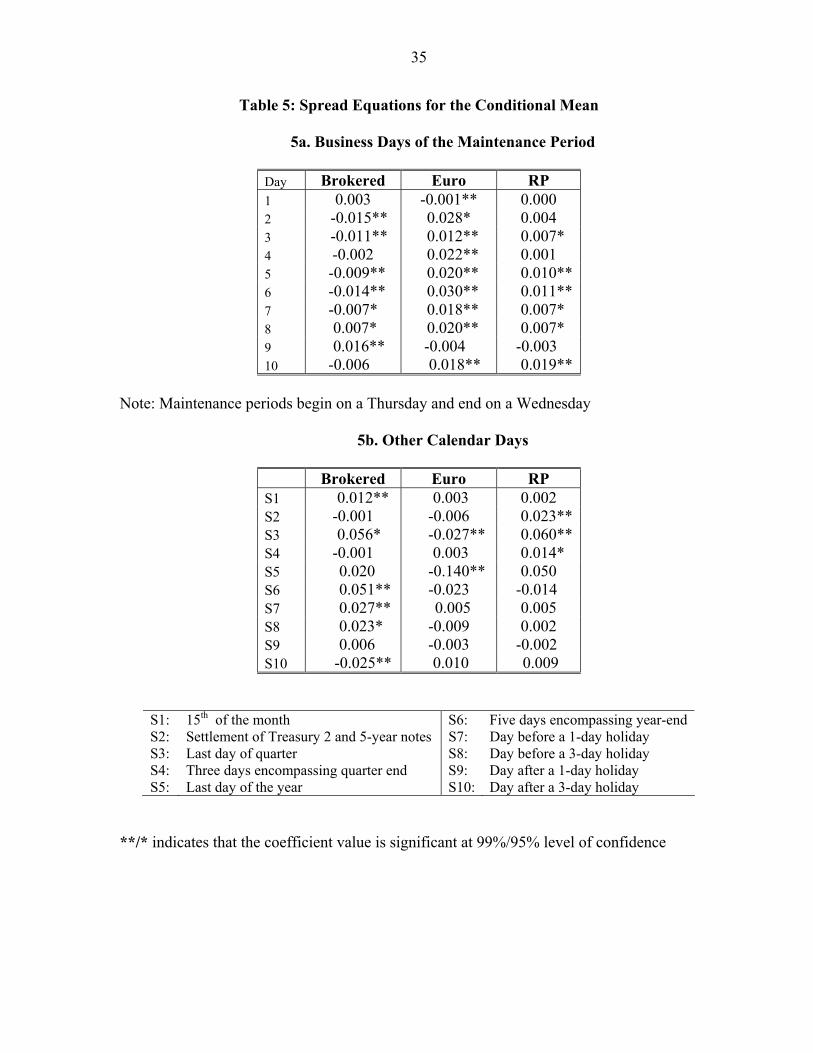
regarding lagged interest rate terms, while Table 5 shows the calendar effects. As indicated,
spreads of the benchmark rate over various market rates often have significant calendar
effects, indicating incomplete arbitrage among these markets. The potential gains from
further arbitrage over the maintenance period are generally fairly small, though often
amounting to 2 to 3 basis points for the benchmark–Eurodollar rate spread (which is just
above the standard 2 basis point brokerage fee on fed funds trades). Potential arbitrage gains
are larger on other calendar-specific days, reaching as high as 5 to 6 basis points on quarter-
and year-ends.
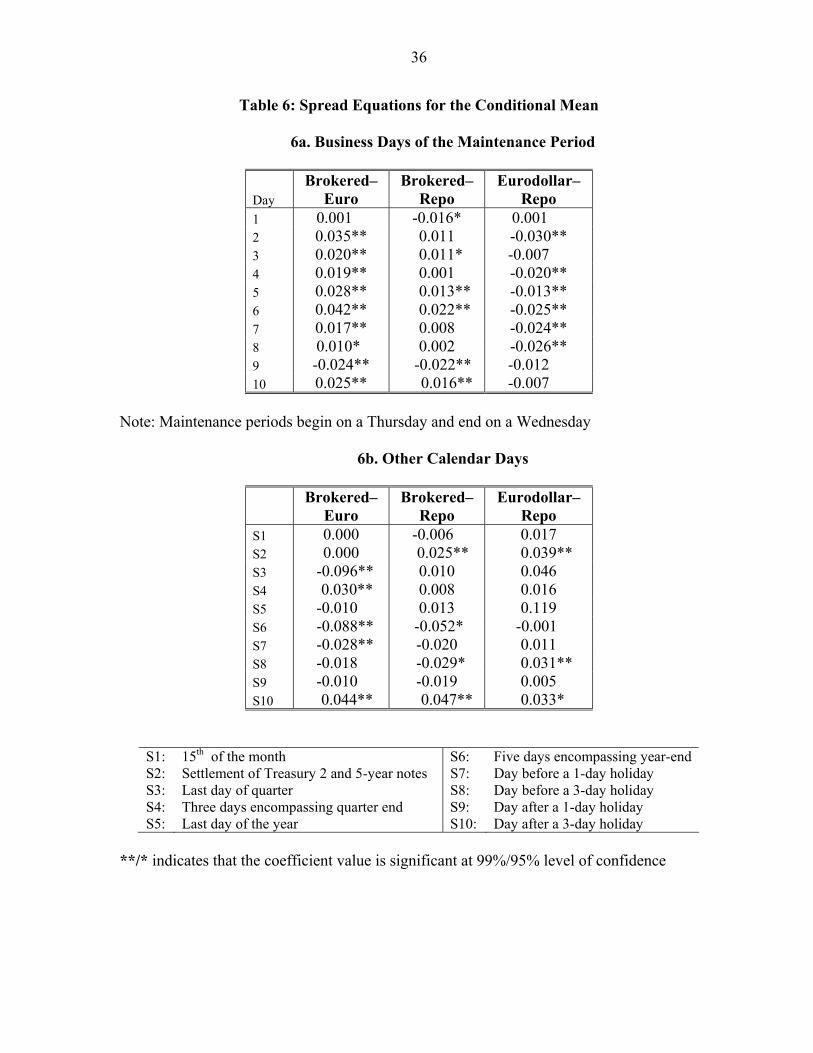
We assess the degree of arbitrage among the market rates themselves by regressing
spreads between these rates on lagged rates and the calendar dummies. As indicated in Table
6, significant and sizable movements of mean spreads are evident on several days of the
26
maintenance period and other calendar days. The brokered funds rate tends to trade high
relative to the Eurodollar and repo rates through the middle of a maintenance period. The
largest effects, however, are around quarter- and year-ends. In particular, the spread of the
Eurodollar rate over the brokered fed funds rate has been 9 to 10 basis points above what
might otherwise be expected on such days. One reason for the incompleteness of arbitrage in
such markets is the different times of concentrated trading over the business day, as noted by
Lee (2003b) and others. In particular, trading in Eurodollars and repo, as well as direct
trades of federal funds, tends to be concentrated during morning hours (U.S. Eastern time),
while trading in brokered fed funds is most concentrated toward the end of the business day.
VI. Conclusion
In this paper, we investigated the identification of overnight loans in Fedwire funds
transfers that do not involve the exchange of securities. We evaluated a variety of
identification criteria and types of candidate transactions. We analyzed the statistical
properties of the resulting partitions of identified loans between brokered fed funds and other
Fedwire loans. In interpreting our results, we benefited from interviews we conducted with
reserve managers of several major banks.
We found a range of alternative possible estimates of overnight loans in the Fedwire
data on transfers of funds. None of the estimates could completely account for the volume of
fed funds transactions reported by brokers, presumably because some brokered transactions,
such as those involving nonbank securities dealers, may not involve the transfer of balances
held at Reserve Banks. Each of our estimates involved a trade-off of possible Type I and
Type II errors, which could not be quantified, but likely varied depending on the purpose to
be served by the estimates. In particular, we found that a somewhat restricted class of
27
transactions was probably appropriate for the investigation of interest rate issues, even
though it might underestimate the total volume of overnight loans.
Across the range of estimates, we found that the share of brokered fed funds in total
overnight loans identified in Fedwire funds transfers has fallen from a range of 34 to 42
percent in early 1998 to a range of 27 to 33 percent by late 2003. Market participants
indicate that this result likely reflects the increased role of overnight Eurodollar transactions
in Fedwire data. Eurodollar transactions may be brokered or direct trades; while many may
be interbank, money funds and large corporations are also important suppliers of overnight
funds in this market. Another key component of overnight Fedwire loans, direct
(nonbrokered) trades of fed funds, has reportedly lost some market share to the brokered
market in recent years, as the banking industry has become more consolidated. In addition,
an unknown, but likely small, volume of overnight loans in Fedwire data may be tri-party
repurchase agreements. While not typically used for interbank lending, the tri-party repo
market has reportedly grown substantially over recent years, and some of these trades may be
settled over Fedwire without any evident transfer of a security.
Multiple regression analysis with an exponential GARCH model indicates that, in the
period since early 1998, arbitrage has been incomplete across brokered fed funds,
Eurodollars, repo, and the transactions included in other overnight Fedwire loans that are not
brokered fed funds. In particular, predictable movements in the spreads between these
interest rates are evident across days of the reserve maintenance period and on other regular
calendar days. While many of these movements are below typical brokerage fees of 2
percent (at an annual rate), they amount to 3 or 4 basis points in the middle of a maintenance
period, and up to 9 or 10 basis points at quarter- and year-ends.
28
In addition, the pattern of effects across days of the maintenance period and other
calendar days has evidently evolved to some extent relative to previous literature that used
earlier sample periods. In particular, we find that day-of-the-maintenance-period effects in
Eurodollars are no longer muted relative to brokered fed funds, in contrast to Lee (2003).
Also, we no longer observe the cumulating downtrend in rates over the first seven business
days of the maintenance period, observed by Hamilton (1996).
Finally, our regression results suggest that interest rates on Fedwire loans other than
brokered fed funds have properties that distinguish them from overnight Eurodollar rates as
well as from brokered fed funds and repo rates. This lends credence to the idea that a
substantial volume of these loans may be direct (nonbrokered) trades of fed funds. While
such transactions may have diminished in importance in recent years, as market participants
assert, they nevertheless evidently continue to play an important role in overnight interbank
lending.
29
References
Anderson, Clay, and 14 co-authors, 1959, "The Federal Funds Market–A Study by a
Federal Reserve System Committee," Board of Governors of the Federal Reserve
System.
Coleman, Stacy, 2002, "The Evolution of the Federal Reserve's Intraday Credit Policies,"
Federal Reserve Bulletin, V. 88, n. 2, February, pages 67-84.
Cyree, Ken, Mark Griffiths, and Drew Winters, 2003, “On the Pervasive Effects of
Federal Reserve Settlement Regulations,” Economic Review, Federal Reserve Bank
of St. Louis, March/April, pages 27-46.
Cyree, Ken, and Drew Winters, 2001, “Analysis of Federal Funds Rate Changes and
Variance Patterns,” Journal of Financial Research, V. 24 no. 3, pages 403-418.
Demiralp, Selva and Dennis Farley, forthcoming, “Declining Required Reserves, Funds Rate
Volatility, and Open Market Operations,” Journal of Banking and Finance.
Federal Reserve Bank of New York, 1987, "A Study of Large-Dollar Payment Flows
through CHIPS and Fedwire," mimeo, December.
Furfine, Craig, 1999, "The Microstructure of the Federal Funds Market," Financial
Markets, Institutions & Instruments, V.8, N. 5, November, pages 24-44.
Furfine, Craig, 2003, "Interbank Exposures: Quantifying the Risk of Contagion," Journal
of Money, Credit and Banking, V. 35, pages 111-128.
Goodfriend, Marvin, and William Whelpley, 1993, "Federal Funds," Instruments of the
Money Market, Federal Reserve Bank of Richmond, pages 7-21.
Griffiths, Mark and Drew Winters, 1995, “Day-of-the-Week Effects in Federal Funds Rates:
Further Empirical Findings,” Journal of Banking and Finance, V. 19, pages 1265-
1284.
, 1997, “The Effect of Federal Reserve Accounting Rules on the Equilibrium
Level of Overnight Repo Rates,” Journal of Business Finance & Accounting, V. 24
no. 6, pages 815-832.
Hamilton, James, 1996, "The Daily Market for Federal Funds," Journal of Political
Economy, 104, pages 26-56.
, 1997, “Measuring the Liquidity Effect,” American Economic Review, V. 87,
pages 80-97.
30
Lee, Young-Sook, 2003a, “The Federal Funds Market and the Overnight Eurodollar Market,”
Journal of Banking & Finance, V. 27, pages 749-771.
, 2003b, “Intraday Predictability of Overnight Interest Rates,” working paper,
University of Nottingham.
McAndrews, James, and Samira Rajan, 2000, "The Timing and Funding of Fedwire
Funds Transfers," Economic Policy Review, Federal Reserve Bank of New York,
July, pages 1-16.
Nelson, Daniel, 1991, “Conditional Heteroskedasticity in Asset Returns: A New Approach,”
Econometrica, V. 59, pages 347-370.
Richmond, Samuel B., 1957, Principles of Statistical Analysis, The Ronald Press
Company, New York.
Spindt, Paul and J. Hoffmeister, 1988, “The Micromechanics of the Federal Funds Market:
Implications of day-of-the-week Effects in Funds Rate Volatility,” Journal of
Financial and Quantitative Analysis, V. 23 no. 4, pages 401-416.
Stigum, Marcia, 1990, "The Money Market," 3rd ed., Homewood, Illinois, Dow Jones-
Irwin.
Taylor, John, 2001, "Expectations, Open Market Operations, and Changes in the Federal
Funds Rate," working paper, Stanford University.
Willis, Parker, 1970, "Federal Funds Market Origin and Development," Federal Reserve
Bank of Boston
31
Table 1: Identifying Fedwire Loans in the First Quarter of 1998 (average daily figures)
Number
Volume
($ billions)
Incremental Brokered Fed Funds Volume Accounted For
1. Total 376,951 1,211 2. Passed Original Amount Filter 32,158 533 3. Passed Repayment Filter Of which: 4. One-for-one matches 5. N-for-N cases 6. M-for-N cases
3,363
3,13996
128
145
13087
99.7%
99.5% 0.2% 0.0%
Memo: Split P&I repayments Of which: 7. One-for-one matches 8. N-for-N cases 9. M-for-N cases
984
13322
793
24
30
21
0.1%
0.0% 0.0% 0.1%
32
Table 2: Federal Funds Purchased and Sold (CALL Report Data)
---$ billions--- Domestically-Chartered
Banks Branches and Agencies
of Foreign Banks Total
Fed Funds Purchased
Fed Funds Sold
Fed Funds Purchased
Fed Funds Sold
Fed Funds Purchased
Fed Funds Sold
2002 Q2 204 154 n.a. n.a. n.a. n.a. Q3 203 158 n.a. n.a. n.a. n.a. Q4 210 166 n.a. n.a. n.a. n.a. 2003 Q1 225 179 72 23 297 202 Q2 239 190 68 40 307 230 Q3 230 180 69 42 299 222 Q4 209 159 57 30 266 189
33
Table 3: Funds Rate and Volatility with Different Versions of Fedwire Loans
Effective Funds Rate (percent) Other Fedwire Loans
Brokered Fed Funds
Benchmark
1-1 and N-N
1-1 matches
Benchmark + Split P&I
3.87 3.88 3.88 3.88 3.86 4.72 4.73 4.73 4.73 4.71 7.06 7.00 7.01 7.01 8.42
Mean Median Maximum Minimum 0.86 0.90 0.90 0.90 0.90
Intraday Standard Deviation (percentage points) Other Fedwire Loans
Brokered Fed Funds
Benchmark
1-1 and N-N
1-1 matches
Benchmark + Split P&I
0.12 0.11 0.11 0.11 0.35** 0.06 0.08 0.08 0.08 0.28 3.41 2.27 2.24 2.25 5.21
Mean Median Maximum Minimum 0.01 0.04 0.04 0.02 0.15
Deviation from Target (percentage points) Other Fedwire Loans
Brokered Fed Funds
Benchmark
1-1 and N-N
1-1 matches
Benchmark + Split P&I
0.00 0.01 0.01 0.01 -0.01* 0.00 0.00 0.00 0.00 -0.02 1.56 0.99 0.97 0.95 2.92
Mean Median Maximum Minimum -1.81 -2.00 -2.01 -2.08 -1.61
Absolute Deviation from Target (percentage points) Other Fedwire Loans
Brokered Fed Funds
Benchmark
1-1 and N-N
1-1 matches
Benchmark + Split P&I
0.08 0.07* 0.07* 0.07* 0.09 0.04 0.04 0.04 0.04 0.05 1.81 2.00 2.01 2.08 2.92
Mean Median Maximum Minimum 0.00 0.00 0.00 0.00 0.00
Skewness (percentage points) Other Fedwire Loans
Brokered Fed Funds
Benchmark
1-1 and N-N
1-1 matches
Benchmark + Split P&I
Mean -0.02 0.06** 0.06** 0.06** -0.10** Median -0.03 0.08 0.08 0.08 -0.23 Maximum 5.54 4.64 4.65 4.71 6.92 Minimum -1.41 -1.33 -1.19 -1.22 -1.93 * (**) indicates rejection at the 5% (1%) significance level of the null hypothesis of no difference between the mean values for brokered fed funds and other Fedwire loans.
34
Table 4: Correlations of the Deviations of Each Interest Rate from the Target Funds Rate
Benchmark Rate Other Fedwire
Loans
Brokered (Effective) Fed
Funds Rate
Eurodollar
Rate
Brokered Fed Funds Rate
.78
Eurodollar Rate
.85 .56
General Treasury Collateral Repo Rate
.77
.54
.68
35
Table 5: Spread Equations for the Conditional Mean
5a. Business Days of the Maintenance Period
Day Brokered Euro RP 1 0.003 -0.001** 0.000 2 -0.015** 0.028* 0.004 3 -0.011** 0.012** 0.007* 4 -0.002 0.022** 0.001 5 -0.009** 0.020** 0.010** 6 -0.014** 0.030** 0.011** 7 -0.007* 0.018** 0.007* 8 0.007* 0.020** 0.007* 9 0.016** -0.004 -0.003 10 -0.006 0.018** 0.019**
Note: Maintenance periods begin on a Thursday and end on a Wednesday
5b. Other Calendar Days
Brokered Euro RP S1 0.012** 0.003 0.002 S2 -0.001 -0.006 0.023** S3 0.056* -0.027** 0.060** S4 -0.001 0.003 0.014* S5 0.020 -0.140** 0.050 S6 0.051** -0.023 -0.014 S7 0.027** 0.005 0.005 S8 0.023* -0.009 0.002 S9 0.006 -0.003 -0.002 S10 -0.025** 0.010 0.009
S1: 15th of the month S6: Five days encompassing year-end S2: Settlement of Treasury 2 and 5-year notes S7: Day before a 1-day holiday S3: Last day of quarter S8: Day before a 3-day holiday S4: Three days encompassing quarter end S9: Day after a 1-day holiday S5: Last day of the year S10: Day after a 3-day holiday
**/* indicates that the coefficient value is significant at 99%/95% level of confidence
36
Table 6: Spread Equations for the Conditional Mean
6a. Business Days of the Maintenance Period
Day Brokered–
Euro Brokered–
Repo Eurodollar–
Repo 1 0.001 -0.016* 0.001 2 0.035** 0.011 -0.030** 3 0.020** 0.011* -0.007 4 0.019** 0.001 -0.020** 5 0.028** 0.013** -0.013** 6 0.042** 0.022** -0.025** 7 0.017** 0.008 -0.024** 8 0.010* 0.002 -0.026** 9 -0.024** -0.022** -0.012 10 0.025** 0.016** -0.007
Note: Maintenance periods begin on a Thursday and end on a Wednesday
6b. Other Calendar Days
Brokered–
Euro Brokered–
Repo Eurodollar–
Repo S1 0.000 -0.006 0.017 S2 0.000 0.025** 0.039** S3 -0.096** 0.010 0.046 S4 0.030** 0.008 0.016 S5 -0.010 0.013 0.119 S6 -0.088** -0.052* -0.001 S7 -0.028** -0.020 0.011 S8 -0.018 -0.029* 0.031** S9 -0.010 -0.019 0.005 S10 0.044** 0.047** 0.033*
S1: 15th of the month S6: Five days encompassing year-end S2: Settlement of Treasury 2 and 5-year notes S7: Day before a 1-day holiday S3: Last day of quarter S8: Day before a 3-day holiday S4: Three days encompassing quarter end S9: Day after a 1-day holiday S5: Last day of the year S10: Day after a 3-day holiday
**/* indicates that the coefficient value is significant at 99%/95% level of confidence
37
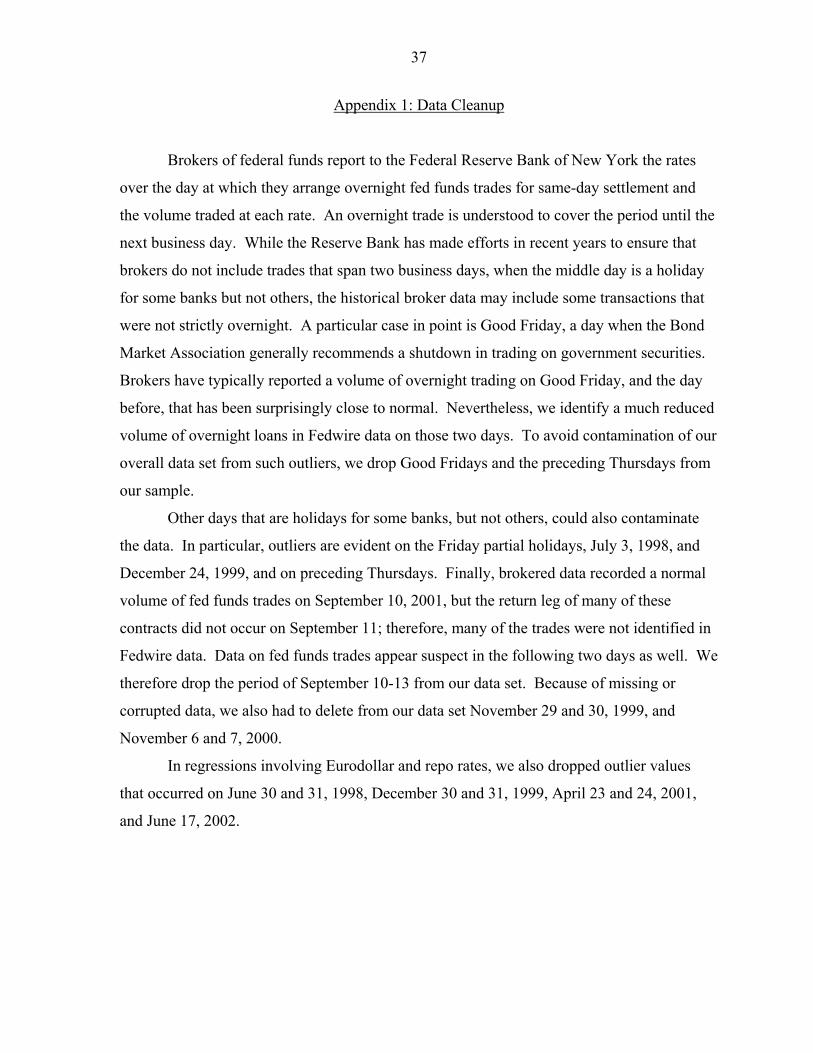
Appendix 1: Data Cleanup
Brokers of federal funds report to the Federal Reserve Bank of New York the rates
over the day at which they arrange overnight fed funds trades for same-day settlement and
the volume traded at each rate. An overnight trade is understood to cover the period until the
next business day. While the Reserve Bank has made efforts in recent years to ensure that
brokers do not include trades that span two business days, when the middle day is a holiday
for some banks but not others, the historical broker data may include some transactions that
were not strictly overnight. A particular case in point is Good Friday, a day when the Bond
Market Association generally recommends a shutdown in trading on government securities.
Brokers have typically reported a volume of overnight trading on Good Friday, and the day
before, that has been surprisingly close to normal. Nevertheless, we identify a much reduced
volume of overnight loans in Fedwire data on those two days. To avoid contamination of our
overall data set from such outliers, we drop Good Fridays and the preceding Thursdays from
our sample.
Other days that are holidays for some banks, but not others, could also contaminate
the data. In particular, outliers are evident on the Friday partial holidays, July 3, 1998, and
December 24, 1999, and on preceding Thursdays. Finally, brokered data recorded a normal
volume of fed funds trades on September 10, 2001, but the return leg of many of these
contracts did not occur on September 11; therefore, many of the trades were not identified in
Fedwire data. Data on fed funds trades appear suspect in the following two days as well. We
therefore drop the period of September 10-13 from our data set. Because of missing or
corrupted data, we also had to delete from our data set November 29 and 30, 1999, and
November 6 and 7, 2000.
In regressions involving Eurodollar and repo rates, we also dropped outlier values
that occurred on June 30 and 31, 1998, December 30 and 31, 1999, April 23 and 24, 2001,
and June 17, 2002.
38
Appendix 2: Regression Results for Conditional Means
(Equation 8)
Brokered Federal Funds Rate
** ** ** ** *1 1 2 1 2 1
* **2 1 2 1 1 2
**1
( / ) (0.74) (0.21) (0.42) (0.31) (0.05)
(0.01) (0.01) (0.06) [ (0.43) (0.13)
(0.51) (
Brok Brok Brok Bench Bench Eurot t t t t t t
Euro RP RP MP Brok Brokt t t t t
Bencht
E r I r r r r r
r r r D r r
r
− − − − − −
− − − − −
−
= + − − +
− + + + − −
+ − **2 1 2 1
10 10
21 1
0.04) (0.16) (0.03) (0.20)
(0.11) ]
Bench Euro Euro RPt t t t
RP MP m S mt m n
m n
r r r r
r Target D Dα β γ
− − − −
−= =
+ + −
+ + + +∑ ∑
Benchmark Equation
** **1 1 2 1 2 1
** ** **2 1 2 1 1 2
**1
( / ) (0.50) (0.10) (0.04) (0.06) (0.01)
(0.08) (0.04) (0.03) [ (0.24) (0.19)
(0.45) (0
Bench Brok Brok Bench Bench Eurot t t t t t t
Euro RP RP MP Brok Brokt t t t t
Bencht
E r I r r r r r
r r r D r r
r
− − − − − −
− − − − −
−
= + − − −
− + + + − −
+ − ** **2 1 2 1
10 10
21 1
.07) (0.02) (0.19) (0.17)
(0.02) ]
Bench Euro Euro RPt t t t
RP MP m S mt m n
m n
r r r r
r Target D Dα β γ
− − − −
−= =
+ + −
+ + + +∑ ∑
Eurodollar Equation
** **1 1 2 1 2 1
** * **2 1 2 1 1 2
1
( / ) (0.39) (0.11) (0.04) (0.07) (0.01)
(0.01) (0.12) (0.06) [ (0.09) (0.23)
(0.03) (0.19)
Euro Brok Brok Bench Bench Eurot t t t t t t
Euro RP RP MP Brok Brokt t t t tBench
t
E r I r r r r r
r r r D r r
r
− − − − − −
− − − − −
−
= + + − −
− + − + − −
− + ** **2 1 2 1
10 10
21 1
(0.28) (0.08) (0.24)
(0.04) ]
Bench Euro Euro RPt t t t
RP MP m S mt m n
m n
r r r r
r Target D Dα β γ
− − − −
−= =
+ + −
+ + + +∑ ∑
RP equation
** ** **1 1 2 3 1 2
* ** ** **3 1 2 3 1
** **2
( / ) (0.26) (0.17) (0.04) (0.11) (0.19)
(0.16) (0.10) (0.13) (0.04) (0.48)
(0.20) (0.11)
RP Brok Brok Brok Bench Bencht t t t t t t
Bench Euro Euro Euro RPt t t t t
RPt
E r I r r r r r
r r r r r
r
− − − − − −
− − − − −
−
= + + − −
− − − − +
+ + 3 1 1 2 3
1 2 3 1 2 3
1 2 3
[ (0.07) (0.09) (0.15)
(0.10) (0.02) (0.20) (0.02) (0.11) (0.02)
(0.10) (0.02) (0.13) ]
RP MP Brok Brok Brokt t t t
Bench Bench Bench Euro Euro Eurot t t t t t
RP RP RPt t t
r D r r r
r r r r r r
r r r Target Dα
− − − −
− − − − − −
− − −
+ − − +
+ − − − + +
− − + + +10 10
1 1
MP m S mm n
m nDβ γ
= =
+∑ ∑
**/* indicates that the coefficient value is significant at 99%/95% level of confidence
39
Appendix 3a: Regression Results for Spreads of
Benchmark Rate Over Indicated Interest Rate
Brokered Federal Funds Rate
** * ** *1 1 2 1 2 1
**2 1 2 1 1 2
**1
( / ) (0.24) (0.09) (0.36) (0.13) (0.03)
(0.05) (0.02) (0.02) [(0.20) (0.09)
(0.35) (0.0
Brok Brok Brok Bench Bench Eurot t t t t t t
Euro RP RP MP Brok Brokt t t t t
Bencht
E SP I r r r r r
r r r D r r
r
− − − − − −
− − − − −
−
= − − + + −
− + + + +
− − **2 1 2 1
10 10
21 1
7) (0.02) (0.10) (0.06)
(0.05) ]
Bench Euro Euro RPt t t t
RP MP m S mt m n
m n
r r r r
r Target D Dα β γ
− − − −
−= =
+ + +
− + + +∑ ∑
Eurodollar Rate
1 1 2 3 1 2*
3 1 2 3 1
2 3 1
( / ) (0.03) (0.05) (0.00) (0.03) (0.10)
(0.03) (0.09) (0.06) (0.00) (0.03)
(0.05) (0.02) [
Euro Brok Brok Brok Bench Bencht t t t t t t
Bench Euro Euro Euro RPt t t t t
RP RP MPt t
E SP I r r r r r
r r r r r
r r D
− − − − − −
− − − − −
− −
= − + + +
− − − + −
+ + + − ** ** *1 2 3
** * *1 2 3 1 2
3 1 2 3
(0.15) (0.18) (0.14)
(0.34) (0.25) (0.04) (0.18) (0.02)
(0.03) (0.06) (0.04) (0.08) ]
Brok Brok Brokt t t
Bench Bench Bench Euro Eurot t t t t
Euro RP RP RP MPt t t t m
m
r r r
r r r r r
r r r r Target Dα
− − −
− − − − −
− − − −
+ +
+ − − − −
− + + − + +10 10
1 1
m S mn
nDβ γ
= =
+∑ ∑
Repo Rate
** ** ** ** **1 1 2 1 2 1
** **2 1 2 1 1 2
**1
( / ) (0.14) (0.09) (0.15) (0.29) (0.08)
(0.03) (0.46) (0.24) [(0.03) (0.04)
(0.28) (
RP Brok Brok Bench Bench Eurot t t t t t t
Euro RP RP MP Brok Brokt t t t t
Bencht
E SP I r r r r r
r r r D r r
r
− − − − − −
− − − − −
−
= − + + +
+ − − + −
− − **2 1 2 1
10 10
21 1
0.04) (0.32) (0.11) (0.12)
(0.03) ]
Bench Euro Euro RPt t t t
RP MP m S mt m n
m n
r r r r
r Target D Dα β γ
− − − −
−= =
+ + −
+ + + +∑ ∑
40
Appendix 3b: Other Spreads Brokered Federal Funds less Eurodollar
** ** *1 1 2 1 2 1
* **2 1 2 1 1 2
**1
( / ) (0.33) (0.05) (0.31) (0.13) (0.13)
(0.02) (0.09) (0.11) [ (0.37)** (0.17)
(0.49)
Brok Euro Brok Brok Bench Bench Eurot t t t t t t
Euro RP RP MP Brok Brokt t t t t
Bent
E SP I r r r r r
r r r D r r
r
−− − − − − −
− − − − −
−
= + − − −
+ − + + − +
+ 2 1 2 1
10 10
21 1
(0.27) (0.02) (0.17) (0.08)
(0.07) ]
ch Bench Euro Euro RPt t t t
RP MP m S mt m n
m n
r r r r
r Target D Dα β γ
− − − −
−= =
− + − +
+ + + +∑ ∑
Brokered Federal Funds less Repo
** ** *1 1 2 1 2 1
** ** ** **2 1 2 1 1 2
**1
( / ) (0.33) (0.12) (0.12) (0.04) (0.09)
(0.13) (0.56) (0.18) [ (0.33) (0.16)
(0.44)
Brok RP Brok Brok Bench Bench Eurot t t t t t t
Euro RP RP MP Brok Brokt t t t t
Bet
E SP I r r r r r
r r r D r r
r
−− − − − − −
− − − − −
−
= + − − +
+ − − + − −
+ *2 1 2 1
10 10
21 1
(0.03) (0.22) (0.05) (0.18)
(0.09) ]
nch Bench Euro Euro RPt t t t
RP MP m S mt m n
m n
r r r r
r Target D Dα β γ
− − − −
−= =
− + − −
+ + + +∑ ∑
Eurodollar less Repo
* * *1 1 2 3 1 2
** ** **3 1 2 3 1
**2
( / ) (0.02) (0.05) (0.03) (0.05) (0.08)
(0.25) (0.30) (0.02) (0.03) (0.37)
(0.11) (0.22)
Euro RP Brok Brok Brok Bench Bencht t t t t t t
Bench Euro Euro Euro RPt t t t t
RPt
E SP I r r r r r
r r r r r
r
−− − − − − −
− − − − −
−
= − − + +
+ + + − −
− − **3 1 1 2 3
*1 2 3 1 2
3 1 2 3
[(0.11) (0.01) (0.15)
(0.25) (0.20) (0.07) (0.14) (0.05)
(0.08) (0.09) (0.17) (0.03) ]
RP MP Brok Brok Brokt t t t
Bench Bench Bench Euro Eurot t t t t
Euro RP RP RPt t t t
r D r r r
r r r r r
r r r r Targetα
− − − −
− − − − −
− − − −
+ − −
− + + + +
+ − − + +10 10
1 1
MP m S mm n
m nD Dβ γ
= =
+ +∑ ∑ **/* indicates that the coefficient value is significant at 99%/95% level of confidence
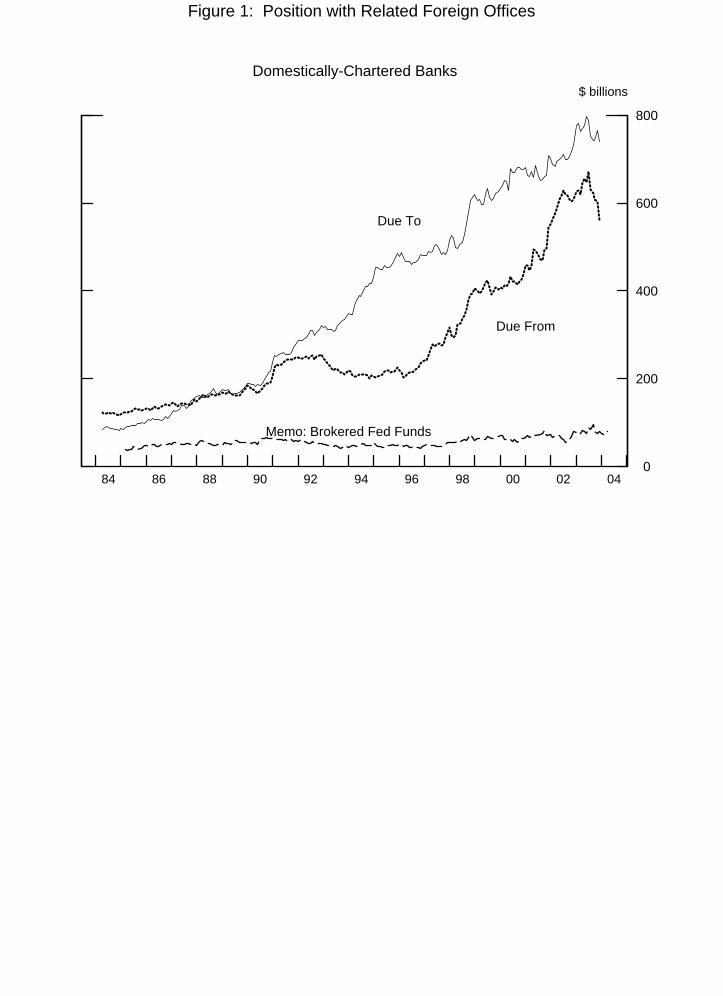
Figure 1: Position with Related Foreign Offices
Domestically-Chartered Banks
84 86 88 90 92 94 96 98 00 02 04 0
200
400
600
800
$ billions
Due To
Due From
Memo: Brokered Fed Funds
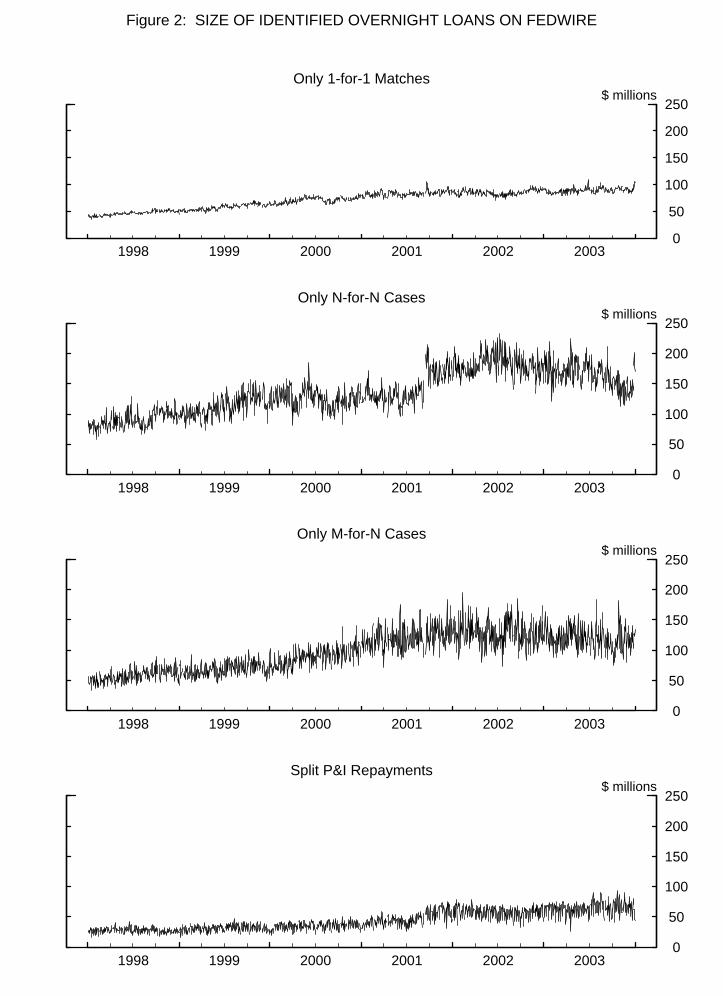
Figure 2: SIZE OF IDENTIFIED OVERNIGHT LOANS ON FEDWIRE
Only 1-for-1 Matches
1998 1999 2000 2001 2002 2003 0
50
100
150
200
250$ millions
Only N-for-N Cases
1998 1999 2000 2001 2002 2003 0
50
100
150
200
250$ millions
Only M-for-N Cases
1998 1999 2000 2001 2002 2003 0
50
100
150
200
250$ millions
Split P&I Repayments
1998 1999 2000 2001 2002 2003 0
50
100
150
200
250$ millions
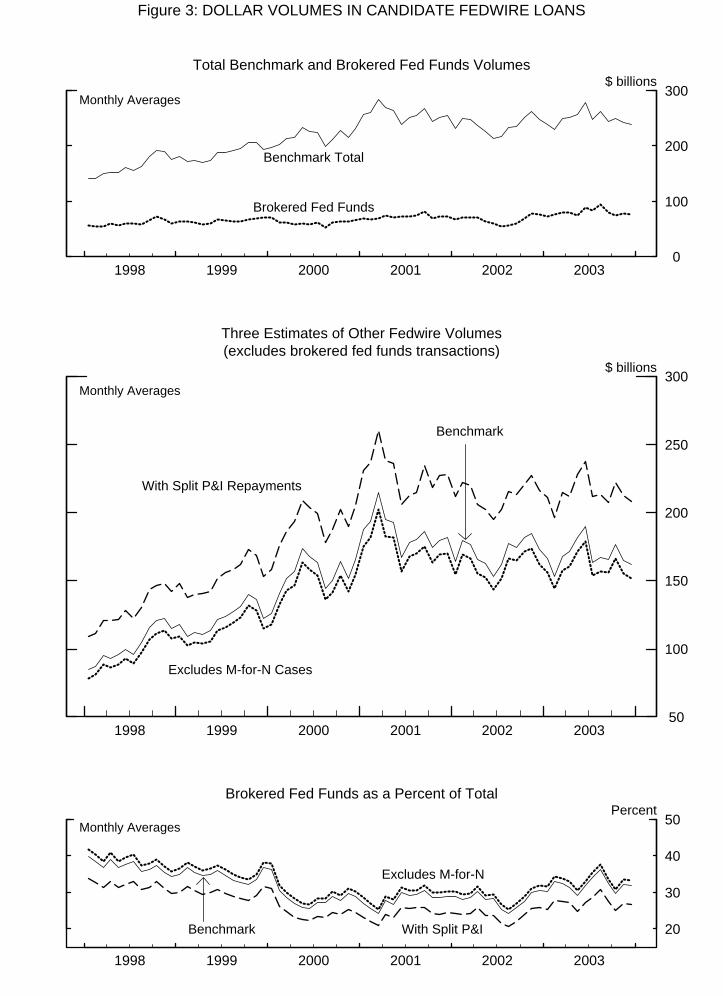
Figure 3: DOLLAR VOLUMES IN CANDIDATE FEDWIRE LOANS
Total Benchmark and Brokered Fed Funds Volumes
1998 1999 2000 2001 2002 2003 0
100
200
300$ billions
Monthly Averages
Benchmark Total
Brokered Fed Funds
Three Estimates of Other Fedwire Volumes(excludes brokered fed funds transactions)
1998 1999 2000 2001 2002 2003 50
100
150
200
250
300$ billions
Monthly Averages
With Split P&I Repayments
Benchmark
Excludes M-for-N Cases
Brokered Fed Funds as a Percent of Total
1998 1999 2000 2001 2002 2003
20
30
40
50Percent
Monthly Averages
With Split P&IBenchmark
Excludes M-for-N
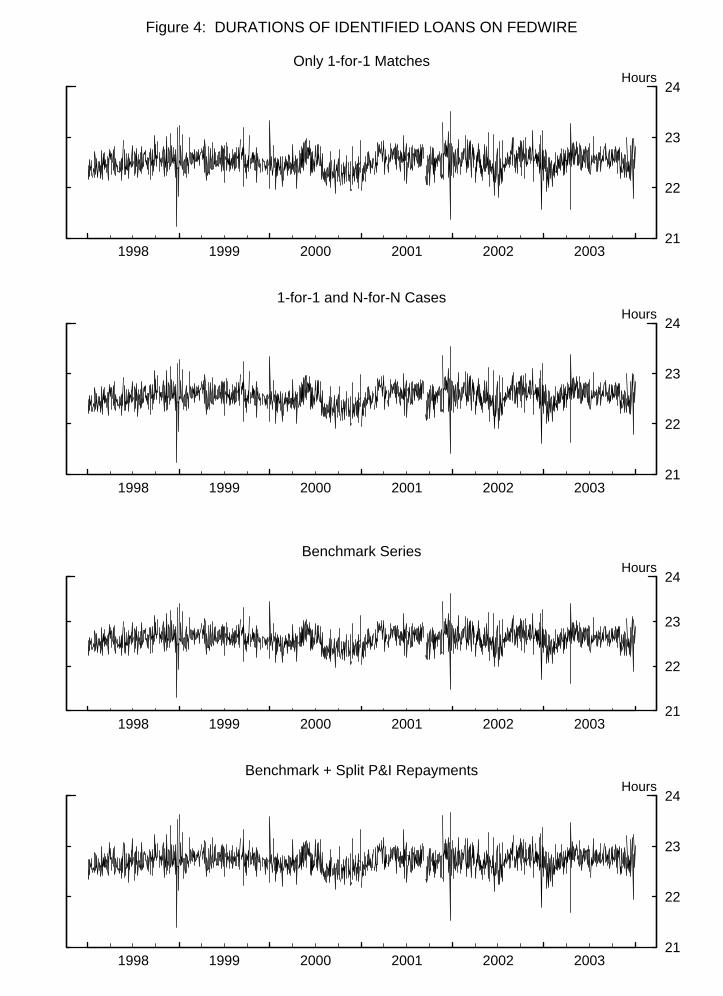
Figure 4: DURATIONS OF IDENTIFIED LOANS ON FEDWIRE
Only 1-for-1 Matches
1998 1999 2000 2001 2002 200321
22
23
24Hours
1-for-1 and N-for-N Cases
1998 1999 2000 2001 2002 200321
22
23
24Hours
Benchmark Series
1998 1999 2000 2001 2002 200321
22
23
24Hours
Benchmark + Split P&I Repayments
1998 1999 2000 2001 2002 200321
22
23
24Hours
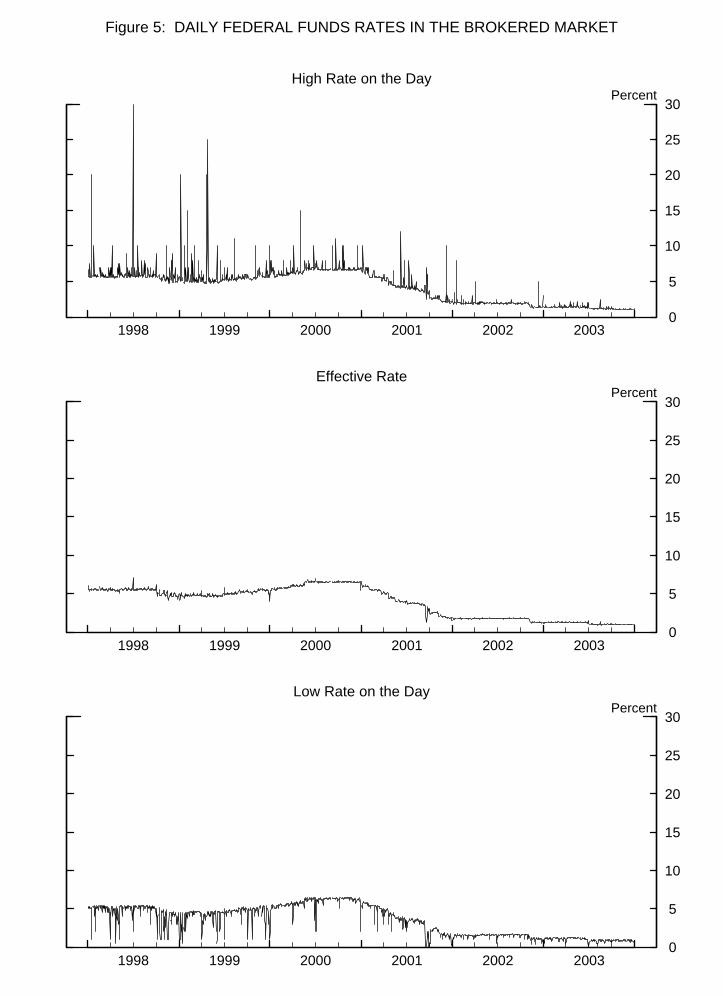
Figure 5: DAILY FEDERAL FUNDS RATES IN THE BROKERED MARKET
High Rate on the Day
1998 1999 2000 2001 2002 2003 0
5
10
15
20
25
30Percent
Effective Rate
1998 1999 2000 2001 2002 2003 0
5
10
15
20
25
30Percent
Low Rate on the Day
1998 1999 2000 2001 2002 2003 0
5
10
15
20
25
30Percent
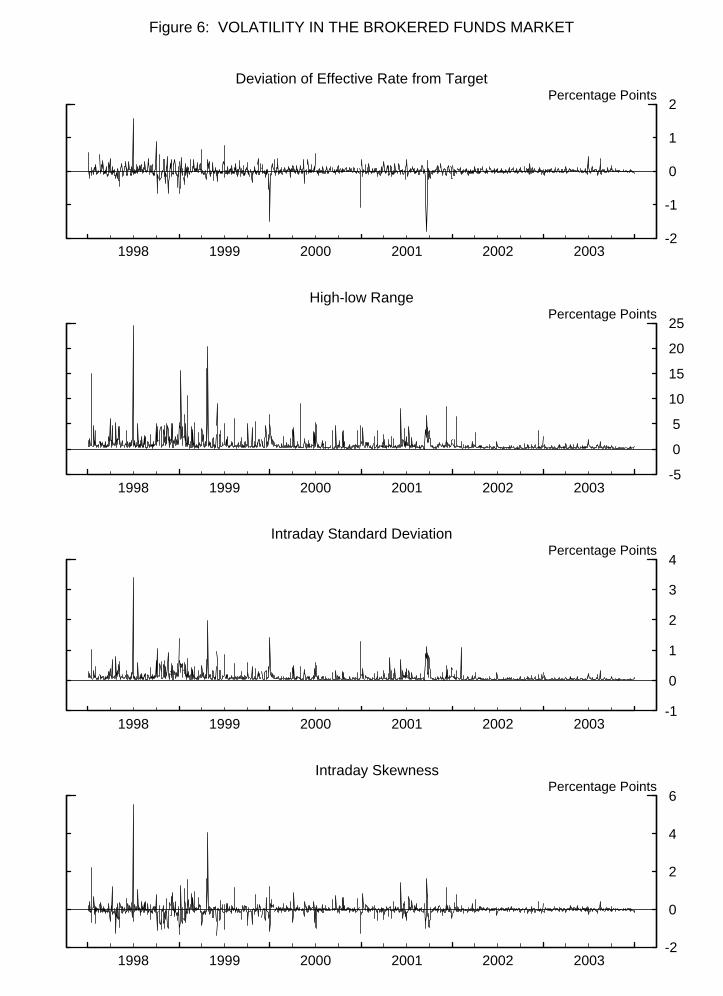
Figure 6: VOLATILITY IN THE BROKERED FUNDS MARKET
Deviation of Effective Rate from Target
1998 1999 2000 2001 2002 2003-2
-1
0
1
2Percentage Points
High-low Range
1998 1999 2000 2001 2002 2003 -5
0
5
10
15
20
25Percentage Points
Intraday Standard Deviation
1998 1999 2000 2001 2002 2003-1
0
1
2
3
4Percentage Points
Intraday Skewness
1998 1999 2000 2001 2002 2003-2
0
2
4
6Percentage Points
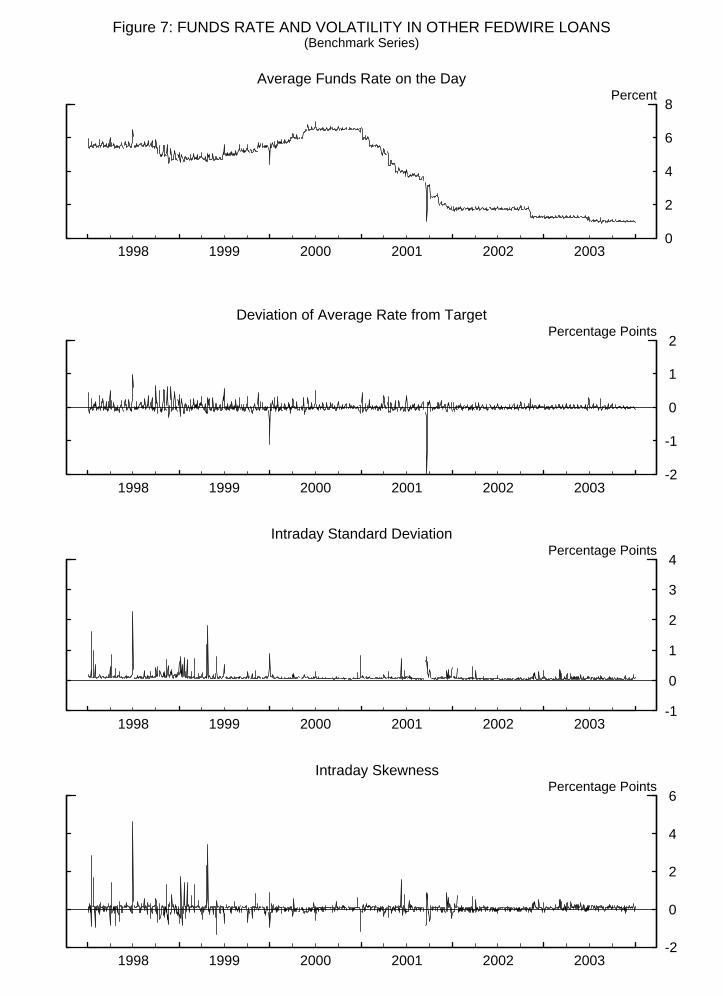
Figure 7: FUNDS RATE AND VOLATILITY IN OTHER FEDWIRE LOANS(Benchmark Series)
Average Funds Rate on the Day
1998 1999 2000 2001 2002 20030
2
4
6
8Percent
Deviation of Average Rate from Target
1998 1999 2000 2001 2002 2003-2
-1
0
1
2Percentage Points
Intraday Standard Deviation
1998 1999 2000 2001 2002 2003-1
0
1
2
3
4Percentage Points
Intraday Skewness
1998 1999 2000 2001 2002 2003-2
0
2
4
6Percentage Points

Figure 8
-10
-8
-6
-4
-2
0
2
4
-10
-8
-6
-4
-2
0
2
4
BrokeredBenchmarkEurodollarRP
1 2 3 4 5 6 7 8 9 10
**
*
*
*
*
*
* *
*
*
*
*
*
*
*
**
*
*
*
** *
*
*
* *
*
**
Note: Maintenance periods begin on a Thursday and end on a Wednesday.
Business Days of the Maintenance Period
Maximum Likelihood Estimates of the Conditional Mean
Basis Points
-70
-60
-50
-40
-30
-20
-10
0
10
20
-70
-60
-50
-40
-30
-20
-10
0
10
20
BrokeredBenchmarkEurodollarRP
S1 S2 S3 S4 S5 S6 S7 S8 S9 S10
* * * ** * *
*
**
* * * *
*
**
* ** * *
*
* * * *
**
**
Other Calendar DaysBasis Points
S1: 15th of the month, S2: Settlement of Treasury 2 and 5-year notes,S3: Last day of quarter, S4: Three days encompassing last day of quarter,S5: Last day of the year,
S6: Five days encompassing last day of year,S7: Day before a one-day holiday,S8: Day before a three-day holiday,S9: Day after a one-day holiday,S10: Day after a three-day holiday.
* Indicates significance at the 95 percent level of confidence or better.
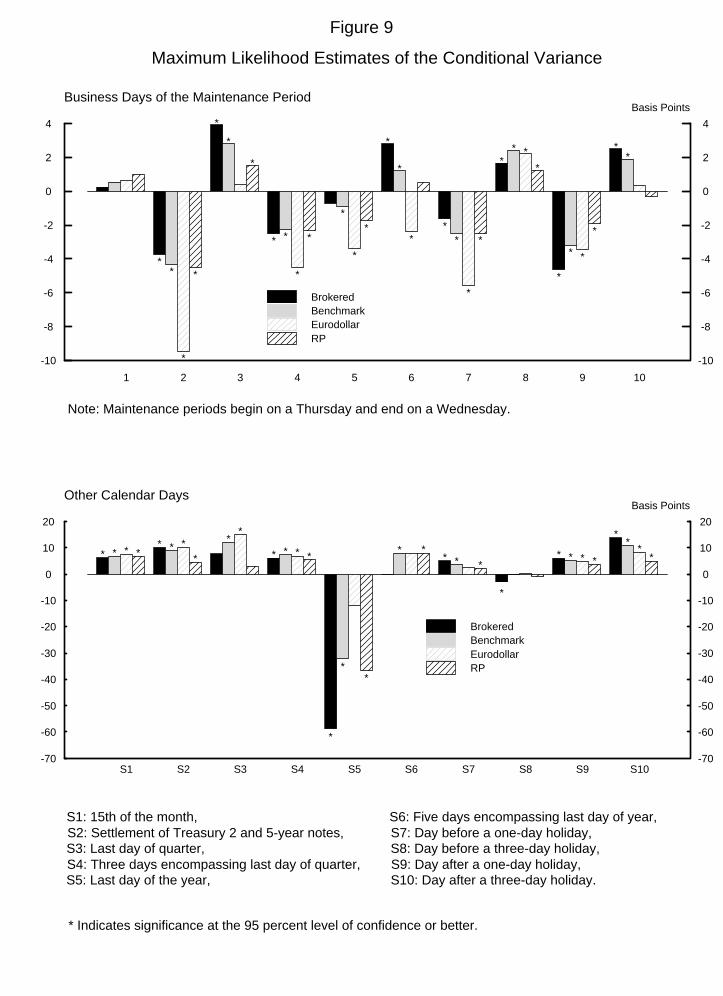
Figure 9
-10
-8
-6
-4
-2
0
2
4
-10
-8
-6
-4
-2
0
2
4
BrokeredBenchmarkEurodollarRP
1 2 3 4 5 6 7 8 9 10
**
*
*
*
*
*
* *
*
*
*
*
*
*
*
**
*
*
*
** *
*
*
* *
*
**
Note: Maintenance periods begin on a Thursday and end on a Wednesday.
Business Days of the Maintenance Period
Maximum Likelihood Estimates of the Conditional Variance
Basis Points
-70
-60
-50
-40
-30
-20
-10
0
10
20
-70
-60
-50
-40
-30
-20
-10
0
10
20
BrokeredBenchmarkEurodollarRP
S1 S2 S3 S4 S5 S6 S7 S8 S9 S10
* * * ** * *
*
**
* * * *
*
**
* ** * *
*
* * * *
**
**
Other Calendar DaysBasis Points
S1: 15th of the month, S2: Settlement of Treasury 2 and 5-year notes,S3: Last day of quarter, S4: Three days encompassing last day of quarter,S5: Last day of the year,
S6: Five days encompassing last day of year,S7: Day before a one-day holiday,S8: Day before a three-day holiday,S9: Day after a one-day holiday,S10: Day after a three-day holiday.
* Indicates significance at the 95 percent level of confidence or better.