Embed Size (px)
Citation preview

WORKING PAPER NO. 2014-4
OVERCOMING THE FISCAL TRILEMMA WITH TWO PROGRESSIVE
CONSUMPTION TAX SUPPLEMENTS
By
Laurence Seidman
WORKING PAPER SERIES

The views expressed in the Working Paper Series are those of the author(s) and do not necessarily reflect those of the Department of Economics or of the University of Delaware. Working Papers have not undergone any formal review and approval and are circulated for discussion purposes only and should not be quoted without permission. Your comments and suggestions are welcome and should be directed to the corresponding author. Copyright belongs to the author(s).

OVERCOMING THE FISCAL TRILEMMA
WITH TWO PROGRESSIVE CONSUMPTION TAX SUPPLEMENTS
Laurence Seidman
Chaplin Tyler Professor of Economics
University of Delaware
Published in Public Finance Review

ABSTRACT
This article recommends a tax reform strategy that can accomplish three objectives:
(1) raise sufficient revenue to deal with long run budget challenges; (2) promote long run
economic growth; (3) provide progressivity in the face of increasing inequality. The strategy for
overcoming this fiscal trilemma is to retain (with modification) the personal income tax, the
corporate income tax, and the payroll tax, and add two progressive consumption tax
supplements: a value added tax made progressive by a refundable VAT credit on the 1040, and a
progressive consumption surtax on the 1040.
Key Words: Tax reform, Progressive consumption tax supplements
JEL Codes: H20, H24, H25

1
1. INTRODUCTION
Is it possible to adopt a tax reform strategy that will simultaneously accomplish three
objectives: (1) raise sufficient revenue to deal with long run budget challenges; (2) promote long
run economic growth; (3) provide progressivity in the face of increasing inequality? This article
recommends the following strategy for overcoming this fiscal trilemma. First, retain (with
modification) the personal income tax, the corporate income tax, and the payroll tax; second, add
two progressive consumption tax supplements: (1) a value added tax made progressive by a
refundable VAT credit on the 1040; and (2) a progressive consumption surtax on the 1040.
The phase in of the two supplements (over several years) would begin as soon as the
economy achieves a full recovery with the unemployment rate below 6 percent. It has been
estimated (Gale and Harris 2013) that a 10 percent VAT that is made progressive by tax rebates
to low and middle-income households (as described below) would raise net revenue (gross
revenue minus tax rebates) equal to 2 percent of GDP. It has been estimated (Seidman and
Lewis 2009) that a progressive consumption surtax on the 1040 with a $1 million threshold and
graduated rates rising from 10 to 40 percent would raise revenue equal to 1 percent of GDP.
Together these two progressive consumption tax supplements would raise revenue by 3 percent
of GDP. If federal revenue would have been 20 percent of GDP without these two supplements
(once the economy recovers fully), with these two supplements federal revenue would instead be
23 percent of GDP. Thus, the two supplements proposed here would generate a 15 percent
increase in federal revenue.
The first progressive consumption tax supplement proposed in this paper is a standard
credit-invoice value-added tax (VAT) that is made progressive by a refundable VAT credit on

2
the 1040 personal income tax return (Seidman 2004, 2006). The VAT would be a supplement to,
not replacement for, the personal and corporate income taxes and payroll tax.
The standard credit-invoice VAT has had decades of proven practical experience in other
economically advanced countries. The VAT is a key component of virtually every economically
advanced country except the United States. In the preface to their book, The Modern VAT
(2001), International Monetary Fund economists Ebril, Keen, Bodin, and Summers wrote (p xi)
that “the rapid and seemingly irresistible rise of the value added tax (VAT) is probably the most
important tax development of the latter twentieth century, and certainly the most
breathtaking…Today it is the key source of government revenue in over 120 countries.”
A sympathetic treatment of the case for the U.S. enacting a VAT as an addition to its
arsenal of taxes has been given by many economists including McLure (1987), Graetz (2002,
2008), Seidman (2004), Hines (2007), Burman (2009), Rogers (2010a, 2010b), Gale and Harris
(2011, 2013), Sullivan (2011), and Bartlett (2011). Sympathetic treatments of the case for
implementing a VAT in any country have been given by Tait (1988), Ebril, Keen, Bodin, and
Summers (2001), and Cnossen (2011).
One objection to a VAT has been that it is regressive. In this paper I will explain how a
refundable VAT credit on the 1040 personal income tax return would work and how it would
make a standard credit-invoice VAT progressive.
Most economists have concluded that if a consumption tax is introduced as a supplement
to current taxes in order to raise revenue, aggregate consumption will be lower, aggregate saving
higher, and capital accumulation greater, than if the revenue were raised by increasing income
tax rates (for any consumption tax, Lewis and Seidman 1998, 1999, Seidman and Lewis 1998,
2003; for the VAT, Alm and El-Ganainy 2012).

3
The second progressive consumption tax supplement proposed in this paper is a
progressive consumption surtax on the 1040 income tax return that is limited to households with
very high income and very high consumption (Andrews 1980, Seidman 2006, Seidman and
Lewis 2009). Only households that exceed the very high income threshold (for example, $1
million in 2013) would be required to compute their cash-flow consumption as described in the
U.S. Treasury’s Blueprints for Basic Tax Reform (1977) and elsewhere (for example, Seidman
1997), and would be taxed only on consumption in excess of a very high threshold (for example,
$1 million in 2013).
In sum, this paper proposes retaining (with modification) the personal income tax, the
corporate income tax, and the payroll tax, and adding two progressive consumption tax
supplements: a value added tax made progressive by a refundable VAT credit on the 1040, and a
progressive consumption surtax on the 1040.
These two progressive tax supplements should be enacted as soon as possible, but they
should be gradually phased in, and the phase in should not begin until the unemployment rate has
fallen below 6 percent. This 6 percent unemployment rate trigger should be part of the
legislation enacting the VAT and the consumption surtax on the 1040. An example of a gradual
phase in of the VAT might be a 2 percent VAT tax rate in year 1, 4 percent in year 2, and so on
until it reaches 10 percent in year 5. A gradual phase in would prevent an abrupt increase in
business costs and prices. An example of a gradual phase in of the consumption surtax on the
1040 might be graduated rates ranging from 2 percent to 8 percent in year 1, 4 percent to 16
percent in year 2, and so on until the range reaches 10 percent to 40 percent in year 5.

4
2. THE IMPACT ON THE PROGRESSIVITY OF THE FEDERAL TAX SYSTEM
Many citizens have strong preferences about whether they want the progressivity of the
federal tax system reduced or maintained. In light of the rising inequality of income over the
past few decades, my strong preference is to maintain progressivity, not reduce it. By contrast, a
proposal to replace the current personal and corporate income taxes with a retail sales tax, or a
value-added tax, or a flat tax (Hall and Rabushka 2007), or an X tax (Bradford 2005, Carroll and
Viard 2012), would reduce the progressivity of the federal tax system. Seidman (1997, chapter
3) presents the main numerical results of two studies by the Office of Tax Analysis of the U.S.
Treasury demonstrating and measuring the reduction in progressivity due to replacement.
The reasons for the reduction in progressivity from replacement are easy to understand.
Replacing the current personal and corporate income taxes with either a retail sales tax or a VAT
would reduce the progressivity of the federal tax system because each has a single rate that
would be lower than the current personal income tax rate on high-income households.
Replacement with either a flat tax or an X tax would reduce the progressivity of the federal tax
system because each taxes households on their labor income but not their investment income; the
exemption of investment income reduces progressivity at the top of the income distribution.
Moreover, many citizens would regard it as unfair to have the U.S. federal household tax apply
to labor income but not investment income.
Replacing personal and corporate income taxes with any of the four taxes—retail sales,
value added, flat tax, or X tax—would promote one of the trilemma objectives-- economic
growth-- by discouraging consumption and encouraging saving and investment. But advocates
of any of these four replacement taxes often (not always) oppose the other two trilemma

5
objectives: raising federal revenue and maintaining the progressivity of the federal tax system.
Those who oppose raising federal tax revenue believe federal deficits should be eliminated by
cutting federal domestic spending. Those who support a reduction in the progressivity of the
federal tax system believe current progressivity is unfair and harmful to the economy (Holtz-
Eakin 2011).
3. POLITICAL FEASIBILITY: A CONSUMPTION TAX VS A LABOR INCOME TAX
Many economists (Bradford 2005, McLure and Zodrow 2007, and Carroll and Viard
2012) call a labor income tax “a consumption-based tax” or simply “a consumption tax.” These
economists correctly point out that a labor income tax or a consumption tax, in contrast to a
capital income tax, does not distort the trade-off between present and future consumption—in
this sense they are equivalent, and to emphasize this equivalence it is useful and warranted to call
them by the same name—“consumption-based taxes.”
But a labor income tax, such as the household component of the flat tax or the X tax, does
not look at all like a consumption tax to most citizens. People easily grasp that a sales tax or a
VAT (when the VAT appears on the retail sales receipt as it usually does) is a consumption tax
and that people bear a burden that varies directly with their consumption spending. But just try
explaining to a non-economist that the flat tax or X tax is really a consumption tax and notice the
reaction. By contrast, people would easily grasp that the two proposals in this paper, a VAT and
a consumption surtax on the 1040, are really consumption taxes that impose a burden that varies
directly with a person’s consumption spending.

6
People sense the following important difference that many economists seem to ignore.
Consider the “lazy heir” who inherits a fortune, spends lavishly every year on consumption, and
never works. The ordinary person grasps that the lazy heir would properly bear a heavy burden
under a sales tax, or VAT, or consumption surtax on the 1040, but would unfairly pay no
household tax under the flat tax or X tax.
Of course, any new tax (or increase in an old tax) would be resisted by many. But in my
judgment the resistance would be less to a new tax that looks like a consumption tax than to a
new tax that looks like a labor income tax.
4. THE CASE FOR ADDITIONAL REVENUE AFTER FULL RECOVERY
After full recovery from the deep 1982 recession—a recession that had been intentionally
generated by the Federal Reserve to bring down inflation-- large federal deficits as a percent of
GDP persisted and consequently federal debt as a percent of GDP continued to rise. In the late
1980s and early 1990s, spending was about 22 percent of GDP and revenues about 18 percent of
GDP, so deficits were about 4 percent of GDP and from 1985 to 1995 federal debt (held by the
public) as a percent of GDP rose from 36 percent to 49 percent of GDP (all numbers in this
section are from U.S. Congressional Budget Office 2012 Table E-1). From the mid-1980s to the
mid-1990s, many rightly argued that reducing deficits and debt as a percent of GDP should be a
top policy priority.
During the 1990s, several Congresses and Presidents confounded cynics by taking
advantage of a strong economy (except for the 1990-1992 recession) to gradually reduce deficits,
achieve a balanced budget (with spending and taxes both near 20 percent of GDP), and then even

7
achieve small surpluses in the late 1990s; and to reduce debt as a percent of GDP from 49
percent in 1995 to 35 percent in 2000. The recession of 2001 generated deficits again, but in
2007, just prior to the plunge of the economy into the Great Recession of 2008, the federal
deficit was only 1 percent of GDP (spending 20 percent, revenue 19 percent) and federal debt as
a percent of GDP was just 36 percent of GDP. Contrary to what many citizens believe
(according to polls), in the decade prior to the Great Recession of 2008, federal spending,
deficits, and debt were well under control.
The steep plunge into the Great Recession of 2008 caused revenue as a percent of GDP in
2009 to fall 4 percentage points to 15 percent, and federal spending to rise 5 percentage points to
25 percent, so that the federal deficit jumped 9 percentage points to 10 percent of GDP in 2009.
This rise in the federal deficit in response to the Great Recession helped prevent a great
depression: if taxes had not fallen and federal spending had not risen, the fall in aggregate
demand for goods and services would have been much greater and the unemployment rate,
instead of rising to 10 percent, might have risen to at least 12 percent (Blinder and Zandi, 2010).
Thus, given the unwelcome Great Recession, the jump in the deficit due to the recession itself
and the fiscal stimulus to combat it should be welcomed, not regretted. The Great Recession
deficits and debt are not a valid reason to enact any tax increases or spending cuts.
Beyond the Great Recession, however, looming on the horizon is not only the retirement
of the baby boomers but, more significantly, the increasing longevity of retirees and the rising
cost of medical care for the entire population including the elderly. The Congressional Budget
Office projects that if the trends in longevity and medical costs continue, combined federal
expenditure on Medicare, Medicaid, and Social Security will double from 8 percent of GDP in
2000 to 16 percent of GDP in 2040. Even if half of this projected rise can be averted, there will

8
be a need for additional revenue equal to 4 percent of GDP to avoid higher deficits over the next
three decades. These looming future deficits, not the Great Recession deficits, are a valid reason
to immediately enact a future schedule of additional revenue and slower spending growth that
would begin to be phased in gradually as soon as the unemployment rate falls below 6 percent.
Thereafter, Congress should be pressured to adhere to a normal unemployment balanced budget
rule (NUBAR)—to keep the budget balanced whenever the economy is running at a normal
unemployment rate (Seidman 2010).
5. THE CASE FOR MULTIPLE TAXES WITH MODERATE RATES
With additional revenue needed after full recovery from the Great Recession, two
questions arise. First, would it be better to raise the revenue using the current arsenal of taxes or
better to introduce one or two new taxes to raise the revenue? Second, politically, which
approach is likely to be more feasible? Consider each question in turn. The best way to raise
additional revenue is not obvious because there is a trade-off.
On the one hand, introduction of a new tax entails new administrative and compliance
costs that are avoided by simply raising rates under old taxes. A value-added tax would impose a
new compliance burden on virtually each firm in the U.S. economy and a new administrative
burden on the IRS. These burdens would be substantial in the initial year the VAT is
implemented but would become smaller once firms have learned how to comply and the IRS has
learned how to implement and audit the VAT. The progressive consumption surtax on the 1040
would impose a much smaller compliance burden and administrative burden than the VAT
because it would apply to only a small number of households. Each very affluent household

9
with income above the very high threshold (for example, $1 million in 2013), however, would
incur a significant compliance burden. These compliance and administrative burdens from the
VAT and the progressive consumption surtax would be avoided if tax rates on current taxes were
raised instead of introducing the new taxes.
On the other hand, public finance textbooks teach that the efficiency cost of a tax
generally rises with the square of the tax rate, so there will often be a smaller efficiency cost if a
given total revenue is raised from a larger set of taxes that each have moderate rates, rather than
from a smaller set of taxes that each have high rates (Seidman 2009). Intuitively, less
deadweight loss is likely to be imposed on the economy by spreading the burden among a larger
set of taxes rather than leaning heavily on a smaller set of taxes. Also, it may often be judged
fairer to spread the burden among a larger set of taxes because any one tax may especially
burden a particular population or behavioral group.
Politically, how much can tax revenue be raised with the current arsenal of taxes? In
2012 Congress let the Bush tax cuts expire for the affluent so starting in 2013 the top tax rate on
labor and interest income is 39.6 percent instead of 35 percent and the top rate on capital gains
and dividend income is 20 percent instead of 15 percent; but Congress preserved the Bush
income tax cuts for the non-affluent. It is politically conceivable that the payroll tax ceiling
might be raised, or a tax levied on payroll above the ceiling, but it may prove difficult to raise
payroll tax rates very much for either Social Security or Medicare—the combined rate is
currently 15.3 percent. On the other hand, the introduction of any new tax is always politically
difficult.
My recommendation is to increase the arsenal of taxes and keep rates moderate under
each tax in the arsenal. I recommend retaining (with modification) the current arsenal of federal

10
taxes and enacting two progressive consumption tax supplements. The enactment of these two
new taxes as supplements, not replacements, should be able to raise sufficient revenue, preserve
progressivity, and promote economic growth through saving and investment, thereby
overcoming the fiscal trilemma.
6. A PROGRESSIVE VAT
Regressivity is a central concern about a VAT. Most economists believe a 10 percent
VAT is equivalent to 10 percent retail sales tax (RST) with the tax collected at each stage of
production rather than delayed to the final retail stage. With either 10 percent tax, the price
charged to the consumer should be the same. With either tax, it is assumed that demand is much
less elastic than supply so that, according to standard textbook tax incidence analysis, demanders
(consumers) bear most of the burden. Because low-income households generally consume a
larger share of their income than high-income households, the tax burden from a RST or a VAT
is a higher percentage of the income of a low-income household than of a high-income
household—hence with respect to income each tax is “regressive.”
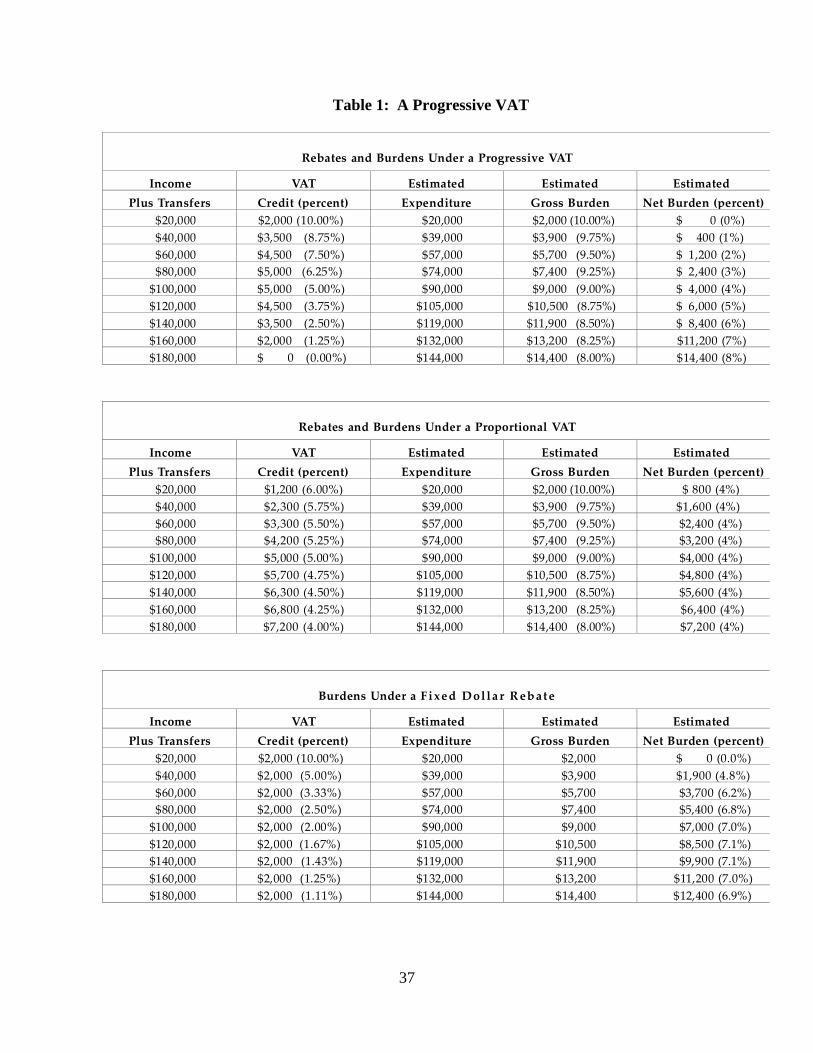
The example in the top block of Table 1, “Rebates and Burdens under a Progressive
VAT,” shows how a refundable VAT credit on the 1040 personal income tax return could make
a VAT progressive. The example uses a 10 percent VAT. The numbers are solely for
illustration. Careful empirical study by Congressional Budget Office technicians should be
undertaken to provide guidance for Congress in setting the VAT’s rebate (1040 refundable VAT
credit) schedule. In particular, it might be desirable to vary the size of the VAT credit according
to the number of members of the household as well as household income. That variation is not
11
shown in the table. Also, the VAT credit numbers should be automatically adjusted for inflation
each year.
A household’s VAT credit would be based on its income plus transfers (IPT). Its income
would equal its total income as computed and reported on the first page of its 1040 personal
income tax return (line 22 on the 2011 1040 return). Its transfers would equal its earned income
tax credit reported on line 64 of its 1040 return plus cash welfare payments received from all
levels government. It would be the responsibility of households to report and document these
transfers received (just as households must, for example, report and document charitable
contributions in order to take the charitable deduction). More attention should be given to what
items should be included in the transfers component of IPT. Note that total income reported on
line 22 already includes unemployment compensation (reported on line 19), social security
benefits (reported on line 20), and miscellaneous items of other income (reported on line 21).
As shown in the first row of the top block of Table 1, under the 10 percent VAT a
household with $20,000 of IPT--income plus transfers—would file its annual income tax return
(the 1040) and then receive a $2,000 rebate check from the U.S. Treasury (10 percent of its
IPT)—its 1040 VAT credit would be $2,000. Thus, a household’s 1040 VAT credit would be
based on its IPT. It must be emphasized that a household’s 1040 VAT credit would not vary
with its own actual consumption expenditure. Hence, the VAT credit would not affect the
household’s incentive to spend versus save. Nor would it require the household to compute and
report its actual consumption.
Suppose the typical $20,000 IPT household is estimated by CBO technicians to have
consumption expenditure of $20,000. Then its estimated VAT gross burden is $2,000 (10
percent of $20,000). Its VAT credit of $2,000 (10 percent of its IPT) would leave it with an
12
estimated VAT net burden of $0. Recall that a household’s VAT credit is not based on its own
actual expenditure, which is unknown, but on its IPT. Thus, the table shows the actual VAT
credit at each level of income plus transfers (IPT) but only the estimated expenditure and
estimated gross and net burdens—the expenditure and burdens borne by a typical household with
that particular IPT. Empirical study by Congressional Budget Office (CBO) technicians would
be needed to guide the selection of the numbers in the expenditure column and therefore in the
gross and net burden columns. Here, without empirical study, expenditure numbers are provided
for illustration. Note that when IPT increases from $20,000 to $40,000, expenditure is estimated
to increase $19,000; when IPT increases from $40,000 to $60,000, expenditure is estimated to
increase $18,000; and so on.
As shown in the second row of the top block of Table 1, under the 10 percent VAT a
household with $40,000 of IPT would receive a $3,500 check from the U.S. Treasury (8.75
percent of its IPT). Suppose the typical $40,000 IPT household is estimated to have a
consumption expenditure of $39,000. Then its estimated VAT gross burden is $3,900 (10
percent of $39,000). Its VAT credit of $3,500 would leave it with an estimated VAT net burden
of $400, 1 percent of its IPT of $40,000. The rest of the top block of the table shows how the
VAT credit would gradually phase down to $0 as household IPT rises to $180,000; the VAT
credit as a percent of a household’s IPT would decline smoothly from 10 percent to 0 percent.
As a consequence of this VAT credit schedule, the estimated VAT net burden would rise
smoothly from 0 percent of IPT when IPT is $20,000 to 8 percent when IPT is $180,000; hence,
over this range, which includes most households, the VAT would be progressive.
Of course, the VAT credit schedule shown in the top block of Table 1 achieves the
smooth rise shown only if the expenditure column estimated by CBO technicians is accurate.
13
Thus, careful empirical study needs to be devoted to obtaining a reasonably accurate estimated
expenditure column as a function of IPT. Even if the estimated expenditure column is
reasonably accurate for the average household with an IPT of $Y, it will not be accurate for any
particular household with an IPT of $Y. Hence, the estimated net burden percent column would
show the net burden for the average household with an IPT of $Y, not for every household with
an IPT of $Y—some households would be over-reimbursed by the VAT credit they receive
while others would be under-reimbursed.
The middle and bottom blocks of Table 1 provide an interesting comparison with the top
block. The middle block, “Rebates and Burdens under a Proportional VAT,” shows how the
credit would have to be varied to achieve a proportional (rather than a progressive) VAT in
which the net burden is 4 percent of IPT for all IPT levels; relative to the credit in the top block,
the credit in the middle block would start lower ($1,200 instead of $2,000) but end up higher
($7,200 instead of $0). The bottom block, “Burdens under a Fixed Dollar Rebate,” shows how
the net burden would vary if a fixed dollar credit ($2,000) were implemented; like the credit in
the top block, the credit in the bottom block would start by achieving the same 0 percent net
burden for the lowest IPT ($20,000), but would result in a sharper jump in the net burden for the
next IPT ($40,000)—a jump to 4.8 percent (in the bottom block) instead of to 1 percent (in the
top block).
A household must file an income tax return to receive the 1040 VAT credit. Most low-
income households already file tax returns to receive the refundable EITC so there would be
little additional compliance or administrative burden for those households (the extra burden
would come from reporting transfers received). The VAT credit would provide an additional
incentive for low-income households to file a tax return, thereby enabling the EITC to reach an

14
even greater share of eligible working households. Households with no earned income receiving
government transfer benefits could be alerted to the new VAT credit through the administrative
apparatus of the transfer programs. Persons who do not file in order to evade income taxes
would, of course, receive no assistance from a VAT credit.
The proposal to reduce the burden of a VAT on low-income households through a
refundable VAT income tax credit for households is not new. When the U.S. Treasury
considered a VAT in 1984 as part of its study of fundamental tax reform (1984), its report
recommended this option, as did McLure in his VAT book (1987). Since then there has been an
expansion of the number of low-income households that file income tax returns to receive the
refundable EITC (Hoffman and Seidman 1990, 2003) so it would be much easier today to deliver
a refundable tax credit to low-income households.
This paper, however, shows that it is possible to do more with a VAT income tax credit
than just reduce VAT regressivity at the bottom. As Table 1 illustrates, it is possible with the
appropriate VAT credit schedule to make the VAT progressive over a broad range of
households.
I recommend that Congress specify that the 1040 VAT dollar credit numbers (shown for
illustration in Table 1) would be automatically raised (or lowered) Z percent whenever the VAT
rate is raised (or lowered) Z percent; for example, if Congress raises the VAT rate from 10
percent to 12 percent, so Z is 20 percent, then the 1040 VAT credit schedule numbers would
automatically be raised 20 percent. Of course, Congress would always be free to override this
automatic adjustment with discretionary action. But the public would be assured that in the
absence of Congressional action an automatic adjustment would occur.
15
7. PRESERVING THE PERSONAL INCOME TAX FOR ALL HOUSEHOLDS
Graetz (2002, 2008) proposed a VAT as a replacement for the income tax for married
couples with income below $100,000 and singles with income below $50,000 (these thresholds
would be indexed for inflation) while retaining the income tax for households above these
thresholds in order to preserve progressivity at the top. The title of both his article and book
contains the phrase “100 million unnecessary returns,” his rough estimate of the number of
households who would no longer need to file a 1040 tax return.
Graetz’s proposal would therefore terminate the assistance to low and moderate income
households that is currently delivered through the 1040 personal income tax return. The earned
income tax credit (EITC), which provides an annual work bonus of several thousand dollars to
millions of low-income working families every April 15th, would be terminated (Hoffman and
Seidman 2003). Households below the threshold would be ineligible for a tax deduction for
giving to charity.
Moreover, new assistance delivered through the 1040 personal income tax return would
be prevented. His proposal would prevent making a VAT progressive by introducing the
income-related refundable VAT credit on the 1040 shown in Table 1. It would prevent the use of
income-related refundable tax credits to assist households below the threshold trying to afford
vocational training, college education, health insurance, or a home (Seidman 2006).
In both his article (2002) and his book (2008) Graetz expressed concern about the
termination of the EITC. In his book he explained how his plan would utilize a payroll tax
withholding adjustment to provide assistance to low-income workers. There are, however, two
serious shortcomings of Graetz’s recommendation. First, the current EITC alone is much larger

16
than the payroll tax that employers withhold for many employees. Consider, for example, a
household with $10,000 of wage income. If the household has two children, its EITC is 40
percent of its wage income, or $4,000 (the EITC phase-in rate is 40%), yet the payroll tax the
employer withholds (employer plus employee) is only 15.3 percent of its wage income, or
$1,530. So even if employers give all the payroll taxes they withhold from their low-wage
employees to these employees instead of to the IRS, those employees would still be much worse
off due to the termination of the EITC and the new VAT burden. In his discussion of the EITC
problem, Graetz does not acknowledge the fact that his method would often deliver less than half
of what the EITC currently gives to many households with low wage income.
Second, the EITC and the VAT credit depend on household income from all members
and all sources. By contrast, the payroll tax withheld depends solely on the wage income of the
individual employee. If two employees earn the same wage, they receive the same payroll tax
treatment. But one may be the head of a household whose low income warrants a large EITC
and large VAT relief, while the other may be a member of an affluent household whose high
income does not warrant any EITC or VAT relief.
Graetz is right in objecting to many of the current tax expenditures under the personal
income tax. But these can be reduced without terminating the personal income tax. Many tax
reformers have called for broadening the base and reducing the rates (for example, Diamond and
Zodrow 2011). My specific recommendation is for Congress to clean up tax expenditures
(deductions, exclusions, exemptions, special low rates, and credits) by either terminating or
‘credifying’ (converting to a refundable tax credit) each current tax expenditure (Seidman 2006,
2011). On the 1040 of a credified personal income tax, a household would add up its total
income, apply the tax rates to its total income to obtain its tax, and then subtract its tax credits.
17
There are two main advantages to credifying each tax expenditure that isn’t terminated:
(1) the magnitude of each household’s tax benefit would be transparent; (2) Congress would be
able to achieve whatever tax benefit pattern across households it desires. First, use of a tax credit
makes the magnitude of each household’s tax benefit apparent. If a household obtains a $25 tax
credit, it has a benefit of $25; by contrast, if a household receives a deduction, exclusion, or
exemption of $100, its benefit is not immediately obvious because it depends on its tax bracket.
Second, a tax credit allows Congress to achieve whatever tax benefit pattern across households it
desires. For example, when a household gives $100 to charity, Congress can decide whether the
household has a benefit of $15, $25, or $35 by specifying a tax credit rate of 15, 25, or 35
percent. Moreover, Congress can decide whether it wants the credit rate to vary with income,
and if so, how; by contrast, with a charitable deduction Congress has no control over a
household’s tax benefit—it depends on the household’s tax bracket.
8. A CREDIT INVOICE VAT VS A SUBTRACTION VAT
A VAT can be implemented by either the credit invoice method or the subtraction
method. Which method should the U.S. use if it adopts a VAT?
An example illustrates the difference between the two methods. Consider a 10 percent
VAT on a firm with sales of $10,000 and purchases from other firms of $4,000. Under a credit
invoice VAT, the firm is taxed 10 percent of its sales ($1,000) but can claim a tax credit of 10
percent of its purchases ($400), so its net tax payment is $600. Under a subtraction VAT, the
firm subtracts its purchases from its sales to obtain a tax base of $6,000, and then pays a tax
equal to 10 percent of this difference--$600.

18
Under the credit invoice VAT, the firm must document that each item it purchased for
$4,000 included a 10 percent VAT—it obtains the credit on an item only if its gets an invoice
from its supplier documenting the tax the supplier paid on the item. Under the subtraction VAT,
documentation of tax paid by suppliers is not required. Requiring documentation of tax paid by
suppliers raises compliance costs but reduces evasion because auditors can cross-check suppliers
and purchasers.
A credit invoice VAT arises naturally from a turnover tax. Under a turnover tax, each
firm is taxed on its sales. But then multiple taxing (cascading) occurs when different firms
provide different stages of production. Converting a turnover tax to a credit invoice VAT
remedies this multiple-tax (cascade) problem by allowing each firm a credit for tax paid at the
previous stage by its suppliers. Decades ago many European countries converted their turnover
tax to a credit invoice VAT.
A subtraction VAT arises naturally from a corporate income tax. Under a corporate
income tax, each firm subtracts the cost of goods sold from its sales to obtain its income and then
applies a tax rate to this difference. A corporate income tax can be converted to a subtraction
VAT by no longer permitting subtractions (deductions) for labor costs, interest, or depreciation,
but permitting a subtraction for the full purchase price of capital goods (immediate expensing).
A credit invoice VAT looks like a retail sales tax to consumers because the sales receipt
shows the VAT percent to consumers in both cases. By contrast, a subtraction VAT does not
look like a sales tax to consumers because the sales receipt does not show the VAT rate.
So which VAT should be adopted? A practical consideration favoring a credit invoice
VAT is economic integration with our economically advanced trading partners. A credit invoice
VAT is used by most OECD countries and the administrative methods of handling exports and

19
imports under the credit invoice VAT have been developed through a half century of experience.
In their books on the VAT, both McLure (1987) and Tait (1988) strongly advised choosing the
credit invoice VAT over the subtraction VAT, and in their VAT book the IMF economists
(Ebril, et al. 2001) also leaned towards the credit invoice VAT.
If one were proposing a VAT as a replacement of the corporate income tax, it might be
natural to adopt a subtraction VAT because corporations would continue to use a subtraction
method tax, but some of the elements subtracted would be altered as explained above. My tax
reform proposal, however, involves preserving the personal and corporate income taxes while
adding two progressive consumption tax supplements. It would therefore be more natural to
choose the standard credit-invoice VAT that would be levied on all business firms, corporate and
non-corporate, and keep the subtraction method just for the corporate income tax.
9. SHOULD THE VAT BE EARMARKED FOR HEALTH INSURANCE?
Burman (2009) makes the case for earmarking the VAT to universal health insurance.
Thus, just as the payroll tax is earmarked for Social Security and Medicare, the VAT would be
earmarked for health insurance.
An advantage of earmarking a particular tax to a particular program is that it compels
Congress and the public to weigh a visible explicit cost against the benefit. For example, any
proposal for an increase in Social Security or Medicare benefits requires an increase in payroll
taxes, so Congress and the public must weigh whether they regard the increase in benefits as
worth the required increase in payroll taxes. Congress and the public would face the same

20
weighing if the VAT which appears on every sales receipt were earmarked for universal health
insurance.
It would be possible to earmark part of the VAT for a particular program and leave the
rest of the VAT unrestricted. For example, Congress might vote for a 10 percent VAT
specifying that 7 percent is earmarked for health insurance and 3 percent can be used for any
other program or deficit reduction. Or a 10 percent VAT might be earmarked for two
programs—7 percent for health insurance and 3 percent for program X.
Of course, as of this writing, a universal health insurance program has not yet been
enacted in the U.S. There are, however, particular health insurance programs—Medicare,
Medicaid, and the Affordable Care Act. A VAT could be earmarked for one, two, or all three of
them.
I would support a VAT (that supplements current federal taxes) with no earmarking,
partial earmarking, or complete earmarking—whichever way can succeed politically.
10. A TEMPORARY CUT IN THE VAT AS A STIMULUS IN RECESSION
More than a decade ago two leading economists, Feldstein and Blinder, each wrote an op
ed advocating a new approach to combating a recession: a temporary cut in a consumption tax.
Commenting on Japan’s recession in 2001, Feldstein (2001) wrote that Japan should
adopt a temporary investment tax credit to give firms an incentive to spend, and a temporary
suspension of its 5 percent VAT to encourage consumers to spend. In the same way that a one-
week sale at a department store encourages consumers to buy during the week of the sale,
Feldstein’s proposal would have encouraged businesses to spend before the credit was

21
terminated, and consumers to spend before the VAT suspension ended. Feldstein could not
address his proposal to the U.S. during its 2001 recession because the U.S. lacked a national
VAT (or national retail sales tax).
Blinder (2001) tried to overcome this obstacle by proposing that a temporary tax cut be
implemented in the U.S. through state sales taxes. He urged Congress to offer to reimburse any
state that agreed to cut its sales tax for the next 12 months. Blinder emphasized that making the
cut explicitly temporary would give consumers an incentive to spend promptly. Blinder’s
attempt to work through the states would have been unnecessary if the federal government levied
a credit invoice VAT.
A credit invoice VAT would be better than a subtraction VAT for communicating the
incentive to consumers. With a credit invoice VAT, the VAT is indicated to each consumer on
each sales receipt so a temporary cut in the VAT would be visible to consumers. Most
economists would expect competition among firms to compel a prompt cut in product prices
following a cut in the VAT.
If the VAT is earmarked for health insurance programs, revenue lost from a temporary
tax cut to combat recession should be replaced by general revenue. This is exactly what was
done in the U.S. in 2011 and 2012 when the employee Social Security payroll tax was
temporarily cut from 6.2 percent to 4.2 percent with the aim of strengthening the recovery from
the 2008 recession by boosting disposable income and consumer spending; general revenue was
injected into the Social Security Trust Fund to replace the lost payroll tax revenue. At the end of
2012 the payroll tax rate was restored to 6.2% for 2013. This 2011-2012 episode shows that it is
administratively and politically feasible to temporarily vary an earmarked tax to combat a
recession without affecting the earmarked program.

22
Since the onset of the 2008 recession, several European countries have varied their VAT
rate. At the end of 2008, Britain cut its VAT for one year, 2009, from 17.5 to 15.0 percent, to
stimulate consumer spending. Unfortunately (in my judgment), Britain prematurely switched its
priority from stimulus to austerity at the beginning of 2010 in response to concern about its large
budget deficit and rising government debt; its VAT was raised back to 17.5 percent in 2010, and
then raised again to 20.0 percent for 2011 and 2012. Similarly, several other countries raised
their VAT to combat large budget deficits—for example, Spain raised its VAT from 16.0 percent
in 2010 to 18.0 percent for 2011 and 2012. Thus, it is clearly administratively and politically
feasible to vary a VAT either to combat recession or to combat large deficits. My
recommendation is that the VAT be cut in response to a severe recession, and not restored to
normal until a strong recovery has taken hold and the unemployment rate has come down
substantially from its recession peak.
During the Great Recession of 2008, without a VAT the U.S. did not have available this
counter-cyclical instrument for stimulating consumer spending.
11. A PROGRESSIVE CONSUMPTION SURTAX ON THE 1040
My second progressive consumption tax supplement is a consumption surtax on the 1040
(Seidman 2006; Seidman and Lewis 2009). Its key feature is a double threshold. Only
households with very high income and very high consumption would have to pay any surtax.
Only households with very high income would have to fill out the new 1040 consumption surtax
schedule; hence, in contrast to the alternative minimum tax (AMT) which requires a computation
by many moderate income taxpayers who end up not owing any AMT, the consumption surtax

23
would require a computation only by taxpayers with very high income. Although the AMT
could be retained if the consumption surtax is enacted, I would recommend terminating the AMT
and relying on the regular income tax plus the consumption surtax to tax the very affluent.
A numerical example illustrates how the consumption surtax would work. The
consumption tax would be levied on any household that met two criteria: 1040 total income over
$1 million and consumption over $1 million. For such a household, the surtax would be levied
on consumption in excess of $1 million. For example, a household with total income over $1
million and consumption equal to $1.5 million would pay a consumption surtax of $50,000 if the
consumption surtax rate is 10 percent.
A consumption surtax is preferable to an income surtax because a consumption surtax
would raise revenue from very affluent households while increasing their incentive to save
(Seidman and Lewis 2009). Every dollar saved would be tax deductible under the surtax. Any
tax on households reduces their disposable income and therefore reduces the sum of their
consumption and saving. But there are three reasons why a consumption surtax reduces saving
less than an income surtax: the horizontal redistribution effect (a consumption surtax reduces the
disposable income of high savers less than of low savers with the same income, Lewis and
Seidman 1998), the incentive effect (a consumption surtax does not reduce the after-tax return to
saving), and the positive behavioral effect (under a consumption surtax, households will realize
that saving is tax deductible).
In addition to the standard arguments for taxing consumption rather than income, there is
a novel efficiency argument for levying a tax on very high consumption that has been given by
Frank (1999, 2011). Frank contends that very high consumption by the very affluent generates a
negative externality. According to this view, when the very affluent increase the size of their

24
homes or the luxury of their possessions or vacations, unintentionally they raise the implicit
standard against which the merely affluent unconsciously measure their own consumption; the
merely affluent become less satisfied with their own consumption and feel a subtle pressure to
consume more just to maintain their utility. In turn, when the merely affluent raise their
consumption, unintentionally they raise the implicit standard against which the almost affluent
unconsciously measure their own consumption. So it continues downward as each stratum
unintentionally puts pressure on the one below it. This cascading effect begins at the top and
rolls down the social strata. From this perspective, taxing very high consumption is exactly what
is needed to internalize the externality—to reduce very high consumption before it generates a
waterfall of disutility. Given Frank’s assumption that the utility of a social stratum partly
depends on the consumption of the stratum directly above it, a consumption tax of proper
magnitude on the highest stratum would raise efficiency (Seidman 1987).
The very high income threshold plays a crucial practical role under the consumption
surtax because it exempts nearly all households from having to compute their consumption. The
moment a household computes its total income on line 22 of its 1040 it would know whether it
must fill out the consumption surtax form; in this example, as long as its total income is less than
$1 million, it would not have to fill out the consumption surtax form. Nearly all taxpayers would
promptly know they are exempt from having to compute their consumption. This exemption of
virtually all households from the burden of computing their consumption is a crucial difference
between the consumption surtax and the current alternative minimum tax. Many households
must go through a calculation of their AMT to determine whether they must pay it.
The consumption surtax form would be an additional schedule of Form 1040. The
computation of consumption by very affluent households is described in Andrews (1980) and
25
Seidman (2006). The computation is similar to the computation under the cash flow
consumption tax described in the U.S. Treasury’s Blueprints for Basic Tax Reform (1977) and in
my book, The USA Tax: A Progressive Consumption Tax (1997). The very high-income
household would compute its cash flow consumption in the past calendar year by subtraction. It
would sum its cash inflows and then subtract non-consumption cash outflows.
This method of computing cash flow consumption is easy to understand: any cash that
comes in this year that does not go to non-consumption must have gone to consumption. The
items that must be added up are all cash inflows. It must be emphasized that some of these items
are “income” but others are not. The aim is to compute total consumption, not total income. The
items that must be subtracted are cash outflows that are not for consumption. Thus, there is a
fundamental difference between the computation of consumption and the computation of total
income on the 1040. The computation of consumption requires the adding of all cash inflows,
whether the cash inflow is “income” or not.
A household’s total consumption would equal the sum of its cash flow consumption and
two additional components: (1) housing consumption by owner-occupiers; and (2) consumption
financed by others. These two components of consumption are not picked up by adding cash
inflows and subtracting non-consumption cash outflows.
The proposed 1040 consumption surtax overcomes three objections that were made to the
Unlimited Savings Allowance (USA) Tax proposed in the mid-1990s by Republican senator Pete
Domenici and Democratic senator Sam Nunn (Seidman 1997). First, it applies only to very high
income households so most households would not be burdened with computing their cash flow
consumption. Second, it contains a straightforward inclusion of borrowing in cash inflows—the
method recommended by virtually all academic experts—instead of the convoluted “schedule S”
26
proposed in the USA Tax. Third, it avoids the complexity of transition rules in the USA Tax—it
does not attempt to provide any transition relief for “old wealth.”
12. AN EXAMPLE OF THE 1040 CONSUMPTION SURTAX
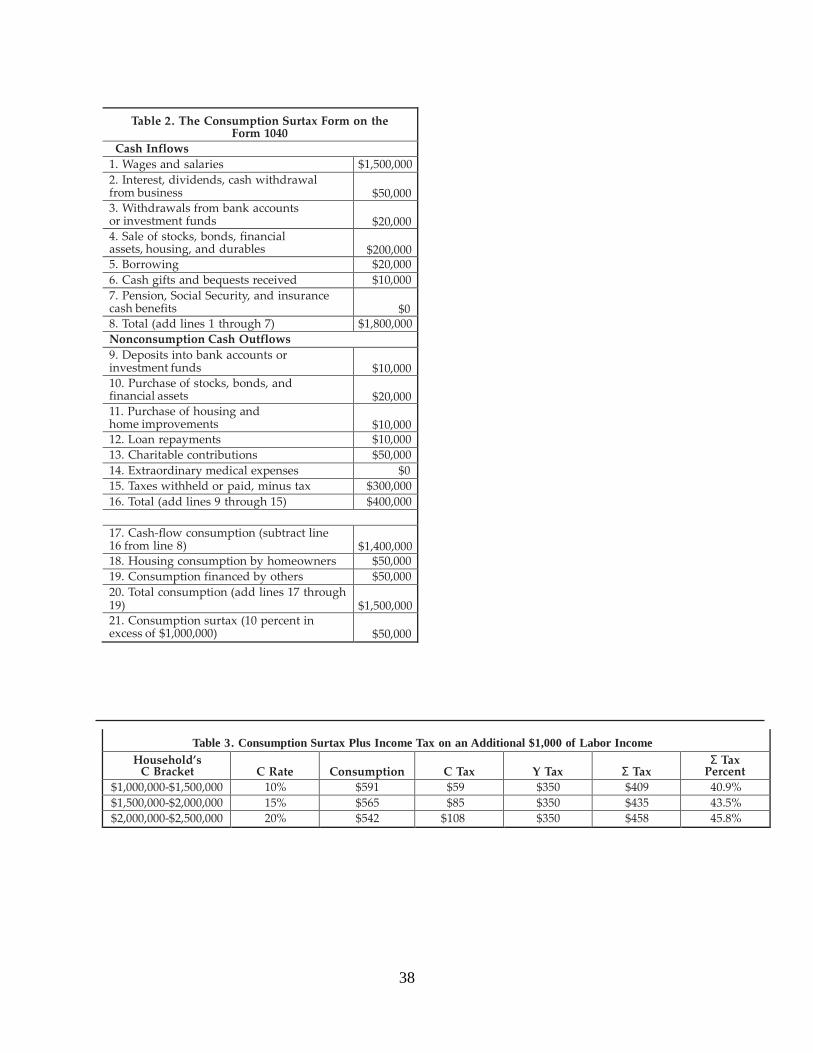
A consumption surtax form with a numerical example is shown in Table 2. To compute
its cash flow consumption, the household would sum its cash inflows and then subtract non-
consumption cash outflows, as shown on lines 1 through 17. What matters is not whether an
item is income, but whether it is a cash inflow that must be included to yield an accurate
computation of cash flow consumption. While line 1 is the same as under an income tax, line 2
includes state and local government bond interest. Line 3, withdrawals from a bank account or
an investment fund, are cash inflows, not income. Line 4, revenue from the sale of stocks and
bonds, is a cash inflow, not income (which would require subtraction of the cost of purchasing
these assets)—it must be emphasized, therefore, that this entry is not capital gains income, but
only revenue from the sale of assets. Line 5, borrowing, is a cash inflow, not income;
consequently, on line 12, loan repayments (principal plus interest) would be a non-consumption
cash outflow that would be subtracted.
Non-consumption cash outflows begin on line 9. The purchase of housing or home
renovation or improvement is treated as an investment on line 11 and is therefore a non-
consumption cash outflow that is subtracted in the year it occurs; however, owner-occupied
housing consumption will be included on line 18 as explained below. If a household purchases a
home this year, there will cash inflows—borrowing, withdrawals from bank accounts or
investment funds, etc.—that will match the investment (the cash outflow to buy the home), so the

27
purchase itself will not give rise to a consumption tax this year. Consumption enjoyed each year
by the homeowner will be entered later on line 18.
Charitable contributions are on line 13, but not gifts given to family or friends.
Extraordinary out-of-pocket medical expenses are not regarded as consumption and are on line
14. Net tax cash payments—taxes actually withheld or paid minus tax refunds actually received
during the calendar year—are on line 15. Any refund received after the tax return is processed
would be subtracted from taxes paid—hence, the entry on line 15 is net tax payments. Line 15
does not require any knowledge of how much income or consumption tax is owed for the
preceding calendar year. It only requires actual tax payments made, taxes withheld, and refunds
received.
Cash flow consumption on line 17 is calculated by subtracting line 16, total non-
consumption cash outflows, from line 8, total cash inflows.
The estimated housing consumption this year by a homeowner is on line 18 (if the
household is a renter, the household’s cash rental payments are automatically included in the
household’s cash flow consumption on line 17). Housing consumption by a home owner in
theory equals the rent that would be paid if the house were rented in a competitive market.
Under the consumption surtax, this hypothetical rent would be measured as an IRS-provided
percent of the estimated current market price P of the home, where the IRS-provided percent
would equal the average ratio of rent to house value according to recent data provided by
Congressional Budget Office technicians. If the estimated market value is $1 million and CBO
technicians estimate that rent is generally 5 percent of market value, then estimated housing
consumption would be $50,000. A formula for determining the estimated current market value P
of a household’s home would be provided by the IRS. The IRS formula should be derived from

28
careful empirical work by CBO technicians. For example, the technicians might use a sample of
houses actually sold to estimate a relationship between the sales price of a house and the house’s
attributes (square feet, number of rooms, zip code, etc.).
Of course, the formula would provide an imperfect estimate of P for any particular house.
But just as imperfect is the officially assessed value on which homeowners pay local property
tax. Yet most homeowners pay their property tax without challenging or protesting the assessed
value on which it is based. It should be kept in mind that the consumption surtax applies only to
a small number of households with very high income while the property tax applies to a large
number of households with a wide range of income.
It could be argued that purchase of a car, boat, or other durable should in theory be
treated the same way a home is treated: as an investment in the year of purchase, with an
estimated rent treated as consumption each year. But in practice it is desirable to avoid having to
estimate rents for a set of consumer durables. It is therefore recommended that the
investment/rent treatment be used only for homes and that the purchase of all other durables be
treated as taxable consumption in the year it occurs.
Consumption financed by others is on line 19. Some firms provide very high-income
employees with fringe benefits, automobiles, recreation, vacations, air travel, etc. Other firms
provide customers or clients with those services. Under the personal income tax, a household is
already required to report most of this in-kind income and be taxed on it; however, enforcement
of this requirement needs to be strengthened. Under the consumption surtax, a very high income
household would be required to report the dollar value of all consumption financed by others on
line 19. Business firms and individuals that finance consumption for very high income
households would be required to provide the dollar value to the household and to the IRS. If a

29
business firm provides a $60,000 car for an executive, the firm must report the $60,000 to the
executive and the IRS, and the executive must include it on the consumption surtax form of the
1040.
In Table 2, total consumption on line 20 is the sum of cash flow consumption on line 17,
housing consumption by homeowners on line 18, and consumption financed by others on line 19.
A rate of 10 percent is applied to consumption above the $1 million threshold. Since the
household’s consumption is $1.5 million on line 20, its surtax on line 21 equals 10 percent of
($1.5 million - $1.0 million), or $50,000.
It is important to recognize that the consumption surtax can use either a single rate or a
set of graduated rates. For example, as shown in Table 3, the first $500,000 of consumption
above $1 million might be taxed 10 percent, but the next $500,000 might be taxed 15 percent,
and so on.
With the consumption surtax, what marginal tax rate would a very high income
household face on another $1,000 of labor income? With the current 35 percent tax rate under
the personal income tax, the household would pay an additional $350 of income tax. If the
household takes the remaining $650 and saves it or gives it to charity, there would be no
additional consumption surtax so the marginal tax rate would be 35 percent. But suppose the
household consumes an amount such that consumption plus surtax equals the remaining $650.
Table 3 shows what would happen. If the consumption surtax rate is 10 percent (top row), then
the household can consume an additional $591 and would owe a surtax of $59 ($591 + $59 =
$650). Thus, on the additional $1,000 of labor income, the household would owe $350 income
tax and $59 consumption surtax for a total of $409, so the marginal tax rate would be 40.9
percent. If the consumption surtax rate is 15 percent (middle row), the surtax would be $85 so

30
the marginal tax rate would be 43.5 percent. And if the consumption surtax rate is 20 percent
(bottom row), the surtax would be $108 so the marginal tax rate would be 45.8 percent. It can be
shown (Seidman and Lewis 2009) that the marginal tax rate would equal (ty+tc)/(1+tc) where ty
is the income tax rate and tc is the consumption surtax rate; for example, if ty = 35 percent and tc
= 10 percent, the marginal tax rate would be (.45/1.10) = 40.9 percent.
I recommend that the graduated rate schedule be set high enough to raise revenue equal
to 1 percent of GDP. In a study of an income surtax on very high income households, Seidman
and Lewis (2009) did a numerical calculation with IRS data and found that a 10 percent income
surtax (raising the tax rate from 35 to 45 percent) on income in excess of $1 million would raise
income tax revenue by 0.5 percent of GDP. Because the IRS does not collect data on each
household’s consumption on the current 1040, I am unable to calculate what consumption surtax
rate would be needed to raise revenue equal to 1 percent of GDP. But based on the
Seidman/Lewis estimate above, I estimate that a graduated consumption rate schedule that rises
from 10 percent to 40 percent on consumption in excess of $1 million would raise 1 percent of
GDP.
13. CONCLUSION
This paper recommends a tax reform strategy that can overcome a fiscal trilemma by
simultaneously accomplishing three objectives: (1) raising sufficient revenue to deal with long
run budget challenges; (2) promoting long run economic growth; (3) providing progressivity in
the face of increasing inequality. The strategy is to retain (with modification) the personal
income tax, the corporate income tax, and the payroll tax, and add two progressive consumption

31
tax supplements: a value added tax made progressive by a refundable VAT credit on the 1040,
and a progressive consumption surtax on the 1040.
I recommend a 10 percent VAT (with tax rebates to achieve progressivity); I estimate that
it would raise net revenue (gross revenue minus rebates) equal to 2 percent of GDP. I
recommend a progressive consumption surtax on the 1040 with rates that rise from 10 percent to
40 percent on consumption in excess of $1 million; I estimate that it would raise revenue equal to
1 percent of GDP. Thus, after a gradual phase in that begins once the unemployment rate is
below 6 percent, the two consumption tax supplements would raise revenue by 3 percent of
GDP—for example, from 20 to 23 percent of GDP (a 15 percent increase in federal revenue).

32
REFERENCES
Alm, James, and Asmaa El-Ganainy. 2013. “Value-added taxation and consumption.”
International Tax and Public Finance 20 (1): 105-128.
Andrews, William. 1980. “A supplemental personal expenditure tax” in What Should Be
Taxed: Income or Expenditure? Joseph Pechman, ed., 127-151. Washington D.C.:
Brookings Institution.
Bartlett, Bruce. 2011. “The conservative case for a VAT” in The VAT Reader, Martin Sullivan,
ed., 83-95. Falls Church VA: Tax Analysts.
Blinder, Alan. 2001. “The economic stimulus we need.” New York Times op ed, September 28.
Blinder, Alan, and Mark Zandi. 2010. “How the Great Recession was brought to an end.” July
27. http://www.economy.com/mark-zandi/documents/End-of-Great-Recession.pdf.
Bradford, David. 2005. “A tax system for the twenty-first century” in Toward Fundamental Tax
Reform, Alan Auerbach and Kevin Hassett, eds., 11-33. Washington D.C.: AEI Press.
Burman, Leonard. 2009. “A blueprint for tax reform and health reform.” Virginia Tax Review
28: 287-323.
Carroll, Robert, and Alan Viard. 2012. Progressive Consumption Taxation: The X-Tax
Revisited. Washington D.C.: AEI Press.
Cnossen, Sijbren. 2011. “A VAT primer for lawyers, economists, and accountants.” in The
VAT Reader, Martin Sullivan, ed., 23-51. Falls Church VA: Tax Analysts.
Diamond, John, and George Zodrow. 2011. Fundamental tax reform: then and now. Baker
Institute Research Report, January.

33
Ebril, Liam, Michael Keen, Jean-Paul Bodin, and Victoria Summers. 2001. The Modern VAT.
Washington D.C.: International Monetary Fund.
Feldstein, Martin. 2001. “Japan needs to stimulate spending.” Wall Street Journal,, July 16.
Frank, Robert. 1999. Luxury Fever. New York: Free Press.
Frank, Robert. 2011. The Darwin Economy. Princeton NJ: Princeton University Press.
Gale, William, and Benjamin Harris. 2011. “A VAT for the United States: part of the solution”
in The VAT Reader, Martin Sullivan, ed., 64-82. Falls Church VA: Tax Analysts.
Gale, William, and Benjamin Harris. 2013. “Creating an American value-added tax. The
Hamilton Project, Brookings Institution” http://www.brookings.edu/research/papers/
2013/ 02/create -american-value-added-tax.
Graetz, Michael. 2002. “100 million unnecessary returns: a fresh start for the U.S. tax system.”
Yale Law Journal 112: 261-310.
Graetz, Michael. 2008. 100 Million Unnecessary Returns: A Simple, Fair, and Competitive
Plan for the United States. New Haven CT: Yale University Press.
Hall, Robert, and Alvin Rabushka. 2007. The Flat Tax. Stanford CA: Hoover Institution Press.
Hines, James. 2007. “Taxing consumption and other sins,” Journal of Economic Perspectives
21 (4): 49-68.
Hoffman, Saul, and Laurence Seidman. 1990. The Earned Income Tax Credit: Anti-Poverty
Effectiveness and Labor Market Effects. Kalamazoo, MI: W.E. Upjohn Institute.
Hoffman, Saul, and Laurence Seidman. 2003. Helping Working Families: The Earned Income
Tax Credit. Kalamazoo, MI: W.E. Upjohn Institute.

34
Holtz-Eakin, Douglas. 2011. “The Case against VAT” in The VAT Reader, Martin Sullivan,
ed., 96-101. Falls Church VA: Tax Analysts.
Lewis, Kenneth, and Laurence Seidman. 1998. “The impact of converting to a consumption tax
when saving propensities vary: an empirical analysis.” International Tax and Public
Finance 5 (4): 499-503.
Lewis, Kenneth, and Laurence Seidman. 1999. “The consumption tax and the saving elasticity.”
National Tax Journal 52 (1): 67-78.
McLure, Charles. 1987. The Value-Added Tax: Key to Deficit Reduction? Washington D.C.:
American Enterprise Institute.
McLure, Charles, and George Zodrow. 2007. “Consumption-based direct taxes: a guided tour of
the amusement park.” Finanzarchiv 63 (2): 285-307.
Rogers, Diane Lim. 2010a. “Why a value-added tax?” Christian Science Monitor, April
27, http://www.csmonitor.com/Business/Economist-Mom/2010/0427.
Rogers, Diane Lim. 2010b. “Why the U.S. Should Enact a VAT.” Christian Science Monitor,
May 10, http://www.csmonitor.com/Business/Economist-Mom/2010/0510.
Seidman, Laurence. 1987. “Relativity and efficient taxation.” Southern Economic Journal 54
(2): 463-474.
Seidman, Laurence. 1996. “The USA tax: a friendly critique of its design.” Tax Notes 73 (7):
833-843.
Seidman, Laurence. 1997. The USA Tax: A Progressive Consumption Tax. Cambridge MA:
MIT Press.

35
Seidman, Laurence. 2004. “A progressive value added tax: has its time finally come” Tax Notes
103 (10): 1255-1263.
Seidman, Laurence. 2006. Pouring Liberal Wine into Conservative Bottles. University Press of
America: Lanham MD.
Seidman, Laurence. 2009. Public Finance. Burr Ridge IL: McGraw-Hill Irwin.
Seidman, Laurence. 2010. “Reducing future deficits while stimulating today’s economy.” The
Economists’ Voice, 7 (3): 1-5.
Seidman, Laurence. 2011. “How to clean up tax expenditures: terminate or ‘credify.’” Tax
Notes 133 (2): 217-219.
Seidman, Laurence, and Kenneth Lewis. 1998. “Conversion to a consumption tax in a growth
model with heterogeneity.” Journal of Macroeconomics 20 (4): 665-680.
Seidman, Laurence, and Kenneth Lewis. 2003. “The later you pay, the higher the k.” Southern
Economic Journal 69 (3): 560-577.
Seidman, Laurence, and Kenneth Lewis. 2009. “Two ways to tax very-high income
households.” Tax Notes 123 (12):1466-1471.
Sullivan, Martin. 2011. “Introduction: Getting Acquainted with VAT” in The VAT Reader,
Martin Sullivan, ed., 7-14. Falls Church VA: Tax Analysts.
Tait, Alan. 1988. The Value Added Tax: International Practice and Problems. Washington
D.C.: International Monetary Fund.
U.S. Congressional Budget Office. 2012. Budget and Economic Outlook, January.
U.S. Treasury, Office of Tax Analysis. 1977. Blueprints for Basic Tax Reform. Washington
D.C. (Second edition by David Bradford, Arlington VAT: Tax Analysts 1984).

36
U.S. Treasury. 1984. Tax Reform for Fairness, Simplicity, and Economic Growth: The
Treasury Department Report to the President, Volume 3: Value-Added Tax, November.
37
Table 1: A Progressive VAT
Rebates and Burdens Under a Progressive VAT
Income VAT Estimated Estimated Estimated
Plus Transfers Credit (percent) Expenditure Gross Burden Net Burden (percent) $20,000 $2,000 (10.00%) $20,000 $2,000 (10.00%) $ 0 (0%) $40,000 $3,500 (8.75%) $39,000 $3,900 (9.75%) $ 400 (1%) $60,000 $4,500 (7.50%) $57,000 $5,700 (9.50%) $ 1,200 (2%) $80,000 $5,000 (6.25%) $74,000 $7,400 (9.25%) $ 2,400 (3%)
$100,000 $5,000 (5.00%) $90,000 $9,000 (9.00%) $ 4,000 (4%) $120,000 $4,500 (3.75%) $105,000 $10,500 (8.75%) $ 6,000 (5%) $140,000 $3,500 (2.50%) $119,000 $11,900 (8.50%) $ 8,400 (6%) $160,000 $2,000 (1.25%) $132,000 $13,200 (8.25%) $11,200 (7%) $180,000 $ 0 (0.00%) $144,000 $14,400 (8.00%) $14,400 (8%)
Rebates and Burdens Under a Proportional VAT
Income VAT Estimated Estimated Estimated
Plus Transfers Credit (percent) Expenditure Gross Burden Net Burden (percent) $20,000 $1,200 (6.00%) $20,000 $2,000 (10.00%) $ 800 (4%) $40,000 $2,300 (5.75%) $39,000 $3,900 (9.75%) $1,600 (4%) $60,000 $3,300 (5.50%) $57,000 $5,700 (9.50%) $2,400 (4%) $80,000 $4,200 (5.25%) $74,000 $7,400 (9.25%) $3,200 (4%)
$100,000 $5,000 (5.00%) $90,000 $9,000 (9.00%) $4,000 (4%) $120,000 $5,700 (4.75%) $105,000 $10,500 (8.75%) $4,800 (4%) $140,000 $6,300 (4.50%) $119,000 $11,900 (8.50%) $5,600 (4%) $160,000 $6,800 (4.25%) $132,000 $13,200 (8.25%) $6,400 (4%) $180,000 $7,200 (4.00%) $144,000 $14,400 (8.00%) $7,200 (4%)
Burdens Under a Fixed Dol la r R ebate
Income VAT Estimated Estimated Estimated
Plus Transfers Credit (percent) Expenditure Gross Burden Net Burden (percent) $20,000 $2,000 (10.00%) $20,000 $2,000 $ 0 (0.0%) $40,000 $2,000 (5.00%) $39,000 $3,900 $1,900 (4.8%) $60,000 $2,000 (3.33%) $57,000 $5,700 $3,700 (6.2%) $80,000 $2,000 (2.50%) $74,000 $7,400 $5,400 (6.8%)
$100,000 $2,000 (2.00%) $90,000 $9,000 $7,000 (7.0%) $120,000 $2,000 (1.67%) $105,000 $10,500 $8,500 (7.1%) $140,000 $2,000 (1.43%) $119,000 $11,900 $9,900 (7.1%) $160,000 $2,000 (1.25%) $132,000 $13,200 $11,200 (7.0%) $180,000 $2,000 (1.11%) $144,000 $14,400 $12,400 (6.9%)
38
Table 2. The Consumption Surtax Form on the Form 1040
Cash Inflows 1. Wages and salaries $1,500,000 2. Interest, dividends, cash withdrawal from business
$50,000
3. Withdrawals from bank accounts or investment funds
$20,000
4. Sale of stocks, bonds, financial assets, housing, and durables
$200,000
5. Borrowing $20,000 6. Cash gifts and bequests received $10,000 7. Pension, Social Security, and insurance cash benefits
$0
8. Total (add lines 1 through 7) $1,800,000 Nonconsumption Cash Outflows 9. Deposits into bank accounts or investment funds
$10,000
10. Purchase of stocks, bonds, and financial assets
$20,000
11. Purchase of housing and home improvements
$10,000
12. Loan repayments $10,000 13. Charitable contributions $50,000 14. Extraordinary medical expenses $0 15. Taxes withheld or paid, minus tax
$300,000
16. Total (add lines 9 through 15) $400,000
17. Cash-flow consumption (subtract line 16 from line 8)
$1,400,000
18. Housing consumption by homeowners $50,000 19. Consumption financed by others $50,000 20. Total consumption (add lines 17 through 19)
$1,500,000
21. Consumption surtax (10 percent in excess of $1,000,000)
$50,000
Table 3. Consumption Surtax Plus Income Tax on an Additional $1,000 of Labor Income Household’s
C Bracket
C Rate
Consumption
C Tax
Y Tax
Σ Tax Σ Tax
Percent $1,000,000-$1,500,000 10% $591 $59 $350 $409 40.9% $1,500,000-$2,000,000 15% $565 $85 $350 $435 43.5% $2,000,000-$2,500,000 20% $542 $108 $350 $458 45.8%