Embed Size (px)
Citation preview

Over Lesson 9–2
A. A
B. B
C. C
D. D
–1, 3
Solve m2 – 2m – 3 = 0 by graphing.

Over Lesson 9–2
A. A
B. B
C. C
D. D
–2.6, -7.2
Solve w2 + 5w – 1 = 0 by graphing. If integral roots cannot be found, estimate the roots to the nearest tenth by using the trace function.

Over Lesson 9–2
A. A
B. B
C. C
D. D
5, 2
Use the quadratic equation to find two numbers that have a difference of 3 and a product of 10.

Over Lesson 9–2
A. A
B. B
C. C
D. D
–7, 5
Solve 21 = x2 + 2x – 14 by graphing.

• Apply translations of quadratic functions.
• Apply dilations and reflections to quadratic functions.

Vocabulary
• transformation--A mapping or movement of a geometric figure that changes its shape or position.
• translation--A transformation in which a figure is slid in any direction.
• dilation--A transformation in which a figure is enlarged or reduced
• reflection--A transformation in which a figure is flipped over a line of symmetry.

Describe and Graph Translations
A. Describe how the graph of h(x) = 10 + x2 is related to the graph f(x) = x2.
Answer: The value of c is 10, and 10 > 0. Therefore, the graph of y = 10 + x2 is a translation of the graph y = x2 up 10 units.

Describe and Graph Translations
B. Describe how the graph of g(x) = x2 – 8 is related to the graph f(x) = x2.
Answer: The value of c is –8, and –8 < 0. Therefore, the graph of y = x2 – 8 is a translation of the graph y = x2 down 8 units.

A. A
B. B
C. C
D. D
A. h(x) is translated 7 units up from f(x).
B. h(x) is translated 7 units down from f(x).
C. h(x) is translated 7 units left from f(x).
D. h(x) is translated 7 units right from f(x).
A. Describe how the graph of h(x) = x2 + 7 is related to the graph of f(x) = x2.

A. A
B. B
C. C
D. D
B. Describe how the graph of g(x) = x2 – 3 is related to the graph of f(x) = x2.
A. g(x) is translated 3 units up from f(x).
B. g(x) is translated 3 units down from f(x).
C. g(x) is translated 3 units left from f(x).
D. g(x) is translated 3 units right from f(x).

Describe and Graph Dilations
The function can be written d(x) = ax2, where a = . __13

Describe and Graph Dilations
Answer: Since 0 < < 1, the graph of y = x2 is a
vertical compression of the graph y = x2.
__13
__13

Describe and Graph Dilations
B. Describe how the graph of m(x) = 2x2 + 1 is related to the graph f(x) = x2.
The function can be written m(x) = ax2 + c, where a = 2 and c = 1.

Describe and Graph Dilations
Answer: Since 1 > 0 and 3 > 1, the graph of y = 2x2 + 1 is stretched vertically and then translated up 1 unit.

A. A
B. B
C. C
D. D
A. n(x) is compressed vertically from f(x).
B. n(x) is compressed horizontally from f(x).
C. n(x) is stretched vertically from f(x).
D. n(x) is stretched horizontally from f(x).
A. Describe how the graph of n(x) = 2x2 is related to the graph of f(x) = x2.

A. A
B. B
C. C
D. D
A. b(x) is stretched vertically and translated 4 units down from f(x).
B. b(x) is compressed vertically and translated 4 units down from f(x).
C. b(x) is stretched horizontally and translated 4 units up from f(x).
D. b(x) is stretched horizontally and translated 4 units down from f(x).
B. Describe how the graph of b(x) = x2 – 4 is
related to the graph of f(x) = x2.
__12
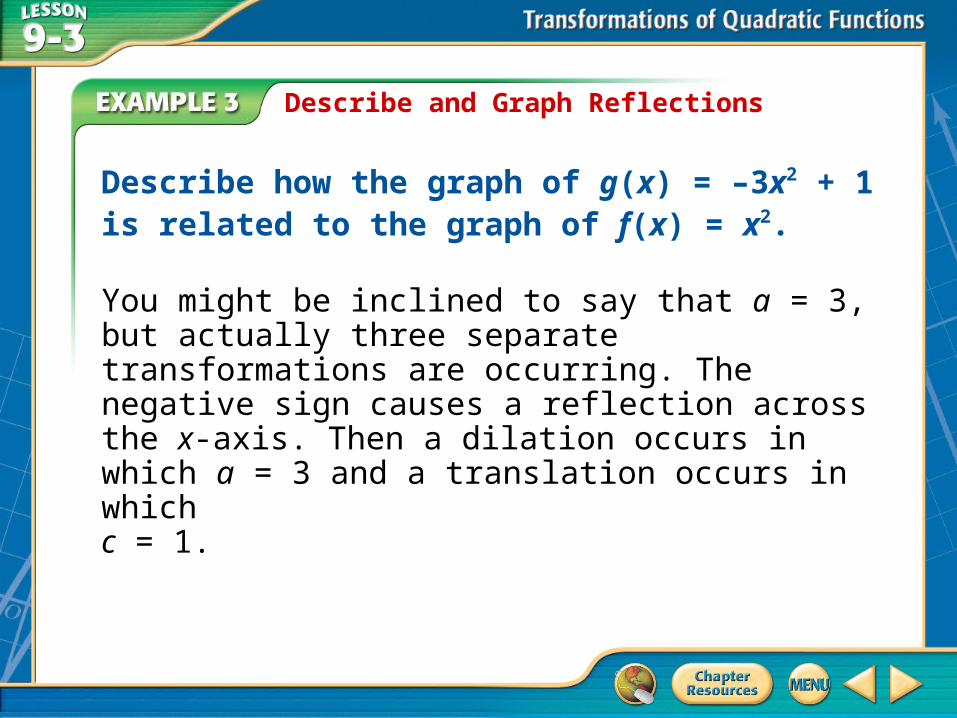
Describe and Graph Reflections
Describe how the graph of g(x) = –3x2 + 1 is related to the graph of f(x) = x2.
You might be inclined to say that a = 3, but actually three separate transformations are occurring. The negative sign causes a reflection across the x-axis. Then a dilation occurs in which a = 3 and a translation occurs in which c = 1.

Describe and Graph Reflections
Answer: The graph of g(x) = –3x2 + 1 is reflected across the x-axis, stretched by a factor of 3, and translated up 1 unit.

A. A
B. B
C. C
D. D
A. The graph of g(x) is reflected across the x-axis, compressed, and translated up 4 units.
B. The graph of g(x) is reflected across the x-axis, compressed, and translated up 5 units.
C. The graph of g(x) is reflected across the x-axis, compressed, and translated down 4 units.
D. The graph of g(x) is reflected across the y-axis, and translated down 4 units.
Describe how the graph of g(x) = –5x2 – 4 is related to the graph of f(x) = x2.

Which is an equation for the function shown in the graph?
A y = x2 – 2
B y = 3x2 + 2
C y = – x2 + 2
D y = –3x2 – 2
__13
__13

Answer: The answer is A.
Read the Test Item
You are given the graph of a parabola. You need to find an equation of the graph.
Solve the Test Item
Notice that the graph opens upward. Therefore, equations C and D are eliminated because the leading coefficient should be positive. The parabola is translated down 2 units, so c = –2 which is shown in equation A.

A. A
B. B
C. C
D. D
A. y = –2x2 – 3
B. y = 2x2 + 3
C. y = –2x2 + 3
D. y = 2x2 – 3
Which is an equation for the function shown in the graph?