Embed Size (px)
Citation preview
JAN 2022
Outlook on theUnited States
RD12134
Summary• While the discovery of the Omicron variant of COVID-19 jolted
markets late in 2021, the outlook for 2022 remains bright.
• We expect elevated inflation through much of 2022, but also expect base effects, the resolution of certain supply chain issues, and the return of several million workers to formal employment to lead to a gradual decline in the rate of price increases.
• Underscoring its intention to focus more on inflation than maximizing employment, the Fed indicated that inflation has already exceeded its target of 2% for “some time.”
• Although we agree the Fed needs to normalize monetary policy away from the emergency measures that have been in place since March 2020, we do not believe the Fed will be able to raise rates as high as some have suggested, nor will it have to do so.
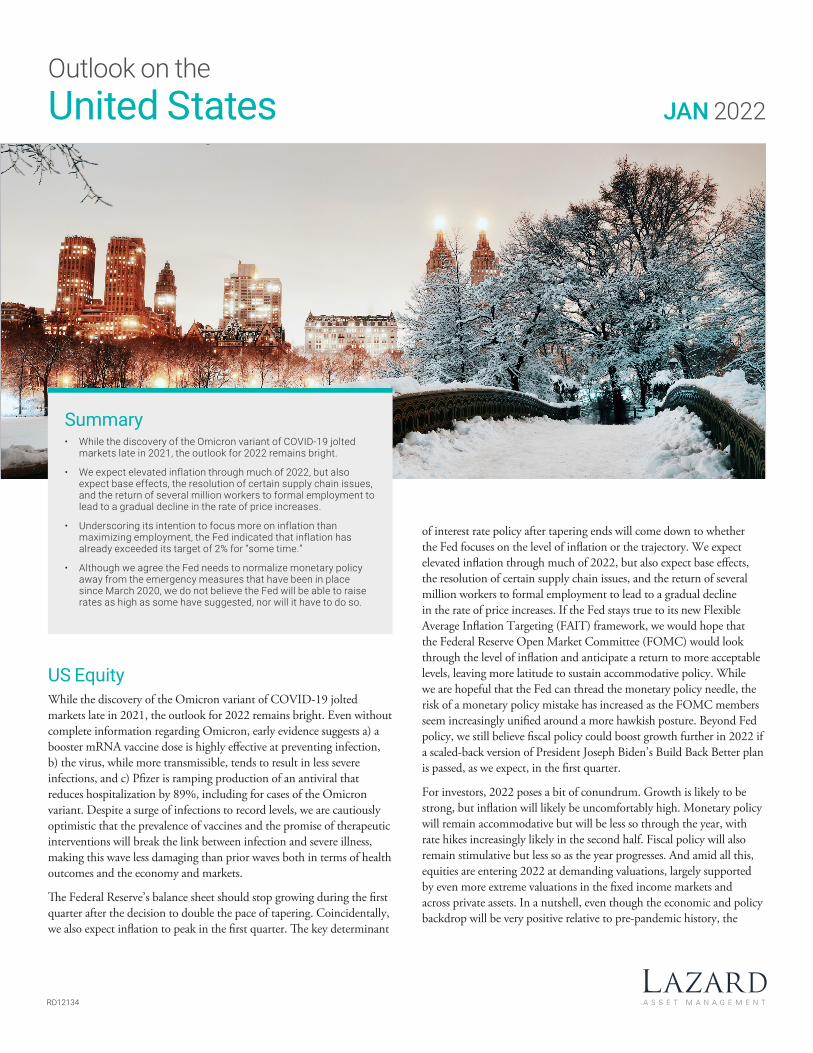
US EquityWhile the discovery of the Omicron variant of COVID-19 jolted markets late in 2021, the outlook for 2022 remains bright. Even without complete information regarding Omicron, early evidence suggests a) a booster mRNA vaccine dose is highly effective at preventing infection, b) the virus, while more transmissible, tends to result in less severe infections, and c) Pfizer is ramping production of an antiviral that reduces hospitalization by 89%, including for cases of the Omicron variant. Despite a surge of infections to record levels, we are cautiously optimistic that the prevalence of vaccines and the promise of therapeutic interventions will break the link between infection and severe illness, making this wave less damaging than prior waves both in terms of health outcomes and the economy and markets.
The Federal Reserve’s balance sheet should stop growing during the first quarter after the decision to double the pace of tapering. Coincidentally, we also expect inflation to peak in the first quarter. The key determinant
of interest rate policy after tapering ends will come down to whether the Fed focuses on the level of inflation or the trajectory. We expect elevated inflation through much of 2022, but also expect base effects, the resolution of certain supply chain issues, and the return of several million workers to formal employment to lead to a gradual decline in the rate of price increases. If the Fed stays true to its new Flexible Average Inflation Targeting (FAIT) framework, we would hope that the Federal Reserve Open Market Committee (FOMC) would look through the level of inflation and anticipate a return to more acceptable levels, leaving more latitude to sustain accommodative policy. While we are hopeful that the Fed can thread the monetary policy needle, the risk of a monetary policy mistake has increased as the FOMC members seem increasingly unified around a more hawkish posture. Beyond Fed policy, we still believe fiscal policy could boost growth further in 2022 if a scaled-back version of President Joseph Biden’s Build Back Better plan is passed, as we expect, in the first quarter.
For investors, 2022 poses a bit of conundrum. Growth is likely to be strong, but inflation will likely be uncomfortably high. Monetary policy will remain accommodative but will be less so through the year, with rate hikes increasingly likely in the second half. Fiscal policy will also remain stimulative but less so as the year progresses. And amid all this, equities are entering 2022 at demanding valuations, largely supported by even more extreme valuations in the fixed income markets and across private assets. In a nutshell, even though the economic and policy backdrop will be very positive relative to pre-pandemic history, the
2
to meet rebounding demand. At the same time, people in urban areas became less willing to take public transit and bought cars. Even as demand surged higher, semiconductor shortages and, to a lesser degree, other transportation bottlenecks curtailed the supply of new vehicles, driving up new and used car prices. Of the 4.9% year-on-year increase in CPI ex-food and energy, automobiles comprised 1.9 percentage points, or 39%, of the increase. Our analysis indicates that semiconductor supply/demand imbalance is already beginning to narrow, which should lead to a sharp decrease in auto price inflation in 2022 and perhaps even outright price declines once supplies have normalized.
It is important to recognize, though, that even if auto prices had not increased at all, core CPI would still be 3% in November 2021. This number was undoubtedly magnified by transportation disruptions leading to shortages of a wide range of products that did not make the journey from port to store in a timely manner. We will be watching to see if the price increases we have observed can stick or whether prices will return to a pre-pandemic equilibrium once shipping issues are resolved.
There are signs that these supply chain problems are being resolved. Semiconductor shortages are easing, more ships are unloading their goods at Southern California ports, and some indicators of shipping prices have plateaued or begun falling. We are not in the clear yet on these issues, but we are encouraged by improvements on the margin.
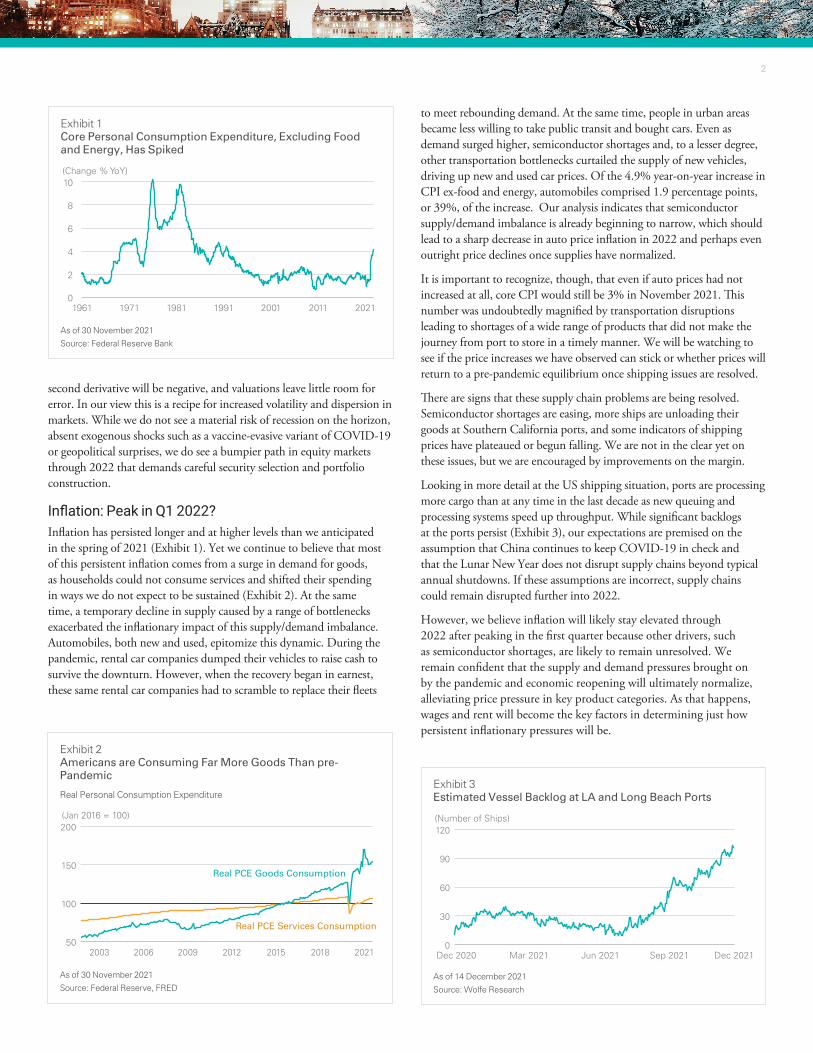
Looking in more detail at the US shipping situation, ports are processing more cargo than at any time in the last decade as new queuing and processing systems speed up throughput. While significant backlogs at the ports persist (Exhibit 3), our expectations are premised on the assumption that China continues to keep COVID-19 in check and that the Lunar New Year does not disrupt supply chains beyond typical annual shutdowns. If these assumptions are incorrect, supply chains could remain disrupted further into 2022.
However, we believe inflation will likely stay elevated through 2022 after peaking in the first quarter because other drivers, such as semiconductor shortages, are likely to remain unresolved. We remain confident that the supply and demand pressures brought on by the pandemic and economic reopening will ultimately normalize, alleviating price pressure in key product categories. As that happens, wages and rent will become the key factors in determining just how persistent inflationary pressures will be.
second derivative will be negative, and valuations leave little room for error. In our view this is a recipe for increased volatility and dispersion in markets. While we do not see a material risk of recession on the horizon, absent exogenous shocks such as a vaccine-evasive variant of COVID-19 or geopolitical surprises, we do see a bumpier path in equity markets through 2022 that demands careful security selection and portfolio construction.
Inflation: Peak in Q1 2022?Inflation has persisted longer and at higher levels than we anticipated in the spring of 2021 (Exhibit 1). Yet we continue to believe that most of this persistent inflation comes from a surge in demand for goods, as households could not consume services and shifted their spending in ways we do not expect to be sustained (Exhibit 2). At the same time, a temporary decline in supply caused by a range of bottlenecks exacerbated the inflationary impact of this supply/demand imbalance. Automobiles, both new and used, epitomize this dynamic. During the pandemic, rental car companies dumped their vehicles to raise cash to survive the downturn. However, when the recovery began in earnest, these same rental car companies had to scramble to replace their fleets
Exhibit 1Core Personal Consumption Expenditure, Excluding Food and Energy, Has Spiked
(Change % YoY)
0
2
4
6
8
10
2021201120011991198119711961
As of 30 November 2021
Source: Federal Reserve Bank
Exhibit 2Americans are Consuming Far More Goods Than pre- Pandemic
Real Personal Consumption Expenditure
(Jan 2016 = 100)
50
100
150
200
2021201820152012200920062003
Real PCE Services Consumption
Real PCE Goods Consumption
As of 30 November 2021
Source: Federal Reserve, FRED
Exhibit 3Estimated Vessel Backlog at LA and Long Beach Ports
(Number of Ships)
0
30
60
90
120
Dec 2021Sep 2021Jun 2021Mar 2021Dec 2020
As of 14 December 2021
Source: Wolfe Research
3
For years, we have consistently focused on wages in our outlooks, as 50%–55% of the cost of goods sold in the United States consists of labor-related expenses. Currently, all but the bottom 25% of earners are experiencing real wage declines, which we view as unsustainable. We expect workers to demand wage increases to regain their real purchasing power, and the key question is to what degree those wage increases feed into price increases. As of November, the Job Openings and Labor Turnover Survey showed that 10.6 million jobs were unfilled in the United States, representing a near-record 6.6% jobs open rate. Prior to the pandemic, the highest opening rate in the series’ nearly 20-year history was 4.8%. With such an elevated number of job openings, employers are being forced to pay up to fill positions.
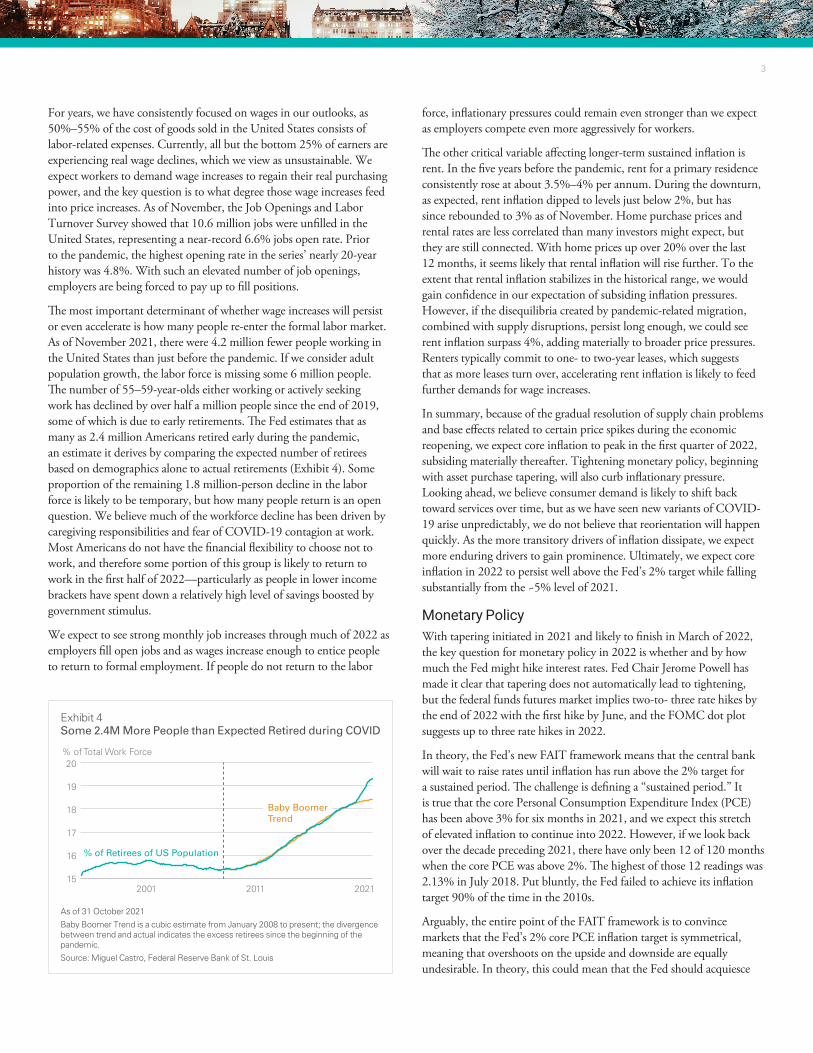
The most important determinant of whether wage increases will persist or even accelerate is how many people re-enter the formal labor market. As of November 2021, there were 4.2 million fewer people working in the United States than just before the pandemic. If we consider adult population growth, the labor force is missing some 6 million people. The number of 55–59-year-olds either working or actively seeking work has declined by over half a million people since the end of 2019, some of which is due to early retirements. The Fed estimates that as many as 2.4 million Americans retired early during the pandemic, an estimate it derives by comparing the expected number of retirees based on demographics alone to actual retirements (Exhibit 4). Some proportion of the remaining 1.8 million-person decline in the labor force is likely to be temporary, but how many people return is an open question. We believe much of the workforce decline has been driven by caregiving responsibilities and fear of COVID-19 contagion at work. Most Americans do not have the financial flexibility to choose not to work, and therefore some portion of this group is likely to return to work in the first half of 2022—particularly as people in lower income brackets have spent down a relatively high level of savings boosted by government stimulus.
We expect to see strong monthly job increases through much of 2022 as employers fill open jobs and as wages increase enough to entice people to return to formal employment. If people do not return to the labor
force, inflationary pressures could remain even stronger than we expect as employers compete even more aggressively for workers.
The other critical variable affecting longer-term sustained inflation is rent. In the five years before the pandemic, rent for a primary residence consistently rose at about 3.5%–4% per annum. During the downturn, as expected, rent inflation dipped to levels just below 2%, but has since rebounded to 3% as of November. Home purchase prices and rental rates are less correlated than many investors might expect, but they are still connected. With home prices up over 20% over the last 12 months, it seems likely that rental inflation will rise further. To the extent that rental inflation stabilizes in the historical range, we would gain confidence in our expectation of subsiding inflation pressures. However, if the disequilibria created by pandemic-related migration, combined with supply disruptions, persist long enough, we could see rent inflation surpass 4%, adding materially to broader price pressures. Renters typically commit to one- to two-year leases, which suggests that as more leases turn over, accelerating rent inflation is likely to feed further demands for wage increases.
In summary, because of the gradual resolution of supply chain problems and base effects related to certain price spikes during the economic reopening, we expect core inflation to peak in the first quarter of 2022, subsiding materially thereafter. Tightening monetary policy, beginning with asset purchase tapering, will also curb inflationary pressure. Looking ahead, we believe consumer demand is likely to shift back toward services over time, but as we have seen new variants of COVID-19 arise unpredictably, we do not believe that reorientation will happen quickly. As the more transitory drivers of inflation dissipate, we expect more enduring drivers to gain prominence. Ultimately, we expect core inflation in 2022 to persist well above the Fed’s 2% target while falling substantially from the ~5% level of 2021.
Monetary Policy With tapering initiated in 2021 and likely to finish in March of 2022, the key question for monetary policy in 2022 is whether and by how much the Fed might hike interest rates. Fed Chair Jerome Powell has made it clear that tapering does not automatically lead to tightening, but the federal funds futures market implies two-to- three rate hikes by the end of 2022 with the first hike by June, and the FOMC dot plot suggests up to three rate hikes in 2022.
In theory, the Fed’s new FAIT framework means that the central bank will wait to raise rates until inflation has run above the 2% target for a sustained period. The challenge is defining a “sustained period.” It is true that the core Personal Consumption Expenditure Index (PCE) has been above 3% for six months in 2021, and we expect this stretch of elevated inflation to continue into 2022. However, if we look back over the decade preceding 2021, there have only been 12 of 120 months when the core PCE was above 2%. The highest of those 12 readings was 2.13% in July 2018. Put bluntly, the Fed failed to achieve its inflation target 90% of the time in the 2010s.
Arguably, the entire point of the FAIT framework is to convince markets that the Fed’s 2% core PCE inflation target is symmetrical, meaning that overshoots on the upside and downside are equally undesirable. In theory, this could mean that the Fed should acquiesce
Exhibit 4Some 2.4M More People than Expected Retired during COVID
% of Total Work Force
15
16
17
18
19
20
202120112001
% of Retirees of US Population
Baby Boomer Trend
As of 31 October 2021
Baby Boomer Trend is a cubic estimate from January 2008 to present; the divergence between trend and actual indicates the excess retirees since the beginning of the pandemic.
Source: Miguel Castro, Federal Reserve Bank of St. Louis
4
to a few years of inflation above 2%, but what if inflation is above 3%? That is the conundrum facing the Fed. We think the Fed will opt for the middle road of hiking rates moderately as an insurance policy but will take into account the falling trajectory of inflation while recognizing the years of undershooting relative to their targets. We are hopeful that the Fed will avoid a policy mistake, but the risks around communication and action are high and are likely to add volatility to markets in 2022.
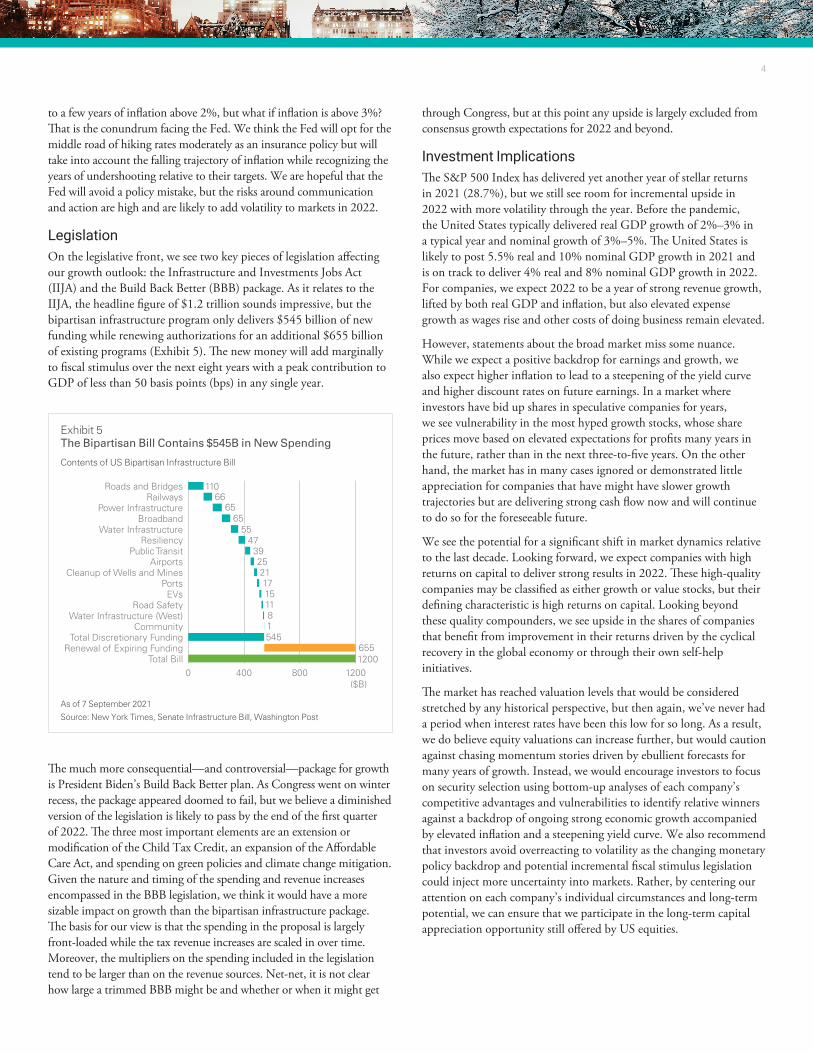
Legislation On the legislative front, we see two key pieces of legislation affecting our growth outlook: the Infrastructure and Investments Jobs Act (IIJA) and the Build Back Better (BBB) package. As it relates to the IIJA, the headline figure of $1.2 trillion sounds impressive, but the bipartisan infrastructure program only delivers $545 billion of new funding while renewing authorizations for an additional $655 billion of existing programs (Exhibit 5). The new money will add marginally to fiscal stimulus over the next eight years with a peak contribution to GDP of less than 50 basis points (bps) in any single year.
The much more consequential—and controversial—package for growth is President Biden’s Build Back Better plan. As Congress went on winter recess, the package appeared doomed to fail, but we believe a diminished version of the legislation is likely to pass by the end of the first quarter of 2022. The three most important elements are an extension or modification of the Child Tax Credit, an expansion of the Affordable Care Act, and spending on green policies and climate change mitigation. Given the nature and timing of the spending and revenue increases encompassed in the BBB legislation, we think it would have a more sizable impact on growth than the bipartisan infrastructure package. The basis for our view is that the spending in the proposal is largely front-loaded while the tax revenue increases are scaled in over time. Moreover, the multipliers on the spending included in the legislation tend to be larger than on the revenue sources. Net-net, it is not clear how large a trimmed BBB might be and whether or when it might get
through Congress, but at this point any upside is largely excluded from consensus growth expectations for 2022 and beyond.
Investment ImplicationsThe S&P 500 Index has delivered yet another year of stellar returns in 2021 (28.7%), but we still see room for incremental upside in 2022 with more volatility through the year. Before the pandemic, the United States typically delivered real GDP growth of 2%–3% in a typical year and nominal growth of 3%–5%. The United States is likely to post 5.5% real and 10% nominal GDP growth in 2021 and is on track to deliver 4% real and 8% nominal GDP growth in 2022. For companies, we expect 2022 to be a year of strong revenue growth, lifted by both real GDP and inflation, but also elevated expense growth as wages rise and other costs of doing business remain elevated.
However, statements about the broad market miss some nuance. While we expect a positive backdrop for earnings and growth, we also expect higher inflation to lead to a steepening of the yield curve and higher discount rates on future earnings. In a market where investors have bid up shares in speculative companies for years, we see vulnerability in the most hyped growth stocks, whose share prices move based on elevated expectations for profits many years in the future, rather than in the next three-to-five years. On the other hand, the market has in many cases ignored or demonstrated little appreciation for companies that have might have slower growth trajectories but are delivering strong cash flow now and will continue to do so for the foreseeable future.
We see the potential for a significant shift in market dynamics relative to the last decade. Looking forward, we expect companies with high returns on capital to deliver strong results in 2022. These high-quality companies may be classified as either growth or value stocks, but their defining characteristic is high returns on capital. Looking beyond these quality compounders, we see upside in the shares of companies that benefit from improvement in their returns driven by the cyclical recovery in the global economy or through their own self-help initiatives.
The market has reached valuation levels that would be considered stretched by any historical perspective, but then again, we’ve never had a period when interest rates have been this low for so long. As a result, we do believe equity valuations can increase further, but would caution against chasing momentum stories driven by ebullient forecasts for many years of growth. Instead, we would encourage investors to focus on security selection using bottom-up analyses of each company’s competitive advantages and vulnerabilities to identify relative winners against a backdrop of ongoing strong economic growth accompanied by elevated inflation and a steepening yield curve. We also recommend that investors avoid overreacting to volatility as the changing monetary policy backdrop and potential incremental fiscal stimulus legislation could inject more uncertainty into markets. Rather, by centering our attention on each company’s individual circumstances and long-term potential, we can ensure that we participate in the long-term capital appreciation opportunity still offered by US equities.
Exhibit 5The Bipartisan Bill Contains $545B in New Spending
Contents of US Bipartisan Infrastructure Bill
($B)0 400 800 1200
Total BillRenewal of Expiring Funding
Total Discretionary FundingCommunity
Water Infrastructure (West)Road Safety
EVsPorts
Cleanup of Wells and MinesAirports
Public TransitResiliency
Water InfrastructureBroadband
Power InfrastructureRailways
Roads and Bridges 11066
6565
554739252117151181545
6551200
As of 7 September 2021
Source: New York Times, Senate Infrastructure Bill, Washington Post
5
The preceding outlook reflects the views and analysis of Lazard’s US equity teams. The following outlook reflects the views and analysis of Lazard’s US fixed income team.
DebtThe Fed’s Pivot When the quarter started, inflation was proclaimed to be “transitory,” the result of temporary bottlenecks in supply chains that would normalize as the global economy recovered from shutdowns associated with the pandemic. However, the Fed provided the impetus for a relatively hawkish shift when Chair Jerome Powell, speaking before Congress in early December, suggested retiring the word “transitory” in reference to inflation and indicated that the Fed was ready to focus on price stability—in other words, to tackle inflation—after months of attending mainly to its other goal, maximum employment. Bond traders were quick to seize on the Fed’s “hawkish pivot,” and moved up their forecasts for the timing and number of rate hikes.
Based on US bond market pricing in mid-December, ahead of the Fed’s meeting, investors expected the central bank to begin raising the policy rate by the middle of 2022, with three total hikes priced in by year-end and a total of five hikes by the end of 2023. Markets also began to expect the Fed to accelerate the tapering of its bond-buying program, which would need to end before the first hike. Indeed, at its mid-December meeting, the Fed confirmed it would accelerate the pace of tapering and revised up both its inflation and growth forecasts for 2022. Moreover, its dot plot indicated three 25-bp hikes in 2022, followed by three more in 2023. Then, Omicron emerged as a threat to the reopening of global economies, potentially challenging the Fed’s pathway yet again.
The Fed’s Intended TrajectoryFrom June 2020 through October 2021 the Fed bought $120 billion of bonds each month: $80 billion of Treasuries and $40 billion of Agency Mortgage-Backed Securities (agency MBS). This program was the primary contributor to the expansion of the Fed’s balance sheet from $4 trillion to $8 trillion. Unlike previous quantitative easing (QE) programs, when the Fed bought longer-term Treasuries, the recent buying has been relatively more balanced. Some 60% of the bonds have maturities of five years or less.
In November, the Fed reduced monthly purchases by $15 billion ($10 billion of Treasuries and $5 billion of agency MBS), a pace that was set to continue each month. At the December 2021 meeting, the Fed announced it would cut purchases by $30 billion a month moving forward ($20 billion of Treasuries and $10 billion of agency MBS), starting in January 2022. This puts the Fed on course to conclude asset purchases by March 2022, instead of June as originally intended, although Chair Powell indicated the timeline could change if warranted.
The Fed’s updated projections now indicate three rate hikes in 2022, up from the one-hike projection implied at the September meeting, when the Federal Open Market Committee was split on the potential need for a second 2022 rate hike. Its inflation forecast was revised up to 2.6% from 2.2% for headline personal consumption expenditures (PCE) by the end of next year, while it raised the target for its preferred gauge of inflation, core PCE, to 2.7% from 2.3% by the end of 2022.
Importantly, underscoring its intention to focus more on inflation than maximizing employment, the Fed indicated that inflation has already exceeded its target of 2% for “some time,” and that this overshoot has made up for previous shortfalls. The Fed sees the headline U-3 unemployment rate continuing to fall below its long-run estimate of 4% to 3.5% next year, down from both the prior estimate of 3.8% and November’s reading of 4.2%.
All in all, this meeting was in line with market expectations, and we agree that the Fed no longer needs to maintain the emergency monetary policy that has been in place since the start of the pandemic in March 2020.
Is Inflation Sustainable?We believe inflation will normalize as supply chain shocks resolve. For example, much has been made of the urban consumer price index (CPI-U) and core CPI-U rising to 6.8% and 4.9%, respectively, in the past 12 months to November 2021 after averaging about 2% for the decade leading up to pandemic. Granted, the 6.8% headline reading was the largest 12-month increase since the period ending in June 1982, and the 4.9% core CPI measurement was the largest since June 1991. However, outside of energy, which was up 33.3% during the period, most of the CPI jump can be attributed to core durable goods such as used car and trucks (up 31.4%) and new vehicles (up 11.1%).
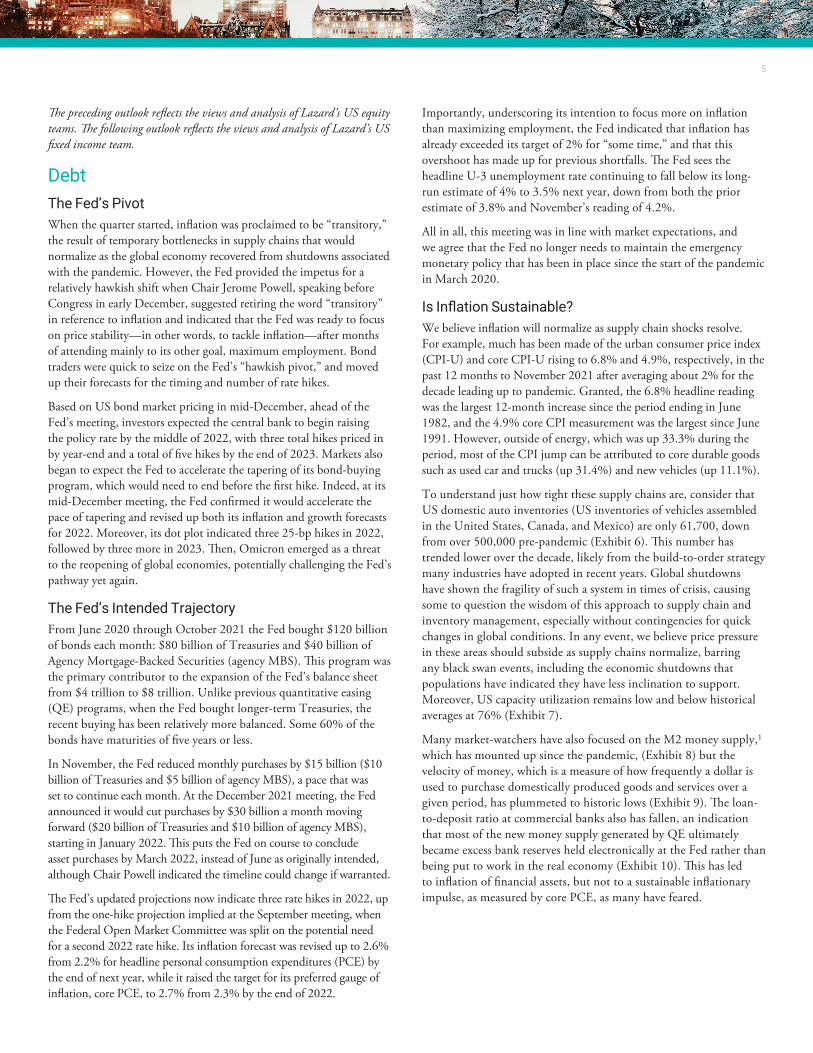
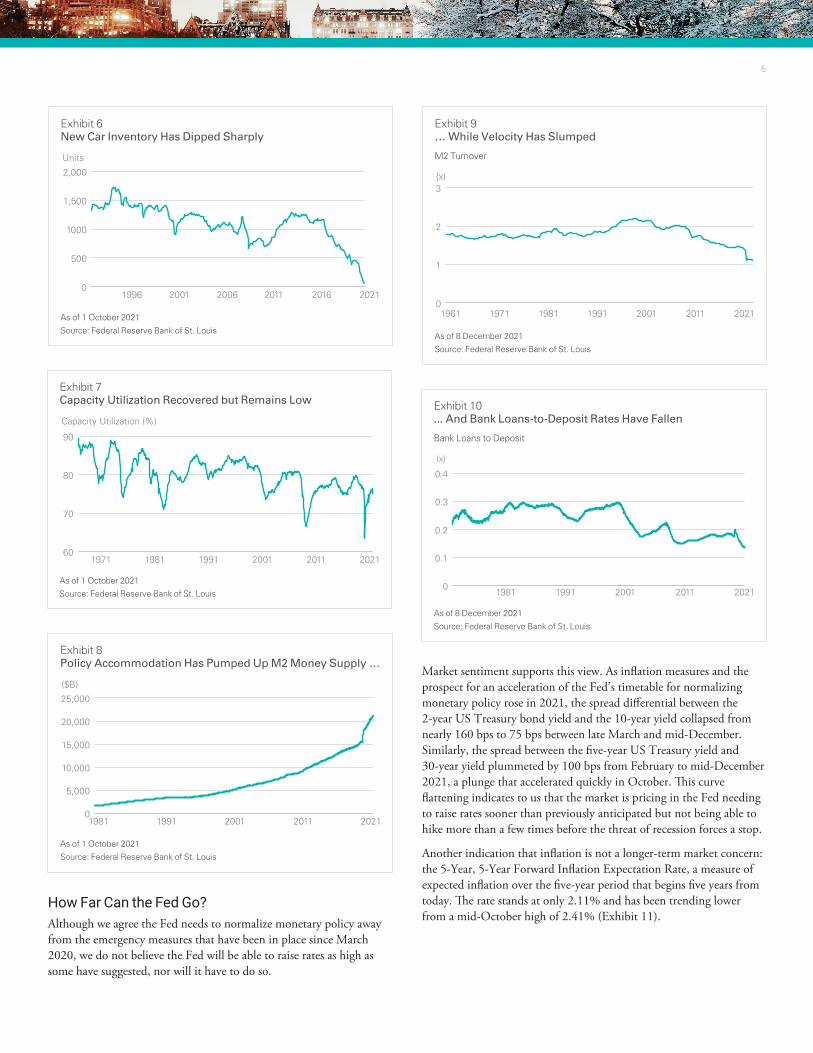
To understand just how tight these supply chains are, consider that US domestic auto inventories (US inventories of vehicles assembled in the United States, Canada, and Mexico) are only 61,700, down from over 500,000 pre-pandemic (Exhibit 6). This number has trended lower over the decade, likely from the build-to-order strategy many industries have adopted in recent years. Global shutdowns have shown the fragility of such a system in times of crisis, causing some to question the wisdom of this approach to supply chain and inventory management, especially without contingencies for quick changes in global conditions. In any event, we believe price pressure in these areas should subside as supply chains normalize, barring any black swan events, including the economic shutdowns that populations have indicated they have less inclination to support. Moreover, US capacity utilization remains low and below historical averages at 76% (Exhibit 7).
Many market-watchers have also focused on the M2 money supply,1 which has mounted up since the pandemic, (Exhibit 8) but the velocity of money, which is a measure of how frequently a dollar is used to purchase domestically produced goods and services over a given period, has plummeted to historic lows (Exhibit 9). The loan-to-deposit ratio at commercial banks also has fallen, an indication that most of the new money supply generated by QE ultimately became excess bank reserves held electronically at the Fed rather than being put to work in the real economy (Exhibit 10). This has led to inflation of financial assets, but not to a sustainable inflationary impulse, as measured by core PCE, as many have feared.
6
How Far Can the Fed Go?Although we agree the Fed needs to normalize monetary policy away from the emergency measures that have been in place since March 2020, we do not believe the Fed will be able to raise rates as high as some have suggested, nor will it have to do so.
Market sentiment supports this view. As inflation measures and the prospect for an acceleration of the Fed’s timetable for normalizing monetary policy rose in 2021, the spread differential between the 2-year US Treasury bond yield and the 10-year yield collapsed from nearly 160 bps to 75 bps between late March and mid-December. Similarly, the spread between the five-year US Treasury yield and 30-year yield plummeted by 100 bps from February to mid-December 2021, a plunge that accelerated quickly in October. This curve flattening indicates to us that the market is pricing in the Fed needing to raise rates sooner than previously anticipated but not being able to hike more than a few times before the threat of recession forces a stop.
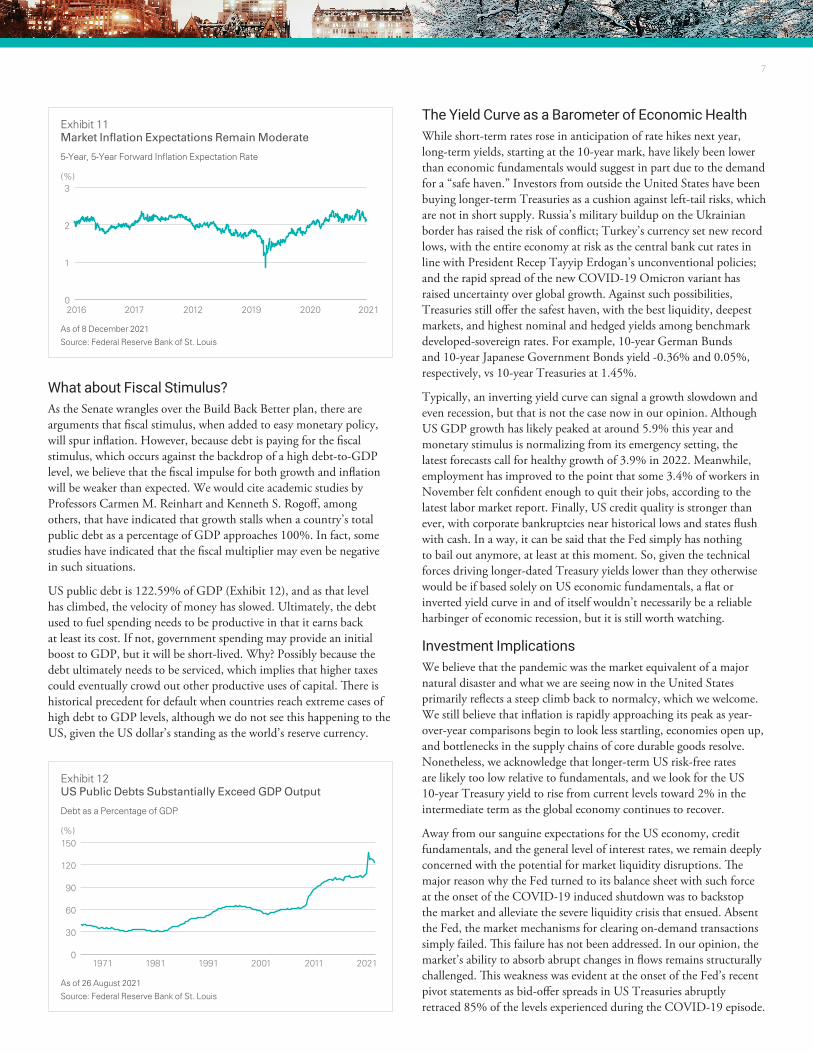
Another indication that inflation is not a longer-term market concern: the 5-Year, 5-Year Forward Inflation Expectation Rate, a measure of expected inflation over the five-year period that begins five years from today. The rate stands at only 2.11% and has been trending lower from a mid-October high of 2.41% (Exhibit 11).
Exhibit 8Policy Accommodation Has Pumped Up M2 Money Supply …
($B)
0
5,000
10,000
15,000
20,000
25,000
20212011200119911981
As of 1 October 2021
Source: Federal Reserve Bank of St. Louis
Exhibit 10... And Bank Loans-to-Deposit Rates Have Fallen
Bank Loans to Deposit
(x)
0
0.1
0.2
0.3
0.4
20212011200119911981
As of 8 December 2021
Source: Federal Reserve Bank of St. Louis
Exhibit 9… While Velocity Has Slumped
M2 Turnover
(x)
0
1
2
3
2021201120011991198119711961
As of 8 December 2021
Source: Federal Reserve Bank of St. Louis
Exhibit 7Capacity Utilization Recovered but Remains Low
Capacity Utilization (%)
60
70
80
90
202120112001199119811971
As of 1 October 2021
Source: Federal Reserve Bank of St. Louis
Exhibit 6New Car Inventory Has Dipped Sharply
Units
0
500
1000
1,500
2,000
202120162011200620011996
As of 1 October 2021
Source: Federal Reserve Bank of St. Louis
7
What about Fiscal Stimulus?As the Senate wrangles over the Build Back Better plan, there are arguments that fiscal stimulus, when added to easy monetary policy, will spur inflation. However, because debt is paying for the fiscal stimulus, which occurs against the backdrop of a high debt-to-GDP level, we believe that the fiscal impulse for both growth and inflation will be weaker than expected. We would cite academic studies by Professors Carmen M. Reinhart and Kenneth S. Rogoff, among others, that have indicated that growth stalls when a country’s total public debt as a percentage of GDP approaches 100%. In fact, some studies have indicated that the fiscal multiplier may even be negative in such situations.
US public debt is 122.59% of GDP (Exhibit 12), and as that level has climbed, the velocity of money has slowed. Ultimately, the debt used to fuel spending needs to be productive in that it earns back at least its cost. If not, government spending may provide an initial boost to GDP, but it will be short-lived. Why? Possibly because the debt ultimately needs to be serviced, which implies that higher taxes could eventually crowd out other productive uses of capital. There is historical precedent for default when countries reach extreme cases of high debt to GDP levels, although we do not see this happening to the US, given the US dollar’s standing as the world’s reserve currency.
The Yield Curve as a Barometer of Economic HealthWhile short-term rates rose in anticipation of rate hikes next year, long-term yields, starting at the 10-year mark, have likely been lower than economic fundamentals would suggest in part due to the demand for a “safe haven.” Investors from outside the United States have been buying longer-term Treasuries as a cushion against left-tail risks, which are not in short supply. Russia’s military buildup on the Ukrainian border has raised the risk of conflict; Turkey’s currency set new record lows, with the entire economy at risk as the central bank cut rates in line with President Recep Tayyip Erdogan’s unconventional policies; and the rapid spread of the new COVID-19 Omicron variant has raised uncertainty over global growth. Against such possibilities, Treasuries still offer the safest haven, with the best liquidity, deepest markets, and highest nominal and hedged yields among benchmark developed-sovereign rates. For example, 10-year German Bunds and 10-year Japanese Government Bonds yield -0.36% and 0.05%, respectively, vs 10-year Treasuries at 1.45%.
Typically, an inverting yield curve can signal a growth slowdown and even recession, but that is not the case now in our opinion. Although US GDP growth has likely peaked at around 5.9% this year and monetary stimulus is normalizing from its emergency setting, the latest forecasts call for healthy growth of 3.9% in 2022. Meanwhile, employment has improved to the point that some 3.4% of workers in November felt confident enough to quit their jobs, according to the latest labor market report. Finally, US credit quality is stronger than ever, with corporate bankruptcies near historical lows and states flush with cash. In a way, it can be said that the Fed simply has nothing to bail out anymore, at least at this moment. So, given the technical forces driving longer-dated Treasury yields lower than they otherwise would be if based solely on US economic fundamentals, a flat or inverted yield curve in and of itself wouldn’t necessarily be a reliable harbinger of economic recession, but it is still worth watching.
Investment ImplicationsWe believe that the pandemic was the market equivalent of a major natural disaster and what we are seeing now in the United States primarily reflects a steep climb back to normalcy, which we welcome. We still believe that inflation is rapidly approaching its peak as year-over-year comparisons begin to look less startling, economies open up, and bottlenecks in the supply chains of core durable goods resolve. Nonetheless, we acknowledge that longer-term US risk-free rates are likely too low relative to fundamentals, and we look for the US 10-year Treasury yield to rise from current levels toward 2% in the intermediate term as the global economy continues to recover.
Away from our sanguine expectations for the US economy, credit fundamentals, and the general level of interest rates, we remain deeply concerned with the potential for market liquidity disruptions. The major reason why the Fed turned to its balance sheet with such force at the onset of the COVID-19 induced shutdown was to backstop the market and alleviate the severe liquidity crisis that ensued. Absent the Fed, the market mechanisms for clearing on-demand transactions simply failed. This failure has not been addressed. In our opinion, the market’s ability to absorb abrupt changes in flows remains structurally challenged. This weakness was evident at the onset of the Fed’s recent pivot statements as bid-offer spreads in US Treasuries abruptly retraced 85% of the levels experienced during the COVID-19 episode.
Exhibit 11Market Inflation Expectations Remain Moderate
5-Year, 5-Year Forward Inflation Expectation Rate
(%)
0
1
2
3
202120202019201220172016
As of 8 December 2021
Source: Federal Reserve Bank of St. Louis
Exhibit 12US Public Debts Substantially Exceed GDP Output
Debt as a Percentage of GDP
(%)
0
30
60
90
120
150
202120112001199119811971
As of 26 August 2021
Source: Federal Reserve Bank of St. Louis
Outlook on the United States
This content represents the views of the author(s), and its conclusions may vary from those held elsewhere within Lazard Asset Management. Lazard is committed to giving our investment professionals the autonomy to develop their own investment views, which are informed by a robust exchange of ideas throughout the firm.
Notes1 M2 money supply consists of currency held by the non-bank public, demand deposits at commercial banks, travelers’ checks, time deposits, and balances in money market funds.
Important InformationOriginally published on 6 January 2022. Revised and republished on 19 January 2022.
This document reflects the views of Lazard Asset Management LLC or its affiliates (“Lazard”) based upon information believed to be reliable as of the publication date. There is no guarantee that any forecast or opinion will be realized. This document is provided by Lazard Asset Management LLC or its affiliates (“Lazard”) for informational purposes only. Nothing herein constitutes investment advice or a recommendation relating to any security, commodity, derivative, investment management service, or investment product. Investments in securities, derivatives, and commodities involve risk, will fluctuate in price, and may result in losses. Certain assets held in Lazard’s investment portfolios, in particular alternative investment portfolios, can involve high degrees of risk and volatility when compared to other assets. Similarly, certain assets held in Lazard’s investment portfolios may trade in less liquid or efficient markets, which can affect investment performance. Past performance does not guarantee future results. The views expressed herein are subject to change, and may differ from the views of other Lazard investment professionals.
This document is intended only for persons residing in jurisdictions where its distribution or availability is consistent with local laws and Lazard’s local regulatory authorizations. Please visit www.lazardassetmanagement.com/globaldisclosure for the specific Lazard entities that have issued this document and the scope of their authorized activities.
As normalization progresses but is offset by new variant outbreaks and potential geopolitical risks, we expect volatility in data and the path to recovery. Investors should be prepared for an uneven recovery as some legacy business models and industries are scrutinized for their sustainability going forward. Therefore, we strongly believe that investors need to focus on lending to viable obligors over a long term. It is imperative that investors scrutinize whom they are lending to and the terms and conditions under which they are lending. In addition, investors should consider mitigating liquidity risk by focusing on key security investment characteristics that have historically been reliable in determining institutional investor demand. Namely, we believe investors should focus on securities and obligors with key attributes, such as:
• serving an essential economic or financial function
• issuing under standardized terms and conditions
• offering in institutional markets and institutional lot sizes
• exhibiting established transition markets enabling the ability to absorb ratings downgrades
• qualifying for inclusion in major market indices