Embed Size (px)
Citation preview
8/9/2019 Manpower Employment Outlook Survey: United States - Q4, 2004
http://slidepdf.com/reader/full/manpower-employment-outlook-survey-united-states-q4-2004 1/20
4th Quarter 2004
Manpower Employment Outlook SurveyUnited States
8/9/2019 Manpower Employment Outlook Survey: United States - Q4, 2004
http://slidepdf.com/reader/full/manpower-employment-outlook-survey-united-states-q4-2004 2/20
2
Manpower Employment Outlook Survey USA
The United States Employment Outlook
ContentsUnited States Employment Outlook 2
The Americas Employment Outlook 14
Global Employment Outlook 16
About the Survey 18
About Manpower 19
Net Employment OutlookNet Employment Outlook Seasonally AdjustedSeasonally Adjusted
’89 ’90 ’91 ’92 ’93 ’94 ’95 ’96 ’97 ’98 ’99 ’00 ’01 ’02 ’03 ’04-5
0
5
10
15
20
25
30
Increase Decrease No Change Don’t KnowNet Employment
Outlook
Seasonally
Adjusted
% % % % % %
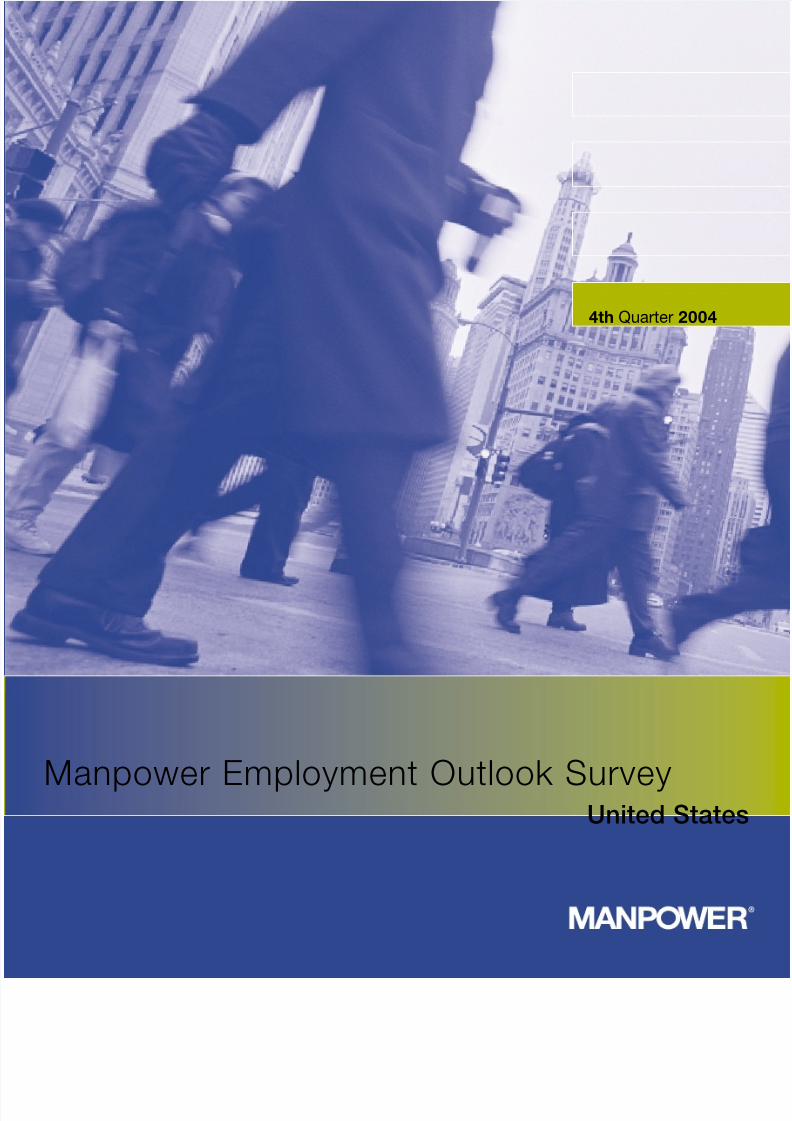
4th Quarter 2003 22 11 62 5 11 10
1st Quarter 2004 20 13 61 6 7 14
2nd Quarter 2004 28 6 62 4 22 20
3rd Quarter 2004 30 6 59 5 24 20
4th Quarter 2004 28 7 60 5 21 20
The results of the Manpower Employment Outlook Survey in the United States include Puerto Rico.
The Net Employment Outlook of 21%, which does not
take into account the seasonal factors that affect hiring,
is slightly lower than it was in the third quarter survey.
When the seasonal variations are removed from the data,
however, the employment outlook for October to December
is the same as it was in the previous two quarters, an
indication that employers intend to keep hiring stable
through the end of the year. Like the previous two
quarters, the job forecast is stronger than it has been
since the beginning months of 2001.
Hiring projections are noticeably different from a year
ago. Employers are twice as optimistic about their hiring
plans for the fourth quarter of 2004 as they were last
year at this time.
Nearly 16,000 interviews have been conducted with
employers across the United States to measure
anticipated employment trends between October and
December 2004. All participants were asked, “How do
you anticipate total employment at your location to
change in the three months to the end of December
2004 as compared to the current quarter?”
Of the U.S. employers that were surveyed, 28% plan to
add staff in the fourth quarter, while 7% expect to
reduce their payrolls. This creates a Net Employment
Outlook of 21%. Sixty percent of the hiring managers
polled anticipate no change in staff levels for the coming
quarter, and 5% are unsure of their hiring plans.

8/9/2019 Manpower Employment Outlook Survey: United States - Q4, 2004
http://slidepdf.com/reader/full/manpower-employment-outlook-survey-united-states-q4-2004 3/20
3
Net Employment
Outlook
Seasonally
AdjustedIncrease Decrease No Change Don’t Know
% % % %%%
Construction 24 12 59 125 19
Education 25 7 64 18 124
Finance, Insurance & Real Estate 23 4 68 5 19 19
Manufacturing – Durables 29 9 57 5 20 23
Manufacturing – Non-Durables 27 7 60 6 2220
Mining 25 6 65 4 1919
Public Administration 14 11 68 3 87
Services 24 8 63 5 16 20
Transportation & Public Utilities 25 5 64 6 20 18
Wholesale & Retail Trade 38 6 51 5 32 22
At the overall national level, the margin of error on the data is +/– 0.8%.
Net Employment SeasonallyIncrease Decrease No Change Don’t Know
Outlook Adjusted
% % % %
Midwest
Northeast27 8 59 6 19 1829 7 58 6 22 21
26 7 64 3 19 20
South
West 30 9 55 6 21 22
% %
According to the seasonally adjusted data, employers in the
majority of industry sectors surveyed expect to hold steady,
predicting a hiring pace similar to third quarter. These sectors
include Mining, Non-Durable Goods Manufacturing,
Transportation/Public Utilities,Wholesale/Retail Trade,Finance/
Insurance/Real Estate, Services and Public Administration.
Durable Goods Manufacturers are slightly more optimistic
about hiring in the fourth quarter, compared with the July to
September period. Construction and Education are the only
sectors for which employers anticipate softer job prospects.
Employers across the 10 industry sectors are more
confident about hiring in the fourth quarter of this year,
compared with the same period of 2003. Year-over-year
hiring plans show the most improvement in the Durable and
Non-Durable Goods Manufacturing, Wholesale/Retail Trade,
Education, Transportation/Public Utilities and Mining sectors.
Across the country, employer confidence is expected to
remain virtually unchanged in the fourth quarter, with
each of the four U.S. regions reporting employment
activity consistent with the previous quarter. Job seekers
in each region can expect to have a much easier time
with their search than a year ago. Employers in the
Northeast, Midwest and West voice hiring intentions that
are twice as strong as the fourth quarter of 2003.
Among the U.S. regions, the employment outlook is
most positive in the West and weakest in the Northeast.
This marks the third consecutive quarter that the
Northeast has lagged other regions in hiring plans.
8/9/2019 Manpower Employment Outlook Survey: United States - Q4, 2004
http://slidepdf.com/reader/full/manpower-employment-outlook-survey-united-states-q4-2004 4/20
4
Manpower Employment Outlook Survey USA
Regional Comparisons
Midwest
Net Employment
Outlook
Seasonally
AdjustedIncrease Decrease No Change Don’t Know
%%%%% %
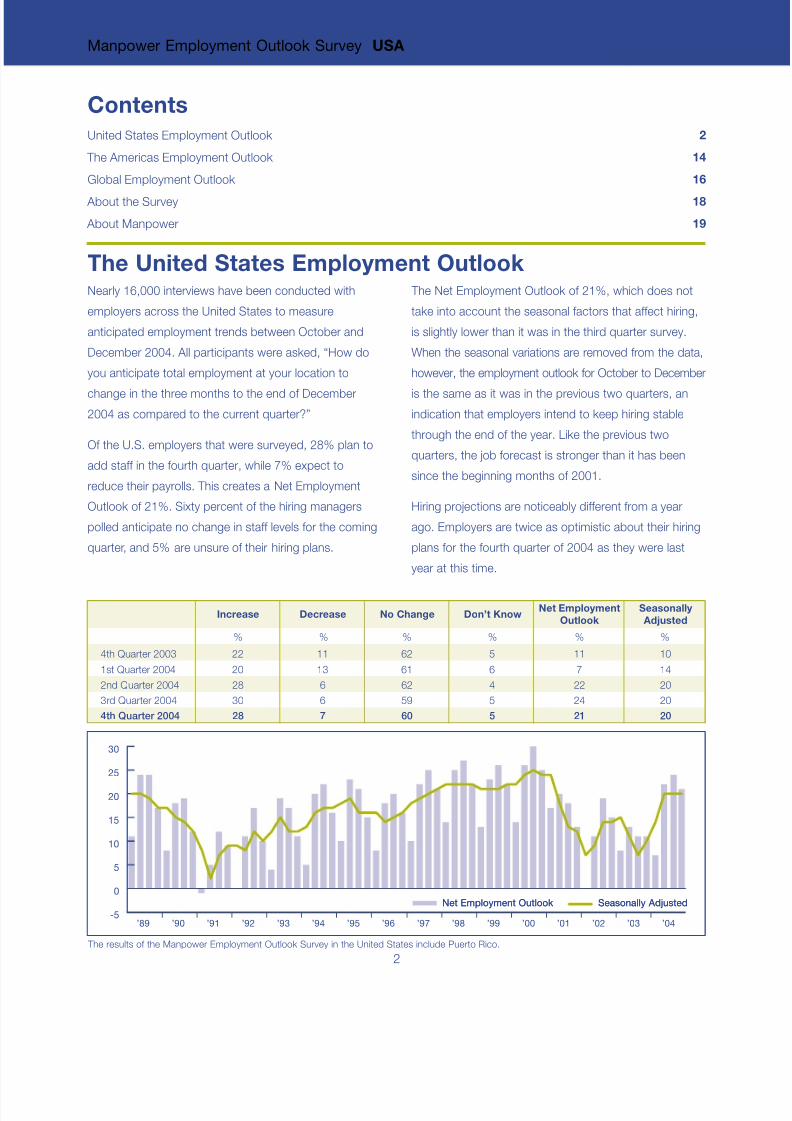
All Industries 26 7 64 3 19 20
Construction 21 19 56 4 2 18
Education 618 73 3 12 6
Finance, Insurance & Real Estate 20 3 74 3 17 17
Manufacturing – Durables 27 8 62 3 19 23
Manufacturing – Non-Durables 25 6 64 5 19 21
Mining 29 14 57 0 1615
Public Administration 11 17 68 4 -6 4
Services 21 7 69 3 14 18
Transportation & Public Utilities 26 675 2 21 22
Wholesale & Retail Trade 36 6 55 3 30 20
Net Employment OutlookNet Employment Outlook Seasonally AdjustedSeasonally Adjusted
’89 ’90 ’91 ’92 ’93 ’94 ’95 ’96 ’97 ’98 ’99 ’00 ’01 ’02 ’03 ’04-5
0
5
10
15
20
25
30
35
The Midwest Region comprises the following states: Illinois, Indiana, Iowa, Kansas, Michigan, Minnesota, Missouri, Nebraska, North Dakota, Ohio,
South Dakota, Wisconsin.
Of the employers surveyed in the Midwest, 26% plan to
add to their payrolls in the fourth quarter, while 7% expect
to slow down the hiring pace. Thus, the Net Employment
Outlook is 19%. According to the seasonally adjusted
data, job prospects for fourth quarter reveal a mounting
optimism among Midwest employers that began in the
final months of 2003.
The hiring pace is expected to remain steady with
projections similar to third quarter in half of the industry
sectors in the Midwest, including Non-Durable Goods
Manufacturing, Wholesale/Retail Trade, Services, Public
Administration and Mining. Durable Goods Manufacturing,
Transportation/Public Utilities and Finance/Insurance/Real
Estate employers anticipate a slightly more positive
outlook than the July to September period, while those
in Construction and Education foresee a mild decrease in
employment activity.
The job climate reported for the fourth quarter is decidedly
more upbeat than it was a year ago with stronger hiring
planned in each of the 10 industry sectors in the Midwest.
Durable and Non-Durable Goods Manufacturing,
Transportation/Public Utilities and Mining employers
foresee the most significant increase in hiring activity.
8/9/2019 Manpower Employment Outlook Survey: United States - Q4, 2004
http://slidepdf.com/reader/full/manpower-employment-outlook-survey-united-states-q4-2004 5/20
5
Net Employment
Outlook
Seasonally
AdjustedIncrease Decrease No Change Don’t Know
% % % % % %
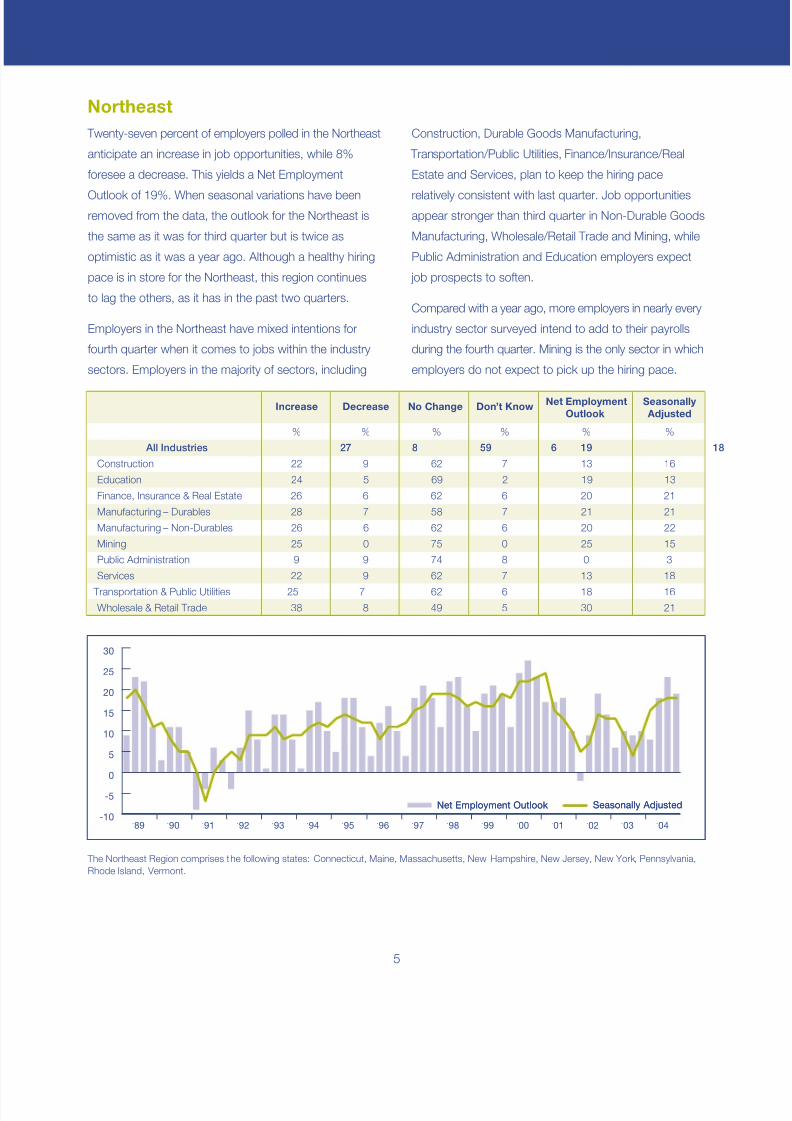
All Industries 27 8 59 6 1819
Construction 22 629 7 13 16
Education 24 5 69 2 19 13
Finance, Insurance & Real Estate 26 6 62 6 20 21
Manufacturing – Durables 28 7 58 7 21 21
Manufacturing – Non-Durables 26 6 20 22
Mining 25 0 25 15
Public Administration 9 9 0 3
Services 22 9 13 18
Transportation & Public Utilities 25 7
62
75
74
62
62
6
0
8
7
6 18 16
Wholesale & Retail Trade 38 8 49 5 30 21
Net Employment OutlookNet Employment Outlook Seasonally AdjustedSeasonally Adjusted
’89 ’90 ’91 ’92 ’93 ’94 ’95 ’96 ’97 ’98 ’99 ’00 ’01 ’02 ’03 ’04-10
-5
0
5
10
15
20
25
30
Northeast
The Northeast Region comprises the following states: Connecticut, Maine, Massachusetts, New Hampshire, New Jersey, New York, Pennsylvania,
Rhode Island, Vermont.
Twenty-seven percent of employers polled in the Northeast
anticipate an increase in job opportunities, while 8%
foresee a decrease. This yields a Net Employment
Outlook of 19%. When seasonal variations have been
removed from the data, the outlook for the Northeast is
the same as it was for third quarter but is twice as
optimistic as it was a year ago. Although a healthy hiring
pace is in store for the Northeast, this region continues
to lag the others, as it has in the past two quarters.
Employers in the Northeast have mixed intentions for
fourth quarter when it comes to jobs within the industry
sectors. Employers in the majority of sectors, including
Construction, Durable Goods Manufacturing,
Transportation/Public Utilities, Finance/Insurance/Real
Estate and Services, plan to keep the hiring pace
relatively consistent with last quarter. Job opportunities
appear stronger than third quarter in Non-Durable Goods
Manufacturing, Wholesale/Retail Trade and Mining, while
Public Administration and Education employers expect
job prospects to soften.
Compared with a year ago, more employers in nearly every
industry sector surveyed intend to add to their payrolls
during the fourth quarter. Mining is the only sector in which
employers do not expect to pick up the hiring pace.
8/9/2019 Manpower Employment Outlook Survey: United States - Q4, 2004
http://slidepdf.com/reader/full/manpower-employment-outlook-survey-united-states-q4-2004 6/20
6
Manpower Employment Outlook Survey USA
South
Net Employment
Outlook
Seasonally
AdjustedIncrease Decrease No Change Don’t Know
% % % % % %
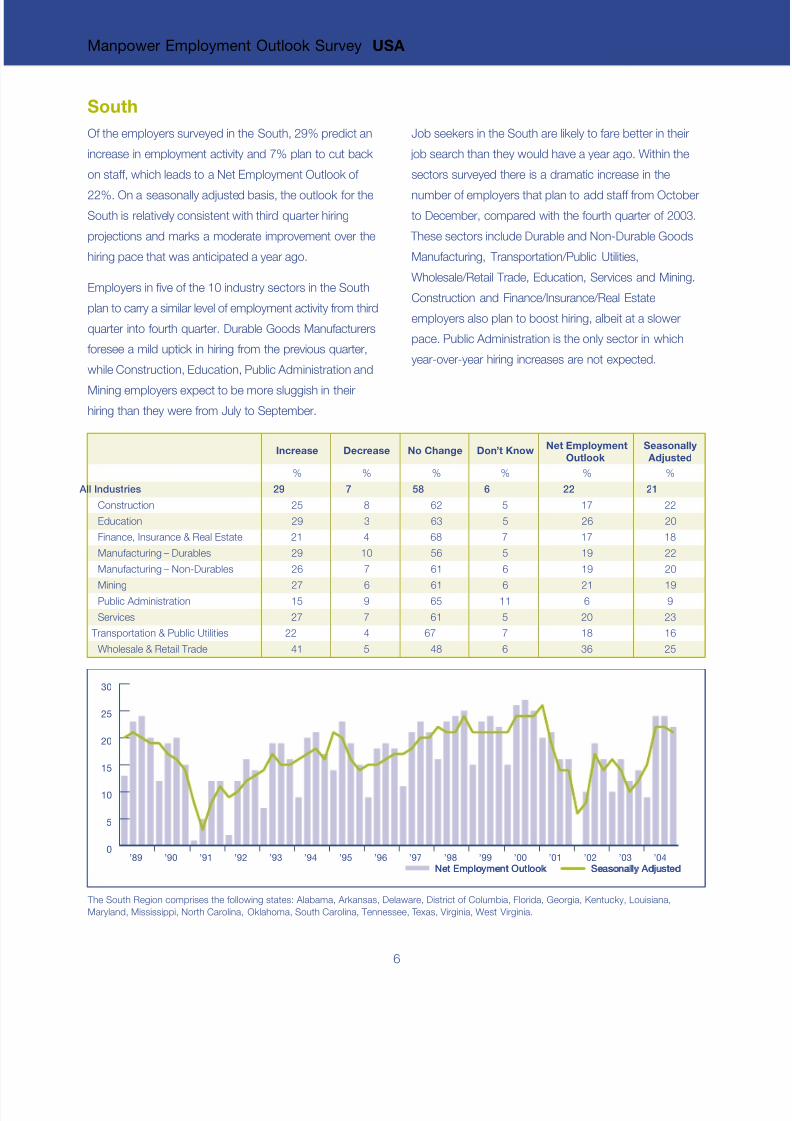
All Industries 29 7 58 6 22 21
Construction 25 628 5 17 22
Education 29 3 63 5 26 20
Finance, Insurance & Real Estate 21 4 68 7 17 18
Manufacturing – Durables 29 10 56 5 19 22
Manufacturing – Non-Durables 26 7 61 6 19 20
Mining 27 6 61 6 21 19Public Administration 15 659 11 6 9
Services 27 7 61 5 20 23
Transportation & Public Utilities 22 674 7 18 16
Wholesale & Retail Trade 41 5 48 6 36 25
Net Employment OutlookNet Employment Outlook Seasonally AdjustedSeasonally Adjusted’89 ’90 ’91 ’92 ’93 ’94 ’95 ’96 ’97 ’98 ’99 ’00 ’01 ’02 ’03 ’04
0
5
10
15
20
25
30
The South Region comprises the following states: Alabama, Arkansas, Delaware, District of Columbia, Florida, Georgia, Kentucky, Louisiana,
Maryland, Mississippi, North Carolina, Oklahoma, South Carolina, Tennessee, Texas, Virginia, West Virginia.
Of the employers surveyed in the South, 29% predict an
increase in employment activity and 7% plan to cut back
on staff, which leads to a Net Employment Outlook of
22%. On a seasonally adjusted basis, the outlook for the
South is relatively consistent with third quarter hiring
projections and marks a moderate improvement over the
hiring pace that was anticipated a year ago.
Employers in five of the 10 industry sectors in the South
plan to carry a similar level of employment activity from third
quarter into fourth quarter. Durable Goods Manufacturers
foresee a mild uptick in hiring from the previous quarter,
while Construction, Education, Public Administration and
Mining employers expect to be more sluggish in theirhiring than they were from July to September.
Job seekers in the South are likely to fare better in their
job search than they would have a year ago. Within the
sectors surveyed there is a dramatic increase in the
number of employers that plan to add staff from October
to December, compared with the fourth quarter of 2003.
These sectors include Durable and Non-Durable Goods
Manufacturing, Transportation/Public Utilities,
Wholesale/Retail Trade, Education, Services and Mining.
Construction and Finance/Insurance/Real Estate
employers also plan to boost hiring, albeit at a slower
pace. Public Administration is the only sector in which
year-over-year hiring increases are not expected.
8/9/2019 Manpower Employment Outlook Survey: United States - Q4, 2004
http://slidepdf.com/reader/full/manpower-employment-outlook-survey-united-states-q4-2004 7/20
7
West
Net EmploymentOutlook
Seasonally Adjusted
Increase Decrease No Change Don’t Know
% % % % % %
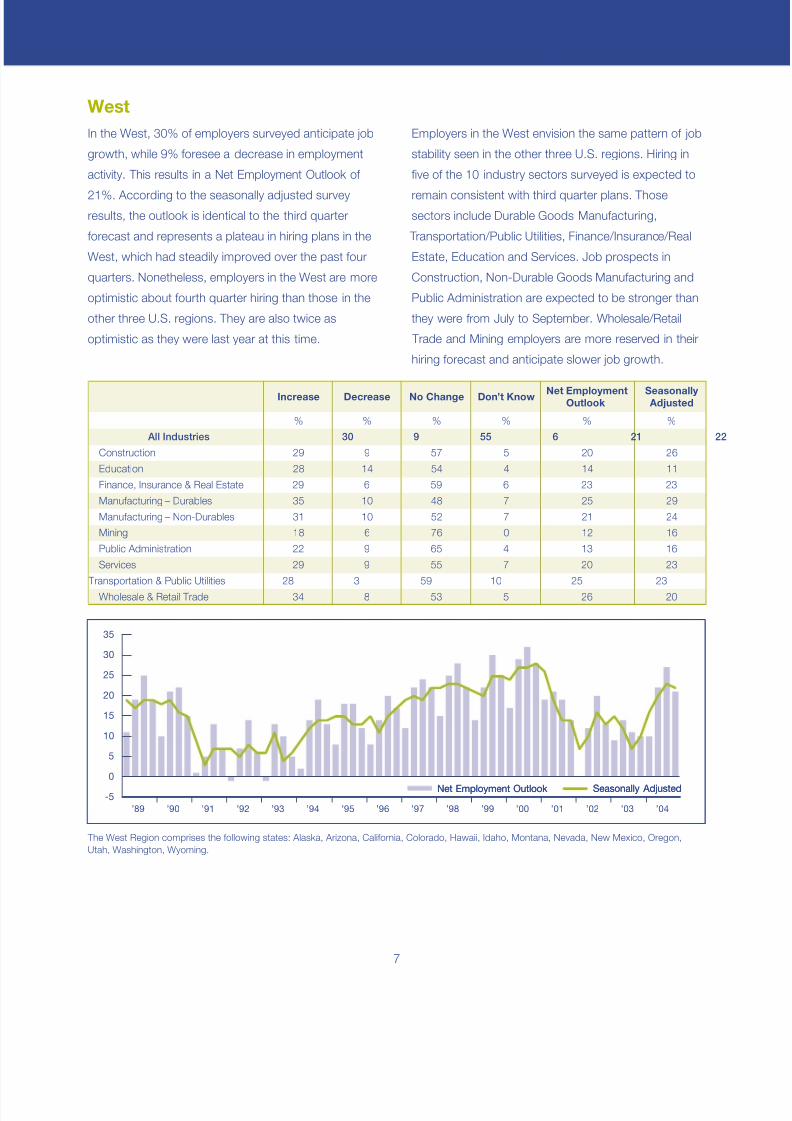
All Industries 30 9 55 6 21 22
Construction 29 9 57 5 20 26
Education 28 14 54 4 14 11
Finance, Insurance & Real Estate 29 6 59 6 23 23
Manufacturing – Durables 35 10 48 7 25 29
Manufacturing – Non-Durables 31 10 52 7 21 24
Mining 18 6 76 0 12 16
Public Administration 22 9 65 4 13 16
Services 29 9 55 7 20 23
Transportation & Public Utilities 28 3 59 10 25 23
Wholesale & Retail Trade 34 8 53 5 26 20
Net Employment OutlookNet Employment Outlook Seasonally AdjustedSeasonally Adjusted
’89 ’90 ’91 ’92 ’93 ’94 ’95 ’96 ’97 ’98 ’99 ’00 ’01 ’02 ’03 ’04
-5
0
5
10
15
20
25
30
35
The West Region comprises the following states: Alaska, Arizona, California, Colorado, Hawaii, Idaho, Montana, Nevada, New Mexico, Oregon,
Utah, Washington, Wyoming.
In the West, 30% of employers surveyed anticipate job
growth, while 9% foresee a decrease in employment
activity. This results in a Net Employment Outlook of
21%. According to the seasonally adjusted survey
results, the outlook is identical to the third quarter
forecast and represents a plateau in hiring plans in the
West, which had steadily improved over the past four
quarters. Nonetheless, employers in the West are more
optimistic about fourth quarter hiring than those in the
other three U.S. regions. They are also twice as
optimistic as they were last year at this time.
Employers in the West envision the same pattern of job
stability seen in the other three U.S. regions. Hiring in
five of the 10 industry sectors surveyed is expected to
remain consistent with third quarter plans. Those
sectors include Durable Goods Manufacturing,
Transportation/Public Utilities, Finance/Insurance/Real
Estate, Education and Services. Job prospects in
Construction, Non-Durable Goods Manufacturing and
Public Administration are expected to be stronger than
they were from July to September. Wholesale/Retail
Trade and Mining employers are more reserved in their
hiring forecast and anticipate slower job growth.
8/9/2019 Manpower Employment Outlook Survey: United States - Q4, 2004
http://slidepdf.com/reader/full/manpower-employment-outlook-survey-united-states-q4-2004 8/20
8
Manpower Employment Outlook Survey USA
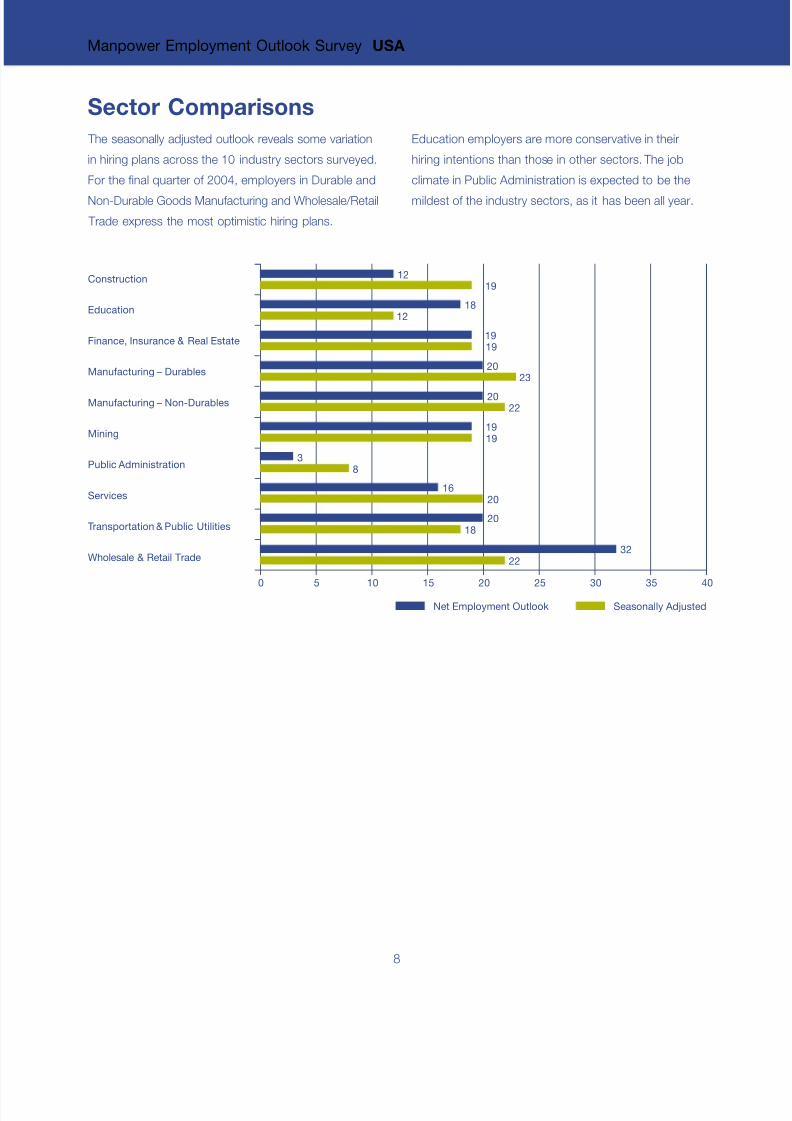
Sector Comparisons
The seasonally adjusted outlook reveals some variation
in hiring plans across the 10 industry sectors surveyed.
For the final quarter of 2004, employers in Durable and
Non-Durable Goods Manufacturing and Wholesale/Retail
Trade express the most optimistic hiring plans.
Education employers are more conservative in their
hiring intentions than those in other sectors. The job
climate in Public Administration is expected to be the
mildest of the industry sectors, as it has been all year.
Construction
Education
Finance, Insurance & Real Estate
Manufacturing – Durables
Manufacturing – Non-Durables
Mining
Public Administration
Services
Transportation & Public Utilities
Wholesale & Retail Trade
19
19
1812
0 40
1919
38
16
18
20
3222
2023
20
20
22
19
Net Employment Outlook Seasonally Adjusted
12
5 10 15 20 25 30 35
8/9/2019 Manpower Employment Outlook Survey: United States - Q4, 2004
http://slidepdf.com/reader/full/manpower-employment-outlook-survey-united-states-q4-2004 9/20
9
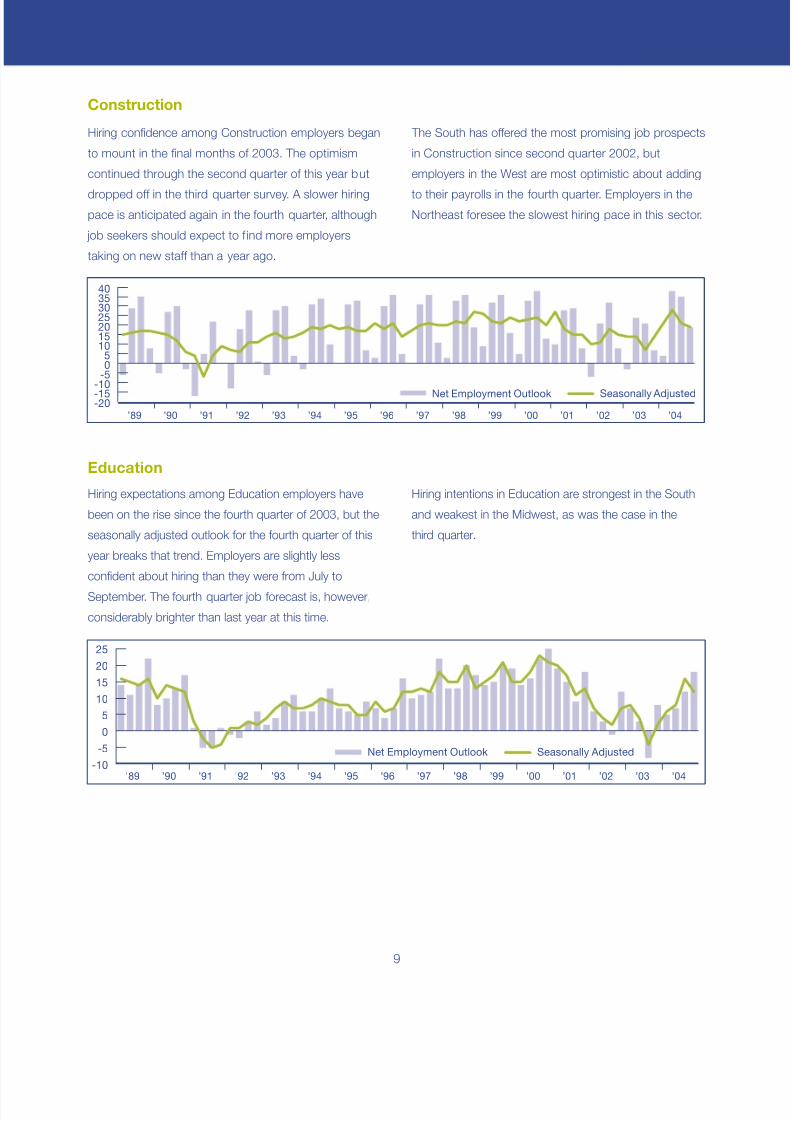
Construction
Net Employment Outlook Seasonally Adjusted
’89 ’90 ’91 ’92 ’93 ’94 ’95 ’96 ’97 ’98 ’99 ’00 ’01 ’02 ’03 ’04-20-15-10
-505
10152025303540
Hiring confidence among Construction employers began
to mount in the final months of 2003. The optimism
continued through the second quarter of this year but
dropped off in the third quarter survey. A slower hiringpace is anticipated again in the fourth quarter, although
job seekers should expect to f ind more employers
taking on new staff than a year ago.
The South has offered the most promising job prospects
in Construction since second quarter 2002, but
employers in the West are most optimistic about adding
to their payrolls in the fourth quarter. Employers in theNortheast foresee the slowest hiring pace in this sector.
Education
Net Employment Outlook Seasonally Adjusted
’89 ’90 ’91 ’92 ’93 ’94 ’95 ’96 ’97 ’98 ’99 ’00 ’01 ’02 ’03 ’04-10
-5
0
5
10
15
20
25
Hiring expectations among Education employers have
been on the rise since the fourth quarter of 2003, but the
seasonally adjusted outlook for the fourth quarter of this
year breaks that trend. Employers are slightly less
confident about hiring than they were from July to
September. The fourth quarter job forecast is, however,
considerably brighter than last year at this time.
Hiring intentions in Education are strongest in the South
and weakest in the Midwest, as was the case in the
third quarter.
8/9/2019 Manpower Employment Outlook Survey: United States - Q4, 2004
http://slidepdf.com/reader/full/manpower-employment-outlook-survey-united-states-q4-2004 10/20
10
Manpower Employment Outlook Survey USA
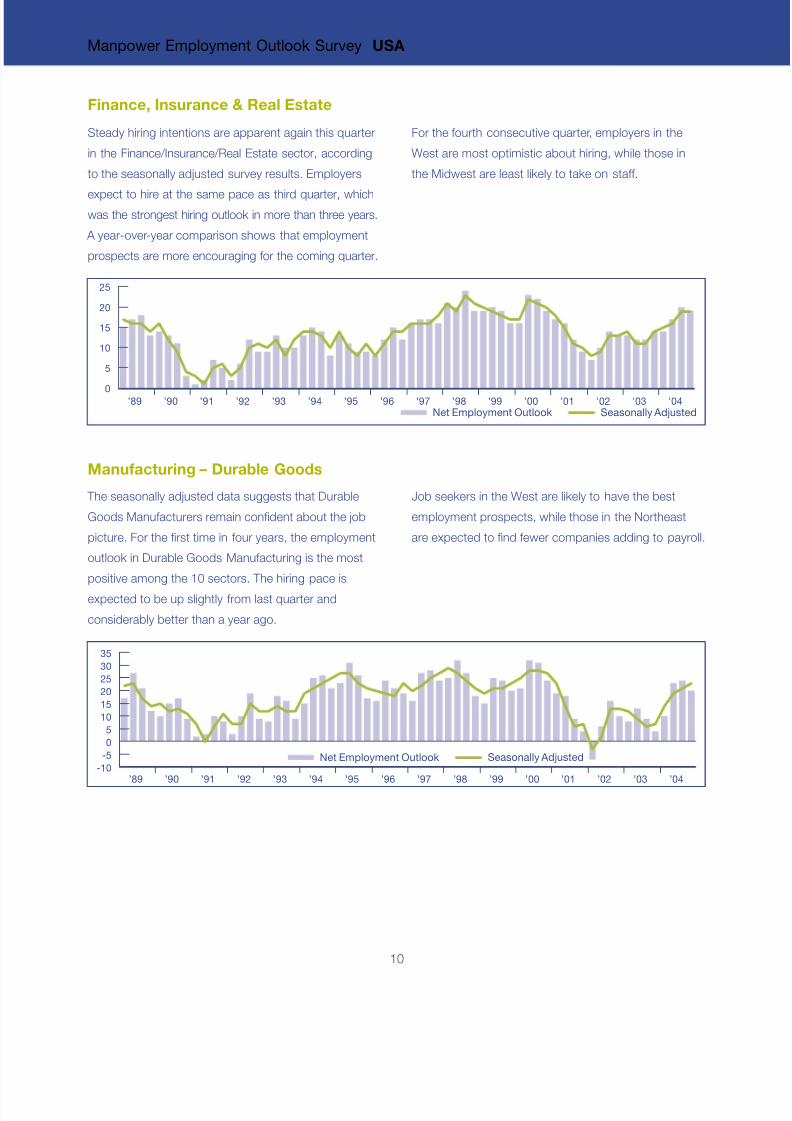
Manufacturing – Durable Goods
Net Employment Outlook Seasonally Adjusted
’89 ’90 ’91 ’92 ’93 ’94 ’95 ’96 ’97 ’98 ’99 ’00 ’01 ’02 ’03 ’04
-10
-5
0
5
10
15
20
25
30
35
The seasonally adjusted data suggests that Durable
Goods Manufacturers remain confident about the job
picture. For the first time in four years, the employment
outlook in Durable Goods Manufacturing is the most
positive among the 10 sectors. The hiring pace is
expected to be up slightly from last quarter and
considerably better than a year ago.
Job seekers in the West are likely to have the best
employment prospects, while those in the Northeast
are expected to find fewer companies adding to payroll.
Finance, Insurance & Real Estate
Net Employment Outlook Seasonally Adjusted’89 ’90 ’91 ’92 ’93 ’94 ’95 ’96 ’97 ’98 ’99 ’00 ’01 ’02 ’03 ’04
0
5
10
15
20
25
Steady hiring intentions are apparent again this quarter
in the Finance/Insurance/Real Estate sector, according
to the seasonally adjusted survey results. Employers
expect to hire at the same pace as third quarter, whichwas the strongest hiring outlook in more than three years.
A year-over-year comparison shows that employment
prospects are more encouraging for the coming quarter.
For the fourth consecutive quarter, employers in the
West are most optimistic about hiring, while those in
the Midwest are least likely to take on staff.
8/9/2019 Manpower Employment Outlook Survey: United States - Q4, 2004
http://slidepdf.com/reader/full/manpower-employment-outlook-survey-united-states-q4-2004 11/20
11
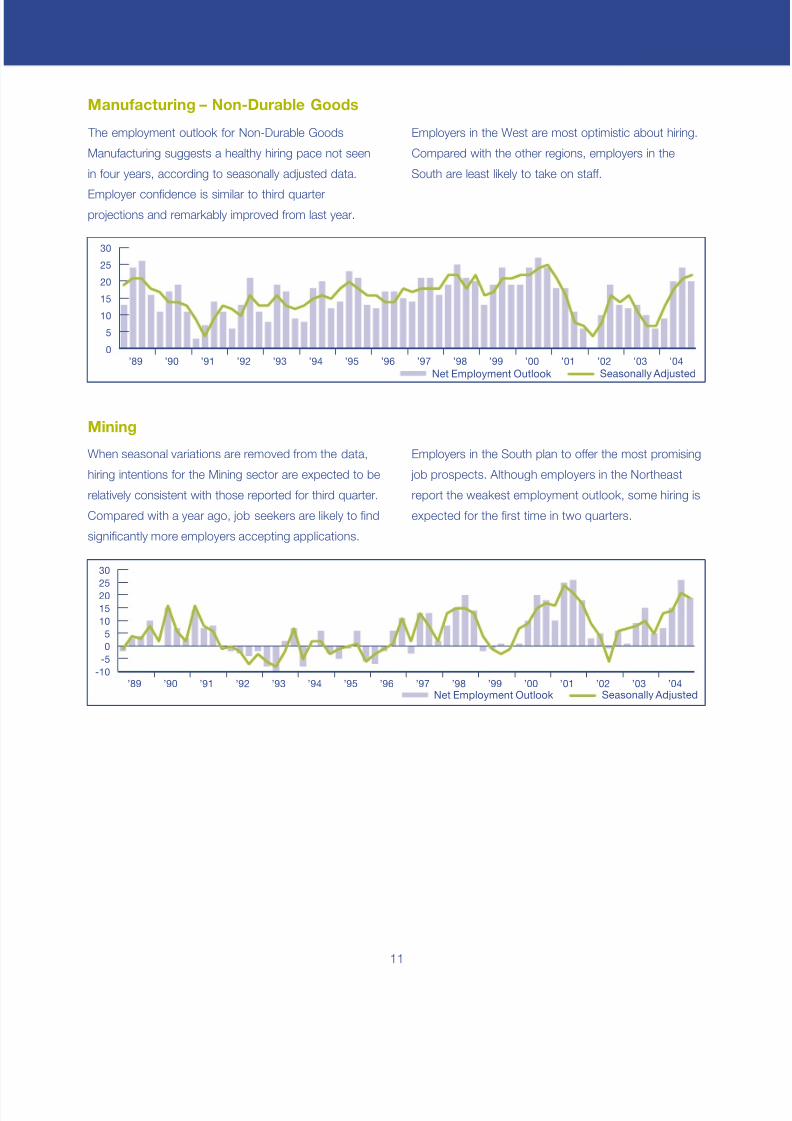
Mining
When seasonal variations are removed from the data,
hiring intentions for the Mining sector are expected to be
relatively consistent with those reported for third quarter.
Compared with a year ago, job seekers are likely to find
significantly more employers accepting applications.
Employers in the South plan to offer the most promising
job prospects. Although employers in the Northeast
report the weakest employment outlook, some hiring is
expected for the first time in two quarters.
Manufacturing – Non-Durable Goods
Net Employment Outlook Seasonally Adjusted’89 ’90 ’91 ’92 ’93 ’94 ’95 ’96 ’97 ’98 ’99 ’00 ’01 ’02 ’03 ’04
0
5
10
15
20
25
30
The employment outlook for Non-Durable Goods
Manufacturing suggests a healthy hiring pace not seen
in four years, according to seasonally adjusted data.
Employer confidence is similar to third quarterprojections and remarkably improved from last year.
Employers in the West are most optimistic about hiring.
Compared with the other regions, employers in the
South are least likely to take on staff.
Net Employment Outlook Seasonally Adjusted’89 ’90 ’91 ’92 ’93 ’94 ’95 ’96 ’97 ’98 ’99 ’00 ’01 ’02 ’03 ’04
-10
-5
0
5
10
15
2025
30
8/9/2019 Manpower Employment Outlook Survey: United States - Q4, 2004
http://slidepdf.com/reader/full/manpower-employment-outlook-survey-united-states-q4-2004 12/20
12
Manpower Employment Outlook Survey USA
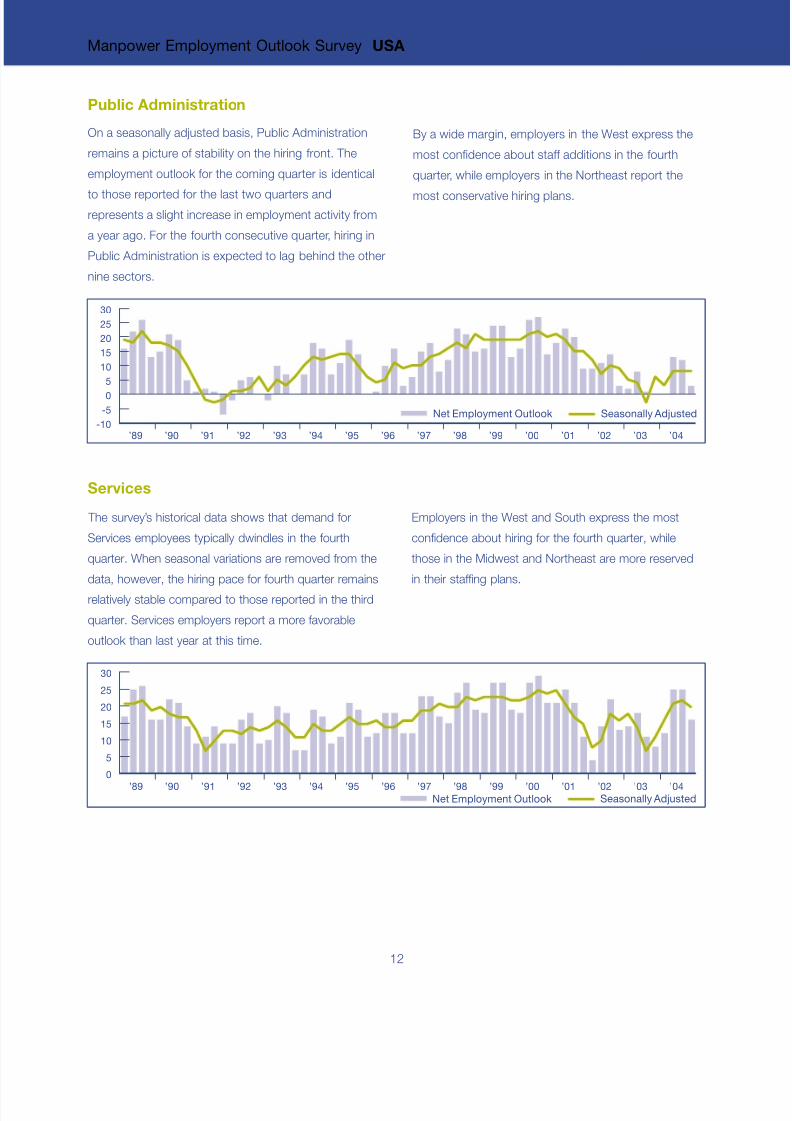
Public Administration
On a seasonally adjusted basis, Public Administration
remains a picture of stability on the hiring front. The
employment outlook for the coming quarter is identical
to those reported for the last two quarters andrepresents a slight increase in employment activity from
a year ago. For the fourth consecutive quarter, hiring in
Public Administration is expected to lag behind the other
nine sectors.
By a wide margin, employers in the West express the
most confidence about staff additions in the fourth
quarter, while employers in the Northeast report the
most conservative hiring plans.
Net Employment Outlook Seasonally Adjusted
’89 ’90 ’91 ’92 ’93 ’94 ’95 ’96 ’97 ’98 ’99 ’00 ’01 ’02 ’03 ’04-10
-5
0
5
10
15
20
25
30
Services
Net Employment Outlook Seasonally Adjusted’89 ’90 ’91 ’92 ’93 ’94 ’95 ’96 ’97 ’98 ’99 ’00 ’01 ’02 ’03 ’04
0
5
10
15
20
25
30
The survey’s historical data shows that demand for
Services employees typically dwindles in the fourth
quarter. When seasonal variations are removed from the
data, however, the hiring pace for fourth quarter remains
relatively stable compared to those reported in the third
quarter. Services employers report a more favorable
outlook than last year at this time.
Employers in the West and South express the most
confidence about hiring for the fourth quarter, while
those in the Midwest and Northeast are more reserved
in their staffing plans.
8/9/2019 Manpower Employment Outlook Survey: United States - Q4, 2004
http://slidepdf.com/reader/full/manpower-employment-outlook-survey-united-states-q4-2004 13/20
13
Wholesale & Retail Trade
Net Employment Outlook Seasonally Adjusted
’89 ’90 ’91 ’92 ’93 ’94 ’95 ’96 ’97 ’98 ’99 ’00 ’01 ’02 ’03 ’04-15-10
-505
101520253035
Transportation & Public Utilities
Net Employment Outlook Seasonally Adjusted
’89 ’90 ’91 ’92 ’93 ’94 ’95 ’96 ’97 ’98 ’99 ’00 ’01 ’02 ’03 ’04
-5
0
5
10
15
20
25
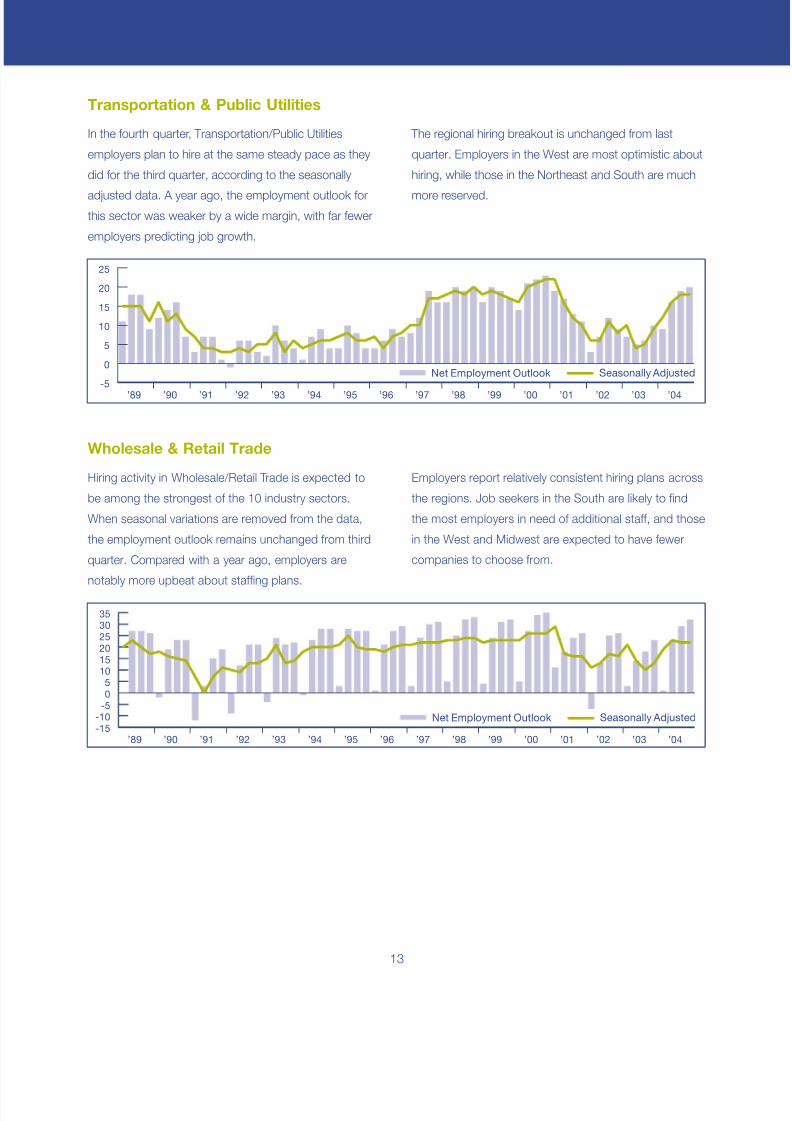
In the fourth quarter, Transportation/Public Utilities
employers plan to hire at the same steady pace as they
did for the third quarter, according to the seasonally
adjusted data. A year ago, the employment outlook for
this sector was weaker by a wide margin, with far fewer
employers predicting job growth.
The regional hiring breakout is unchanged from last
quarter. Employers in the West are most optimistic about
hiring, while those in the Northeast and South are much
more reserved.
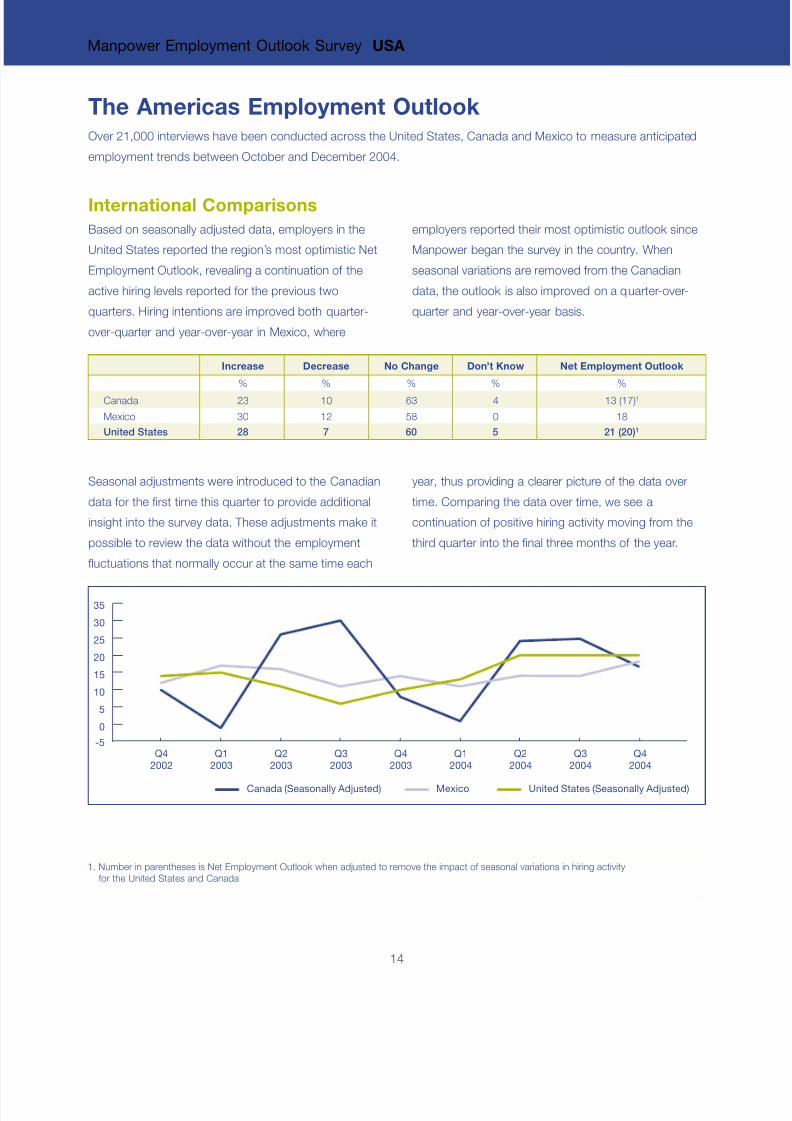
Hiring activity in Wholesale/Retail Trade is expected to
be among the strongest of the 10 industry sectors.
When seasonal variations are removed from the data,
the employment outlook remains unchanged from third
quarter. Compared with a year ago, employers are
notably more upbeat about staffing plans.
Employers report relatively consistent hiring plans across
the regions. Job seekers in the South are likely to find
the most employers in need of additional staff, and those
in the West and Midwest are expected to have fewer
companies to choose from.
8/9/2019 Manpower Employment Outlook Survey: United States - Q4, 2004
http://slidepdf.com/reader/full/manpower-employment-outlook-survey-united-states-q4-2004 14/20
14
Manpower Employment Outlook Survey USA
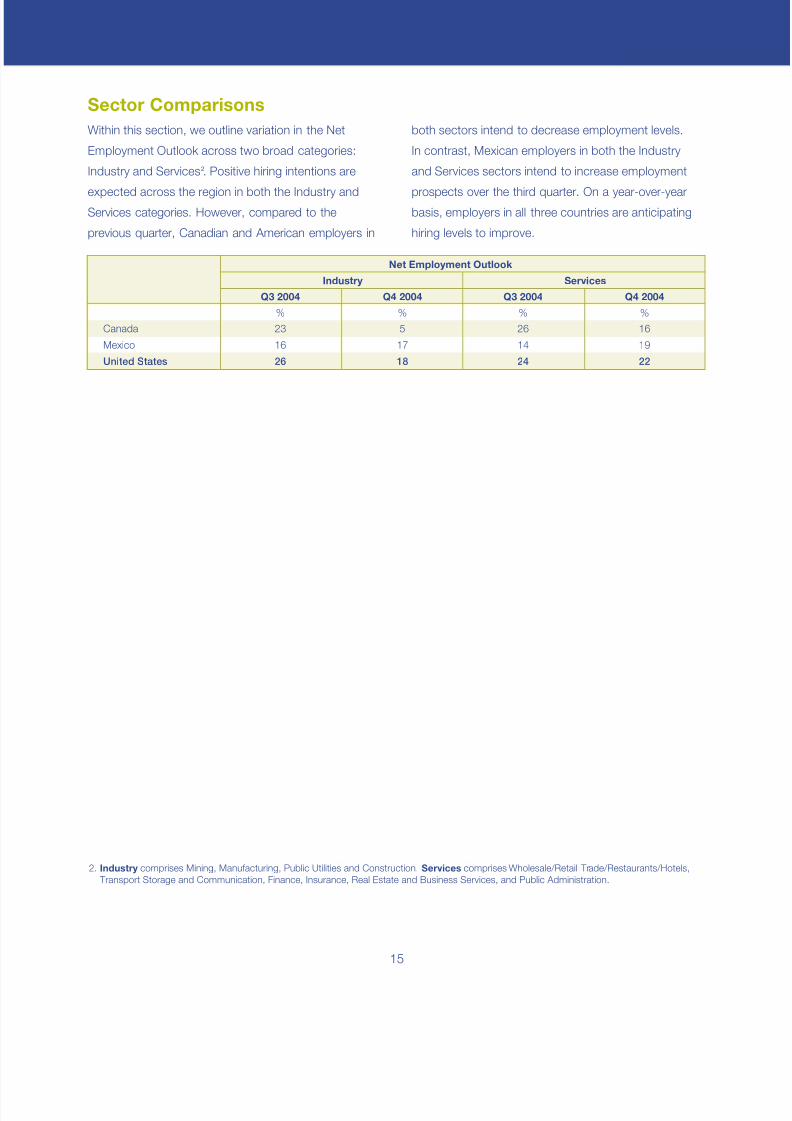
The Americas Employment OutlookOver 21,000 interviews have been conducted across the United States, Canada and Mexico to measure anticipated
employment trends between October and December 2004.
International Comparisons
Seasonal adjustments were introduced to the Canadian
data for the first time this quarter to provide additional
insight into the survey data. These adjustments make it
possible to review the data without the employment
fluctuations that normally occur at the same time each
year, thus providing a clearer picture of the data over
time. Comparing the data over time, we see a
continuation of positive hiring activity moving from the
third quarter into the final three months of the year.
1. Number in parentheses is Net Employment Outlook when adjusted to remove the impact of seasonal variations in hiring activity
for the United States and Canada.
Increase Decrease No Change Don’t Know Net Employment Outlook
% % % % %
Canada 23 10 63 4 13 (17)1
Mexico 30 12 58 0 18
United States 28 7 60 5 21 (20)1
-5
0
5
10
15
20
25
30
35
United States (Seasonally Adjusted)MexicoCanada (Seasonally Adjusted)
Q42002
Q12003
Q22003
Q32003
Q42003
Q12004
Q22004
Q32004
Q42004
Based on seasonally adjusted data, employers in the
United States reported the region’s most optimistic Net
Employment Outlook, revealing a continuation of the
active hiring levels reported for the previous two
quarters. Hiring intentions are improved both quarter-
over-quarter and year-over-year in Mexico, where
employers reported their most optimistic outlook since
Manpower began the survey in the country. When
seasonal variations are removed from the Canadian
data, the outlook is also improved on a quarter-over-
quarter and year-over-year basis.
8/9/2019 Manpower Employment Outlook Survey: United States - Q4, 2004
http://slidepdf.com/reader/full/manpower-employment-outlook-survey-united-states-q4-2004 15/20
15
Sector Comparisons
both sectors intend to decrease employment levels.
In contrast, Mexican employers in both the Industry
and Services sectors intend to increase employment
prospects over the third quarter. On a year-over-yearbasis, employers in all three countries are anticipating
hiring levels to improve.
2. Industry comprises Mining, Manufacturing, Public Utilities and Construction. Services comprises Wholesale/Retail Trade/Restaurants/Hotels,
Transport Storage and Communication, Finance, Insurance, Real Estate and Business Services, and Public Administration.
Canada
%
16
Net Employment Outlook
Industry Services
%
23
Q3 2004
%
26
Q3 2004
%
5
United States 2226 2418
Mexico 1916 1417
Q4 2004 Q4 2004
Within this section, we outline variation in the Net
Employment Outlook across two broad categories:
Industry and Services2. Positive hiring intentions are
expected across the region in both the Industry andServices categories. However, compared to the
previous quarter, Canadian and American employers in
8/9/2019 Manpower Employment Outlook Survey: United States - Q4, 2004
http://slidepdf.com/reader/full/manpower-employment-outlook-survey-united-states-q4-2004 16/20
16
Manpower Employment Outlook Survey USA
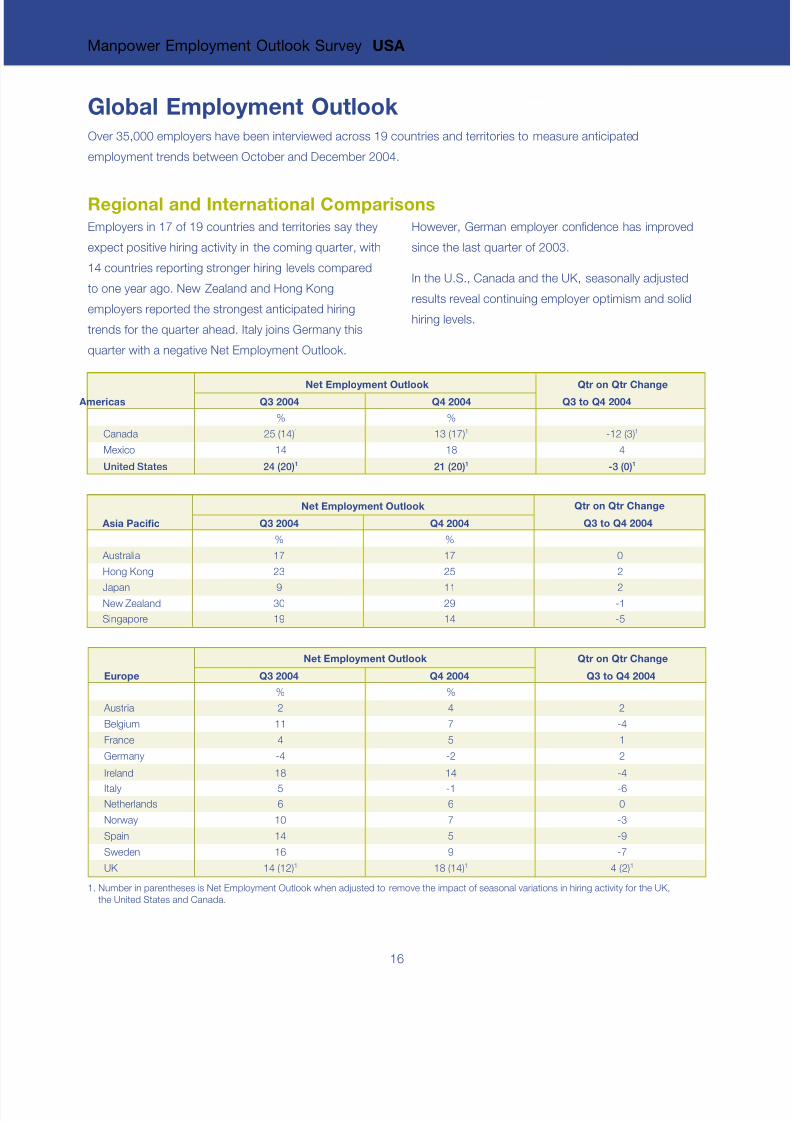
Global Employment OutlookOver 35,000 employers have been interviewed across 19 countries and territories to measure anticipated
employment trends between October and December 2004.
Net Employment Outlook Qtr on Qtr Change
Americas Q3 to Q4 2004
Canada -12 (3)1
Mexico 4
United States
Q3 2004
%
25 (14)1
14
24 (20)1
Q4 2004
%
13 (17)1
18
21 (20)1 -3 (0)1
Net Employment Outlook
Asia Pacific
Australia 0
Hong Kong 2
Japan 2New Zealand
Q4 2004
%
17
25
1129
Q3 2004
%
17
23
930 -1
Singapore 1419 -5
Qtr on Qtr Change
Q3 to Q4 2004
Net Employment Outlook Qtr on Qtr Change
Europe Q3 to Q4 2004
Austria 2
Belgium -4
France 1
Germany 2
Ireland -4
Netherlands 0
Norway -3
Spain -9
Sweden -7
UK 4 (2)1
Italy
Q3 2004
%
2
11
4
-4
18
6
10
14
16
14 (12)1
5
Q4 2004
%
4
7
5
-2
14
6
7
5
9
18 (14)1
-1 -6
1. Number in parentheses is Net Employment Outlook when adjusted to remove the impact of seasonal variations in hiring activity for the UK,
the United States and Canada.
Regional and International ComparisonsHowever, German employer confidence has improved
since the last quarter of 2003.
In the U.S., Canada and the UK, seasonally adjusted
results reveal continuing employer optimism and solid
hiring levels.
Employers in 17 of 19 countries and territories say they
expect positive hiring activity in the coming quarter, with
14 countries reporting stronger hiring levels compared
to one year ago. New Zealand and Hong Kong
employers reported the strongest anticipated hiring
trends for the quarter ahead. Italy joins Germany this
quarter with a negative Net Employment Outlook.
8/9/2019 Manpower Employment Outlook Survey: United States - Q4, 2004
http://slidepdf.com/reader/full/manpower-employment-outlook-survey-united-states-q4-2004 17/20
17
Sector Comparisons
2. Industry comprises Mining, Manufacturing, Public Utilities and Construction. Services comprises Wholesale/Retail Trade/Restaurants/Hotels,
Transport, Storage & Communication, Finance, Insurance, Real Estate & Business Services, and Public Administration.
Canada
%
16
Net Employment Outlook
Industry Services
Americas
%
23
Q3 2004
%
26
Q3 2004
%
5
United States 2226 2418
Mexico 1916 1417
Q4 2004 Q4 2004
%%
Japan 11 11
Net Employment Outlook
Industry Services
Asia Pacific
%
6
Q3 2004 Q3 2004
%
Australia 17 1816 14
Hong Kong 28 3013 12
11
New Zealand 32 3427 28
Singapore 22 129 15
Q4 2004 Q4 2004
%%
Ireland 2113 1317
Italy 7-3 03
Net Employment Outlook
Industry Services
Europe
%
Q3 2004 Q3 2004
%
France 2 5 62
Germany -3 -1-4 -4
Austria 421 2
Belgium 11 79 5
Norway 106 810
Netherlands 66 68
UK 1316 1914
Sweden 1511 922
Spain 19 45 9
Q4 2004 Q4 2004
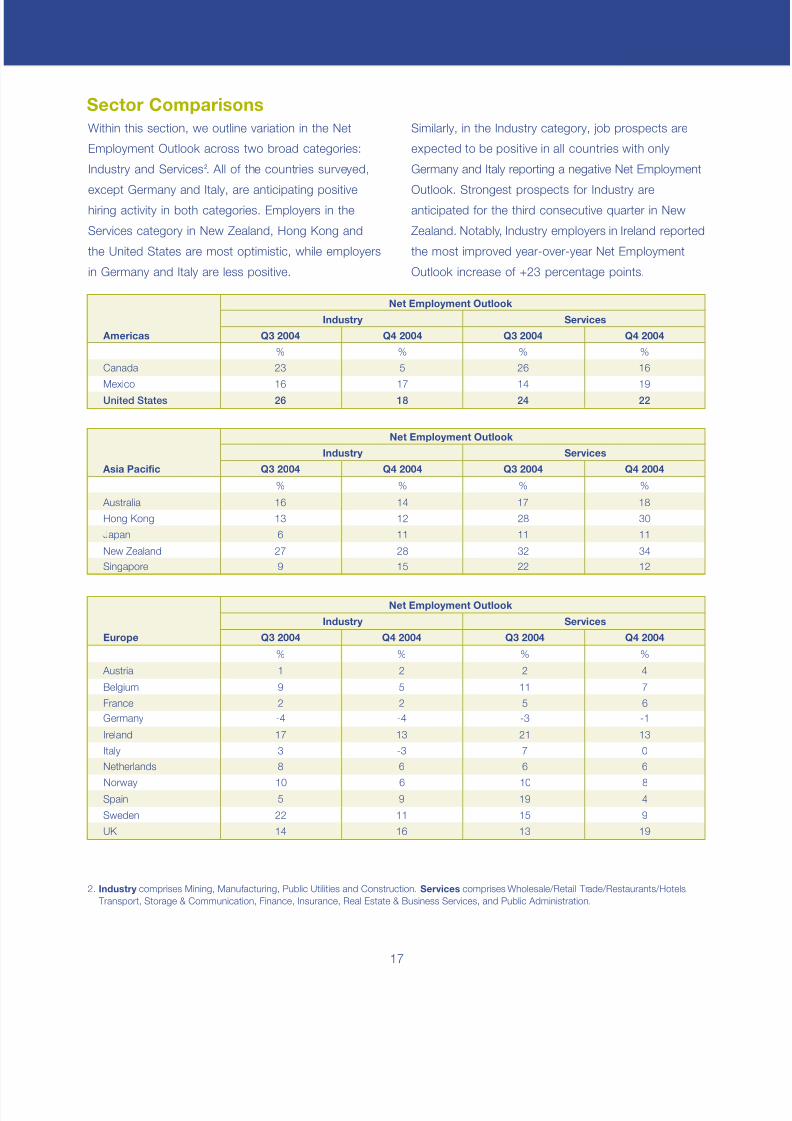
Similarly, in the Industry category, job prospects are
expected to be positive in all countries with only
Germany and Italy reporting a negative Net Employment
Outlook. Strongest prospects for Industry areanticipated for the third consecutive quarter in New
Zealand. Notably, Industry employers in Ireland reported
the most improved year-over-year Net Employment
Outlook increase of +23 percentage points.
Within this section, we outline variation in the Net
Employment Outlook across two broad categories:
Industry and Services2. All of the countries surveyed,
except Germany and Italy, are anticipating positivehiring activity in both categories. Employers in the
Services category in New Zealand, Hong Kong and
the United States are most optimistic, while employers
in Germany and Italy are less positive.
8/9/2019 Manpower Employment Outlook Survey: United States - Q4, 2004
http://slidepdf.com/reader/full/manpower-employment-outlook-survey-united-states-q4-2004 18/20
18
Manpower Employment Outlook Survey USA
About the Survey The Manpower Employment Outlook Survey is conducted
quarterly to measure employers’ intentions to increase or
decrease the number of employees in their workforce during
the next quarter. The survey has been running for more than 40
years and is one of the most trusted surveys of employmentactivity in the world. Various factors underpin the success of
the Manpower Employment Outlook Survey:
Unique: It is unparalleled in its size, scope, longevity and area
of focus.
Projective: The Manpower Employment Outlook Survey is the
only forward-looking survey, asking employers to forecast
employment over the next quarter. In contrast, other surveys
and studies focus on retrospective data to report on what
occurred in the past.
Focused: For more than four decades, the survey has derived
all of its information from a single question.
Independent: The survey is conducted with a representative
sample of employers from throughout the countries in which it
is conducted. The survey participants are not derived from
Manpower’s customer base.
Robust: The survey is based on interviews with more than
35,000 public and private employers across 19 national
economies to measure anticipated employment trends each
quarter. This sample allows for analysis to be performed across
specific sectors and regions to provide more detailed information.
Methodology
The Manpower Employment Outlook Survey is conducted using
a validated methodology, in accordance with the higheststandards in market research. The research team for the 19
countries and territories where the survey is currently conducted
includes Manpower’s Market Intelligence team; the Organization
Research and Analysis Division of Right Management
Consultants – an independent operating division of Manpower
Inc.; NOP World and Grupo IDM. The survey has been
structured to be representative of each national economy. The
margin of error for all national, regional and global data is not
greater than +/- 4.2%.
In the United States, the national survey is conducted by
Manpower’s North American Market Intelligence Team and
includes 16,000 employers. With this number of interviews, the
margin of error for the United States survey is +/- 0.8%.
Survey Question
All employers participating in the survey worldwide are asked
the same question, “How do you anticipate total employment
at your location to change in the three months to the end of
December 2004 as compared to the current quarter?”
Net Employment Outlook Throughout this report, we use the term “Net Employment
Outlook”. This figure is derived by taking the percentage of
employers anticipating an increase in hiring activity and
subtracting from this the percentage of employers that expect to
see a decrease in employment at their location in the next quarter.
The result of this calculation is the Net Employment Outlook.
Seasonal Adjustment
Seasonal adjustments have been applied to the data for
Canada, the United States and United Kingdom to provide
additional insight into the survey data. These adjustments
make it possible to review the data without the employmentfluctuations that normally occur at the same time each year,
thus providing a clearer picture of the data over time. Manpower
intends to add seasonal adjustments to the data for other
countries in the future, as more historical data is compiled.
Sectors
The industry sectors that are reported for each country in this
report are representative of the local economy. In some areas
of the report, we have reported the data in two broad sector
categories: Industry and Services. These categories are
consistent with standards of other respected international data
sources. The “Industry” category includes sectors such as:
construction, manufacturing, mining and public utilities. The
“Services” category includes wholesale and retail trade;
restaurants and hotels; transportation and storage;
communication; finance; insurance; real estate; other business
services and public administration.
8/9/2019 Manpower Employment Outlook Survey: United States - Q4, 2004
http://slidepdf.com/reader/full/manpower-employment-outlook-survey-united-states-q4-2004 19/20
19
History of the Survey
1962 1st generation of the Manpower Employment Outlook
Survey launched in the United States and Canada.
1966 Manpower’s UK operation launches the equivalent of
the United States survey, naming the report the
Quarterly Survey of Employment Prospects. The survey
adopts the same forward-looking research format as the
United States survey and is the first of its kind in
Europe.
1976 2nd generation of Manpower’s Employment Outlook
Survey launched in the United States and Canada.
Research methodology is updated to evolve with
advancements in the field of market research.
2002 Manpower UK’s Quarterly Survey of Employment
Prospects is updated to adopt an enhanced research
methodology. Manpower’s operations in Mexico and
Ireland launch the survey in their respective countries.
2003 3rd generation of the Manpower Employment Outlook
Survey is launched, expanding the program to a total18 countries worldwide: Australia, Austria, Belgium,
Canada, France, Germany, Hong Kong, Ireland, Italy,
Japan, Mexico, Netherlands, Norway, Singapore, Spain,
Sweden, United Kingdom and United States.
2004 Manpower operations in New Zealand launch the
Manpower Employment Outlook Survey.
About Manpower Inc.Manpower Inc. (NYSE: MAN) is a world leader in the
employment services industry, offering customers a continuum of
services to meet their needs throughout the employment and
business cycle. The company specializes in permanent,
temporary and contract recruitment; employee assessment;training; career transition and organizational consulting services.
Manpower’s worldwide network of 4,300 offices in 67 countries
and territories enables the company to meet the needs of its
400,000 customers per year, including small and medium size
enterprises in all industry sectors, as well as the world’s largest
multinational corporations. The focus of Manpower’s work is on
raising productivity through improved quality, efficiency and cost-
reduction, enabling customers to concentrate on their core
business activities. In addition to the Manpower brand, the
company operates under the brand names of Right
Management Consultants, Jefferson Wells, Elan, Brook Street
and Empower. More information on Manpower Inc. is available at
www.manpower.com.
In the United States, Manpower offers businesses a range of
HR services, in addition to providing administrative, industrial
and contact center personnel. Under the Manpower
Professional brand, the company places contract professionals
on assignment in areas such as information technology,
scientific, finance, engineering and telecommunications. More
information about Manpower’s US operation can be found at
www.us.manpower.com.

8/9/2019 Manpower Employment Outlook Survey: United States - Q4, 2004
http://slidepdf.com/reader/full/manpower-employment-outlook-survey-united-states-q4-2004 20/20
Manpower Inc., 5301 N. Ironwood Rd., Milwaukee, WI 5321
Tel: 414 961 1000
www.us.manpower.com
© 2004 M I All i ht d