Embed Size (px)
Citation preview

Outlook 2015

David BaskinPresident
Following his early career as a lawyer and banker, David founded Baskin Financial
Services Inc. in 1992. The firm, now operating as Baskin Wealth Management, has
grown from assets under management of $25 million in 2000 to over $700 million
today, with about 500 client families in seven provinces. David appears frequently
on national television and radio as a commentator on the markets and is frequently
quoted in the press. An enthusiastic sailor and traveller, David and his wife Joan
Garson have two adult children. All are actively involved in community and
charitable activities.
Barry Schwartz, MBA, CFAVice President, Chief Investment Officer
Barry joined the firm in 2000 and became a partner in 2005. He spearheads
the research on new investment opportunities and carefully monitors current ones.
Barry is also a frequent commentator on the markets on national television, radio
and in the press, and he provides insightful editorials regularly on Twitter
and on the Baskin Wealth Management blog. Barry is currently involved in many
community charitable organizations, and he is on the investment committee
of Robbins Hebrew Academy. He and his wife live in Toronto with their two
energetic boys.
Scott J. Mazi, CPA, CA, CFAVice President, Portfolio Manager & Chief Compliance Officer
Scott joined Baskin Wealth Management in 2006 and became a partner in 2009.
He has over twenty years of experience in wealth management and financial
services and has held senior positions at KPMG, UBS (Cayman Islands) and TD Asset
Management. With his large breadth of experience, he is involved in numerous
aspects of portfolio and relationship management as well as business development
and operations. Scott and his family live in Oakville, and he is involved in community
and charitable activities as well as coaching.
Jeff Pollock, BBA, JD, CFAAssociate Portfolio Manager
Jeff joined Baskin Wealth Management in 2011. He actively researches new
investment ideas and contributes regularly to the Baskin Wealth Management
blog. Jeff graduated on the Dean’s List from the Schulich School of Business (BBA)
and the Faculty of Law from the University of Windsor (Juris Doctor). He is a
CFA charterholder and member of the Toronto CFA Society. In his spare time,
Jeff works as a volunteer mathematics tutor.He enjoys watching Major League
Baseball, particularly in October, and is a hopeful fan of the Blue Jays.

1
The Great Divide:How Corporations Are Getting Richer and Families Are Getting Poorer
Section 1Six years after the recession, why is the US recovery so slow? Five reasons.
Section 2If the recovery is so slow, why are companies making so much money?
Section 3Meanwhile, in Canada...
Section 4Our asset class expectations for 2015.
Section 5Five investments that meet our criteria.
2
Section 1:
Six years after the recession, why is the US recovery so slow? Five reasons.
I. Fewer full time workers:
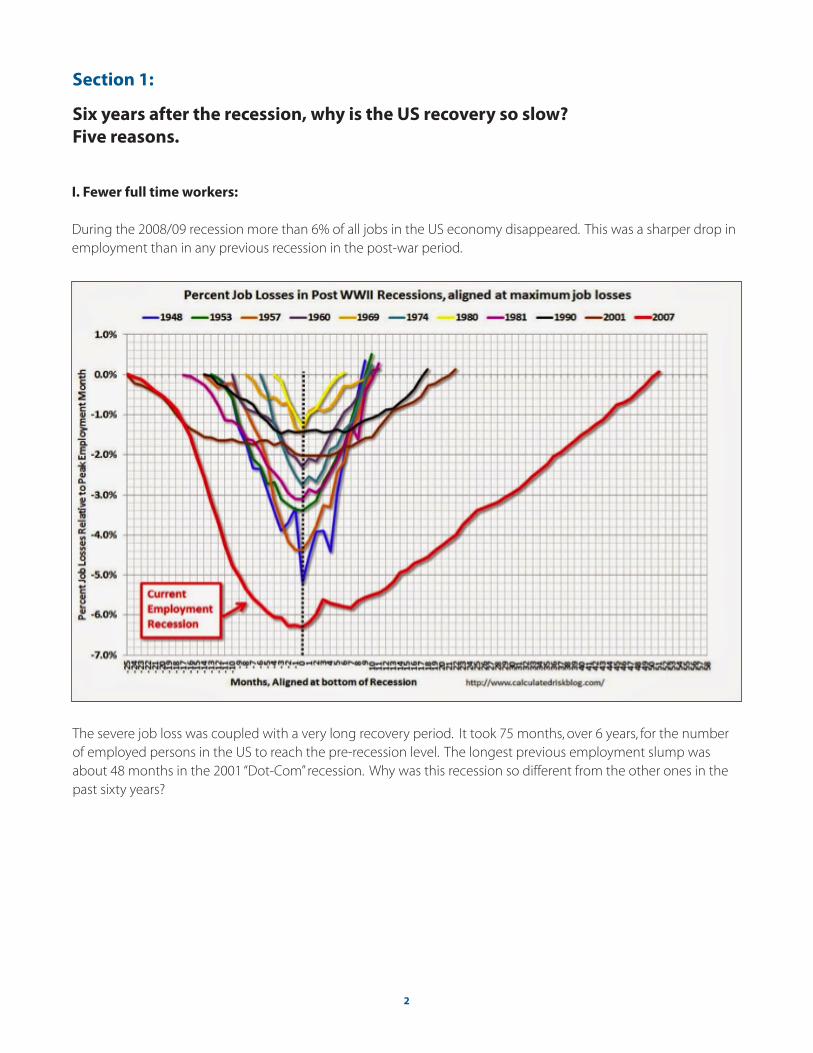
During the 2008/09 recession more than 6% of all jobs in the US economy disappeared. This was a sharper drop in employment than in any previous recession in the post-war period.
The severe job loss was coupled with a very long recovery period. It took 75 months, over 6 years, for the number of employed persons in the US to reach the pre-recession level. The longest previous employment slump was about 48 months in the 2001 “Dot-Com” recession. Why was this recession so different from the other ones in the past sixty years?
3
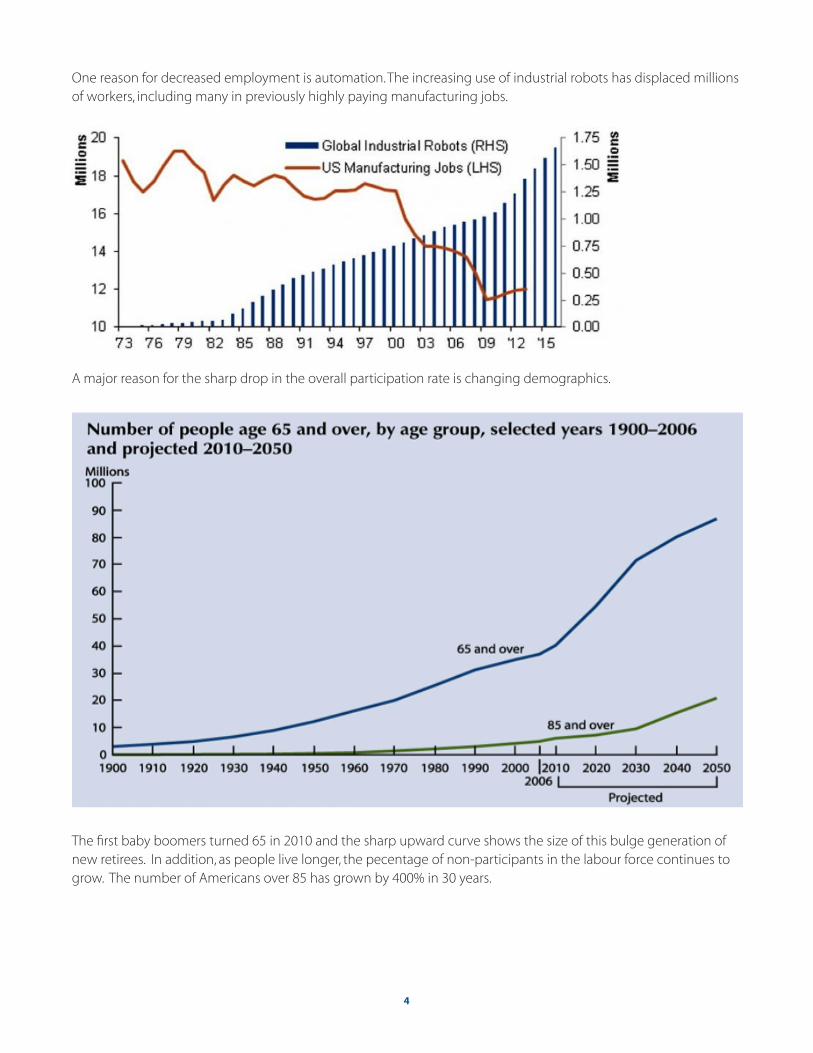
So while the total number of jobs recovered, no new jobs were created for the increased population. As a result, the ratio of employed persons to the total population dropped. For workers in their key earning years, from 25 to 54 years old, the percentage employed dropped from over 80% in 2008 to about 77% now. The difference is about 5 million fewer jobs for prime-of-life wage earners. These are exactly the people who are normally building new households, having children and consuming household goods.
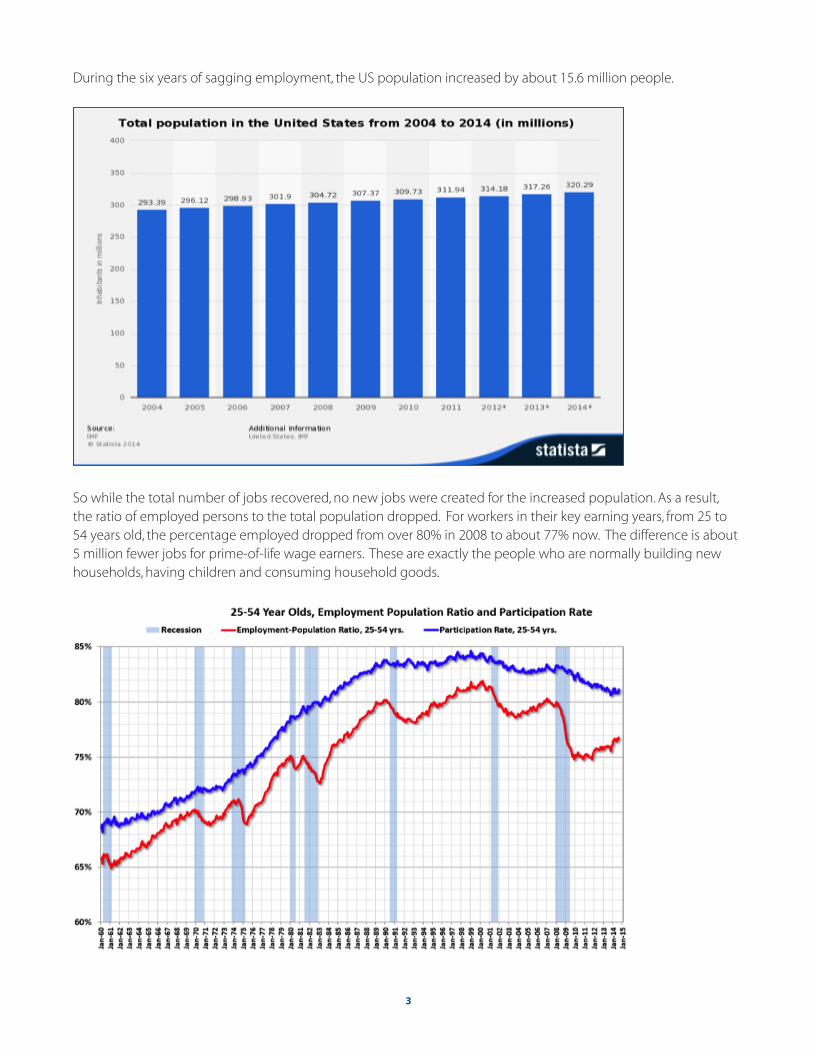
During the six years of sagging employment, the US population increased by about 15.6 million people.
4
A major reason for the sharp drop in the overall participation rate is changing demographics.
The first baby boomers turned 65 in 2010 and the sharp upward curve shows the size of this bulge generation of new retirees. In addition, as people live longer, the pecentage of non-participants in the labour force continues to grow. The number of Americans over 85 has grown by 400% in 30 years.
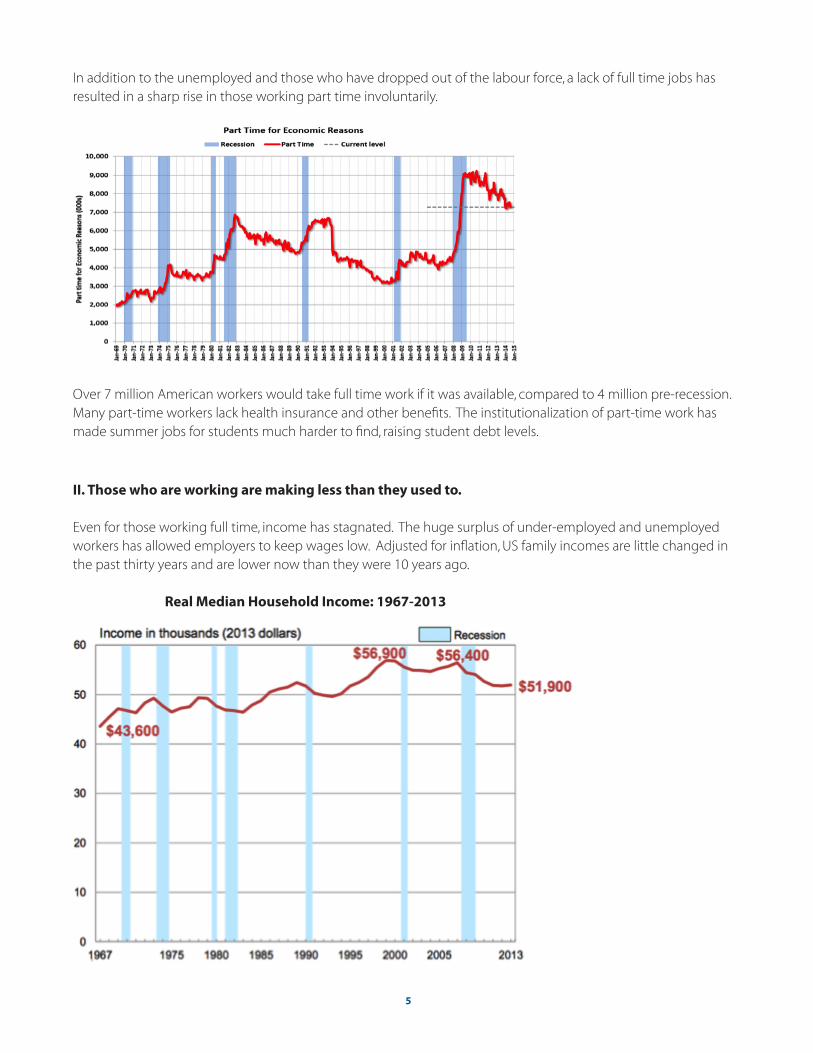
One reason for decreased employment is automation. The increasing use of industrial robots has displaced millions of workers, including many in previously highly paying manufacturing jobs.
5
II. Those who are working are making less than they used to.
Even for those working full time, income has stagnated. The huge surplus of under-employed and unemployed workers has allowed employers to keep wages low. Adjusted for inflation, US family incomes are little changed in the past thirty years and are lower now than they were 10 years ago.
Real Median Household Income: 1967-2013
Over 7 million American workers would take full time work if it was available, compared to 4 million pre-recession. Many part-time workers lack health insurance and other benefits. The institutionalization of part-time work has made summer jobs for students much harder to find, raising student debt levels.
In addition to the unemployed and those who have dropped out of the labour force, a lack of full time jobs has resulted in a sharp rise in those working part time involuntarily.
6
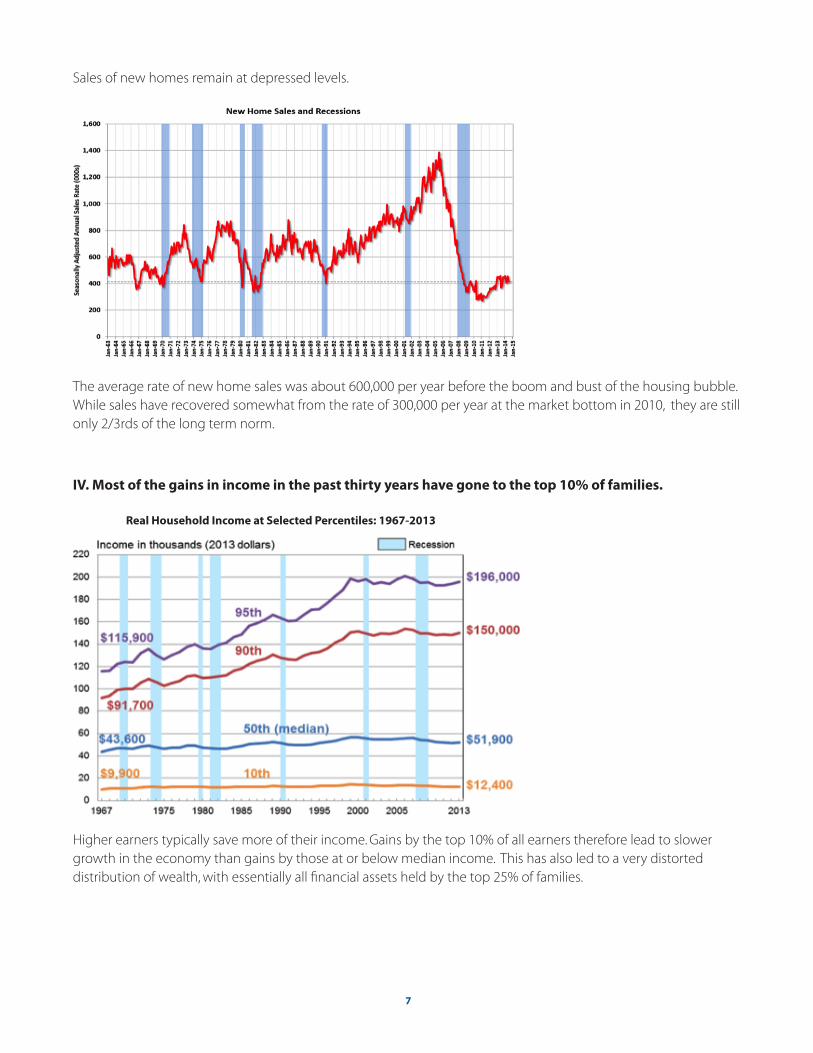
III. Households are paying down debt rather than buying new homes or durable goods.
Household financial obligations are at a 35 year low as a percentage of income. While debt repayment is good on the family level, it has a detrimental impact on the overall economy as income is diverted from consumption to saving.
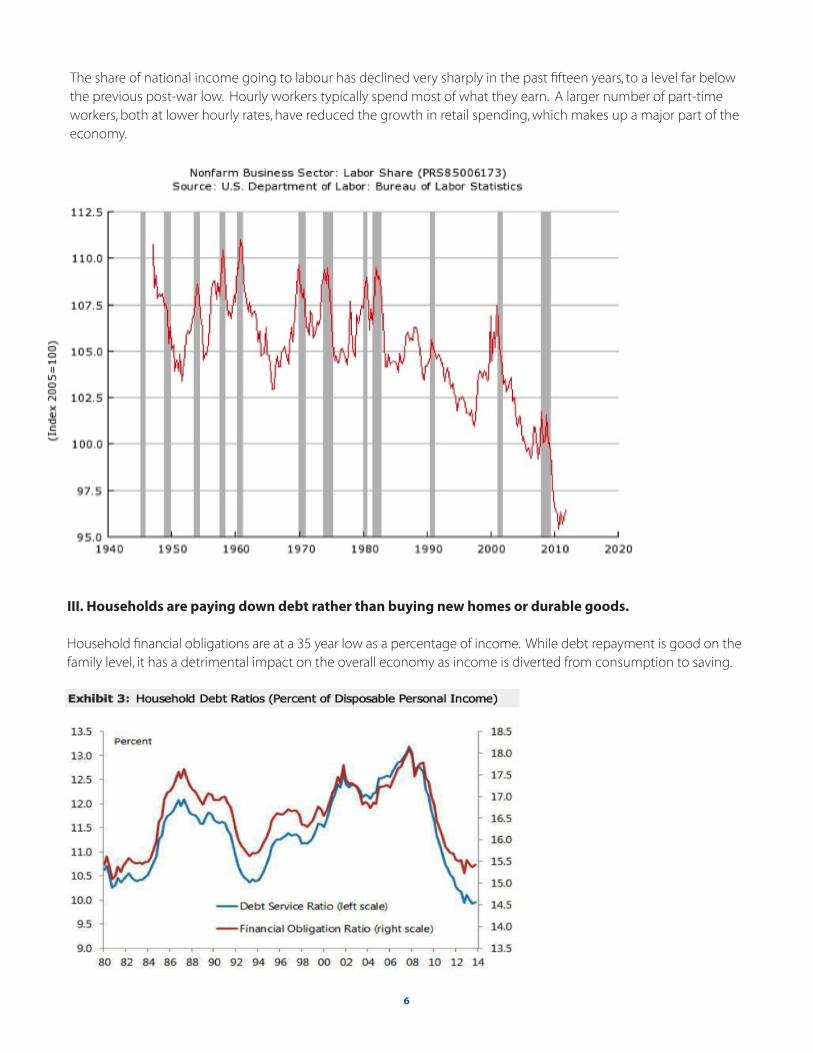
The share of national income going to labour has declined very sharply in the past fifteen years, to a level far below the previous post-war low. Hourly workers typically spend most of what they earn. A larger number of part-time workers, both at lower hourly rates, have reduced the growth in retail spending, which makes up a major part of the economy.
7
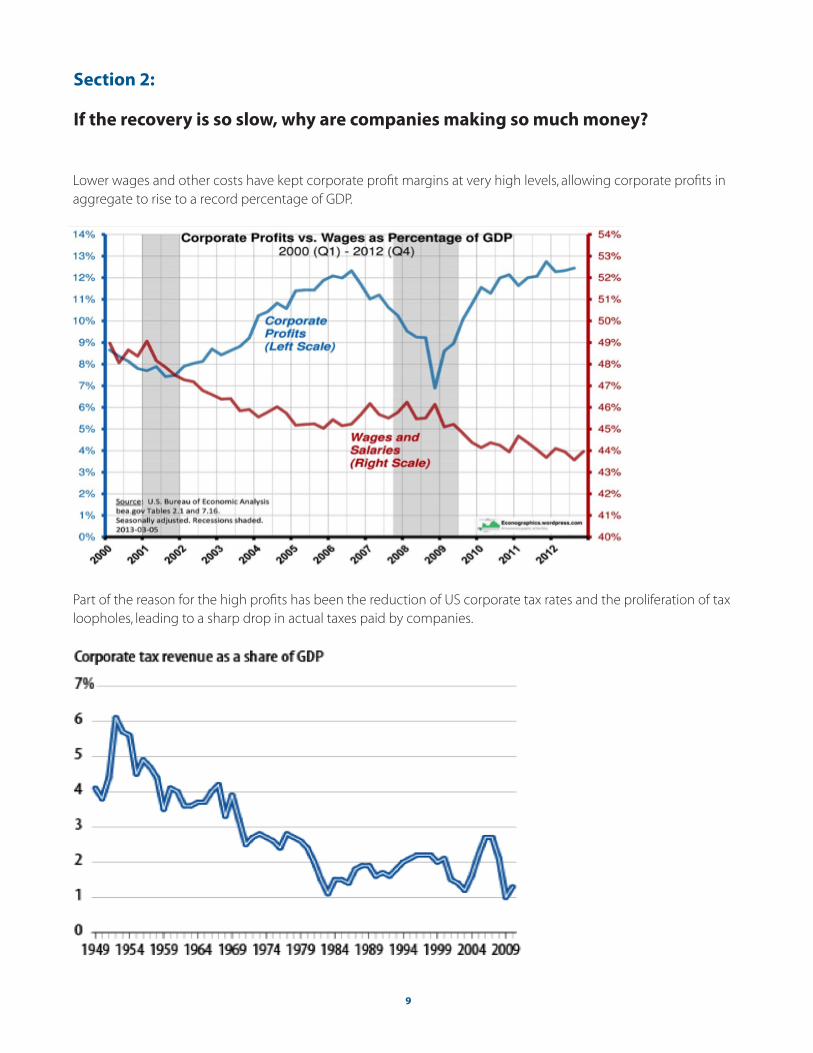
IV. Most of the gains in income in the past thirty years have gone to the top 10% of families.
Real Household Income at Selected Percentiles: 1967-2013
Higher earners typically save more of their income. Gains by the top 10% of all earners therefore lead to slower growth in the economy than gains by those at or below median income. This has also led to a very distorted distribution of wealth, with essentially all financial assets held by the top 25% of families.
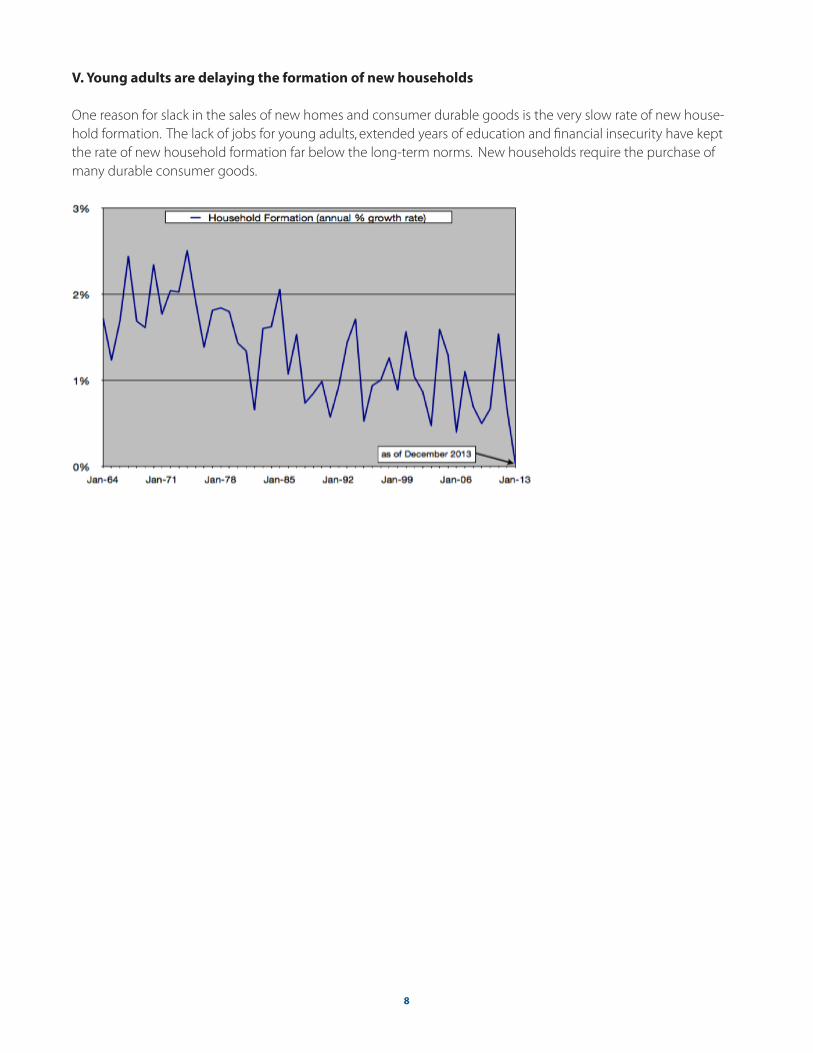
Sales of new homes remain at depressed levels.
The average rate of new home sales was about 600,000 per year before the boom and bust of the housing bubble. While sales have recovered somewhat from the rate of 300,000 per year at the market bottom in 2010, they are still only 2/3rds of the long term norm.
8
V. Young adults are delaying the formation of new households
One reason for slack in the sales of new homes and consumer durable goods is the very slow rate of new house-hold formation. The lack of jobs for young adults, extended years of education and financial insecurity have kept the rate of new household formation far below the long-term norms. New households require the purchase of many durable consumer goods.
9
Section 2:
If the recovery is so slow, why are companies making so much money?
Lower wages and other costs have kept corporate profit margins at very high levels, allowing corporate profits in aggregate to rise to a record percentage of GDP.
Part of the reason for the high profits has been the reduction of US corporate tax rates and the proliferation of tax loopholes, leading to a sharp drop in actual taxes paid by companies.
10
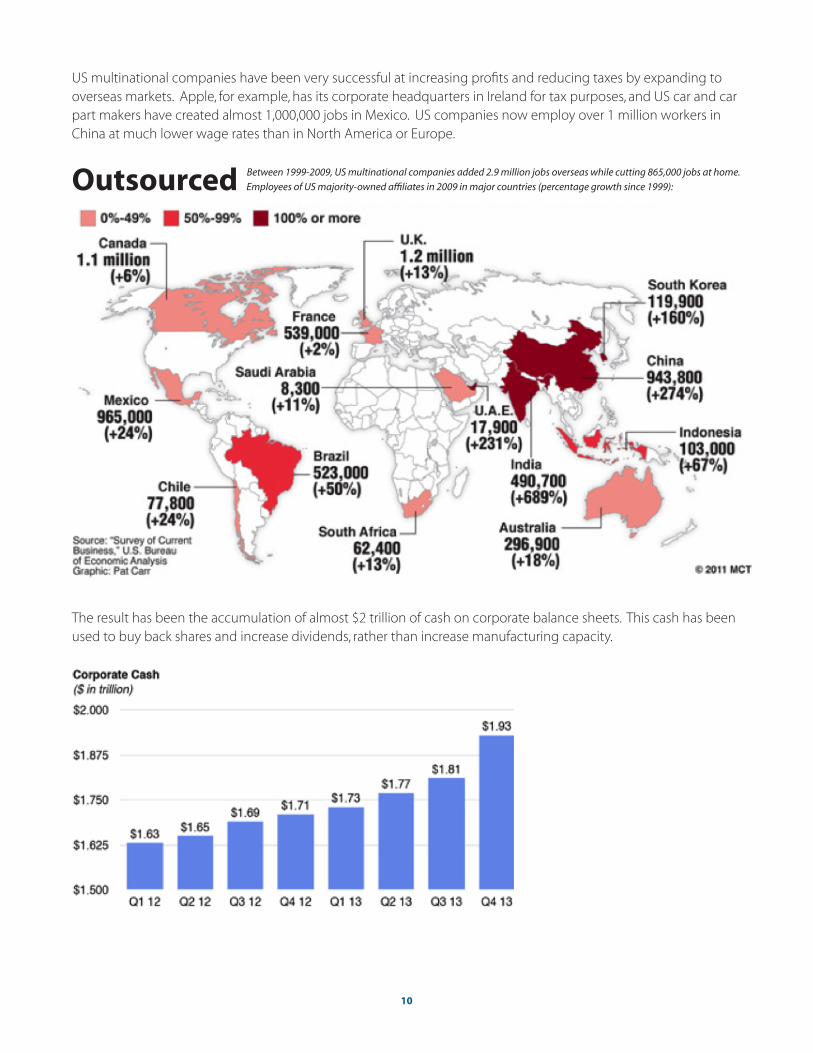
US multinational companies have been very successful at increasing profits and reducing taxes by expanding to overseas markets. Apple, for example, has its corporate headquarters in Ireland for tax purposes, and US car and car part makers have created almost 1,000,000 jobs in Mexico. US companies now employ over 1 million workers in China at much lower wage rates than in North America or Europe.
Outsourced Between 1999-2009, US multinational companies added 2.9 million jobs overseas while cutting 865,000 jobs at home. Employees of US majority-owned affiliates in 2009 in major countries (percentage growth since 1999):
The result has been the accumulation of almost $2 trillion of cash on corporate balance sheets. This cash has been used to buy back shares and increase dividends, rather than increase manufacturing capacity.
11
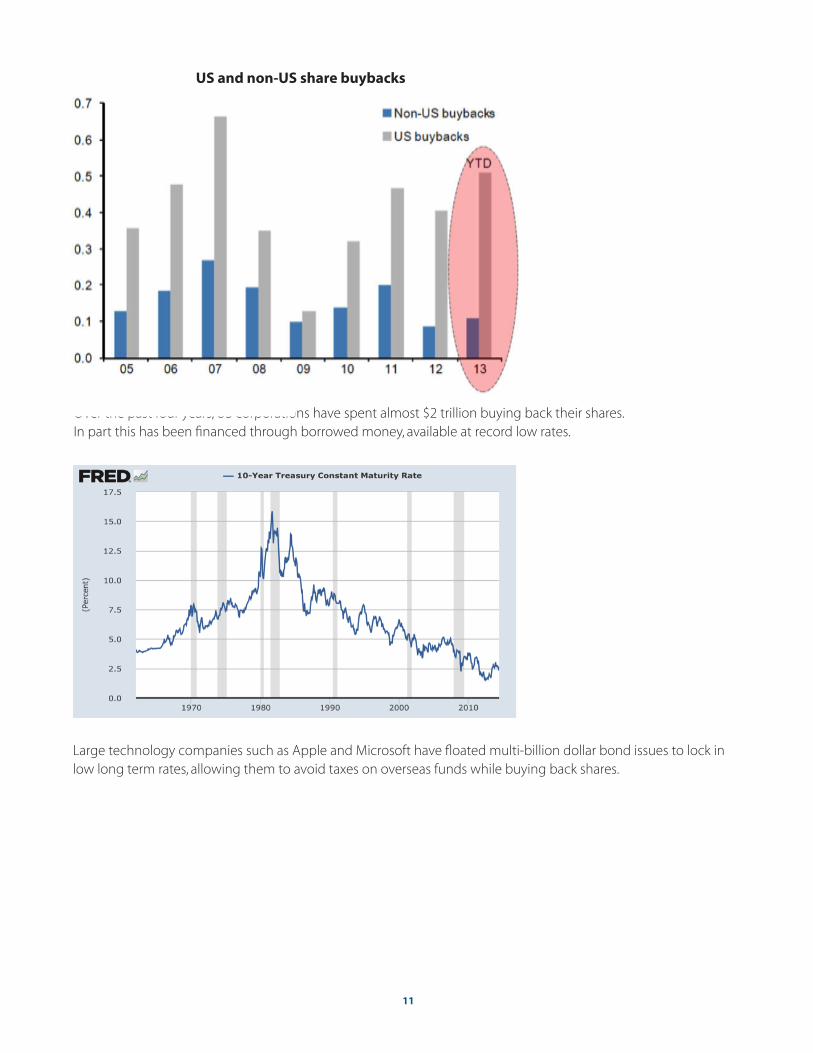
Large technology companies such as Apple and Microsoft have floated multi-billion dollar bond issues to lock in low long term rates, allowing them to avoid taxes on overseas funds while buying back shares.
Over the past four years, US corporations have spent almost $2 trillion buying back their shares.In part this has been financed through borrowed money, available at record low rates.
US and non-US share buybacks
12
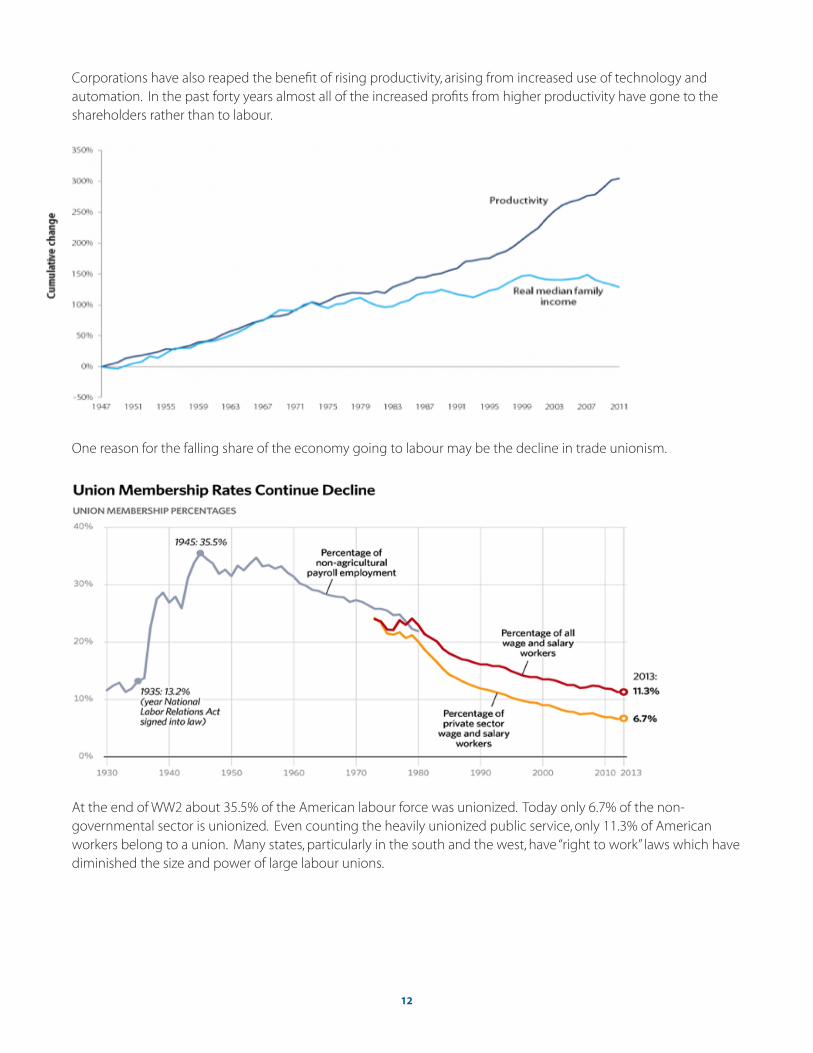
At the end of WW2 about 35.5% of the American labour force was unionized. Today only 6.7% of the non- governmental sector is unionized. Even counting the heavily unionized public service, only 11.3% of American workers belong to a union. Many states, particularly in the south and the west, have “right to work” laws which have diminished the size and power of large labour unions.
One reason for the falling share of the economy going to labour may be the decline in trade unionism.
Corporations have also reaped the benefit of rising productivity, arising from increased use of technology and automation. In the past forty years almost all of the increased profits from higher productivity have gone to the shareholders rather than to labour.
13
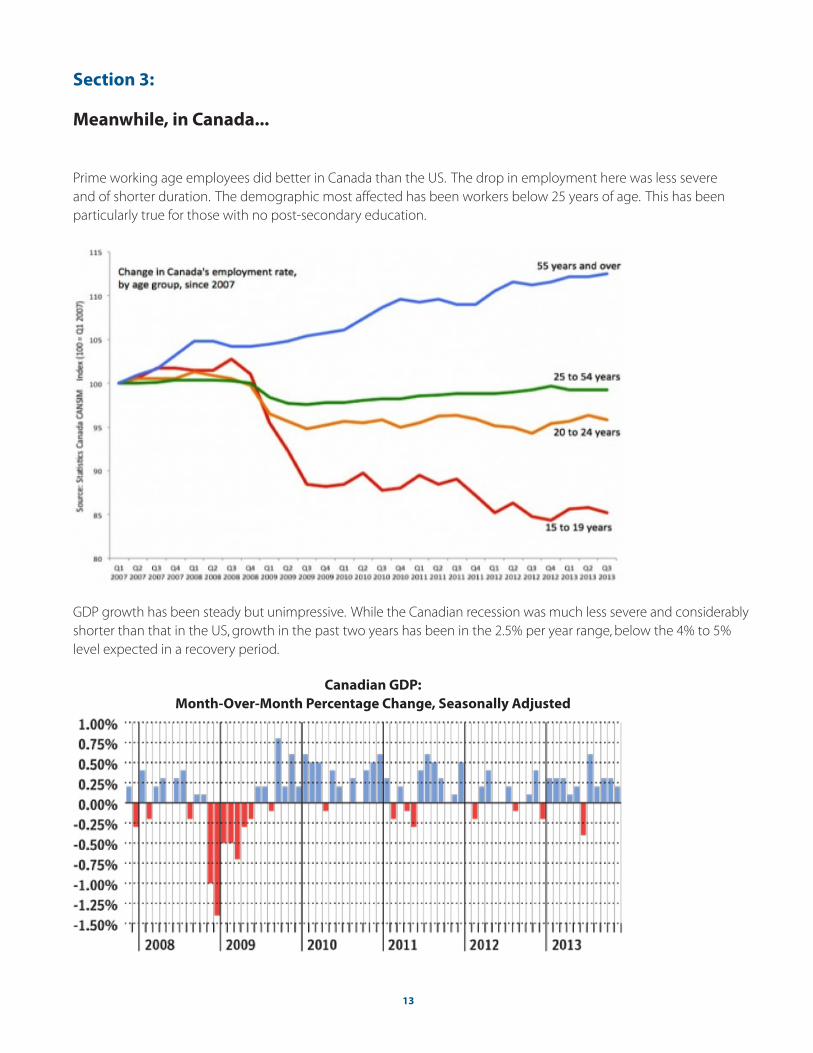
Prime working age employees did better in Canada than the US. The drop in employment here was less severe and of shorter duration. The demographic most affected has been workers below 25 years of age. This has been particularly true for those with no post-secondary education.
Section 3:
Meanwhile, in Canada...
GDP growth has been steady but unimpressive. While the Canadian recession was much less severe and considerably shorter than that in the US, growth in the past two years has been in the 2.5% per year range, below the 4% to 5% level expected in a recovery period.
Canadian GDP: Month-Over-Month Percentage Change, Seasonally Adjusted
14
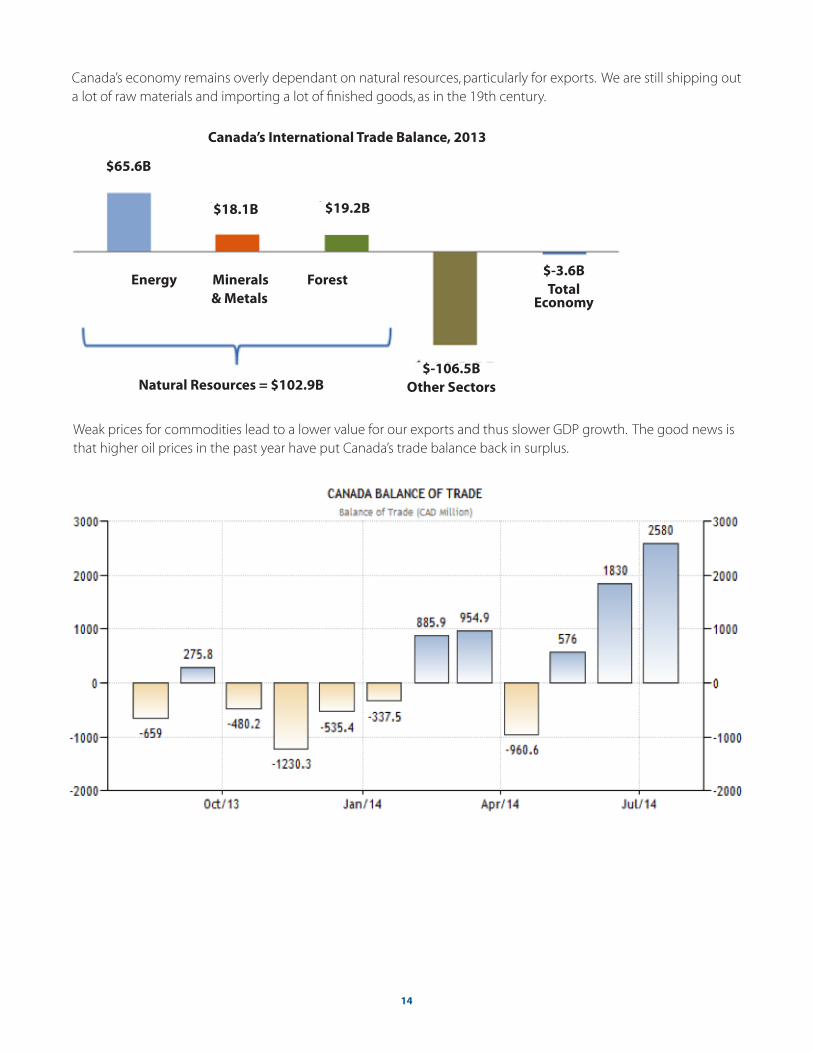
Canada’s economy remains overly dependant on natural resources, particularly for exports. We are still shipping out a lot of raw materials and importing a lot of finished goods, as in the 19th century.
Weak prices for commodities lead to a lower value for our exports and thus slower GDP growth. The good news is that higher oil prices in the past year have put Canada’s trade balance back in surplus.
Canada’s International Trade Balance, 2013
$65.6B
$18.1B $19.2B
$-3.6BTotal
Economy
Energy Minerals Forest& Metals
Natural Resources = $102.9B$-106.5B
Other Sectors
15
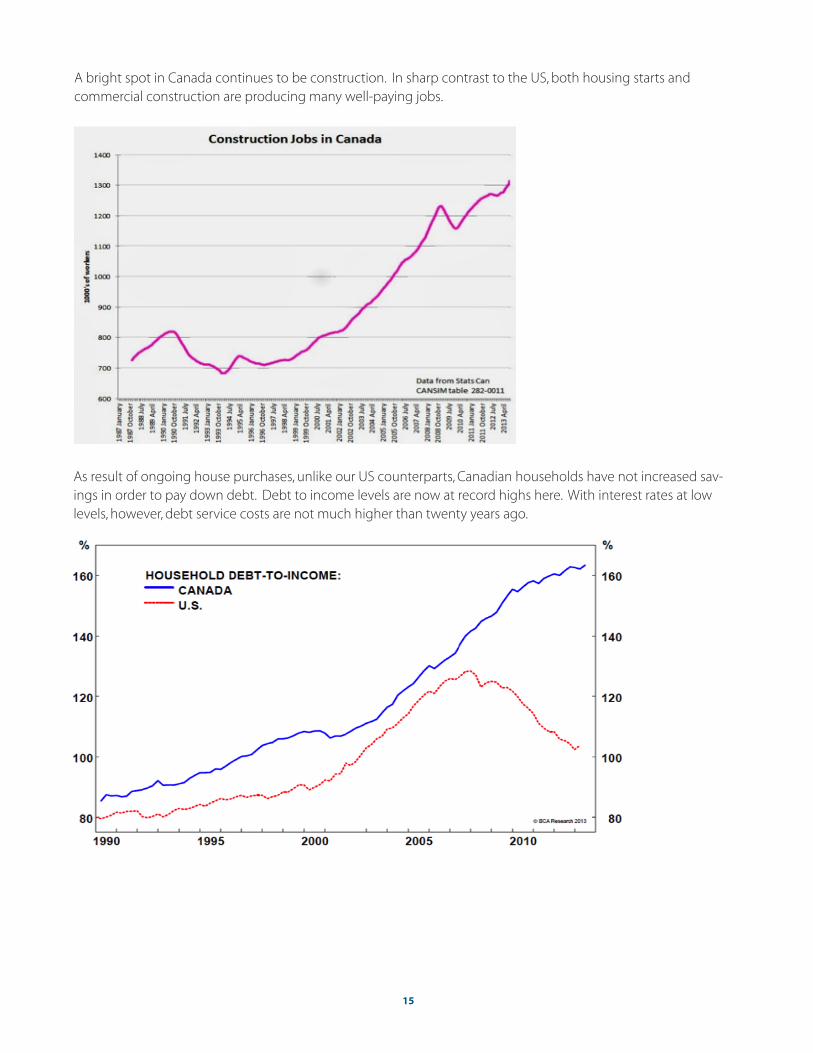
As result of ongoing house purchases, unlike our US counterparts, Canadian households have not increased sav-ings in order to pay down debt. Debt to income levels are now at record highs here. With interest rates at low levels, however, debt service costs are not much higher than twenty years ago.
A bright spot in Canada continues to be construction. In sharp contrast to the US, both housing starts and commercial construction are producing many well-paying jobs.
16
Low interest rates have made homes affordable to buyers even at these high prices. However, with high levels of indebtedness, Canadians are vulnerable to increases in mortgage and other interest rates. A significant increase in mortgage rates would put many households in financial peril, and would make home purchases at current prices impossible for many middle income families. In these circumstances, home prices would undoubtedly fall.
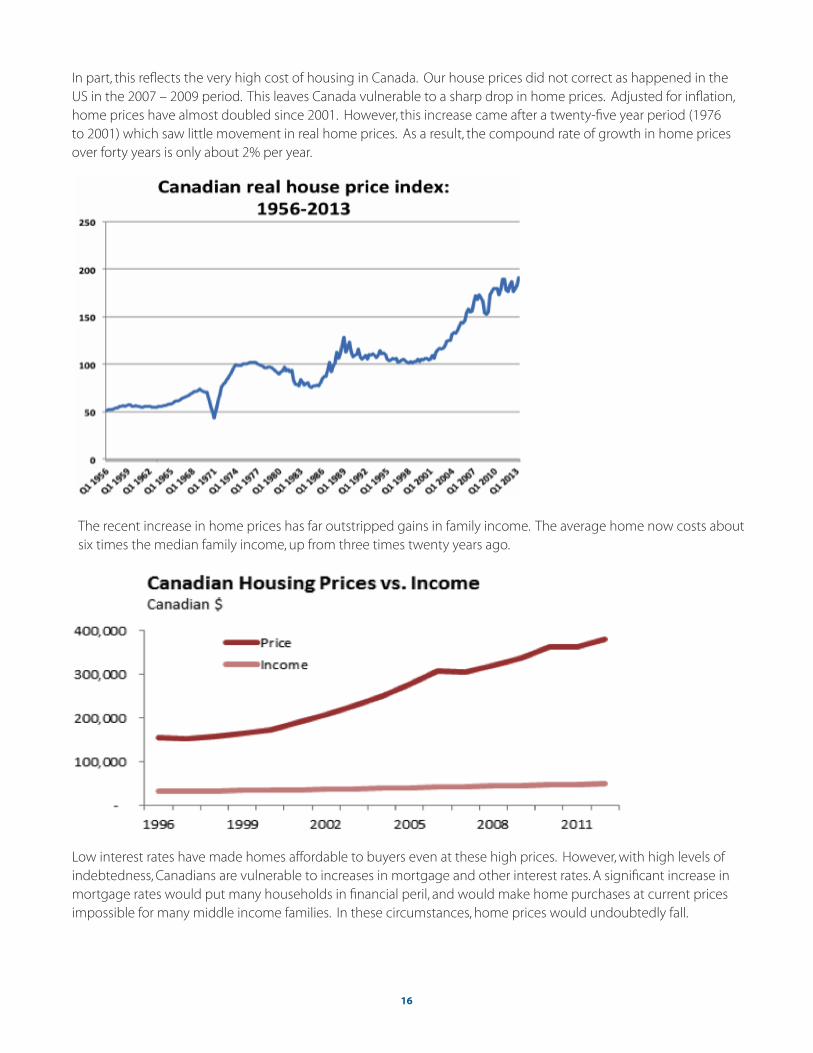
The recent increase in home prices has far outstripped gains in family income. The average home now costs about six times the median family income, up from three times twenty years ago.
In part, this reflects the very high cost of housing in Canada. Our house prices did not correct as happened in the US in the 2007 – 2009 period. This leaves Canada vulnerable to a sharp drop in home prices. Adjusted for inflation, home prices have almost doubled since 2001. However, this increase came after a twenty-five year period (1976 to 2001) which saw little movement in real home prices. As a result, the compound rate of growth in home prices over forty years is only about 2% per year.
17
Section 4:
Our asset class expectations for 2015.
I. Our Expectations for Fixed Income
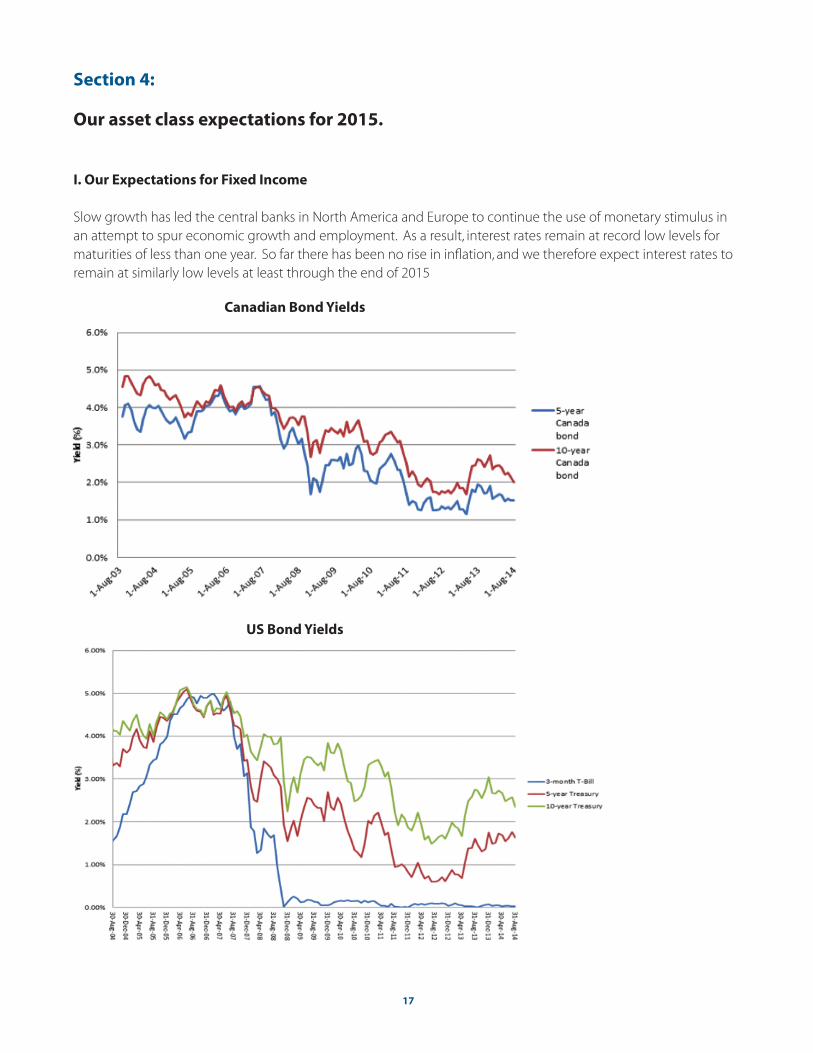
Slow growth has led the central banks in North America and Europe to continue the use of monetary stimulus in an attempt to spur economic growth and employment. As a result, interest rates remain at record low levels for maturities of less than one year. So far there has been no rise in inflation, and we therefore expect interest rates to remain at similarly low levels at least through the end of 2015
Canadian Bond Yields
US Bond Yields
18
Over the past year, the US Federal Reserve bank has “tapered” its purchases of longer maturity bonds in the open market from $85 billion to $10 billion/month. This program (QE3) is scheduled to end this month. Contrary to expectations in 2013, the reduced buying has not led to an increase in long rates.
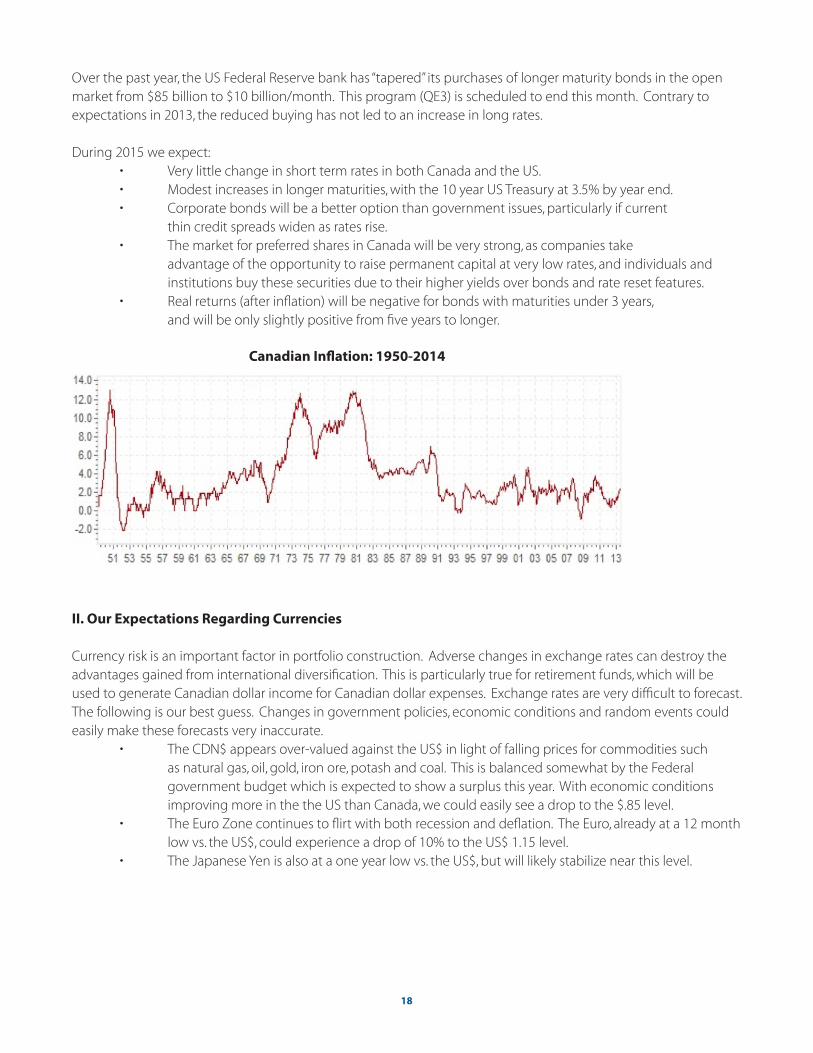
During 2015 we expect: • Very little change in short term rates in both Canada and the US. • Modest increases in longer maturities, with the 10 year US Treasury at 3.5% by year end. • Corporate bonds will be a better option than government issues, particularly if current thin credit spreads widen as rates rise. • The market for preferred shares in Canada will be very strong, as companies take advantage of the opportunity to raise permanent capital at very low rates, and individuals and institutions buy these securities due to their higher yields over bonds and rate reset features. • Real returns (after inflation) will be negative for bonds with maturities under 3 years, and will be only slightly positive from five years to longer.
Canadian Inflation: 1950-2014
II. Our Expectations Regarding Currencies
Currency risk is an important factor in portfolio construction. Adverse changes in exchange rates can destroy the advantages gained from international diversification. This is particularly true for retirement funds, which will be used to generate Canadian dollar income for Canadian dollar expenses. Exchange rates are very difficult to forecast. The following is our best guess. Changes in government policies, economic conditions and random events could easily make these forecasts very inaccurate. • The CDN$ appears over-valued against the US$ in light of falling prices for commodities such as natural gas, oil, gold, iron ore, potash and coal. This is balanced somewhat by the Federal government budget which is expected to show a surplus this year. With economic conditions improving more in the the US than Canada, we could easily see a drop to the $.85 level. • The Euro Zone continues to flirt with both recession and deflation. The Euro, already at a 12 month low vs. the US$, could experience a drop of 10% to the US$ 1.15 level. • The Japanese Yen is also at a one year low vs. the US$, but will likely stabilize near this level.
19
III. Our Approach to Canadian and US Stocks
Our current equity portfolio is about 69% Canadian and 31% other, primarily American. During the year we expect our non-Canadian exposure to grow to between 35% and 40%.
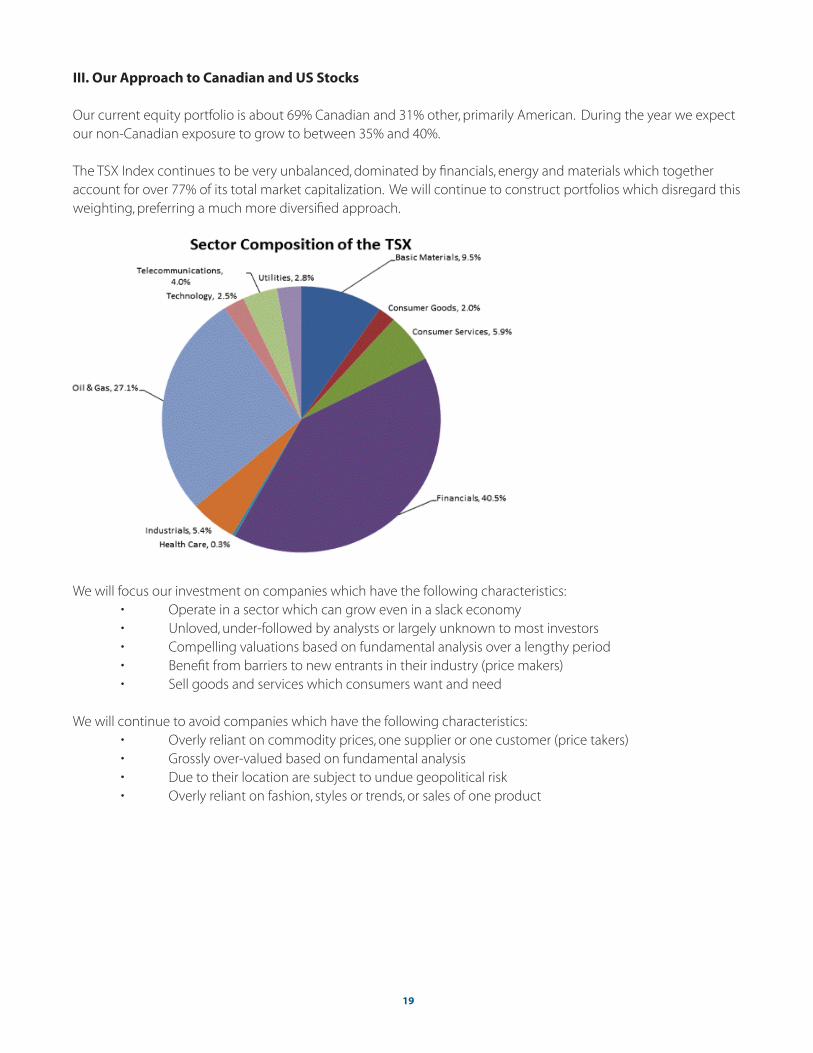
The TSX Index continues to be very unbalanced, dominated by financials, energy and materials which together account for over 77% of its total market capitalization. We will continue to construct portfolios which disregard this weighting, preferring a much more diversified approach.
We will focus our investment on companies which have the following characteristics: • Operate in a sector which can grow even in a slack economy • Unloved, under-followed by analysts or largely unknown to most investors • Compelling valuations based on fundamental analysis over a lengthy period • Benefit from barriers to new entrants in their industry (price makers) • Sell goods and services which consumers want and need
We will continue to avoid companies which have the following characteristics: • Overly reliant on commodity prices, one supplier or one customer (price takers) • Grossly over-valued based on fundamental analysis • Due to their location are subject to undue geopolitical risk • Overly reliant on fashion, styles or trends, or sales of one product
20
Section 5:
Five investments that meet our criteria.
I. Zimmer Holdings - A company which operates in a sector that can grow even in a slack economy
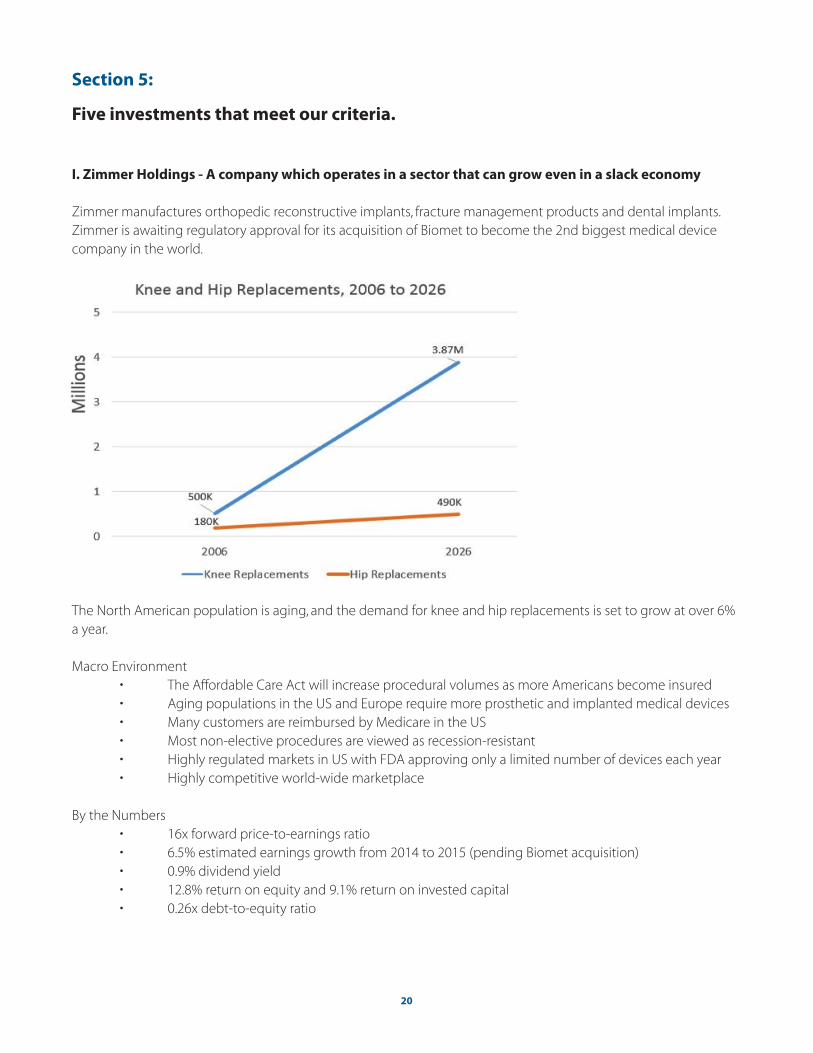
Zimmer manufactures orthopedic reconstructive implants, fracture management products and dental implants. Zimmer is awaiting regulatory approval for its acquisition of Biomet to become the 2nd biggest medical device company in the world.
The North American population is aging, and the demand for knee and hip replacements is set to grow at over 6% a year.
Macro Environment • The Affordable Care Act will increase procedural volumes as more Americans become insured • Aging populations in the US and Europe require more prosthetic and implanted medical devices • Many customers are reimbursed by Medicare in the US • Most non-elective procedures are viewed as recession-resistant • Highly regulated markets in US with FDA approving only a limited number of devices each year • Highly competitive world-wide marketplace
By the Numbers • 16x forward price-to-earnings ratio • 6.5% estimated earnings growth from 2014 to 2015 (pending Biomet acquisition) • 0.9% dividend yield • 12.8% return on equity and 9.1% return on invested capital • 0.26x debt-to-equity ratio
21
II. High Liner Foods - Unloved, under-followed by analysts or largely unknown to most investors
High Liner Foods is a North American processor and marketer of value-added frozen seafood. The company’s products are sold in grocery stores and restaurants throughout the United States and Canada. It aspires to grow its operating earnings by almost 90% between now and 2016.
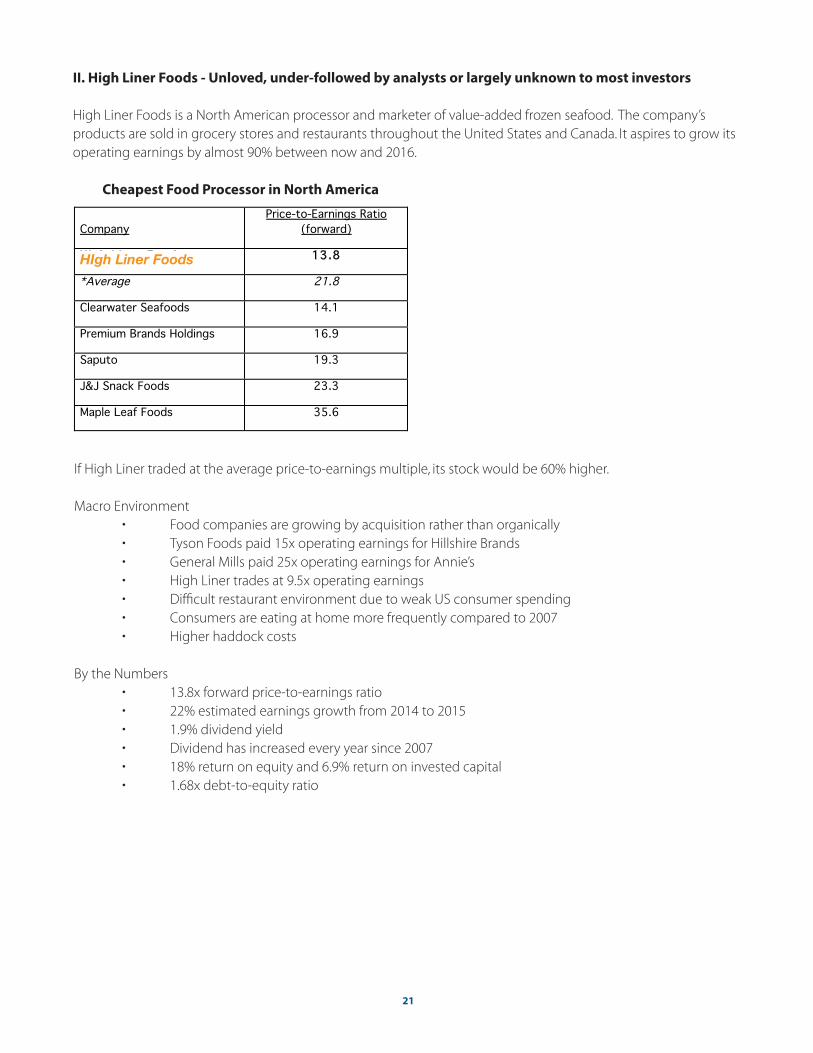
Cheapest Food Processor in North America
Company Price-to-Earnings Ratio
(forward)
High Liner Foods 13.8
*Average 21.8
Clearwater Seafoods 14.1
Premium Brands Holdings 16.9
Saputo 19.3
J&J Snack Foods 23.3
Maple Leaf Foods 35.6
If High Liner traded at the average price-to-earnings multiple, its stock would be 60% higher.
Macro Environment • Food companies are growing by acquisition rather than organically • Tyson Foods paid 15x operating earnings for Hillshire Brands • General Mills paid 25x operating earnings for Annie’s • High Liner trades at 9.5x operating earnings • Difficult restaurant environment due to weak US consumer spending • Consumers are eating at home more frequently compared to 2007 • Higher haddock costs
By the Numbers • 13.8x forward price-to-earnings ratio • 22% estimated earnings growth from 2014 to 2015 • 1.9% dividend yield • Dividend has increased every year since 2007 • 18% return on equity and 6.9% return on invested capital • 1.68x debt-to-equity ratio
HIgh Liner Foods
22
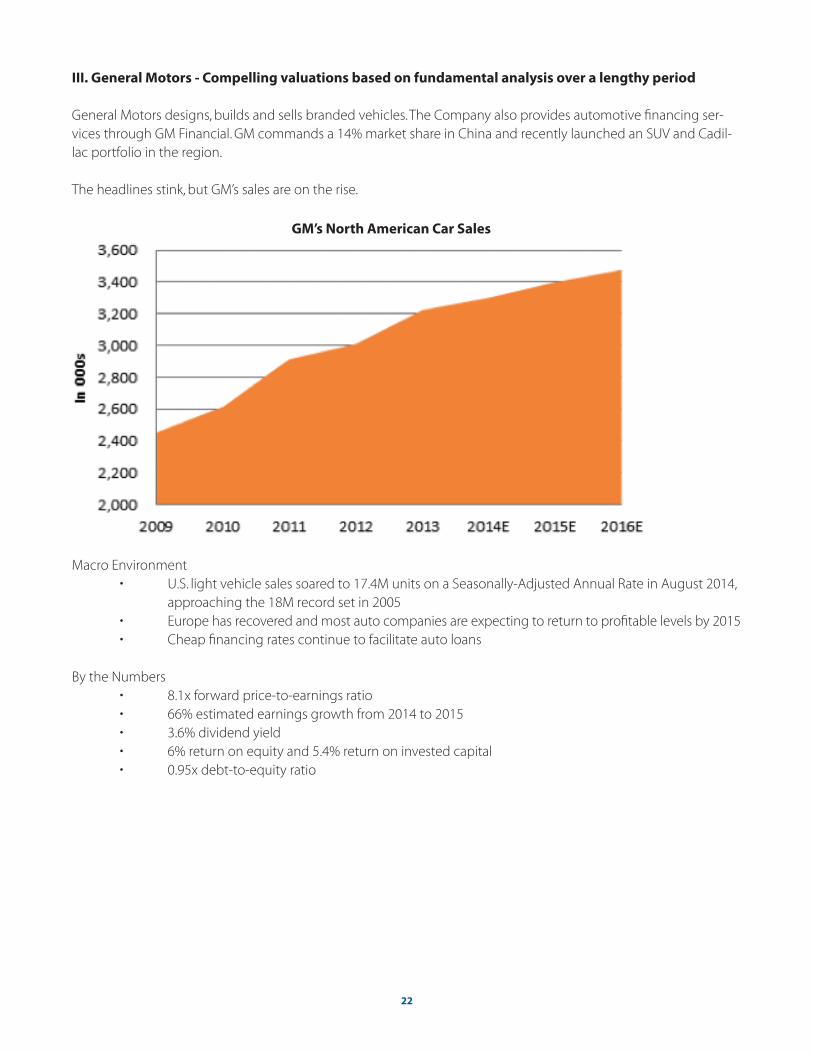
III. General Motors - Compelling valuations based on fundamental analysis over a lengthy period
General Motors designs, builds and sells branded vehicles. The Company also provides automotive financing ser-vices through GM Financial. GM commands a 14% market share in China and recently launched an SUV and Cadil-lac portfolio in the region.
The headlines stink, but GM’s sales are on the rise.
Macro Environment • U.S. light vehicle sales soared to 17.4M units on a Seasonally-Adjusted Annual Rate in August 2014, approaching the 18M record set in 2005 • Europe has recovered and most auto companies are expecting to return to profitable levels by 2015 • Cheap financing rates continue to facilitate auto loans
By the Numbers • 8.1x forward price-to-earnings ratio • 66% estimated earnings growth from 2014 to 2015 • 3.6% dividend yield • 6% return on equity and 5.4% return on invested capital • 0.95x debt-to-equity ratio
GM’s North American Car Sales
23
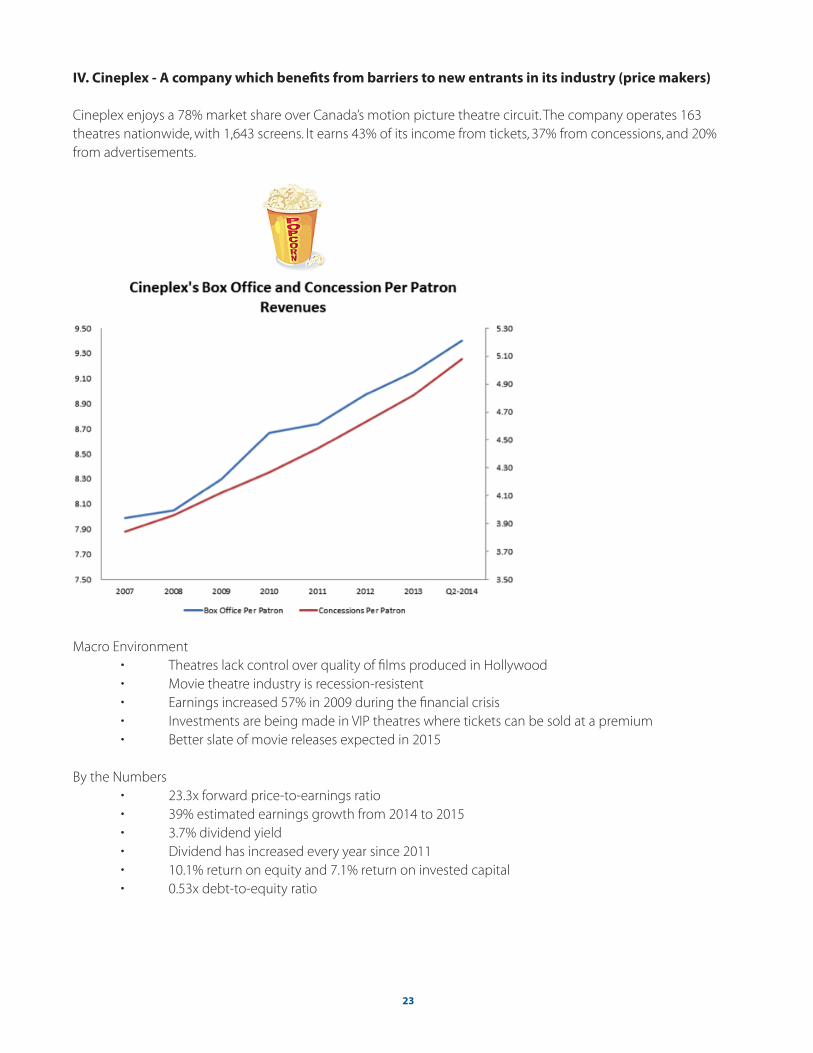
IV. Cineplex - A company which benefits from barriers to new entrants in its industry (price makers)
Cineplex enjoys a 78% market share over Canada’s motion picture theatre circuit. The company operates 163 theatres nationwide, with 1,643 screens. It earns 43% of its income from tickets, 37% from concessions, and 20% from advertisements.
Macro Environment • Theatres lack control over quality of films produced in Hollywood • Movie theatre industry is recession-resistent • Earnings increased 57% in 2009 during the financial crisis • Investments are being made in VIP theatres where tickets can be sold at a premium • Better slate of movie releases expected in 2015
By the Numbers • 23.3x forward price-to-earnings ratio • 39% estimated earnings growth from 2014 to 2015 • 3.7% dividend yield • Dividend has increased every year since 2011 • 10.1% return on equity and 7.1% return on invested capital • 0.53x debt-to-equity ratio
24
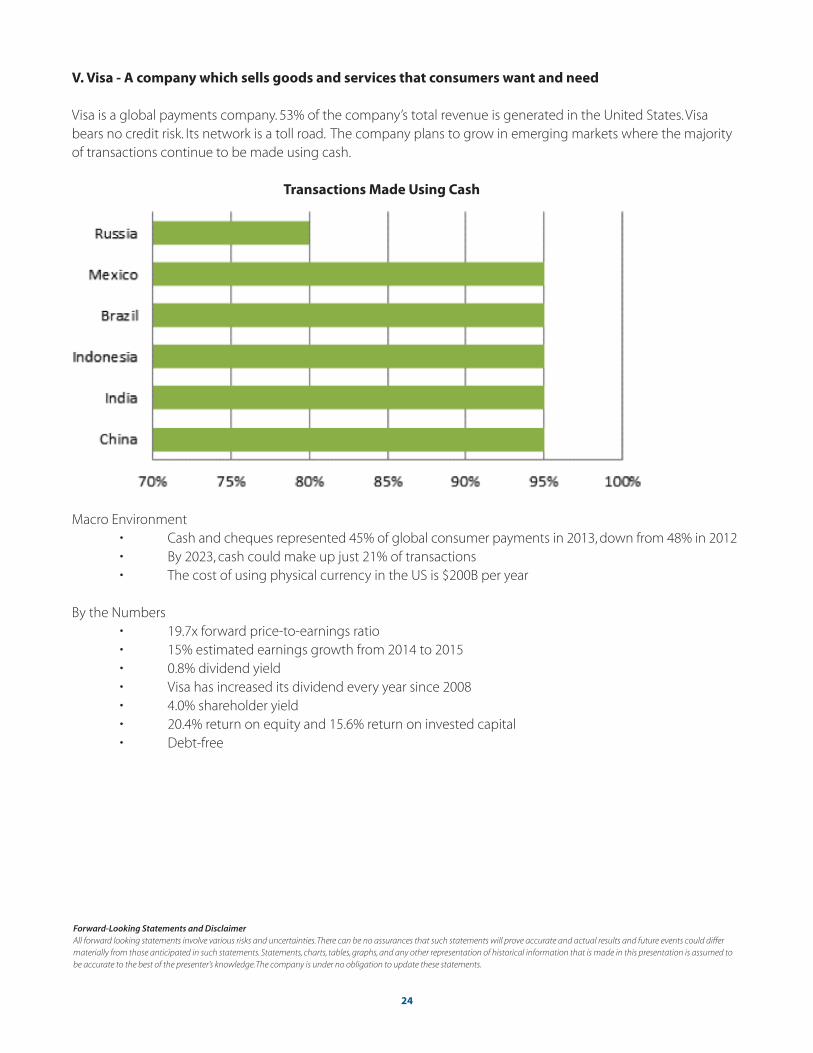
V. Visa - A company which sells goods and services that consumers want and need
Visa is a global payments company. 53% of the company’s total revenue is generated in the United States. Visa bears no credit risk. Its network is a toll road. The company plans to grow in emerging markets where the majority of transactions continue to be made using cash.
Transactions Made Using Cash
Macro Environment • Cash and cheques represented 45% of global consumer payments in 2013, down from 48% in 2012 • By 2023, cash could make up just 21% of transactions • The cost of using physical currency in the US is $200B per year
By the Numbers • 19.7x forward price-to-earnings ratio • 15% estimated earnings growth from 2014 to 2015 • 0.8% dividend yield • Visa has increased its dividend every year since 2008 • 4.0% shareholder yield • 20.4% return on equity and 15.6% return on invested capital • Debt-free
Forward-Looking Statements and DisclaimerAll forward looking statements involve various risks and uncertainties. There can be no assurances that such statements will prove accurate and actual results and future events could differ materially from those anticipated in such statements. Statements, charts, tables, graphs, and any other representation of historical information that is made in this presentation is assumed to be accurate to the best of the presenter’s knowledge. The company is under no obligation to update these statements.

baskinwealth.com
416 969 9540Toll Free: 1 877 227 [email protected]
95 St. Clair Avenue West, Suite 900Toronto, Ontario M4V 1N6
Follow us on Twitter:@DavidBaskinBWM @BarrySchwartzBW