Embed Size (px)
Citation preview
Outcome Focused Management in the United Kingdom
General Expenditure Policy, HM Treasury
Towards Outcome Focussed Management
1. In 1998 the government of the United Kingdom conducted a Comprehensive Spending
Review which examined the resources allocated to each area of spending, and for the first
time decided on and published the service improvements and reforms required in return for
the resources allocated to departments’ expenditure programmes. These requirements were
set out in Public Service Agreements (PSAs) for every central government department
published in December 19981. Each PSA set out the aim and objectives of each department as
well as performance targets including measures of operations and outcomes. The
government’s second spending review in 2000 resulted in revised PSAs, and excluded those
expenditure programmes for which the Scottish Parliament and the Welsh Assembly have
executive responsibility following the devolved constitutional arrangements.
2. An independent study2 analysed the targets in the 1998 PSAs and found that they were
mainly process targets (51%) and output targets (27%) with a relatively small proportion of
outcome targets (11%). In July 2000 new PSAs3 were agreed for the period 2001-2004 with a
clear objective to focus the targets on priority outcomes. A recent report by the National
Audit Office suggests4 that in the 2000 PSAs 67% of targets are outcome targets with 14%
process targets and 8% output targets.
3. This shift in focus was achieved in part by shifting the supporting output and
operational targets to a new set of agreements, Service Delivery Agreements, but also by an
increase in the absolute number of outcome focused targets by which the performance of
government will be judged.
The core elements of UK outcome-focused management
1) Public Service Agreements
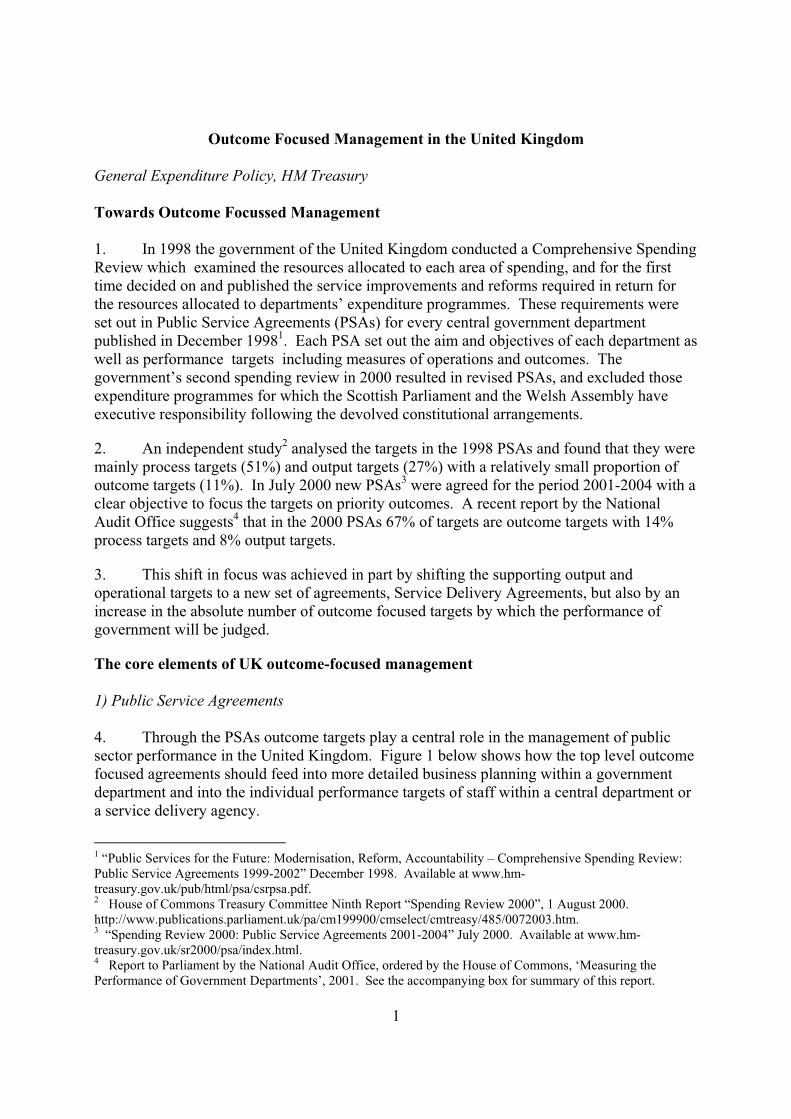
4. Through the PSAs outcome targets play a central role in the management of public
sector performance in the United Kingdom. Figure 1 below shows how the top level outcome
focused agreements should feed into more detailed business planning within a government
department and into the individual performance targets of staff within a central department or
a service delivery agency.
1 “Public Services for the Future: Modernisation, Reform, Accountability – Comprehensive Spending Review:
Public Service Agreements 1999-2002” December 1998. Available at www.hm-
treasury.gov.uk/pub/html/psa/csrpsa.pdf.2 House of Commons Treasury Committee Ninth Report “Spending Review 2000”, 1 August 2000.
http://www.publications.parliament.uk/pa/cm199900/cmselect/cmtreasy/485/0072003.htm.3 “Spending Review 2000: Public Service Agreements 2001-2004” July 2000. Available at www.hm-
treasury.gov.uk/sr2000/psa/index.html.
1
4 Report to Parliament by the National Audit Office, ordered by the House of Commons, ‘Measuring the
Performance of Government Departments’, 2001. See the accompanying box for summary of this report.
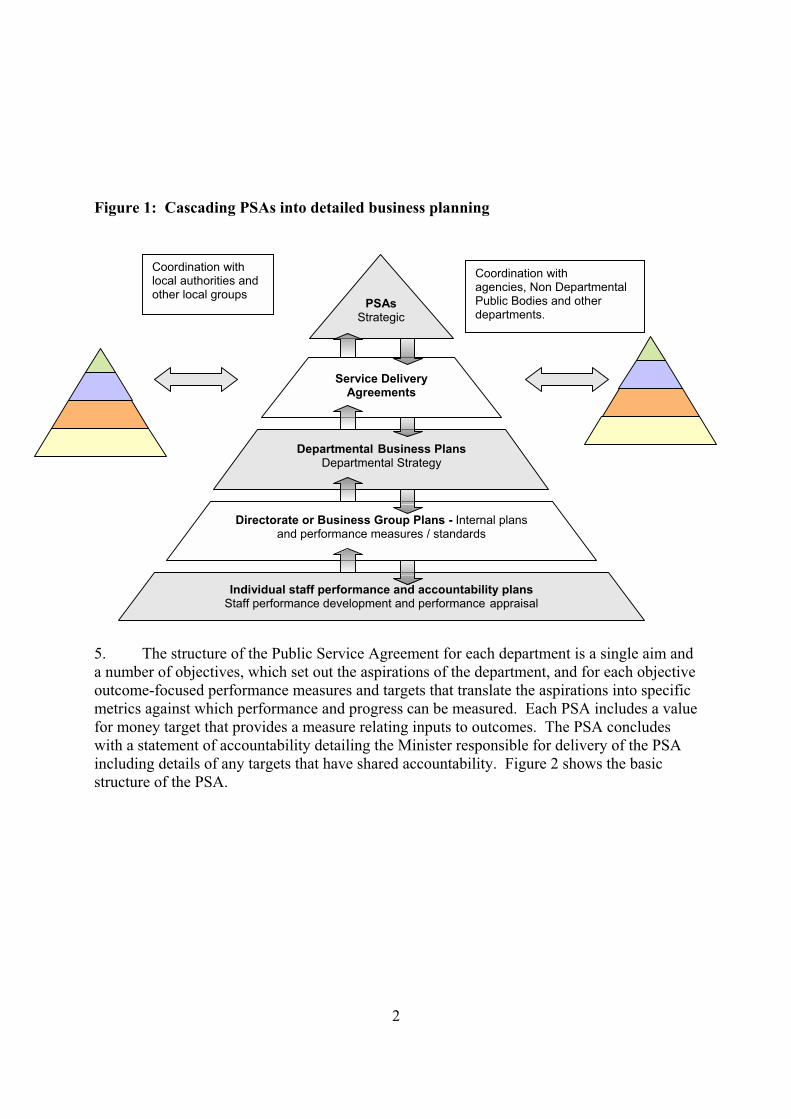
Figure 1: Cascading PSAs into detailed business planning
Individual staff performance and accountability plansStaff performance development and performance appraisal
Directorate or Business Group Plans - Internal plansand performance measures / standards
Departmental Business PlansDepartmental Strategy
PSAsStrategic
Service DeliveryAgreements
Coordination withlocal authorities andother local groups
Coordination withagencies, Non DepartmentalPublic Bodies and otherdepartments.
5. The structure of the Public Service Agreement for each department is a single aim and
a number of objectives, which set out the aspirations of the department, and for each objective
outcome-focused performance measures and targets that translate the aspirations into specific
metrics against which performance and progress can be measured. Each PSA includes a value
for money target that provides a measure relating inputs to outcomes. The PSA concludes
with a statement of accountability detailing the Minister responsible for delivery of the PSA
including details of any targets that have shared accountability. Figure 2 shows the basic
structure of the PSA.
2
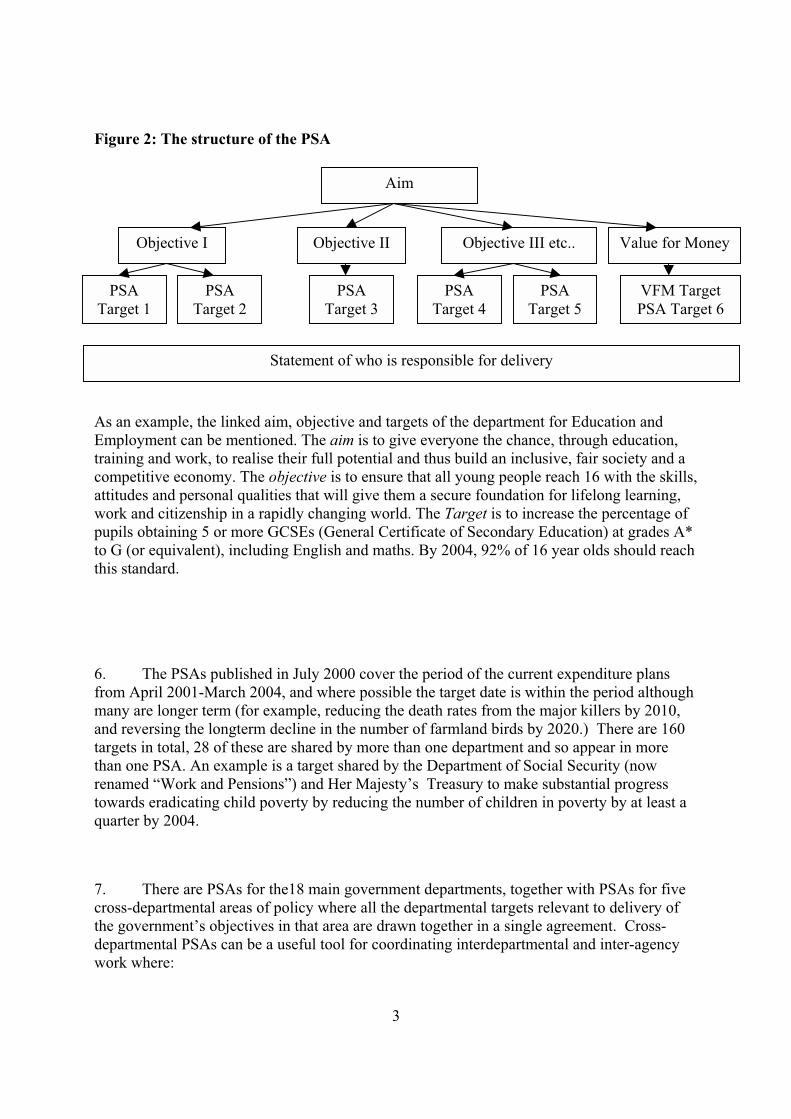
Figure 2: The structure of the PSA
VFM Target
PSA Target 6
PSA
Target 5
PSA
Target 4
PSA
Target 3
PSA
Target 2
Value for Money Objective III etc.. Objective II
PSA
Target 1
Objective I
Aim
Statement of who is responsible for delivery
As an example, the linked aim, objective and targets of the department for Education and
Employment can be mentioned. The aim is to give everyone the chance, through education,
training and work, to realise their full potential and thus build an inclusive, fair society and a
competitive economy. The objective is to ensure that all young people reach 16 with the skills,
attitudes and personal qualities that will give them a secure foundation for lifelong learning,
work and citizenship in a rapidly changing world. The Target is to increase the percentage of
pupils obtaining 5 or more GCSEs (General Certificate of Secondary Education) at grades A*
to G (or equivalent), including English and maths. By 2004, 92% of 16 year olds should reach
this standard.
6. The PSAs published in July 2000 cover the period of the current expenditure plans
from April 2001-March 2004, and where possible the target date is within the period although
many are longer term (for example, reducing the death rates from the major killers by 2010,
and reversing the longterm decline in the number of farmland birds by 2020.) There are 160
targets in total, 28 of these are shared by more than one department and so appear in more
than one PSA. An example is a target shared by the Department of Social Security (now
renamed “Work and Pensions”) and Her Majesty’s Treasury to make substantial progress
towards eradicating child poverty by reducing the number of children in poverty by at least a
quarter by 2004.
7. There are PSAs for the18 main government departments, together with PSAs for five
cross-departmental areas of policy where all the departmental targets relevant to delivery of
the government’s objectives in that area are drawn together in a single agreement. Cross-
departmental PSAs can be a useful tool for coordinating interdepartmental and inter-agency
work where:
3
• several departments are involved in delivering a number of related outcomes;
• the task is of major importance to the government’s key objectives;
• delivery depends on a significant element of joint working at national as well as local
level; and
• it is helpful to articulate shared objectives as well as shared targets.
The five policy areas with a cross-departmental PSA are Sure Start (a programme for
disadvantaged children aged 0-3), Welfare to Work (a programme providing employment
opportunities for the young and long-term unemployed and disadvantaged groups), the
Criminal Justice System, Action Against Illegal Drugs and Local Government.
Box 1. PSA for cross-departmental policy area: Action Against Illegal Drugs
Aim
To create a healthy and confident society, increasingly free from the harm caused by the misuse of drugs.
Objectives and Performance Targets
Objective I: to help young people resist drug misuse in order to achieve their full potential in society.
Target: Reduce the proportion of people under the age of 25 reporting the use of Class A drugs by 25% by
2005 (and by 50% by 2008). (Also in Home Office PSA)
Objective II: to protect our communities from drug-related anti-social and criminal behaviour.
Target: Reduce the levels of repeat offending amongst drug abusing offenders by 25% by 2005 (and by
50% by 2008). (Also in Home Office PSA)
Objective III: to enable people with drug problems to overcome them and live healthy and crime-free lives.
Target: Increase the participation of problem drug abusers in drug treatment programmes by 55% by 2004
(by 66% by 2005 and by 100% by 2008). (Also In Department of Health PSA)
Objective IV: to stifle the availability of drugs on our streets.
Target: Reduce the availability of Class A drugs by 25% by 2005 (and by 50% by 2008). (Also in Customs
& Excise PSA)
Who is Responsible for Delivery?
This PSA covers government activity against illegal drugs, coordinated by the Minister for the Cabinet
Office and led by the Secretary of State for Health, the Secretary of State for Education and Employment,
the Home Secretary, and the Paymaster General. On behalf of Ministerial colleagues the Home Secretary,
supported by the Secretary of State for Health and the Secretary of State for Education and Employment,
takes the lead on target 1. The Home Office's prime contribution is through effective management of the
Drug Prevention Advisory Service and support for Drug Action Teams. The Home Secretary also has lead
responsibility for delivery of target 2. The Secretary of State for Health has lead responsibility for delivery
of target 3. The Paymaster General has lead responsibility for delivery of target 4, supported by the Home
Secretary. Anti-drugs operations in Scotland, Wales and Northern Ireland are the responsibility of these
Devolved Administrations.
4
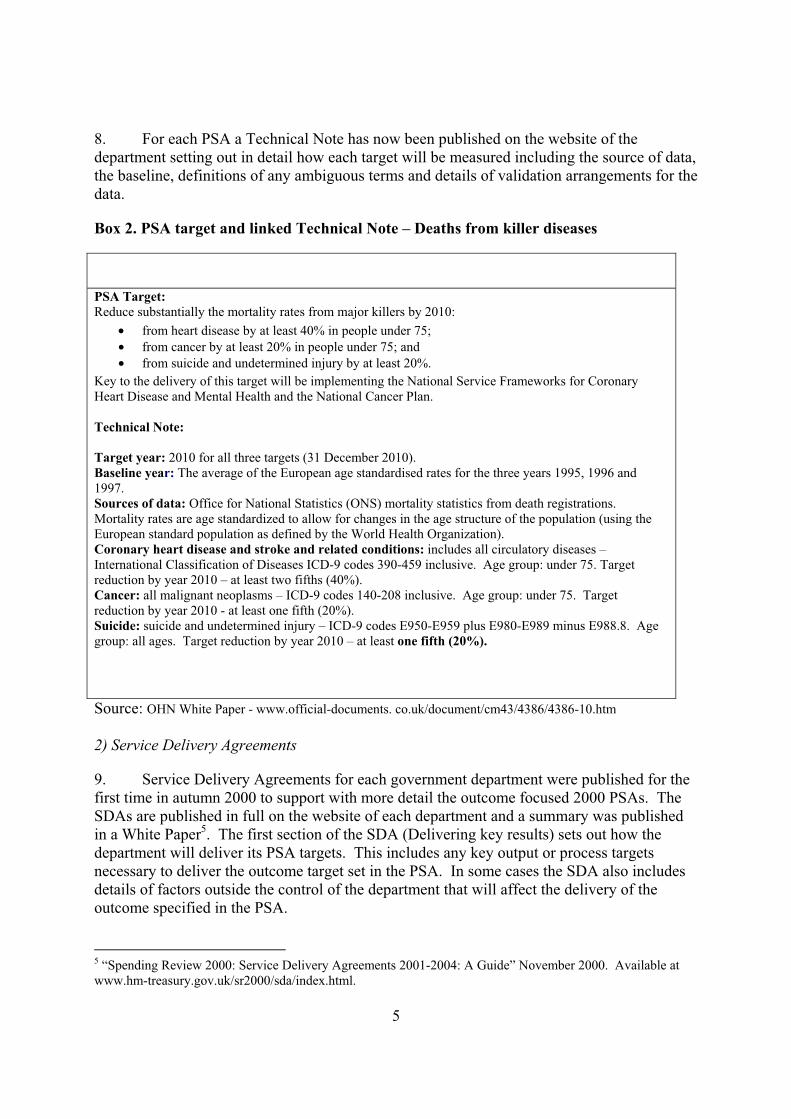
8. For each PSA a Technical Note has now been published on the website of the
department setting out in detail how each target will be measured including the source of data,
the baseline, definitions of any ambiguous terms and details of validation arrangements for the
data.
Box 2. PSA target and linked Technical Note – Deaths from killer diseases
PSA Target:
Reduce substantially the mortality rates from major killers by 2010:
• from heart disease by at least 40% in people under 75;
• from cancer by at least 20% in people under 75; and
• from suicide and undetermined injury by at least 20%.
Key to the delivery of this target will be implementing the National Service Frameworks for Coronary
Heart Disease and Mental Health and the National Cancer Plan.
Technical Note:
Target year: 2010 for all three targets (31 December 2010).
Baseline year: The average of the European age standardised rates for the three years 1995, 1996 and
1997.
Sources of data: Office for National Statistics (ONS) mortality statistics from death registrations.
Mortality rates are age standardized to allow for changes in the age structure of the population (using the
European standard population as defined by the World Health Organization).
Coronary heart disease and stroke and related conditions: includes all circulatory diseases –
International Classification of Diseases ICD-9 codes 390-459 inclusive. Age group: under 75. Target
reduction by year 2010 – at least two fifths (40%).
Cancer: all malignant neoplasms – ICD-9 codes 140-208 inclusive. Age group: under 75. Target
reduction by year 2010 - at least one fifth (20%).
Suicide: suicide and undetermined injury – ICD-9 codes E950-E959 plus E980-E989 minus E988.8. Age
group: all ages. Target reduction by year 2010 – at least one fifth (20%).
Source: OHN White Paper - www.official-documents. co.uk/document/cm43/4386/4386-10.htm
2) Service Delivery Agreements
9. Service Delivery Agreements for each government department were published for the
first time in autumn 2000 to support with more detail the outcome focused 2000 PSAs. The
SDAs are published in full on the website of each department and a summary was published
in a White Paper5. The first section of the SDA (Delivering key results) sets out how the
department will deliver its PSA targets. This includes any key output or process targets
necessary to deliver the outcome target set in the PSA. In some cases the SDA also includes
details of factors outside the control of the department that will affect the delivery of the
outcome specified in the PSA.
5
5 “Spending Review 2000: Service Delivery Agreements 2001-2004: A Guide” November 2000. Available at
www.hm-treasury.gov.uk/sr2000/sda/index.html.
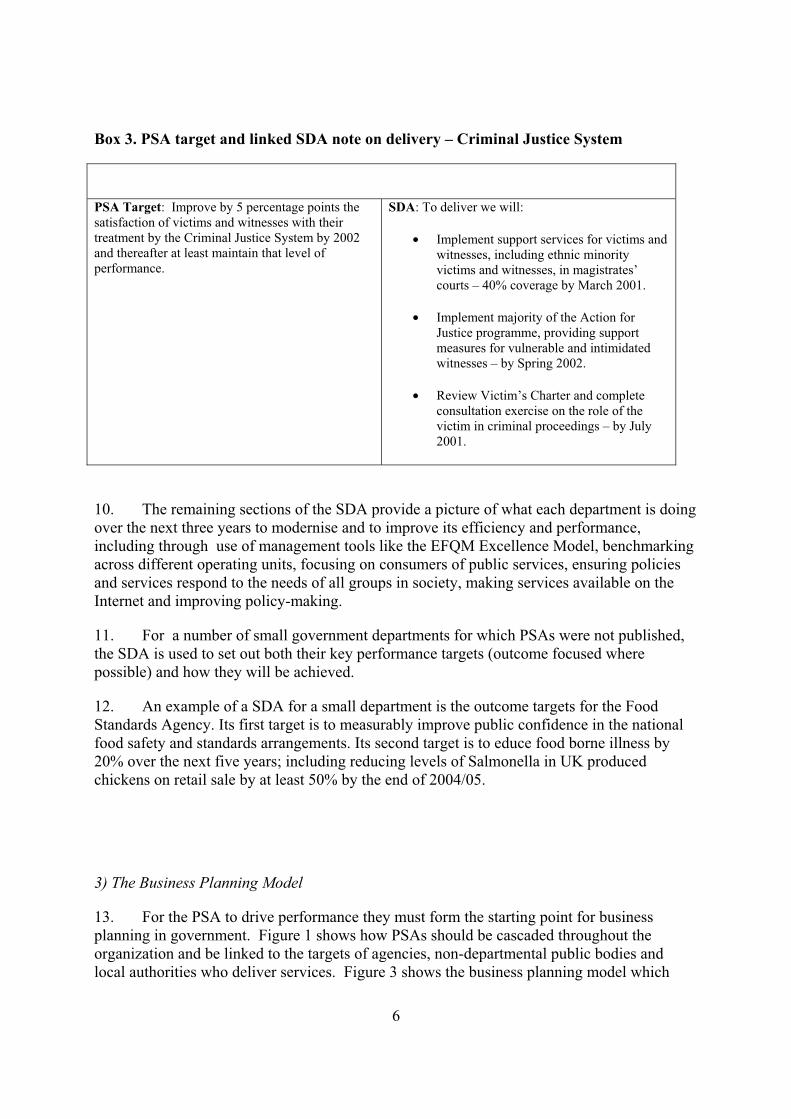
Box 3. PSA target and linked SDA note on delivery – Criminal Justice System
PSA Target: Improve by 5 percentage points the
satisfaction of victims and witnesses with their
treatment by the Criminal Justice System by 2002
and thereafter at least maintain that level of
performance.
SDA: To deliver we will:
• Implement support services for victims and
witnesses, including ethnic minority
victims and witnesses, in magistrates’
courts – 40% coverage by March 2001.
• Implement majority of the Action for
Justice programme, providing support
measures for vulnerable and intimidated
witnesses – by Spring 2002.
• Review Victim’s Charter and complete
consultation exercise on the role of the
victim in criminal proceedings – by July
2001.
10. The remaining sections of the SDA provide a picture of what each department is doing
over the next three years to modernise and to improve its efficiency and performance,
including through use of management tools like the EFQM Excellence Model, benchmarking
across different operating units, focusing on consumers of public services, ensuring policies
and services respond to the needs of all groups in society, making services available on the
Internet and improving policy-making.
11. For a number of small government departments for which PSAs were not published,
the SDA is used to set out both their key performance targets (outcome focused where
possible) and how they will be achieved.
12. An example of a SDA for a small department is the outcome targets for the Food
Standards Agency. Its first target is to measurably improve public confidence in the national
food safety and standards arrangements. Its second target is to educe food borne illness by
20% over the next five years; including reducing levels of Salmonella in UK produced
chickens on retail sale by at least 50% by the end of 2004/05.
3) The Business Planning Model
13. For the PSA to drive performance they must form the starting point for business
planning in government. Figure 1 shows how PSAs should be cascaded throughout the
organization and be linked to the targets of agencies, non-departmental public bodies and
local authorities who deliver services. Figure 3 shows the business planning model which
6
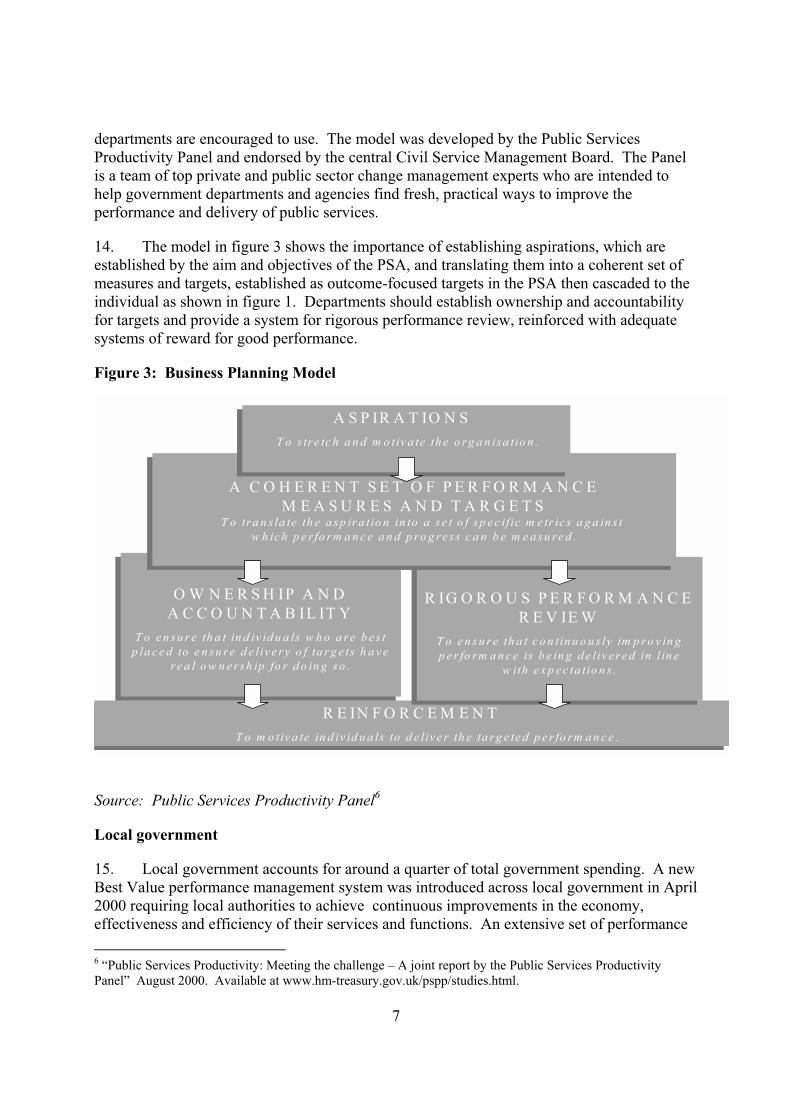
departments are encouraged to use. The model was developed by the Public Services
Productivity Panel and endorsed by the central Civil Service Management Board. The Panel
is a team of top private and public sector change management experts who are intended to
help government departments and agencies find fresh, practical ways to improve the
performance and delivery of public services.
14. The model in figure 3 shows the importance of establishing aspirations, which are
established by the aim and objectives of the PSA, and translating them into a coherent set of
measures and targets, established as outcome-focused targets in the PSA then cascaded to the
individual as shown in figure 1. Departments should establish ownership and accountability
for targets and provide a system for rigorous performance review, reinforced with adequate
systems of reward for good performance.
Figure 3: Business Planning Model
R E IN F O R C E M E N T
T o m o tiv a te in d iv id u a ls to d e liv e r th e ta rg e te d p e r fo rm a n c e .
R E IN F O R C E M E N T
T o m o tiv a te in d iv id u a ls to d e liv e r th e ta rg e te d p e r fo rm a n c e .
O W N E R S H IP A N D
A C C O U N T A B IL IT Y
T o e n su re th a t in d iv id u a ls w h o a re b e s t
p la c e d to e n su re d e liv e r y o f ta rg e ts h a v e
r e a l o w n e r sh ip fo r d o in g so .
O W N E R S H IP A N D
A C C O U N T A B IL IT Y
T o e n s u r e th a t in d iv id u a ls w h o a r e b e s t
p la c e d to e n su re d e liv e r y o f ta rg e ts h a v e
re a l o w n e r sh ip fo r d o in g so .
R IG O R O U S P E R F O R M A N C E
R E V IE W
T o e n s u re th a t c o n tin u o u s ly im p r o v in g
p e r fo r m a n c e is b e in g d e liv e re d in l in e
w ith e x p e c ta tio n s .
R IG O R O U S P E R F O R M A N C E
R E V IE W
T o e n s u r e th a t c o n tin u o u s ly im p ro v in g
p e r fo rm a n c e is b e in g d e liv e r e d in l in e
w ith e x p e c ta tio n s .
A C O H E R E N T S E T O F P E R F O R M A N C E
M E A S U R E S A N D T A R G E T ST o tra n s la te th e a sp ira tio n in to a s e t o f s p e c ific m e tr ic s a g a in s t
w h ic h p e r fo r m a n c e a n d p ro g r e s s c a n b e m e a su r e d .
A C O H E R E N T S E T O F P E R F O R M A N C E
M E A S U R E S A N D T A R G E T ST o tra n s la te th e a sp ira tio n in to a s e t o f sp e c if ic m e tr ic s a g a in s t
w h ic h p e r fo r m a n c e a n d p r o g re s s c a n b e m e a su re d .
A S P IR A T IO N S
T o s tr e tc h a n d m o tiv a te th e o r g a n is a tio n .
A S P IR A T IO N S
T o s tr e tc h a n d m o tiv a te th e o rg a n isa tio n .
Source: Public Services Productivity Panel6
Local government
15. Local government accounts for around a quarter of total government spending. A new
Best Value performance management system was introduced across local government in April
2000 requiring local authorities to achieve continuous improvements in the economy,
effectiveness and efficiency of their services and functions. An extensive set of performance
7
6 “Public Services Productivity: Meeting the challenge – A joint report by the Public Services Productivity
Panel” August 2000. Available at www.hm-treasury.gov.uk/pspp/studies.html.
measures and targets provides the framework against which this improvement is measured
and achieved. For each given activity, the aim is to capture all the key dimensions of service
delivery. A programme of local service reviews is subject to external review and independent
inspection, by the Best Value Inspectorate of the Audit Commission. This will highlight
examples of best practice and trigger intervention by central government in the event of
serious service failure.
16. In its first year of operation, the Best Value performance indicators tended towards
separate measures of input and output rather than outcome. But the clear intention is to refine
the indicators over time and move to real outcome measures. The Audit Commission has
ceased setting its own performance indicators for local government in favour of a
developmental role in quality of life and cross-cutting measures which will help achieve this
enhanced focus on outcomes. Research is also underway into how good cost effectiveness
measures might be constructed, which relate outcomes to resource use.
17. Further steps are being taken to strengthen the link between national targets and local
delivery by piloting local Public Service Agreements (LPSAs) between central government
and individual local authorities.
18. The aim of local PSAs is to agree a package of around 12 key outcome targets
reflecting national PSA targets and local priorities. If they perform well over the next three
years, local authorities will be rewarded, partly through financial benefits and partly through
increased autonomy (greater flexibilities and freedoms). Local PSAs will therefore provide
real incentives to improve performance and sharpen the focus on outcomes, including cross-
cutting targets which require close co-operation with other local partners.
19. Following the pilot with 20 local authorities in 2001-02, local PSAs will be rolled-out
to all 150 upper tier local authorities from 2002..
Government agencies
20. Following the ‘Next Steps’ initiative in the 1980s, there are now 136 Executive
Agencies of government departments employing approximately 75% of civil servants, which
play a key role in delivering government services to the public. The achievement of the
objectives and targets set out in the PSAs therefore requires that the priorities of agencies are
aligned with those of government departments, and that agency performance targets are
consistent with the delivery of the PSA targets.
21. Agencies have historically focused performance measurement on process and output
measures (ref "Exec Agencies 1999" White Paper) but the shift at departmental level towards
focusing on outcomes (rather than outputs and processes) is starting to be reflected within
agency performance reporting. One of the challenges is to define an individual agency's
distinct contribution towards the wider policy objective so that a clear outcome can be
articulated for the agency itself. A number of agencies have been successful in defining
measurable outputs that bridge the gap between the immediate results of their activities and
the outcomes that Government is aiming to achieve. Box four below contains an example,
which illustrate the linkages between agency measures and PSAs.
8
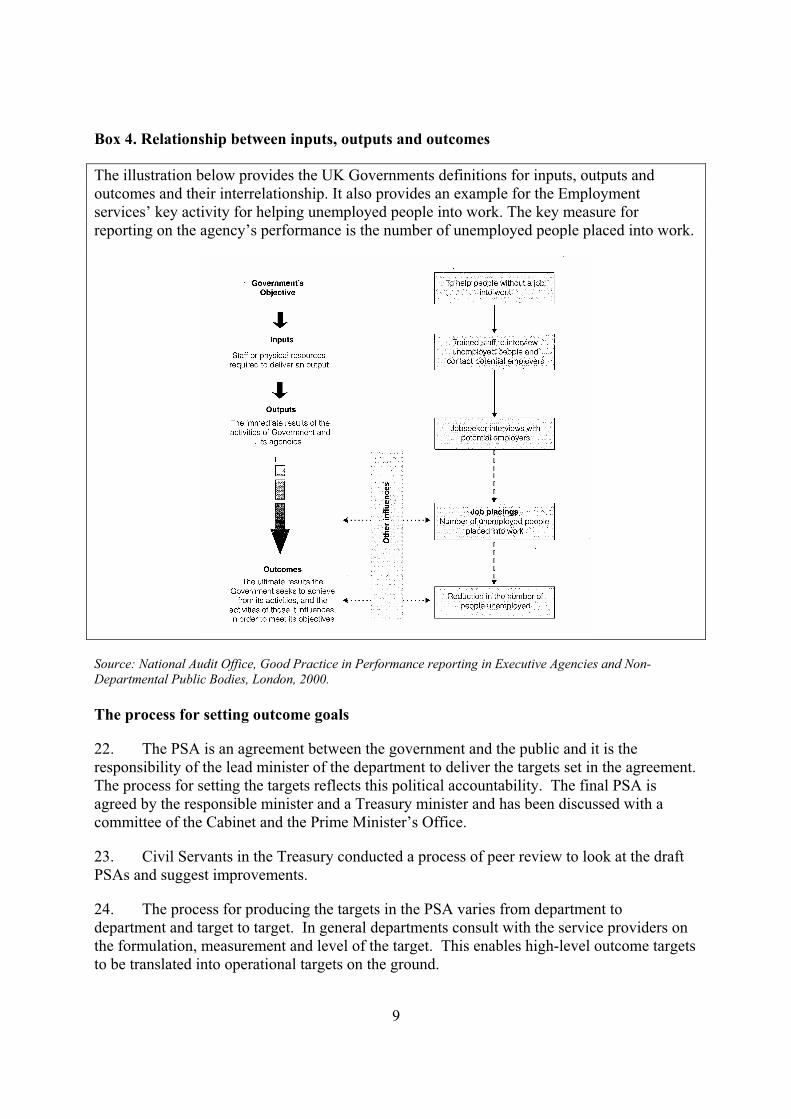
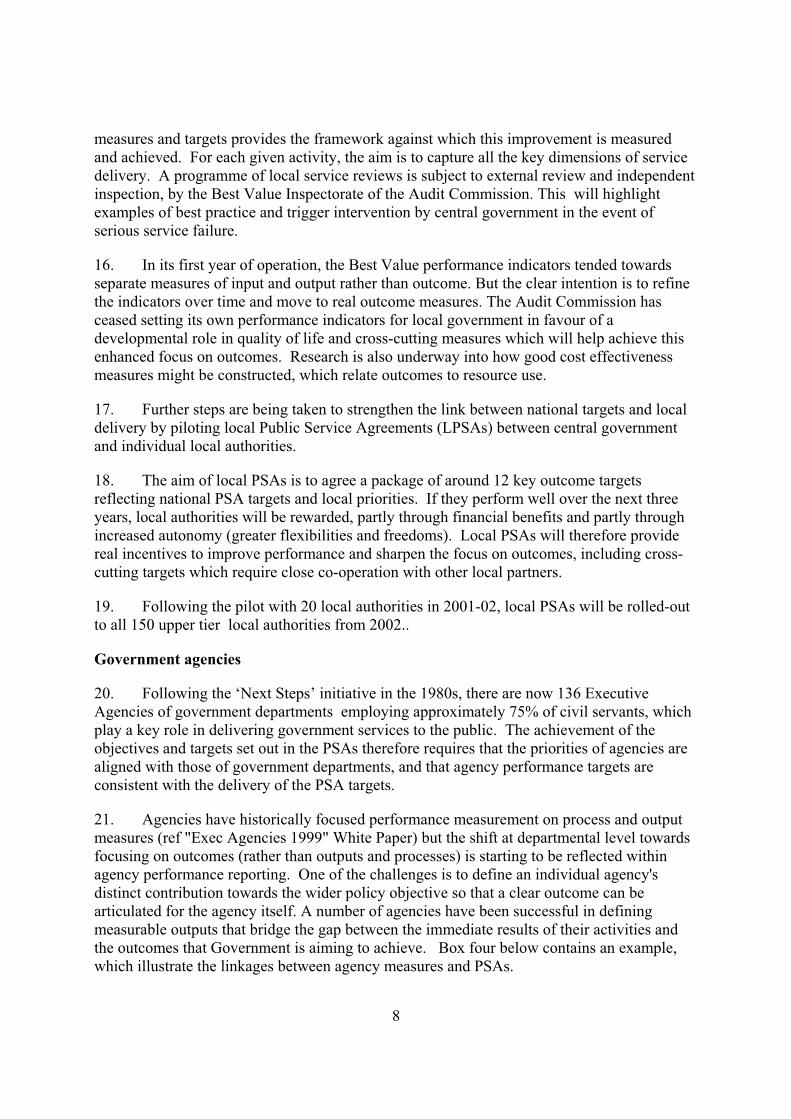
Box 4. Relationship between inputs, outputs and outcomes
The illustration below provides the UK Governments definitions for inputs, outputs and
outcomes and their interrelationship. It also provides an example for the Employment
services’ key activity for helping unemployed people into work. The key measure for
reporting on the agency’s performance is the number of unemployed people placed into work.
Source: National Audit Office, Good Practice in Performance reporting in Executive Agencies and Non-
Departmental Public Bodies, London, 2000.
The process for setting outcome goals
22. The PSA is an agreement between the government and the public and it is the
responsibility of the lead minister of the department to deliver the targets set in the agreement.
The process for setting the targets reflects this political accountability. The final PSA is
agreed by the responsible minister and a Treasury minister and has been discussed with a
committee of the Cabinet and the Prime Minister’s Office.
23. Civil Servants in the Treasury conducted a process of peer review to look at the draft
PSAs and suggest improvements.
24. The process for producing the targets in the PSA varies from department to
department and target to target. In general departments consult with the service providers on
the formulation, measurement and level of the target. This enables high-level outcome targets
to be translated into operational targets on the ground.
9
25. A White Paper is published presenting the full set of Public Service Agreements to
Parliament. Parliamentary Select Committees make use of the PSA in discussions with
ministers and civil servants from a department.
26. The Treasury produces guidance for drafting the PSA and setting outcome targets.
Box five below contains a summary of the key parts of the guidance on drafting PSAs
including advice on dealing with the difficulties of targeting outcomes.
Box 5. Setting the Right Target – summary of advice on how to set targets:
• PSAs should be concise: only 2 or 3 pages.
• A PSA should include department’s aim, objective, statements of responsibility, and value for money
target.
• The range of targets in a PSA should reflect the scope of the Government’s priorities and of the
department’s objectives. Each target should relate to a specific objective and all objectives should have a
target. Where a target relates to delivery of more than one objective, this should be stated.
• Targets should usually be outcome focused. They should be SMART (Specific, Measurable, Achievable,
Relevant, Timed).
• Value for money targets should wherever possible match inputs to outcomes ie capture real increases in
productivity.
• Targets should be easily understood by the public - not too technical and jargon free.
• Targets should be deliverable - able to cascade down to operational level. (PSA targets are not supposed
to be operational targets but the link to the operational level should be clear).
• Targets should still be met where outside factors help determine whether they can be met. However, these
outside factors should be outlined in the SDA.
• Targets should be owned by those who have to deliver them, which means, wherever possible, they
should be involved in designing them.
• The easy option should not be taken when setting a target if the result would be that the target would not
focus on the policy outcome desired, e.g. quality of service is often more difficult to measure than
quantity but the use of consumer surveys etc can make it possible.
Relating outcome goals to resources
27. In the 2000 Spending Review resources were allocated to departments for the next
three years (2001-2004) and at the same time PSAs were agreed that set out the outcomes
which departments are expected to meet with these resources. The decisions on budgets and
targets are made along side each other and are considered by the same Cabinet committee. So
the negotiation of outcome measures is part of the budgeting process.
28. To inform the discussions of the Cabinet committee, departments are asked to provide
information on the outputs or improvements in outcomes that any additional money requested
would buy.
29. The White Papers which announce the new expenditure plans and the new PSAs are
published as part of the same budget announcement.
30. As part of the introduction of Resource Accounting and Budgeting there will be a
section of the new accounts that will set out the links between resources and the objectives set
in PSAs.
10
Identifying and managing risk
31. One of the risks of focusing on outcomes is the difficulty of isolating the impact of
factors outside the control of the department. Departments have been encouraged to detail
these factors in their Service Delivery Agreement to provide a context for the published
outcome results.
32. The risks on delivery of the targets are considered as part of the regular monitoring
process. The minister in charge of the department or the ministers accountable for a cross-
departmental PSA are called before the Cabinet committee on public spending, or a sub-
committee for smaller departments, and are required to present information on their
performance so far, the risks to delivery and their action plans to manage the risk. These
meetings are planned to take place twice a year, more regular meetings are conducted at
official level. These discussions are not public.
Monitoring and reporting
33. The Treasury collects information on progress against targets every quarter and
presents that to the Cabinet committee. Departments provide a public progress report against
targets annually in their annual departmental reports in the spring. The Treasury is planning
to provide more regular public progress reports on the Internet.
34. Every target in the PSA is monitored quarterly by the Treasury. The frequency at
which new information is available depends on the measure and the data underlying it – data
on inflation is available monthly so progress can be updated each quarter, data on exam
results is available annually and can only be updated every fourth quarter.
35. The progress against targets provides a background to decisions on resources in the
following budgeting round.
Policy evaluation
36. Steps are being taken to improve our knowledge of the effects on outcomes of existing
and proposed policies and programmes.
37. As a starting point the Treasury is engaging with each department in an assessment of
the evidence base underpinning departmental delivery of individual PSA objectives. The
assessment is a stepping-stone - either directly to better policy (if it turns out that policy is
somewhat out of line with the evidence base), or more likely to a better analytical, piloting,
research and evaluation programme to fill the evidence gap and to improve policies in the
medium term.
38. Box six below contains a summary of a framework which departments will be using
to find the gaps in the evidence base.
11
Box 6. Evidence assessment relating to an objective (EARO)
Below is a summary of a five step framework for determining the analysis, information and modelling that is
required to assess whether departments have the right policies in place to meet individual PSA objectives:
Step 1 Determine which combinations of objectives and targets are to be assessed, making use of a clear
structure showing the links between the department’s aim, objectives, targets and policies. In addition, list the
related policies and, where appropriate, the resources devoted to them. Consult policy leads and stake holders on
policy constraints and establish a reference panel (including outside experts) to discuss issues during the
assessment.
Step 2 Gather information, including key data to give a picture of the stylised facts relating to the area of
concern. Create a conceptual framework to explain the factors that affect the objective and identify the full range
of policy instruments that can have an impact.
Step 3 Gather existing evidence on relationship between objectives and policies, e.g. previous policy evaluations,
policy option appraisals, academic literature and think tank reports. (Feedback from steps 2 and 3 to step 1).
Step 4 Assess the adequacy of the present departmental and academic research and identify what more needs to
be done.
Step 5. Design Research, taking into account the need to meet objectives, whether the research should be
external or internal and whether there are constraints to publication.
From the start the review process must be designed to maximise its impact upon policy making, e.g. by:
• securing the right skills and capability;
• securing policy endorsement for the objectives of the project;
• ensuring research addresses the critical political issues (e.g. winners and losers); and
• publishing and disseminating results both of the assessment and of the consequent research.
Source: Her Majesty’s Treasury
Conclusion
39. PSAs and the outcome focused performance targets which they encompass are an
integral part of the spending review process in the United Kingdom. In our view, there
introduction during the Comprehensive Spending Review in 1998 marked an important
milestone in the Government’s drive to improve the quality of public services . For the first
time decisions on public expenditure plans over a three-year period were tied to public
commitments by departments to meet specific and measurable targets from their expenditure
programmes. Departments were given a real incentive to drive up standards in the public
services and the public was given the opportunity to judge their performance. Greater focus
on policy outcomes was achieved in Spending Review 2000 with the total number of PSA
targets being reduced and a significant shift towards most of these being outcome targets.
Much of the detail on how departments will deliver on policy outcomes was moved in
Spending Review 2000 from the PSAs to new Service Delivery Agreements. If PSAs answer
the ‘what’ question about public service commitments, the SDAs are intended to answer the
‘how’ question. Technical Notes were also introduced, giving details on how departments’
performance against PSA targets would be measured. Technical Notes enable the public to
have confidence that performance measurement is properly undertaken.
12
40. Outcome focussed management in the UK continues to develop as we learn the
lessons from our experience. For instance, the introduction of technical notes in Spending
Review 2000 highlighted the issue of ensuring that the underlying data systems behind
performance measurement are externally validated. A high proportion of these systems
already meet high standards of validation, for example for those measures which have the
status of “national statistics”. However, there is room for improvement. A Treasury led
working group is now examining how, where there are weaknesses, a greater component of
external validation can be introduced. In addition, we are examining ways of improving
SDAs by making them more focussed on their primary task of translating high-level targets
into the action required to achieve these outcomes on the ground. We are also keen to ensure
that the system is not unduly bureaucratic and onerous, and we are examining the issue of
whether some small departments (which do not have PSAs) should be exempted altogether
from the administrative burden of an SDA.
41. As prosperity increases people’s expectations tend to increase and they become less
tolerant of poor service, whether provided by the private or public sectors. This reality poses
a challenge to governments across the world at the start of the new century. The UK
Government has responded to this challenge by focussing on ensuring that it gets specific and
measurable improvements in public services and that these improvements represent value for
money. This constitutes a major agenda to deliver and demonstrate change in the
commissioning, management and delivery of public services. The agenda will be clarified and
re-focused by the revised PSAs which will be published in July 2002 with the government’s
expenditure plans for 2003-2006.
Literature, www and studies
42. There are a number of references that readers may find useful. Some of these are
included in footnotes above but are repeated here for ease of reference:
“Public Services for the Future: Modernisation, Reform, Accountability – Comprehensive
Spending Review: Public Service Agreements 1999-2002” December 1998 and supplement in
March 1999. Available at www.hm-treasury.gov.uk/pub/html/psa/csrpsa.pdf and www.hm-
treasury.gov.uk/pdf/1999/psa99.pdf.
“Spending Review 2000: Public Service Agreements 2001-2004” July 2000. Available at
www.hm-treasury.gov.uk/sr2000/psa/index.html.
“Spending Review 2000: Service Delivery Agreements 2001-2004: A Guide” November
2000. Available at www.hm-treasury.gov.uk/sr2000/sda/index.html. Also includes links to individual
departments’ SDAs.
Technical Notes for Public Service Agreements 2001-2004 are available on departmental
websites. An index can be found at www.hm-treasury.gov.uk/sr2000/psa/technote.html.
13

“Good Practice in Performance Reporting in executive Agencies and Non-Departmental
Public Bodies”, 9 March 2000. Available at www.nao.gov.uk/publications/nao_reports/index.htm.
“Aiming to Improve: The Principles of Performance Measurement”, June 2000. Available at
www.audit-commission.gov.uk/ac2/PIfirst.htm.
“On Target: The Practice of Performance Indicators”, June 2000. Available at www.audit-
commission.gov.uk/ac2/PIfirst.htm.
14
Appendix – Terminology
43. The following are the definitions commonly used in the UK in this area. These
definitions are taken from a draft of a Performance Information Framework that the Treasury
is drafting together with the other key central department and the audit organisations. The
definitions have not yet been finalised:
Aim : A summary of the overall objectives. The aim provides a vision statement that
embraces the desired future that the organisation is working towards.
Economy: Relates to the cost of inputs being consumed. Economy measures can used to
indicate whether the right price was paid to acquire the necessary inputs.
Efficiency: Efficiency represents the relationship between inputs and outputs. Efficiency is
the ratio of output to input.
Effectiveness: The extent to which outputs achieve the desired outcomes. Effectiveness
measures are concerned with the strength of the relationship between a given intervention and
outcomes.
Cost effectiveness/Value for Money: The relationship between the resources consumed and
the outcomes achieved. Cost effectiveness measures highlight how well the costs of
interventions have been translated into desired outcomes. Measures of cost effectiveness can
indicate which set of interventions is best able to achieve the desired outcomes at the lowest
cost. Ideally, cost effectiveness measures apply full economic costs against a clearly defined
outcome.
Inputs: The resources that contribute to the production and delivery of an output. Inputs
commonly include things such as labour, physical resources, administrative services and IT
systems.
Objectives: An objective is a succinct statement of the key goal(s) being pursed over the
medium to long run. Objectives reflect the key components of the intended strategy.
Outcomes: Outcomes are the impacts on, or consequences for, the community, of the
activities of the Government. Outcomes reflect the intended and unintended results from
government actions and provide the rationale for government interventions. Improving the
health status of the population is an example of an outcome.
Outputs: Outputs are the goods and services produced by the organisation. Outputs are
delivered to an external party (usually to the public either individually or collectively) and
comprise the majority of day-to-day interaction between people and government. Outputs
15
include things such as issuing licences, investigations, assessing applications for benefits and
providing policy advice.
Performance measures: Performance measures establish the basis or means by which
performance can be demonstrated against a robust scale. For accountability and management
purposes performance measures are also partnered with performance standards or
performance targets.
Performance standard: Achievement of a given level of desired performance or minimum
level of acceptable performance status to be achieved or maintained.
Performance targets: A performance target represents the level of performance expected
from a particular activity against the relevant performance. Using the above example, a
suitable performance target may be a quantitative target such as sustained reduction by 5%
over a stipulated period. Such targets should be consistent with the !SMART criteria.
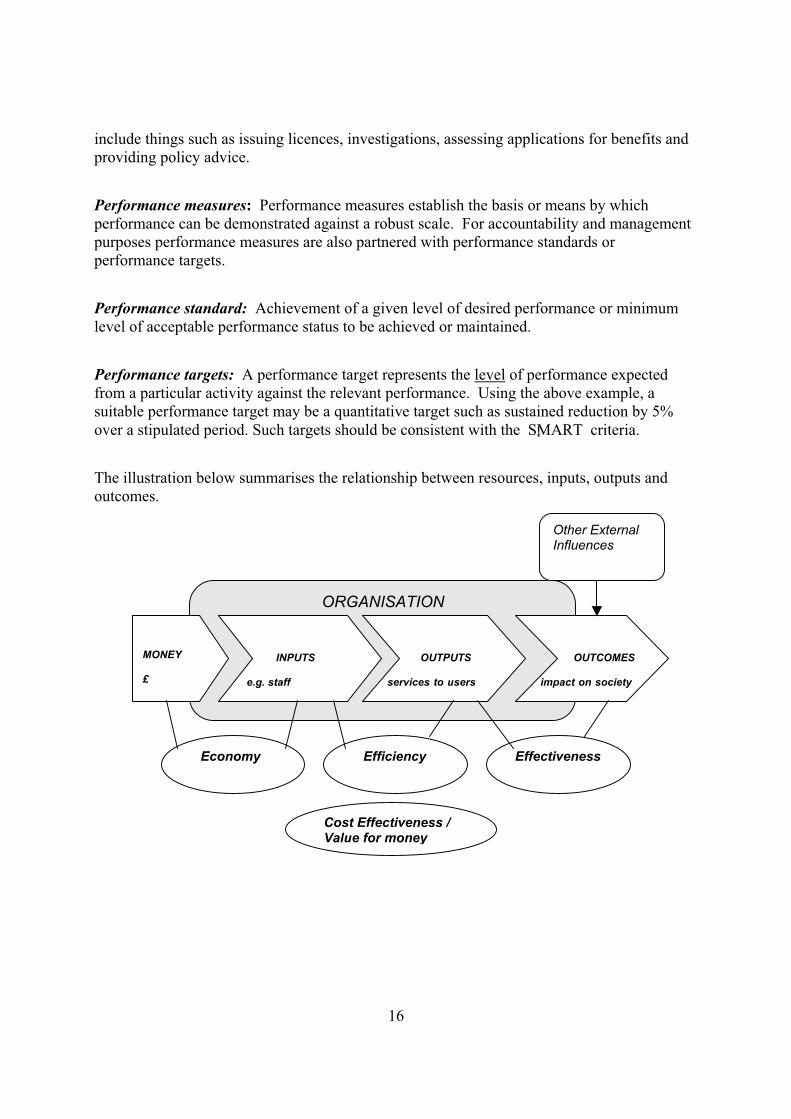
The illustration below summarises the relationship between resources, inputs, outputs and
outcomes.
ORGANISATION
MONEY
£
INPUTS
e.g. staff
OUTPUTS
services to users
Other External
Influences
Economy Efficiency Effectiveness
OUTCOMES
impact on society
Cost Effectiveness / Value for money
16