Embed Size (px)
Citation preview

University of Twente
Performance measurement in universities
--Managerial Perspective--
Author:
Xiaocheng Wang
Business Administration – Financial Management
Faculty of Management and Governance
University of Twente
Supervisors:
Prof. dr. Nico P. Mol
Faculty of Management and Governance
University of Twente
Dr. Ben Jongbloed
Senior Research Associate
Center for Higher Education Policy Studies
University of Twente
17th January 2010
Enschede, The Netherlands
2
Acknowledgement
This paper is a final assignment in University of Twente. The topic of assignment is about
a managerial perspective of performance measurement in universities. It took months of
knowledge accumulation until the paper is completed. To a financial management track
student, it is a rather challenging task initially without much knowledge in this field. The
start was with pains. I eventually went through it with many helps from my supervisors and
people in the university.
I would like to sincerely thank my supervisors, Prof. Mol and Dr. Jongbloed, whose kindly
supports and insights that help the completion of this thesis in the university. They have
provided me with much knowledge in performance measurement.
I would like to especially thank Dr. Stolk who has provided me with much knowledge
regarding performance indicators in the university. I would like to thank my study advisor
Charlotte in BOZ as well. She encouraged me when I was frustrated in the research. I
would also like to thank other people who provided me with information in the interviews.
I would also thank weilei who help me check the grammars and spellings in the paper.
I would also sincerely thank my parents, Wang Meihua and Du yaxian whose
unconditional supports help me finish my studies in the Netherlands. I miss them very
much. I miss my kind grandmother as well.
Xiaocheng Wang
17th January 2010

3
Table of content
Executive Summary 5
List of Abbreviations 6
Part ⅠⅠⅠⅠ
1. Introduction 7
1.1 Topic 7
1.2 Background 7
1.3 Research objectives and research questions 8
1.4 Structure 8
2. Methodology 10
2.1 Research outline 10
2.2 Problems statement 10
2.3 Research design 11
2.4 Research limitations 13
Part ⅡⅡⅡⅡ
3. Reviews of Performance measurement 14
3.1 From a single dimensional to multi-dimensional PM approach 15
3.2 Balanced Scorecard 16
4. The complexity of universities in terms of performance measurement 18
4.1 University characters and constraints in performance measurement 18
4.2 The distinction of academic and management performance 20
4.3 Multi-dimensional framework 21
4.4 Use of key performance indicators 22
4.5 University academic performance 22
4.6 University management performance 24
4.7 Conclusion 26
5. Performance indicators 28
5.1 Performance indicators in the literatures 29
5.2 Academic performance indicators 30
5.2.1 Research Performance indicators 30
5.2.2 Educational Performance indicators 40
5.3 Management performance indicators 49
5.3.1 Financial indicators 49
5.3.2 Human resource (employee) indicators 56
5.4 Conclusion 62
4
Part ⅢⅢⅢⅢ
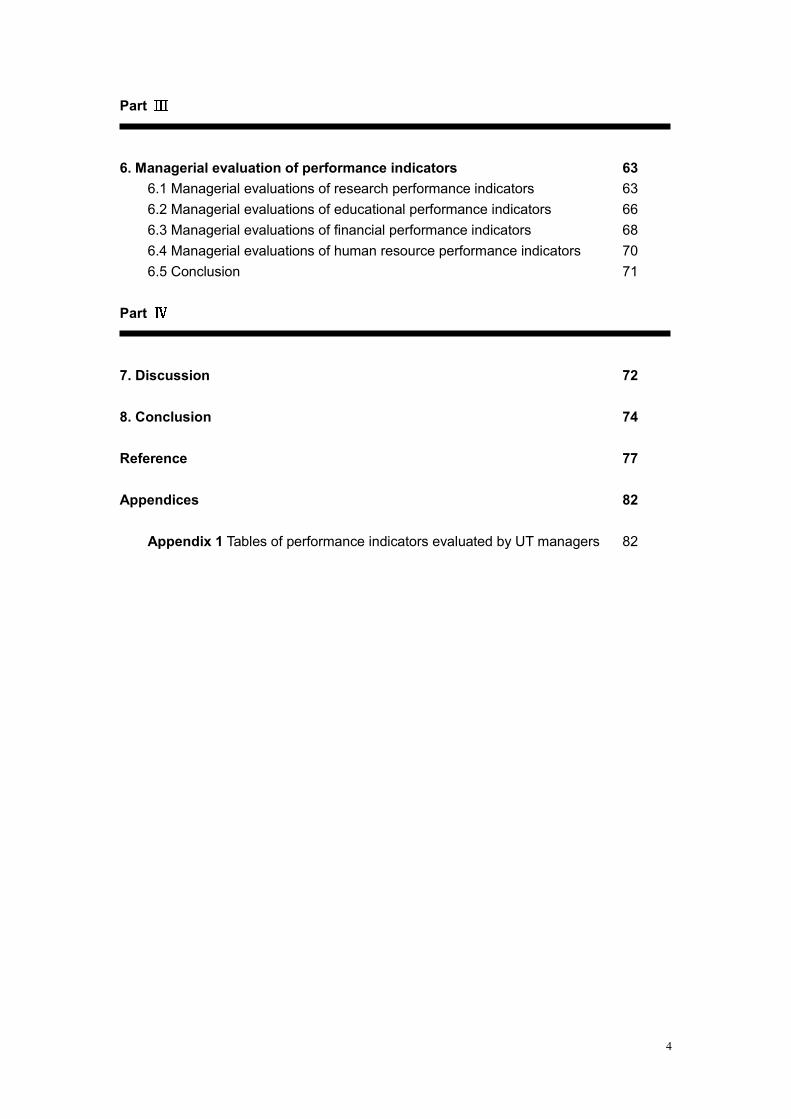
6. Managerial evaluation of performance indicators 63
6.1 Managerial evaluations of research performance indicators 63
6.2 Managerial evaluations of educational performance indicators 66
6.3 Managerial evaluations of financial performance indicators 68
6.4 Managerial evaluations of human resource performance indicators 70
6.5 Conclusion 71
Part ⅣⅣⅣⅣ
7. Discussion 72
8. Conclusion 74
Reference 77
Appendices 82
Appendix 1 Tables of performance indicators evaluated by UT managers 82

5
Executive Summary
This paper is about a research on performance measurement in universities. The
research is to figure out how the performance of universities can be measured from a
managerial perspective. By far, few performance measurement frameworks originated
from public sector have been developed for performance measurement in universities.
Frameworks such as balanced scorecard in for-profit settings have been increasingly
adapted to performance measurement in universities. Risks are concerned that they may
incompletely grab the nature of university services. The paper aims to develop a
framework for performance measurement in universities. Therefore, the main research
question is:
“To what extent can a tailored performance measurement framework along the lines
of BSC be developed for performance measurement in university settings?”
Universities are characterized by goal ambiguity (Barbara and Richard I, 1999, pp 25).
Thus traditional performance measurement approach by goal rational model may not be
able to serve performance measurement in universities. This paper argues that the
performance of universities can be measured by the extent to which each of university
functions is maintained toward the university goals. Based on this argument, it proposes a
solution to performance measurement in universities by the distinction of academic
performance and management performance. The distinction creates four sub-dimensions
under the academic and management performance dimensions. The four sub-dimensions
are education, research, finance and human resources. The four sub-dimensions
construct a balanced concept for university managers in management control. Meanwhile,
a complete performance measurement framework based on the notion of pyramid from
Cross and Lynch (1992) is established by integration of the performance dimensions and
performance indicators.
Performance measurement in universities has been focused on output and outcome
measurement. However, outcome and output measures fail to catch the whole process of
academic activities. This paper suggests that input and process measures be included in
the performance measurement in addition to output and outcome measures. Most current
performance indicators are quantitative. They are unable to measure some aspects such
as customer satisfaction and employee satisfaction. Therefore, the use of qualitative
indicators is proposed. Performance indicators under each sub-dimension are developed.
Pros and cons of the indicators for university management are argued before interviews
are going to be held in the University of Twente. The purpose of interviews is not only to
know current performance indicators and performance measurement in the university but
it is also to justify how valid and reliable the indicators in the paper can be put into actual
applications in the university settings. In the end of this paper, potential problems and
limitations from this research are discussed. The report ends with a conclusion for this
research.

6
List of Abbreviations
BSC -Balanced Scorecard
CUC -Committee of University Chairs in United Kingdom
FTE -Full-time equivalent
HBO -Higher Professional Education in the Netherlands
HAVO -Senior General Secondary Education in the Netherlands
IP - Intellectual Property
KPI -Key performance indicator
PM -Performance measurement
UT -University of Twente
VO -University Education in the Netherlands
VWO -University Preparatory Education

7
Part ⅠⅠⅠⅠ
1. Introduction
1.1 Topic
This paper is written about a managerial perspective of performance measurement in
universities in the Netherlands. The topic of performance measurement is popular in
public sector. People are curious to know how the performance of universities can be
measured comprehensively and effectively. By far, few frameworks from public sector
have been developed for performance measurement in universities. This paper aims to
devote to this field and tries to develop a tailored framework in university settings.
1.2 Background
Great pressure has been exerted on public organizations to increase the quality of
services, efficiency and effectiveness in utilization of resource in new public management
reform. As one kind of public organizations, universities have experienced great changes
since then. Managerialism and entrepreneurialism concepts have been increasingly
applied to university management. The ideology of university as a corporate actor has
increasingly gained importance in systematic coordination in recent years (De Boer et al.
2007). Universities are responsible for themselves in resources seeking and market
seeking. They need to be self-sufficiency and be accountable to the stakeholders.
Increasing call for accountability to performance but with less financial supports from
governments has caused university managers much burden in management control.
University managers may need to seek external resources to meet the extra demands by
academic activities. They may also need to ensure that the university resources are
properly allocated. The managers need to undertake full responsibilities for their actions
within the regulations to obtain value for money. Therefore, university managers may be
relying more on performance measurement mechanisms to acquire the information in
management control.
Performance measurement is defined as a process of quantifying the efficiency and
effectiveness of actions (Neely et al. 1995). It is regarded as a pre-cautionary and
diagnostic management control system to help managers to keep track of performance in
organizational activities. The role of performance measurement is as if an information
supplier, which can be regarded as a first step toward building an effective management
control mechanism. University managers with information can facilitate the planning
course of operation and pay attentions to aspects where improvements are needed. To
capture valuable information in universities, performance indicators on multi-dimensions
must be developed. This paper tends to provide some insights into the development of
performance indicators and the build of a tailored multi-dimensional performance
measurement framework from a managerial perspective in university settings. The paper

8
hopes to provide some contributions for university managers who are interested in
performance measurement issues.
1.3 Objectives and research questions
The main objective of this paper is to look at a managerial perspective of performance
measurement in universities and to develop a tailored framework in university settings.
The paper will also study a popular balanced scorecard performance measurement
approach. By studying its robust design, we hope to learn from it and adapt its balanced
concept to the development of framework in this paper.
Based on these objectives, the main research question is formed as:
“To what extent can a tailored performance measurement framework along the lines of
BSC be developed for performance measurement in university settings?”
As a further step toward clarification of the main research question, sub-research
questions are developed:
1. How can the performance of universities be captured using comprehensive
dimensions?
2. In which way can a comprehensive performance measurement framework be set
up for application along the lines of BSC in university settings?
3. Which performance indicators in the literatures (esp. PM in public organizations)
along with own performance indicators could be used in the performance
measurement in the University of Twente?
1.4 Structure
The paper is divided into four parts, here being the first part. In the first part of the paper, it
will mainly be an introduction of research topic and methodology for this research.
Research problems and research methods for answering to the research questions will be
discussed.
In the second of part of this paper, it begins with a review of performance measurement
and the evolvement from a single dimensional to multi-dimensional performance
measurement framework. The balanced scorecard approach is discussed in terms of its
pros and cons of application in higher education. Then the paper enters into the
discussions of university characteristics and difficulties in performance measurement
design. The discussions need to figure out a framework to capture the performance of

9
universities. After the framework, the paper will discuss each performance dimension and
their importance to the performance areas. Performance indicators are the final and most
important section in this part in which a portfolio of performance indicators in each
dimension will be discussed.
In the third part of this paper, it will mainly be summaries of interviews in the University of
Twente. A list of performance indicators will be evaluated by the selected people in the
university.
In the final part of this paper, it will be discussions of potential performance measurement
issues in the research. The paper ends with a conclusion of the whole research.

10
2. Methodology
2.1 Research outline
The paper is based on a research in University of Twente for the sake of in-depth
comprehension into university affairs and environment. An overall methodology is a
qualitative approach by reviewing existing literatures and an empirical study by conducting
interviews in the University of Twente. By means of the interviews, performance indicators
will be evaluated by university managers to see how valid they could be put into use.
The endorsement of indicators by university managers plays a critical role to the success
of this research. The interviews will shed light on what their concerns in terms of pro and
cons of performance indicators. The desired outputs of this research include a list of
performance indicators and a comprehensive performance measurement framework. The
actual implementation of the framework is not discussed but potential issues associated
with will be analyzed.
2.2 Problems statement
In past years, increasing interest in performance measurement in higher education was
generated (Broadbent 2007, Ruben 1999) and various multi-dimensional frameworks
such as balance scorecard and dashboard have been applied to higher education sector.
By far, few frameworks from public sector have been developed for performance
measurement in universities. Many performance measurement frameworks are originated
from private sector in for-profit settings. Risks are concerned that they are unable to grab
the nature of every public organization and they are unable to understand the complexities
of university services.
A common character from the frameworks applied in higher education is that established
dimensions are translated from clear organizational goals. Therefore, performance in the
organizations can be measured by the extent to which these goals are achieved. The
dimensions help capturing key performance areas that are critical to achieve the
organizational goals. To universities with ambiguous goals, the measurement can not be
applicable. University goals are often vague and broad e.g. contribution to regional
development, social impact, world-class research and education etc. It is a rather difficult
task to capture the performance areas related to the ambiguous goals. Besides, it is
unclear to what extent the established dimensions from the frameworks can capture and
understand the performance areas and goals in universities. Current performance
measurement in universities focuses much on output and outcome measurements which
are unable to grab the whole process of university academic activities from input, process
to output till outcome. A call for input and process measurement is necessary to cover a
broad perspective of university activities. Performance indicators are mostly quantitative,
which they are unable to measure subjects that are not able to be quantified. The use of
qualitative indicators may be necessary in measuring the non-quantifying objects.

11
2.3 Research design
The research is a combination of literature studies and an empirical research in University
of Twente. It goes by answering three research questions.
With regard to the first research question of “How can the performance of universities be
captured using comprehensive dimensions”, we begin by reviewing existing performance
measurement literatures and expect that they will provide some helpful insights into
performance measurement in universities. A rational-goal model indicates that
organizational performance can be measured by the extent to which organizational goals
are achieved. Since the rational-goal model is only applicable for organizations with clear
goals, universities with ambiguous goals may not be very appropriate for this approach.
Then the research moves onto search for other literatures about performance
measurement in public organizations. Past literatures demonstrate that organizations with
ambiguous goals can be measured by other factors such as general condition of fiscal
health, ability to acquire resources and ability to satisfy stakeholders etc (Sowa et al.
2004). The measurement is very similar to a general health check of human body to see
how each of function of body is well maintained. Therefore, this paper argues that the
performance of universities can be measured by the extent to which each of university
functions is maintained toward the university goals. The performance can be mainly
divided into academic and management performance. The academic performance
dimension can be further divided into research and educational dimensions. Education
and research are two traditional activities in most universities. The management
performance dimension can be further divided into financial and human resource
dimensions. Both of them are the enablers to the performance in university management.
With regard to the second research question “In which way can a comprehensive PM
framework be set up for application along the lines of BSC in university settings, we begin
by studying existing performance frameworks (BSC, performance pyramid, dashboard) to
get to know how performance framework can be established and fit for university settings.
An idea of pyramidal framework is triggered by Cross and Lynch (1992)’s notion on
pyramid with cascading measures toward organization objectives. In Cross and Lynch’s
framework, performance dimensions at different organizational hierarchies are integrated
into the framework.

12
Figure 1 Performance pyramid
(Source: www. Accaglobal .com)
The dimensions in the framework represent performance areas in different organizational
layers. While in university settings, such cascading measures at different dimensions in a
pyramid just fit the university hierarchies. At the top of pyramid, it could be the university
vision as a whole in performance measurement with two main dimensions (academic and
management). Four sub-dimensions (research, education, finance, human resource) are
placed under the two main dimensions, meaning a clear division of hierarchy. At the
bottom of pyramid, there are all kinds of indicators under the four sub-dimensions. The
clear division of management and academic performance and their subsequent
dimensions in the pyramid also show that university managers need to balance the
performance measurement among them. A further study of Cross and Lynch’s pyramid
discloses that they does not indicate the use of indicators. While in university settings, the
use of indicators is necessary for different levels of managers. At higher level, managers
may depend on key performance indicators with aggregated information on performance
areas. To managers at lower level, they may need operational indicators with more
specific information. Therefore, the final framework in the paper is a pyramidal framework
that integrates performance indicators with performance dimensions.
In response to the third research question of “Which performance indicators in the
literatures (esp. PM in public organizations)along with own performance indicators could
be used in the University of Twente?” we begin by searching for existing performance
indicators in literatures and developing own performance indicators. Existing performance
indicators from the literatures and academic reports in higher education in United
Kingdom and Australia provide some helpful instructions in how performance indicators
can be developed. From these reports, some performance indicators will be collected and
classified into the four sub-dimensions in this paper. The indicators will be discussed in
13
terms of validity and reliability in the measurement and pros and cons for management.
The discussions lead to a few open and close questions for interviews in the empirical
research. In order to see how valid the indicators can be put into actual use under each
dimension, interviews were held to consult managers in the University of Twente. The
interviews were made in the university because this research is a graduation assignment
in the university. People in interviews are from different levels of positions in the
management. They are Prof. dr. Loon, the dean of school of management and
governance, Prof. dr. Krabbendam, the head of department of Operations, Organization
and Human Resources and Dr. Stolk, the senior staff officer in Strategy & Communication.
They were interviewed with open and close questions regarding the performance
measurement and performance indicators in the university. The interview with Dr. Stolk
has produced much helpful information regarding the evaluation of performance indicators
in the university. The results are formulated into a final list of performance indicators
based on the managerial evaluations.
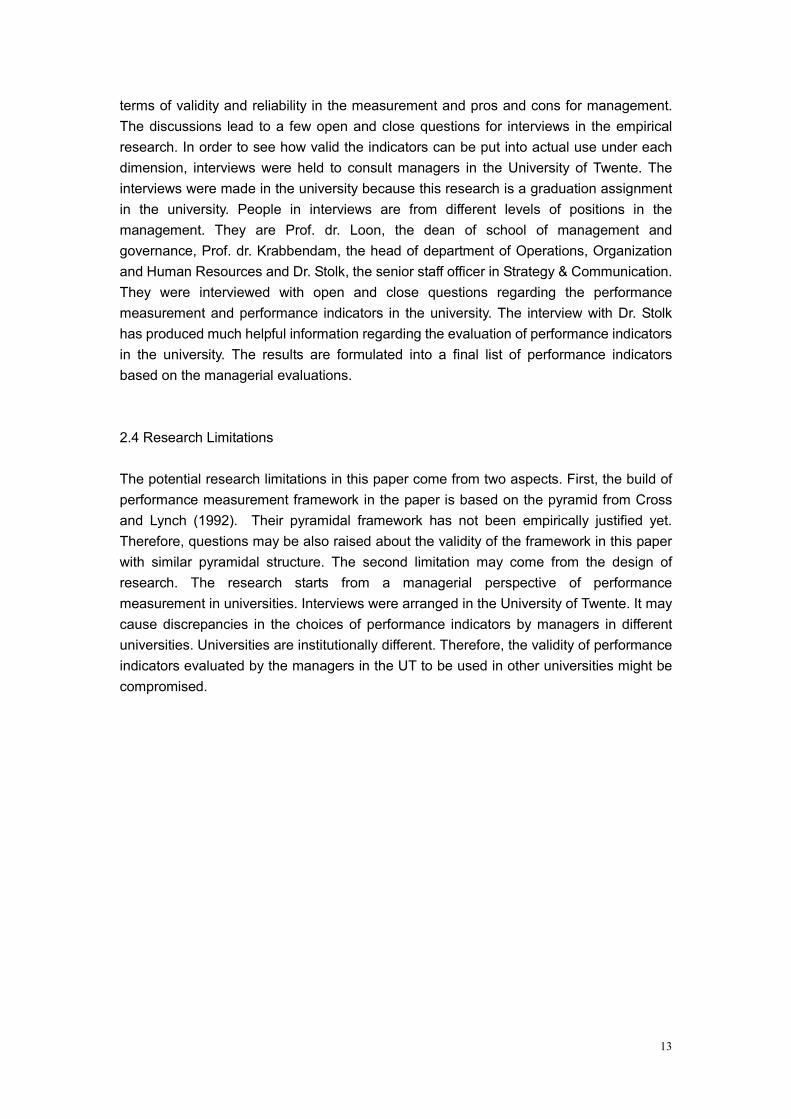
2.4 Research Limitations
The potential research limitations in this paper come from two aspects. First, the build of
performance measurement framework in the paper is based on the pyramid from Cross
and Lynch (1992). Their pyramidal framework has not been empirically justified yet.
Therefore, questions may be also raised about the validity of the framework in this paper
with similar pyramidal structure. The second limitation may come from the design of
research. The research starts from a managerial perspective of performance
measurement in universities. Interviews were arranged in the University of Twente. It may
cause discrepancies in the choices of performance indicators by managers in different
universities. Universities are institutionally different. Therefore, the validity of performance
indicators evaluated by the managers in the UT to be used in other universities might be
compromised.
14
Part ⅡⅡⅡⅡ
3. Reviews of Performance measurement
To begin with the discussions of performance measurement, we need first to understand
what organizational performance is. By far, there is no unanimous definition of
organizational performance because organizations vary by industries with different
situations. A description of organizational performance without considering actual
organizational context might be faint. Efforts on clarifying organizational performance
remain the most vague and loosely defined construct in the relative field of study (Rogers
and Wright 1998). From the rational-goal model, organizational effectiveness or
performance can be defined as the extent to which organizational goals are achieved
(Price 1972). Thus, organizational performance can be measured by the extent to which
the organizational goals are achieved. The system resource model defines organizational
effectiveness through the survival of the organization by actively interacting with its
environments to seek scare and valuable resources to ensure its functioning (Seashore
and Yuchtman 1967). The survivability of an organization is a critical indicator of
organizational performance. The ability to acquire valuable and scare resources is an
important mean to an organization’s survival. The models provide researchers with two
theoretical approaches that can be helpful in configuration of organizational performance
and in the design of performance measurement in the paper.
The brief reviews of performance measurement and organizational theories still do not
solve the problem of what scholars might be looking at particularly in organizations. A
widely accepted performance measurement definition by Neely et al. (1995) is the
process of quantifying the efficiency and effectiveness of actions. The discussion of
efficiency and effectiveness must relate to different contexts and measurement subjects
such as inputs, outputs and outcomes (Carmona and Sieh, 2004, pp101). According to
Carmona and Sieh’s definition, efficiency generally described as the ratio of output to
inputs relates to attributes such as the number of outputs etc. Effectiveness describes a
relation between outcome effect and output. Neely (1998, p5) describe the effectiveness
of organizational actions as to what extent customer’s demands are met. The
measurements on effectiveness and efficiency vary as organizational contexts and goals
vary. If efficiency is only regarded as an output measurement at quality of products in a
manufacturing company, then it might only need to measure the ratio of flawed products to
total qualified ones. In reality, efficiency ought to be a result from multi-dimensional efforts
in achieving organizational goals with least cost. In public organizations, the
measurements on efficiency and effectiveness are even more complicated due to
complexities between business features and non-business features, clear and ambiguous
goals. The measurements are inclined to be multi-dimensional, which depends on how
people interpret the “efficiencies” to a specific organization goal is. For example, if one of
the goals of hospitals is to provide treatments and cares for patients who are suffering

15
from a variety of diseases and incidents, then the measurements on efficiency ought to
cover aspects such as the number of patients cured in each category of illnesses, the
average number of days a patient stay in hospital and the average amount of time each
doctor spends on a patient etc. The measurements will require considerable numbers of
multi-dimensional indicators in tracking every characteristic of hospital services. The
measurements on effectiveness are also multi-dimensional, which they depend on how
people interpret the “effectiveness” to a specific organizational goal is.
Thus, performance measurement on effectiveness and efficiency is not simply a fixed
form of measurement on organizational past actions. Rather, it is a multi-dimensional
concept that covers broad aspects in public organizations.
3.1 From a single dimension to multi-dimensional PM approach
Early measurements of organizational performance in for-profit settings emphasized
much on financial and accounting models. The models such as return on investment
(ROA), sales growth and net profit margin were widely applied. They provided people with
an easy measurement tool and a common ground where comparisons with other
organizations can be made. Meantime, the only reliance on financial and accounting
models in performance measurement has incurred many criticisms because of misleading
signals for continuous improvements and inadaptable to today’s environment (Kaplan and
Norton 1992).
The shortcomings of only reliance on financial indicators might cause managers in
organizations:
� myopia, which financial indicators may only emphasize on short-term
organizational benefits and be regardless of long-term strategic
planning, development and investment
� dysfunctional behavior, which managers focus on aspects that are
easily measurable and achievable especially when such measures are
linked to rewards (Metawie and Gilman ,2005)
� Inadequate attentions to other aspects where are strategically important
to an organization e.g. people in human service organizations and labor
intensive industries
The financial and accounting techniques provide very limited coverage on organizational
performance and fail to grab more strategic areas such as learning and innovation in the
organizations. Financial information only can hardly lead managers to steer an
organization into right directions.
16
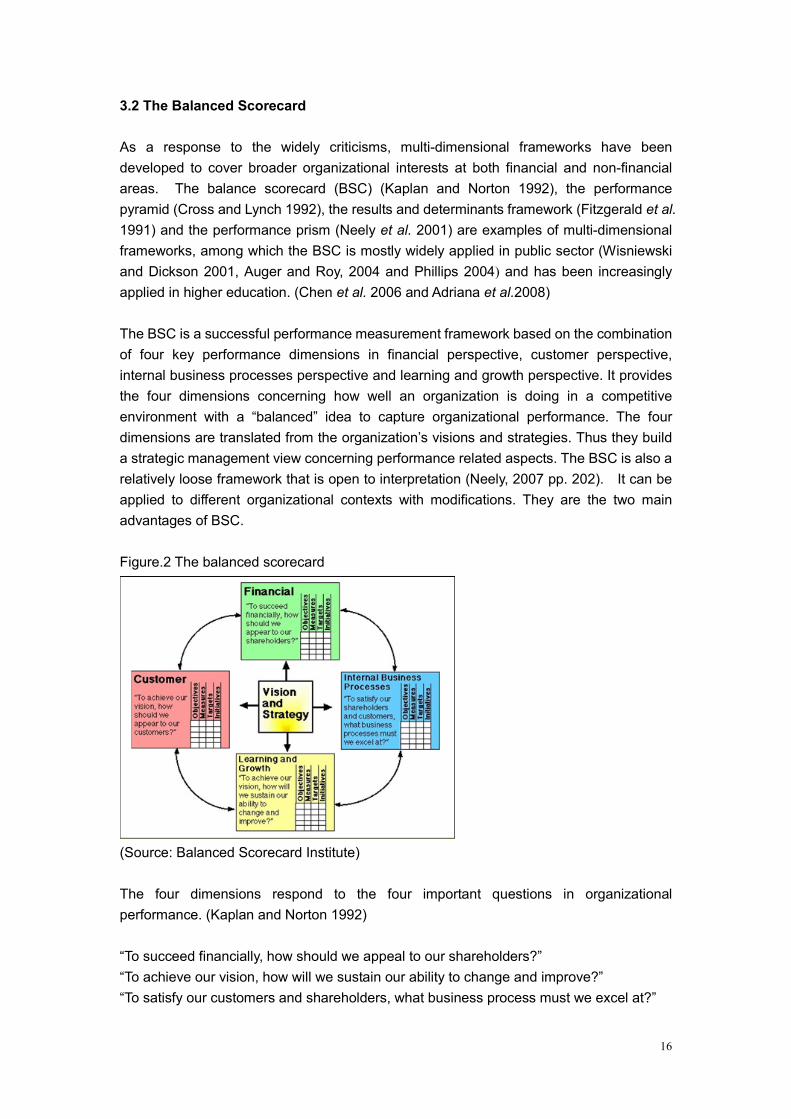
3.2 The Balanced Scorecard
As a response to the widely criticisms, multi-dimensional frameworks have been
developed to cover broader organizational interests at both financial and non-financial
areas. The balance scorecard (BSC) (Kaplan and Norton 1992), the performance
pyramid (Cross and Lynch 1992), the results and determinants framework (Fitzgerald et al.
1991) and the performance prism (Neely et al. 2001) are examples of multi-dimensional
frameworks, among which the BSC is mostly widely applied in public sector (Wisniewski
and Dickson 2001, Auger and Roy, 2004 and Phillips 2004) and has been increasingly
applied in higher education. (Chen et al. 2006 and Adriana et al.2008)
The BSC is a successful performance measurement framework based on the combination
of four key performance dimensions in financial perspective, customer perspective,
internal business processes perspective and learning and growth perspective. It provides
the four dimensions concerning how well an organization is doing in a competitive
environment with a “balanced” idea to capture organizational performance. The four
dimensions are translated from the organization’s visions and strategies. Thus they build
a strategic management view concerning performance related aspects. The BSC is also a
relatively loose framework that is open to interpretation (Neely, 2007 pp. 202). It can be
applied to different organizational contexts with modifications. They are the two main
advantages of BSC.
Figure.2 The balanced scorecard
(Source: Balanced Scorecard Institute)
The four dimensions respond to the four important questions in organizational
performance. (Kaplan and Norton 1992)
“To succeed financially, how should we appeal to our shareholders?”
“To achieve our vision, how will we sustain our ability to change and improve?”
“To satisfy our customers and shareholders, what business process must we excel at?”

17
“To achieve our vision, how should we appear to our customers?”
In public sector, concerns about disadvantages of BSC are also raised in recent years. It
might cause difficulties in labeling a parameter as to a dimension or to another one with
pre-codified framework in the BSC (Silvi et al. 2004). For example, it might be difficult to
label educational indicators as either customer dimension or internal business process
dimension in the BSC. The measurements in educational activities may contain both
“how should we appear to our customers” and “what business process should we excel at”.
In other words, the measurements may contain what universities can offer to students and
what kind of process of knowledge services the universities should excel at. The BSC also
places much emphasis on the overall views of performance in organizations instead of
operational views (Ghalayini et al. 1997). It focuses on the four strategic dimensions that
are expected to capture the critical success factors of a given organization. It may make
the BSC performance measurement only suitable for higher-level managers (e.g. chief
executives).
As a business management tool developed in for-profit settings, the BSC may not be able
to grab every nature of public service organizations and their performance areas. The
design of BSC may be mainly for higher-level managers. Hereby, the application without
modifications may cause difficulties in grabbing key performance dimensions in the
organizations.

18
4. The complexity of university in terms of PM
Universities are in pursuit for knowledge creation and knowledge transmission.
Performance measurement in universities has been focused on academic excellence. In
past decade, the ideology of university as a corporate actor has increasingly gained
importance in systematic coordination in recent years (De Boer et al. 2007). The change
was accompanied by managerialism and entrepreneurialism concepts brought to higher
education sector. A preliminary examination of performance measurement on efficiency
and effectiveness leads to the questions of “What is the efficiency and effectiveness in a
university?” and “How do we correctly label it and hence measure it”.
4.1 University characters and constraints in performance measurement
Universities are characterized by goal diversity and ambiguity which are a common
phenomenon in a wide range of universities. Readers seldom have a clear and direct
impression of university statements in telling them what universities are actually aiming at.
University goals are often complicated and broad e.g. contribution to regional
development, social impact, world-class research etc. Much information is hidden and
need digesting. Universities are not guided by principles of profit maximization solely as
most organizations do in private sector. They may have no priorities in mind in terms of
aggressive resources seeking, cost reduction and profit generation. Instead, universities
may try to maintain a stable status of operating and by that they slowly achieve
organizational objectives. For example, in the mission statement of University of Twente,
it states that
“ The university needs to be responsive to the requirements of the knowledge society and
also has a special responsibility to develop and implement a broad knowledge potential in
science and technology…………the University of Twente also wants to stimulate
economic and social development regionally: in Twente, the north-east of the Netherlands,
and in the Gronau-Twente Euregio”
“Teaching is of the highest standard and the University is committed to: an educational
programme that is in tune with the latest international research developments……The
University of Twente conducts world class research……”
The goal ambiguity of universities suggests that performance measurement can not follow
the rational-goal model which pre-determines that organizations with clear goals are
priority in this model. Organizations with ambiguous goals can be measured by other
factors such as general condition of fiscal health, ability to acquire resources and ability to
satisfy stakeholders etc (Sowa et al. 2004). This approach is very similar to a general
health check of human body to see whether the performance of each body function is well
maintained. Thus, the performance of universities can be measured by the extent to which

19
each of university functions is maintained toward the university goals. Universities have
two main function, academic function and management function. The overall performance
ought to be a combined set of performance dimensions derived from the functions.
Performance measurement on efficiency and effectiveness ought to be based on the
measurement of performance in the functions in the university. For example, when it
comes to efficiency and effectiveness in educational activities, performance in the
university can be measured by the average amount of time for bachelors and masters to
complete studies, the number of graduates and the number of diplomas etc. When it
comes to the efficiency and effectiveness in research, performance in the university can
be measured by the number of publications and the number of citations etc.
To better understand what exactly can be measured by performance indicators, a general
model of input-process-output-outcome needs to be illustrated.
Fig.2 The input-process-output-outcome model
The arrows indicate the general direction of equation from inputs, process, and outputs till
outcomes, which the four aspects are what performance measures arrive at. Tendency
toward performance measurement reflects increasingly call for accountability in higher
education (Ruben 1999). Two factors may influence on this trend. First, it is a general call
for universities to increase the efficiency and effectiveness in management. Second,
higher education is very costly. Financial constraint on investment in universities by the
governments and emphasis on value for money suggest the funds be prudently and
appropriately allocated. Any investment from the governments and individuals must have
some kind of returns in contributions to the development of society, increase in
educational output, employment etc. AUCC (1995) pointed out that the increasing
demand for accountability has led to an interest in outcome measurement in performance
measurement. Not only outcomes measurement, but also output measurement is what
people may be interested in. Both of them focus on the valuable components in the
equation.
However, output and outcome measurement fail to grab the whole comprehensive images
of academic activities in universities. For example, the nature of educational activities
determines that student’s learning is an enduring process from input, process to output till
outcome. By far, most people only see student’s increase in knowledge, skills and
capabilities as a result of educational activities. Little is known about the process of
student learning and what universities have contributed to that process. In order to control
the quality of education services, university managers ought to get to know what has
happened in that process. Therefore, process measurement is becoming necessary to fill
the gap and produce valuable information for the managers in the value-adding process.
When emphases are on output and outcome measurement, input measurement still holds
20
its importance in performance measurement in universities. Heller (2001) stated in the
forward of his book that a critical input (students) still plays a key role in educational
outcomes of a university and some of the best outcomes are produced by a student’s
peers. Therefore, both input and process measurement are of equal importance with
output and outcome measurement in performance measurement in universities. The input
measures incoming resources such as students, infrastructures and instructors etc. The
process measures how universities deal with these resources in educational process,
courses programs and workload schedules etc. The output measures the achievements
that result from the value-added activities and the outcome measures the effects of the
achievements. All the measures together provide university managers with
comprehensive information in university academic activities.
4.2 The distinction between academic and management function
In order to capture the performance of universities, dimensions need to be developed from
the functions in the universities. It might be helpful and clear to distinguish between
university academic function and management function related performance. The
distinction is in line with the overall university academic and business-like structure. It
creates two focal dimensions in capturing the performance of universities. Academic
and management activities are closely linked with each other in university practices.
Either of them could capture a complete and key factor of the performance of universities
solely. For example, a university may have an excellent management system with
excellent personnel but it does not necessarily result in excellent performance in the
university. Academic performance is the core to a university’s performance and
management performance is the one that can enhance and serve academic performance.
Both of them together, they construct a complete picture of performance in different
functional roles in the university. Thus in the measurement of performance in universities,
academic and management performance can be clearly distinguished from each other.
The distinction provides managers with a tailored measurement approach to university
settings.
The two focal dimensions can be further divided into sub-dimensions. Academic
performance is traditionally composed of two kinds of activities, research and education.
They are two kinds of university activities underpinning a society’s development.
Research and educational activities provide people with knowledge and trainings for jobs.
They are sources of new theoretical and practical knowledge as well. Educational and
research activities are the most common activities in wide categories of universities.
Management performance has two components that are important to the performance in
universities. It includes human resources (employee) and financial resources. Managers
in universities must have financial resources to serve customers and hence performance
in financial dimension determines how sustainable the managers are able to provide the
services in long term. For example, investment in infrastructures, research equipments etc.
Meanwhile, as human services provided by universities, staff especially academic staff

21
plays a crucial role in converting organizational inputs into outputs (Hasenfeld 1983).
4.3 Multi-dimensional PM framework
The framework is to be built on the distinction of university academic and management
performance. Academic performance refers to a university’s’ core character in education
and research. Management performance encompasses two important resources. Both of
these resources are related to the capabilities in the university.
Cross and Lynch (1992) developed a performance pyramid model to measure
organizational performance at different hierarchical levels. The notion of framework is built
on cascading measures toward the organization objectives. It composes several layers in
the pyramid where corporate vision is put on the top of pyramid together with two
important market and finance dimensions. Underneath the market and finance
dimensions, the dimensions of productivity, flexibility, customer satisfaction, waste, cycle
time, delivery and quality are placed. The framework suggests that an organization’s
operation at different levels of structure have different focuses which can be monitored by
performance indicators in the dimensions. The dimensions are supporting each other,
which they eventually link the organizational objectives and strategies to actual
operations.
Following the Cross and Lynch’s notion of pyramid, we complete a similar pyramidal
performance measurement framework to capture the performance of universities.
Figure 3, The PM framework for universities
The pyramid is a product of systemic integration of the performance dimensions and
indicators into a complete performance measurement framework. At the top of the
pyramid, it is the university vision as a whole with two main performance dimensions

22
(academic and management) that are closely linked to the university goals. The two main
dimensions are divided into four sub-dimensions (research, education, finance, human
resource). Therefore, it brings with a more strategic and balanced performance
measurement to high-level managers with key performance indicators. At the middle and
bottom of the pyramid, other indicators in four sub-dimensions construct an operational
view of performance measurement in universities. Information from the indicators at each
sub-dimension will be summarized and reviewed by high-level managers to form a main
measurement on academic and management performance. Performance measurement
follows a measure-up model in the framework.
4.4 Use of Key performance indicators
Key performance indicators (KPIs) are sets of measures on aspects that are most critical
to current and future success of an organization (Parmenter, 2007, p3), where competitive
advantages over competitors may be built. They may bring to managers at several
vantages points:
1. KPIs may provide a snapshot of an organization without wasting much
time on volumes of information
2. The information is high-level and can be critical to decision making
3. KPIs can provide a set of competitive advantages in analysis where the
results can be comparable to those in other organizations.
The use of KPIs is not an instant phenomenon but it has been a popular tool in
performance measurement. The CUC report (2006) developed 10 high-level KPIs in the
measurement of institutional performance from a perspective of governors in higher
education, covering both financial and non-financial aspects. Here, the focus is on the
development and selection of KPIs for academic and management dimensions. Although
the use of KPIs has been a hot topic, little guidance or arguments on concrete selection of
KPIs among other performance indicators have been developed. One of common criteria
in selection may be critical and powerful to indicate the performance at their measurement.
The selection procedures could be institutionally differentiated. The selection processes
are very likely to be the result of managerial subjective judgments and may be driven by
external stakeholders in universities.
4.5 university academic performance
Academic performance is a primary indicator to most universities in performance
measurement. It is an icon that people see whether good or bad a university is. As
universities differ, emphases on academic performance differ from one discipline to
another. For example, research universities may place more resources on research
activities than educational activities. Thus, indicators in research dimension may take

23
more credits in the overall measurement of academic performance. The goals of a
university affect what kind of academic activities in the measurement. They can further
influence what kind of management activities should be done in accord with production
process in academic activities. Academic activities traditionally include two components,
research and education. The balance between research and education activities may be
an important character in universities.
Criteria in academic performance disclose a university’s expectations on academic
activities. They provide managers with guidance to measure academic performance at
different levels within the university. Criteria are mostly derived from university goals and
mission statements, which they take on different characteristics at different hierarchies of
university. At university level, criteria for academic performance are broad and show the
university’s general expectations in academic activities. At faculty, departmental and
individual level, they become more specific and concrete to measure academic excellence.
From broad to specific criteria, it leaves much flexibility to managers in interpretation and
developing appropriate indicators that are in line with their situations.
To measure whether a university has excellent research performance, we may perhaps
generally see whether it meets the following broad criteria.
1. Excellent research personnel and recognized research groups or faculty
2. The amount of annual expenditures on researching activities
3. The number of doctorate granted
4. The amount of governmental and third party research funding granted
5. Excellence in research output and outcome
The University of Twente is an enterprising research university which focuses on
technological development. It helps students, companies and governments to achieve
competitive advantages through research and educational activities. The character of
enterprising indicates a close link between university academic activities and market. It
brings research activities with more features of commercialization in research products.
Hence, in addition to the above general criteria for a university, the university should also
bring in the criteria of enterprising in research performance measurement. For example,
criteria such as excellence in commercialization of research outputs, annual increase in
the number of entrepreneurs, spin-off companies etc.
Research activities are mostly carried out by academic staff and PhD students in
universities. Some research programs may be project-based with definite time frame and
are contracted with outside agents. Research performance is usually evaluated by peer
review of outputs e.g. refereed journals. Indicators such as the number of refereed
publications and the number of patents are used in measurement. Research performance
can also be evaluated by external rankings and awards etc.
Criteria for educational performance focus much on characteristics in educational

24
activities. In the measurement of educational performance, we may perhaps see the
following broad criteria
1. wide range of competitive degree programs
2. Excellent academic staff
3. diversity of intake of students from abroad and home, culture and
religion
4. graduate’s employability
5. High retention rate and graduation rate
Most educational activities are carried out at undergraduate and graduate stages in
universities. Factors influencing a university’s educational performance vary. The factors
may include students, quality of teacher force and instruction facilities etc. Students can
be regarded as a determining factor because their level of commitment to study may have
decisive influence on cognitive increase. They directly involve in the production of
educational activities as both customers and producers. Academic staff is another factor
in educational performance. Staff experience, skills, commitment and motivation may
influence how much knowledge is transferred to students in educational process. Input
indicators in educational activities will include intake of students, degree programs,
academic staff etc. Educational programs usually take years for student to complete.
Process indicators in educational performance measurement will include student’s study
efficiency, drop-out rates and retention etc. Output indicators in educational performance
measurement include the number of diplomas issued, the number of students graduated
etc. The final outcomes of university educational activities are students with enough
trainings and knowledge for employment in the society. Hence outcome indicators will
focus on student’s employment conditions and graduate’s starting salaries etc.
4.6 university management performance
The framework also highlights the importance of management performance to the overall
performance measurement in universities. Managers in higher education feel constant
pressure toward effectiveness and efficiency in utilization of resources in management.
Universities have human resources and financial resources that are critical and are
strategically important to management performance.
4. 6.1 Human resources (employee)
The role of human resources has significantly changed from time to time. In early
industrial era, people were only operationally or tactically important especially when
products are physical things and routine services (McGregor 1988). Such tactical
importance might be primarily due to early industrial organizational designs with
emphases on efficiency in working places. Job responsibility and nature of tasks can
largely define what kinds of people are necessary on the positions. At that time,

25
organizations with physical assemble lines and routine services tended to be standardized
in production e.g. car manufacturing industry and retail services. In post-industrial era, the
role of people has changed as a critical input into final products in organizations with
“smart” and complex products (Brickner 1981). The change has raised human resources
(people) to strategic importance in management because people are no longer seen as a
necessary but a decisive factor to the success of organizations. Universities are within this
category of organizations that provide knowledge services and produce smart people.
University staff, especially academic staff who directly involve in academic services, is the
strategic and sometimes non-replaceable asset. Academic staff is the source of core
capability in universities and their know-how has much influence on the overall level of
service performance.
Academic activities influence human capital and associated policies and practices that are
required to build in accord with certain level of academic performance. Both strength of
human capital and effectiveness of HR policies and practices may be two important
criteria in the measurement of human resource performance. To a research university
such as University of Twente, having excellent research personnel is critical to build the
stock of human capital that match its research needs. The number of PhD students,
professors and assistant professors in research activities are important elements in
employee composition. Besides, the number of lecturers, supportive staff and other staff
are also important stock of human capital to the university. University’s human capital is
influenced by factors such as age, experiences and outflow of people. With increasing
average age of employees, universities may decrease in capabilities and level of outputs.
To maintain a certain level of human capital, universities need investment in employee
training, development and recruitment, where such means help building and acquiring the
capacity embodied in people. Effectiveness of human resource policies and practices is
another criterion in human resource performance measurement. It affects not only the
building of human capital but also employee’s job performance. Huselid (1995) argued
that management practices such as the use of appraisal on performance on individual and
group work performance, linkages with incentives and use of promotion opportunities will
effectively encourage employee and raise their motivation. Thus, in measuring
employee’s job performance, indicators may include employee’s satisfaction with the HR
polices and practices.
4.6.2 Financial resource
Financial resources underpin an organization’s capability in operations, decision making
and organizational outputs. Morden (2007, pp, 33) regards the importance of financial
resources as:
“The enterprise can only do what its available financial resources (and the quality
of financial management) will permit it to do”
Hereby, the amount of financial resources decides what an organization might be able to

26
achieve and what kind of people and asset are affordable. It is a crucial point in the
realization of organizational capability and value creation as well. An example is about
Formula 1, clubs having large quantities of financial resources can decide what kind of
team members to acquire and what kind of technologies to use to improve speed and
reliability of the formula cars. Though there might be no definite causal relationship
between amounts of financial resources and organizational performance, it could become
an important indicator in management performance.
The need on the amount of financial resources is different to academic activities in
universities. For example, research activities that require large quantities of funds may
beyond the cap of budgets that the universities can afford. Third-party funding and
governmental funding have been becoming important extra sources of research funding to
university budgets. Donations, government grants, subsidies, contracts and awards are
typical means in the acquirement of financial resource. Besides tuition fees from students,
universities can also acquire financial resources by means of providing consulting
services, sales of intellectual property and even renting places and facilities to outside
companies. Thus, the diversity of funding sources may be an important criterion in
measuring financial performance in universities.
Financial performance in universities can be measured by whether universities are in
financial health. Financial health may be a criterion in measuring how effectively
universities have used financial resources to serve academic purposes. It is also a
higher-level of key performance indicator in CUC report (2006). McKinney (2004, pp.2)
views financial management as an indispensable role in achieving organizational
objectives and it has two important implications, one of which is the means to obtain and
allocate resources and another of which is to utilize methods and controls to achieve
determined goals.
In summary, both human resource and financial resources are of importance to
management in universities because they concern not only the capability of what
universities can do but also who are going to serve the university’s goals. Performance
measurement in management will focus on these two kinds of critical resources where
performance indicators in next section are developed.
4.7 Conclusion
The discussions by far have answered the two research question in the first part. The
performance in universities can be measured by the extent to which each of university
functions is maintained toward the university goals. Based on the argument, the
performance in universities can be captured mainly by the management and academic
dimensions. Academic performance is the core to the performance in universities and
management performance is the enabler to the performance in universities. The main
dimensions can be further into divided into the sub-dimensions of research, education,

27
finance and human resources, which the four construct a balanced concept to
performance measurement in universities. With an idea of pyramidal framework from
Cross and Lynch, we complete a similar pyramidal framework in the lines of BSC with the
integration of the performance dimensions and performance indicators. In the following
section, we are going to focus on the development of portfolios of performance indicators
in the dimensions of research, education, finance and human resources. We are also
going to discuss the pros and cons of performance indicators for university management.
28
5. Performance indicators
A performance indicator is usually a statement that can be quantified on resources and
achievements to the particular objectives of an enterprise (Higgins, 1989). It can also be
defined as an item of information collected at regular intervals to track the performance of
a system (Fitz-Gibbon, 1990, pp.1). Sizer (1979) suggested that performance indicators
include the following characteristics: relevance, verifiability, freedom from bias,
quantifiability, economic feasibility and institutional acceptability. While in Higgins’ (1989)
articles, he quoted the development of performance indicators from British Committee of
Vice-Chancellors and Principals as “relate to objective, be specific, quantifiable,
standardized, be simple as possible, be acceptable and creditable and be capable of
acting as signposts to areas needing attention”.
Relevance to goals is of priority in developing performance indicators in all kinds of
businesses. It concerns whether performance measurement is right on what organizations
aim to achieve. In most cases, university objectives are not explicit in written context
where they can be easily distinguished. It is high possibility that many objectives are
hidden in the mission statements. The clarification of mission statements must be taken
consideration into the development of meaningful indicators. Acceptability suggests that
performance indicators be accepted by people who are considered as users in order that
fairness and relevance are not compromised. In other words, the indicators would fulfill
the needs of management use. Quantifiability means that performance indicators must be
quantifiable but cautions have to be taken when applied to non-quantifiable objects in
developing meaningful indicators. Economic feasibility may have two kinds of implications.
One is the development of indicators should be simple and easy to use, in a well
structured form related to input, output and outcome model. The more complex of
indicators hints that they are more expensive to collect (Propper and Wilson 2003). The
other implication is that the overall benefits of developing performance indicators ought to
outweigh the costs and associated harmful effects in the use of performance indicators.
Metawie and Gilman (2005) documented problems such as employee dysfunctional
behavior, principal-agent and gaming associated with the implementation of performance
measurement in the UK public sector when performance measures are related to
incentives and rewards. The development of performance indicators ought to be
comprehensive from a user’s perspective.
There is a great concern about the choices of indicators as well. Performance indicators
are mostly quantitative and descriptive, relating to anything that can be quantified.
Quantitative indicators may be not only inappropriate for items such as student’s
satisfaction and employee’s satisfaction but also may provide little valuable information in
these aspects for managers in improvement. Hence, more meaningful, qualitative and
diagnostic performance indicators are required. Qualitative indicators are inclined to
measure the effects of something. They may be very helpful in measuring how is working
and what needs improving. Meanwhile, attentions need to be paid to the use of qualitative

29
indicators because qualitative indicators may contain people’s opinions and are very likely
subject to bias. Dowling and Richardson (1997, pp. 354) documented that the application
of qualitative indicators in performance measurement caused frequent skepticism when
measuring individual job performance of managers in health service. From a managerial
perspective, the pre-settled vision has also implied two different uses for managerial
controls. Managers need to know not only the overall views of performance but also need
to know the operational views of performance in universities.
In summary, the development of performance indicators must follow the characteristics of
relevance, economic feasibility and institutional acceptability etc. The development of
indicator also needs to consider what kinds of performance indicators are most applicable
to objects that are being measured. For example, qualitative indicators might be more
helpful than quantitative indicators in measuring people’s attitude and satisfaction etc. In a
word, performance indicators ought to serve a useful mean to improve the quality of
university activities with least cost.
5.1 Performance Indicators in the literatures
Several literatures and information sources are found exclusively useful for this study.
They provide a few performance indicators which can be categorized into the dimensions
in this study. The literatures and information source include CUC report (2006), Australian
Government report in higher education (2005) and performance measurement in
University of Edinburgh and performance measurement in University of Twente
The CUC report is about performance measurement in a university from a governor
perspective. It focuses on ten high-level key performance indicators that are important to
the performance in the university. The key performance indicators are institutional
sustainability, academic profile and market position, student experiences, teaching and
learning, research, Knowledge transfer and relationships, financial health, estates and
infrastructure, staff and human resource development, governance, leadership and
management and Institutional projects. From the high-level key performance indicators, a
large number of key performance indicators are further developed. In doing so, the
governors can get a comprehensive image of the performance in the university. As the
report is for governors, the level of information from the indicator is considerable
aggregated because of the use of key performance indicators.
The report by Australian government is a review of performance outcome indicators in
higher education. In the report, it focuses on the robustness of performance outcome
indicators in higher education. The indicators are progress rate, attrition/retention rates,
graduate full-time employment, graduate full-time study, graduate salary, overall
satisfaction, good teaching and general skills. The literature in University of Edinburgh is a
balanced scorecard performance measurement approach which helps senior managers to
achieve the goals in the university’s strategic plan. The concrete goals in the strategic

30
plan provide a foundation for university managers to develop the performance indicators
in the dimensions of organizational development perspective, financial perspective,
stakeholder perspective and internal business perspective. Besides, by interviews within
the University of Twente, the managers provide some helpful information regarding the
current performance indicators in the University.
The performance indicators from the literatures, the website of University of Edinburgh
and interviews in the Unviersity of Twente provide much information about the
development of indicators in the four dimensions. Some of the indicators are categorized
into the dimensions in this study.
5.2 Academic performance indicators
Academic performance can be seen as the core competencies of a university. All other
university functions and facilities are built for this purpose. In this paper, the measurement
of academic performance focuses on the educational performance and research
performance. In the following sub-sections, academic performance indicators are
discussed.
5.2.1 Research performance indicators
Research may be one of pillars that underpin a university’s academic reputation. It is an
important source of new knowledge as well. Academic research may often appear in a
university’s mission statement signaling what the university does. The development of
research performance indicators will cover the whole research process. Input
measurement includes indicators such as the number of researches from sponsors and
researchers FTE etc. Output and outcome measurement frequently include indicators
such as the number of publications, citations, the number of awards and memberships
etc.

31
Table 1 Research performance indicators
Performance
areas
Indicators Measurement alternative Pros and cons for management
researcher FTE
researcher FTE by PhD students,
academic staff etc)
The FTEs provide university managers with a valid approach to measure employees with
different level of involvement in research. University managers are able to know how many
research employees or how many percentages of employees are completely committed to
research activities. However, it is a question mark to what extent the FTEs provide a
reliable measurement of actual input of time by researchers. To PhD students, overtime
work is quite a normal phenomenon. The FTEs may only provide university manages with
a measurement of researcher’s involvement against standard amount of time in labor
contacts.
The number of
researchers from
sponsors
The number of researchers paid
from external grants
The more number of researchers from external grants in cooperation, the more
connections with external organizations a university could have in research networks. It
also signals a university’s research influence at its fields.
The number of successful
applications by National &
international programs or by
other sponsors
The number of successful
research granted
applications
(CUC report 2006) € amount of research grants
The indicator signals the research strength of a university in competing for research
resources and their quality of research proposals. The indicator still needs manager’s
subjective judgments in the measurement of value in research programs because research
programs differ. The indicator is also a measurement of performance in the university’s
systematic support and training for researchers to apply for research programs rather than
the performance of “scatter-guns “by the large number of applications.
Research input
The number of Strategic
partnerships(CUC report
2006)
The number of formal agreement
the university has in research
The indicator counts the number of formal agreements a university is engaged in. The
more number of formal agreements, the more strategic partnerships the university is
engaged in, and the more diverse of sponsors could be.
ISI-refereed journals
non-ISI refereed Journals
Research output The number of
publications by research
unit Journal articles (non-refereed)
The indicator by different measures has different issues of validity in measuring research
performance. ISI-refereed journals, refereed conference paper, books and chapters are
considered as higher validity in measuring research performance. The validity of non-ISI

32
Refereed top conference paper
(i.e. Top 5)
Books
Refereed book chapters
Other academic work
refereed journals, non-refereed journals and other academic work in research performance
measurement may be compromised. The indicator needs manager’s subjective judgments
on the quality of publications
The number of doctorate
conferred
The annual average number of
doctorate conferred
The indicator is a very important disclosure of research outputs of a university. It provides
university managers with the total number of conferred doctorate degrees in the university,
which can be compared with the performance in other universities in the country.
The number of Spin-off
companies
The number of License
agreements
Exploitation of IP
(CUC report 2006)
The number of Patents
The indicator of exploitation of IP measured by number of spin-off companies, patents and
license agreements is an effective way to see how well a university has achieved in
utilizing its research outputs in a commercial way. However, with regard to the actual value
of exploitation of IP, it is the amount of economic benefits that matter to the university. The
amount of information from the indicator by these measures is limited to university
managers in this aspect.
The number of successful
entrepreneurs (start-up
companies)
Annual growth of successful
entrepreneurs
The indicator quantifies the total number of students and university staff who become
entrepreneurs but it may encounter difficulties in judging to what extent an entrepreneur
can be seen as successful or not. Therefore, the usefulness to management might be
limited.
Impact score Citation
H index
Citation is a widely recognized indicator in the measurement of research outcomes.
Citation is also a very time-lagged indicator by different measures. It may take years until a
publication of a given author is citied. Therefore, the validity of the indicator for
management in the measurement of current research performance of a given research
group might be compromised due to both time problems and outflow of researchers etc.
Research
outcome
Membership of research
council or editorship of
journals
The number of board members in
research council and editors in
journals
The indicator may provide university managers with a clear image of research strength and
research reputation in a university. However, the validity of memberships of research
council and editorships of ISI journals to be used in current research performance
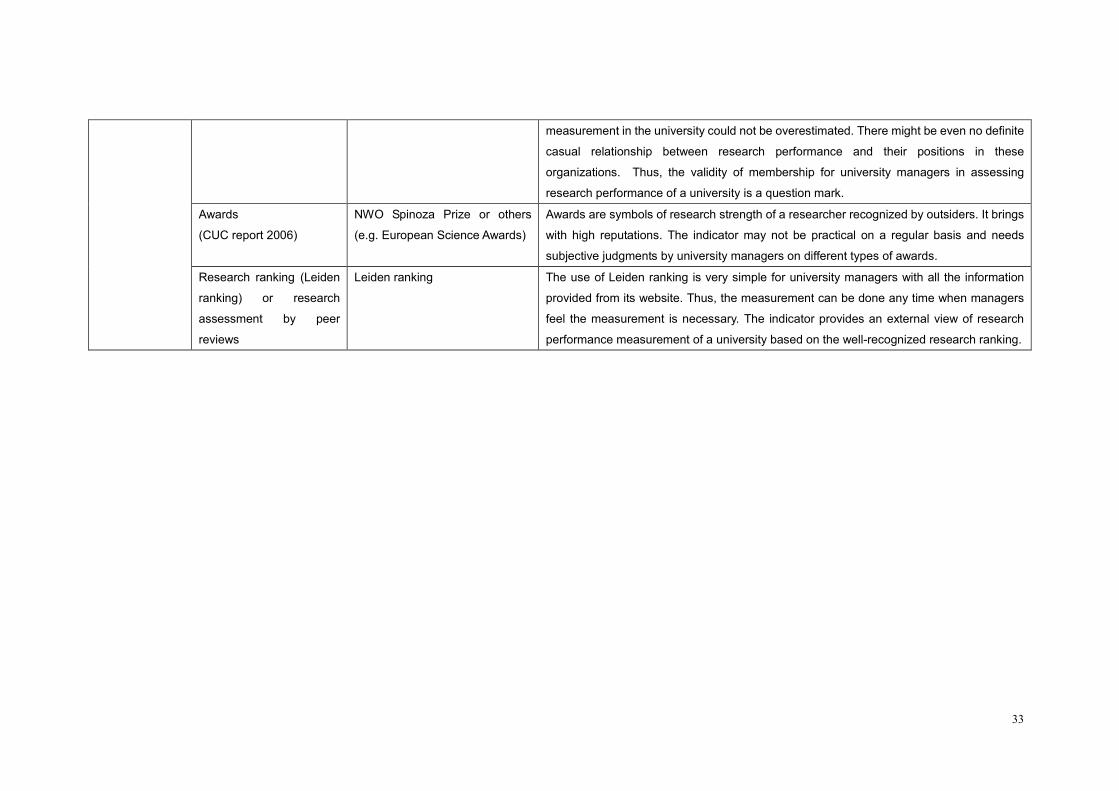
33
measurement in the university could not be overestimated. There might be even no definite
casual relationship between research performance and their positions in these
organizations. Thus, the validity of membership for university managers in assessing
research performance of a university is a question mark.
Awards
(CUC report 2006)
NWO Spinoza Prize or others
(e.g. European Science Awards)
Awards are symbols of research strength of a researcher recognized by outsiders. It brings
with high reputations. The indicator may not be practical on a regular basis and needs
subjective judgments by university managers on different types of awards.
Research ranking (Leiden
ranking) or research
assessment by peer
reviews
Leiden ranking The use of Leiden ranking is very simple for university managers with all the information
provided from its website. Thus, the measurement can be done any time when managers
feel the measurement is necessary. The indicator provides an external view of research
performance measurement of a university based on the well-recognized research ranking.

34
5.2.1.1 Research input indicators
� Researcher FTE
The FTE is a popular measure of the involvement level of researchers in research
activities. It is measured by the amount of time an employee is involving in research
projects. FTE of 1 generally equals to a full-time employee’s level of involvement in
research activities, for example, 40 hours a week etc. FTE of o.5 is half of the amount of
time the employee with 1 FTE. Therefore, by counting employees with different scores in
FTE, university managers are able to know how many employees are completely
committed to the research activities or how much percentage of employees is with
different FTE scores. Most research activities are carried out by PhD students and
academic staff in universities. The FTE provides the managers with a valid approach to
measure employees with different level of involvement in research. However, the results
from FTE are calculated from the standard amount of time laid down in contracts. It is
unclear to what extent the FTEs provide a reliable measurement on actual input of time by
researchers. To PhD students, overtime work is quite a normal phenomenon. Therefore,
the FTE may only provide university manages with a measurement of researcher’s
involvement against standard amount of time in labor contacts.
� The number of researches from sponsors
With increasing external funding from outside organizations, universities may employ
researchers from sponsors to co-participate in research programs as parts of agreement.
The indicator can be measured by the number of people paid from external grants. The
more researchers from external grants in cooperation, the more connections with external
organizations a university could have in research networks. It also signals the university’s
research influence at its fields.
� Successful research granted applications
The indicator measures the total number of granted applications for wide ranges of
research programs. A similar indicator can be the ratio of successful research grant
applications in the CUC report (2006). The indicators signal the general research strength
of a university in competing for research resources and the quality of research proposals.
Research programs can be divided into a few levels of international, national and other
institutional. Successful research grant applications by international and national level
sponsors can be considered as high achievements for a research scholar. International
and national level research programs from research councils and international institutions
may require an applicant with higher academic achievements in certain fields. Not all
applicants may meet eligibility criteria to the category of research programs. Besides, an
applicant may face fierce competition by other scholars from different universities at home
or abroad. Thus, it can be considered as a valid indicator in research performance
measurement.

35
The number of successful research grant applications can also be measured by other
research programs in non-governmental institutions. The research programs may open to
large group of applicants with less strict requirements attached than programs from
research councils. Thus in the measurement of research performance, they may not be as
valid as research granted applications from high level research programs. In addition,
factors influencing the success of application can not be ignored. The factors may include
the scientific topics addressed in applications, popularity of research topics related to
university researching fields and research budgets etc. The reliability of indicator for
university managers in the measurement of research performance should not be
over-estimated. The indicator may also subject to broad economic influence in the
measurement. In years with good economic condition, the number of successful
applications may increase significantly when compared with years in bad economic
conditions. To university managers, the indicator is also a measurement of university’s
systematic supports and trainings for researchers to apply for research programs rather
than the performance of scatter-guns by the large number of applications.
Besides, the number of successful applications can also be measured by monetary terms
e.g. euro. It provides managers in universities with an annual sum of research granted
funds which can be compared with the amount of funds granted in pervious years. Again,
because of broad economic influence and size of research budgets from the applications,
the reliability of the measurement might be compromised. In extreme case, one
successful application can generate great proportion of research funds to total research
granted funds.
� The number of strategic partnerships
The strategic partnership is a formal agreement between a university and external
organizations, which the parties share the information, know-how and support common
objectives. It is also an important source of research funds and sponsors as well. Partners
in the agreement could cover all business areas, from venture capitalists to governments,
from technological companies to universities. The strategic partnership establishes a
channel that common interests can be pursued for benefits in areas of interests by
involved parties. With increasing strategic partnerships, the university can eventually form
a knowledge transfer networks. Thus, it is an important input indicator to the university in
the CUC report (2006). The more strategic partnerships the university is engaged in, the
more diverse of sponsors could be. The indicator can be measured by the number of
strategic partners that the university has formal agreements with. It is a valid and direct
measure on quantity of partnerships that the university has. However, it may not be very
reliable in measuring quality of strategic partnership which affects the actual amount of
value might be created in cooperation. The indicator provides a quantitative measurement
on the university’s engagement in connections with external organizations.

36
5.2.1.2 Research output indicators
� The number of publications
In output measurement, the use of indicators such as the number of publications is a
frequent quantifying measure on research outputs. The indicator is simple in use but the
information from it is limited because little is known about the quality of these publications
and how profound of the publications can produce is unknown. Thus, a problem here is
how to judge the quality of publications, in other words, how prestigious journals and
conferences where paper gets published can be seen as a good indicator of excellent
research performance. The publications can be measured by refereed journals,
non-refereed journals, conference, books and chapters of books etc. Refereed journals
can also be divided into ISI refereed journals and non-ISI refereed journals. ISI journals
are the most frequent used academic journals categories in worldwide. ISI journals
provide a relative high valid and reliable measurement on the quality of publications. ISI
refereed journals, books and refereed chapters in books published by world top publishers
can generally be considered as good quality. The publications are carefully examined by
publishers in content for a long period of time and they mainly serve academic purposes.
To non-ISI refereed journals, non-refereed journals and other non-refereed publications by
some not well-known publishers, it is unclear whether the publications can be regarded as
good quality or not. The publishers may lack of mechanisms in prudently assessing the
quality of publications or they assess publications by low level of criteria.
To conference publications, university managers face the same problem in validity and
reliability issues. Conference publications can be categorized into refereed paper and
non-refereed paper by different levels of conferences. For example, ISSCC (International
Solid State Circuits Conference) is the best in electronic engineering. Paper there tend to
be considered as top quality ones in the field because they have been reviewed by
experts before publication. However, researchers can also submit their papers to some
small conferences such as IEEE International Midwest Symposium on Circuits and
Systems. To non-top conferences, it is unknown whether paper get published there is
good or not. The validity of the papers in non-top conferences in measuring research
performance might be compromised by low level of acceptance criteria. To non-refereed
paper, the validity of measurement in research performance is low. Therefore, the
indicator of the number of publications still needs subjective judgments by university
managers on whether the publications are considered as good research performance or
not. The indicator lacks the reliability in the measurement on quality of publications. The
indicator may unexpectedly lead research personnel to chase for quantity instead of
quality of publications if ISI refereed journals and top conferences are not emphasized.
� The number of doctorate conferred
The number of doctorate conferred is an output indicator in research performance
measurement. It counts the total number of doctorates conferred to PhD students annually.

37
PhD students constitute a research university’s main research groups. When they
graduate, they also become the university’s research outputs as well. Thus, it is a
relative valid and reliable measurement in research performance. It provides managers
with a total amount of doctorate degrees in the university, which can be compared with the
performance in other universities in the country.
� Exploitation of Intellectual Property ( IP)
Exploitation of IP is an output indicator for a university to measure how effectively she has
used IP for economic benefits. In the CUC report (2006), the indicator is put under the
dimension of knowledge transfer and relations. The indicator can be measured by the
number of spin-off companies, license agreements and patents etc. The number of
university spin-off companies measures how well the university has transformed
intellectual property, technologies into new products with commercial value into market
places. A spin-off company usually starts life within the university and later progresses to
be an independent business organization on its own endeavor. The higher number of
spin-off companies, the higher performance the university will be in exploitation of
intellectual property. Thus, exploitation of IP by the number of spin-off companies is a valid
measure. Because of close relations with the university at initial stages of development,
spin-off companies can be seen as reliable measure in the measurement of a university’s
IP exploitation.
The number of license agreements signed measures a university’s commercial effort in
utilizing its intellectual property in exchange for economic interests. Thus, it is a valid
measure of the university’s effort in exploitation of IP. However, the number of licenses the
university can successfully issue is affected by external demands and criteria in the
agreements. If there is no demand by customers or both sides can not reach the
agreement, there will probably no license agreements by the university. No license issued
does not necessary mean poor exploitation of IP in the university. Thus, the reliability of
this measure in measuring exploitation of IP should not be overestimated. The number
of patents granted is another measure in exploitation of IP. A university can secure its
research achievements by applying for patents from governmental institutions. Patents
are sources of competitive advantages as well. The patents could be seen as a first step
for commercial exploitation of IP. However, with regard to the value in the patents, it is the
outputs of the patents that matter rather than the sheer number of patents. A university
with hundreds of patents that are never to be commercialized will not produce the same
amount of economic benefits as another university with only a few successfully
commercialized patents does in exploitation of IP. Thus, it could not be a very valid
measure in the measurement. The indicator of exploitation of IP measured by the number
of spin-off companies, patents and license agreements is a way to see how well the
university has made effort in utilizing its research outputs in a commercial way. However,
with regard to actual value of exploitation of IP, it is the amount of economic benefits that
matter to the university. The information from the indicator is limited in this aspect.
38
� The number of successful entrepreneurs
The number of successful entrepreneurs may also be one of output indicators in research.
It quantifies the total number of students and university staff who become entrepreneurs
with research background in the university. An entrepreneur can be seen as a person with
passions and ambitions to be an enterprise with bears of risks and benefits. It is also a
passion to create value with knowledge, skills and techniques learned from research
activities in the university. Thus, it is an important process of transferring research outputs
into real business applications. An alternative measure is the growth rate of entrepreneurs,
which it counts the incremental percentage of people who become entrepreneurs.
However, to become an entrepreneur is a matter; to become an entrepreneur who
succeeds is another matter. It takes time to justify. Beside, it is unclear the extent to which
criteria can be used to evaluate a successful entrepreneur or not. The validity of indicator
used in research performance measurement may not be overestimated.
5.2.1.3 Research outcome indicators
� Citation
Citation is a widely applied indicator on quality of publications. It counts the frequency of
quotations from a specific source appeared in other authors’ publications. It provides a
helpful method for people to scientifically measure the quality of publications. Citation by
impact score is a widely applied tool in ISI publications. It measures the average number
of frequencies of published papers are citied usually two years after publication. However,
it also subjects to deficiencies in the reliability of scientific counting. Lehmann and
co-authors (Lehmann et al. 2008) argued that because of the asymptotic power-law
distribution of citations in all kinds of websites, the average number of citations under a
given author may be unreliable due to fluctuations of sample means in selection. It also
suffers criticisms because of limited use only in ISI publications and self-citations.
Furthermore, the impact score to a given author may be manipulated by the increasing
number of review papers which may boost the impact score. Thus, it may have validity
and reliability issues in research performance measurement.
An alternative approach in measuring citations is the h index. The h index can be applied
to wide ranges of objects including individuals, departments, faculties and universities.
Hirsch (2005) explains that “a scientist has index h if h of his or her Np papers have at
least h citations each and the other (Np-h) papers have ≤h citations each”. The advantage
of h index for management is a measurement on both quantity and quality of publications.
The disadvantage of h index is still largely dependent on manager’s intuitive judgments on
citation data. The index is not amenable to quantitative investigation in the measurement
of scientific research performance of people especially when such citation data are used
in evaluation of promotion and appointment (Lehmann et.al 2008). For example, if an
author has 12 papers with each at least 12 citation, then the index is 12. When compared
39
with another author has with 16 papers within which 12 has been citied at least 12 times
each and the rest is less than 12 times citations, the result of h index is still 12.
Another disadvantage in the measurement might be lack of time based concern. The h
index depends on the accumulation of an author’s publications and citations over time
(Hirsch, 2005). The longer an author works the larger h index he or she may have
accumulated. While in research performance measurement on a regular basis, a problem
arise at whether very past performance records should still be used in current
performance measurement. The H-index may purposely boost performance with very
historically data in updated measurement of research outcomes. Besides, the h-index
focuses on papers with most cited records that may give rise to biased comparisons
among institutions. Sypsa and Hatzakis (2009) concerned that “An institution with a
moderate-size production will not reach the h-index of a very large institution even if the
quality of its publications are of similar or even better quality simply because its total
production may be even less than h.”
For university management, citation provides managers with a widely recognized tool in
the measurement of research publications. However, citation is a very time-lagged
indicator as discussed by different measures above. It may take years until a publication
of a given author is citied. Therefore, the validity of the indicator for management in
research performance measurement of a given research group might be compromised
due to flow of researchers and accumulation of citations.
� Membership of research council and editorship of ISI journals
The indictor counts the number of people with membership in research councils and
editorship of journals. It may signal a general research reputation and research strength of
a university. Thus, it might be a helpful indictor for university management. Research
councils may include both national and international research councils. ISI journals are the
most frequently used and highly recognized journals in academic world. To become a
member of research councils or an editor in ISI journals may be a great honor to a
researcher in the field. The indicator can be measured by the number of editors in ISI
journals and the number of board members in research councils. They provide a
measurement by counting the total number of people with titles in these organizations.
However, the validity of memberships in research councils and editorships of ISI journals
in current research performance measurement of the university may not be overestimated.
Most likely, it is because of the researcher’s past research performance that leads them to
the positions in the prestigious organizations. There might be even no definite casual
relation between research performance and their positions in these organizations. Thus,
the validity of membership for university managers in research performance measurement
of a university is a question mark.

40
� Awards
Award is an outcome indicator in research performance measurement, which is also used
in the CUC report (2006). The indicator counts the total number of awards people
received from outside research organizations. For example, the NWO Spinoza prize, also
called “Dutch Nobel Prize”, is a national-wide award to researchers for great contributions
in research activities. One of winners in 2009 is Prof. Albert van den Berg at the University
of Twente. The NWO Spinoza prize is a well-recognized award in the country with high
reputations. Thus, it can be considered as a valid and reliable indicator in research
performance measurement. Besides, in journals and conferences, researchers can also
be awarded by “best paper” to their publications in their research fields. Because of
various types of awards, the validity of the measurement to university managers might be
compromised. High-level awards are recognized by most people and they bring with high
reputations to researchers. The indicator depends on manager’s subjective judgment on
the value of types of awards. The reliability of awards in measuring research performance
is a problem for different types of awards. The indicator of awards is simple to use but it
might be not practical on a regular basis. The chances of actual use of the indicator might
not be very often because awards are rare to happen.
� Research ranking
Ranking can be an indirect measure on research performance in universities. It measures
the ordinal numbers of each research subject by different criteria. One of well-known
research rankings is from University of Leiden, commonly known as Leiden Ranking. The
ranking can be done by selection of different fields, scopes and period of time on the basis
of composed indicators in research. Thus, it provides a relative valid and reliable
measurement to measure the university’s research performance. The use of Leiden
ranking is very simple for university managers with all the information provided from its
website. Thus, the measurement can be done any time the managers feel the
measurement is necessary. An alternative approach is research assessment by peers’
reviews. Research performance in universities can be rated by experts outside the
universities. Their ratings can also provide a relative objective measurement for
universities.
5.2.3 Educational performance indicators
Educational performance may be another pillar that underpins a university’s academic
reputation. It is a traditional and standard dimension in performance measurement in
universities. Educational performance indicators will cover the whole educational
process from input, process and output till outcome.

41
Table 2, Educational performance indicators
Performance
areas
Indicators Measurement alternatives Pros and Cons for management
Market share of 1st year bachelors
Intake of 1st year bachelor students
Intake # of International and EU
bachelor students
Total intake # of masters
Intake # of international and EU
master students
The number of enrolments
(university of twente)
The indicator measures the demographic characters of intake of students by
classifying them into different groups.
Strictly speaking, the indicators lack of validity in the assessment of
educational performance because no definite casual relationship with
university educational performance. It is unclear whether educational
performance precedes the number of enrollments or vise versa.
student per degree programs The number of degree
programs(BA/MA) The number of honor degrees
The indicator provides university managers with guidelines in appropriate
investment of resources in degree programs
Staff FTE Academic staff FTE The FTE may provide managers with a relative valid and reliable approach to
measure university staff with different levels of involvement in educational
activities.
Input
Student/ academic staff Ratio of the number of full-time
Student/ academic staff
The student/ staff ratio indicates a general strength of teaching force to
students in education. Though the indicator provides a ratio of the number of
required academic staff to students in universities, managers may not
immediately take actions to improve the ratio due to factors such as financial
constraints and recruitment timing if academic staff is in shortage. Thus, the
usefulness to university managers may be discounted.
Process
Retention
(Australian Government report in
higher education 2005)
Retention rate (1st year to 2
nd year) It is a measure to see how many percentages of students has progressed
after first year’s study or how attractive a university to students could be.
Student’s retention rate is not only affected by the university’s educational
performance perceived by students in the first year’s study, but also are
affected by the student’s behaviors and other academic mechanisms (screen

42
policies by hogeschool) by principals. The reliability of the indicator in
measuring educational performance is limited to university managers.
Drop-out Drop-out rate (BA/MA) The indicator provides university managers with percentages of students
who drop out due to various reasons. Though the number of drop-out
students may not directly relate to educational performance of a university, it
might be an important indicator to see how the university has made effort in
keeping their students on campus.
Contact hours Average contact hours per week for
bachelor and master students
Information from the indicator can provide managers with clear
understandings of what universities have contributed to the process of
education. The indicator might be used as a mechanism to increase the
study performance of students but the actual efficiency of how students has
utilized the contact hours are unknown to the managers.
General student satisfaction
(CUC report 2006 and Australian
Government report in higher
education 2005)
Student evaluation by Internal
survey
It is a valid and economic method in measuring the satisfaction level of
students by surveys.
Because of qualitative indicators, the data from the indicators may only be
referential.
Study efficiency
(Australian Government report in
higher education 2005)
avg. time to complete for bachelors,
research and non-research masters
It provides a helpful tool for university managers to know what the average
amount of time each category of students are needed to complete their
studies but the reliability of the measure in efficiency of studies may not be
overestimated due to factors such as students work before getting diplomas.
Graduation rate Output
&Outcome
Graduation
(CUC report 2006, Australian
Government report in higher
education 2005)
The number of diplomas issued
It is a direct measure on outputs of university’s educational activities. It is an
effective measurement on how many percentage students have managed to
graduate as a result of university educational services. Universities may
even purposely loosen graduation criteria for sheer increase in the number of
graduates if too many emphases are put on the indicator.

43
Graduation satisfaction
( Australian Government report in
higher education 2005)
Student graduation evaluation by
survey
It provides valuable feedbacks for university managers in the evaluation of
university services where further improvement may be made. However,
data from student’s evaluations may only be referential because student’s
evaluation may lead to bias by subjective judgments.
Employment rate
Average starting salaries
Employment
(CUC report 2006)
Employer feedback
It shows the competitiveness of graduates from universities in labor markets
as part results of university education and training. It is an important outcome
indicator of educational activities but it is affected by factors such as
self-employment and continuing studies. Thus, the reliability of the indicator
might be compromised in measuring educational performance in universities.
It is beyond what university managers can control.

44
5.2.3.1 Input indicators
� Intake of graduates and undergraduates
Past indicators on input measurement by student’s entry qualifications and initial abilities
have been unsatisfactory (Higgins 1989). These indicators only measure what students
bring into universities and they may not have direct links to the subsequent performance
of students. Current indicators on input measurement have been focused on measuring
the number of intake of students. The number of enrollments for undergraduates and
graduates or market shares of students are used as input indicators in the University of
Twente. However, the linkage between educational performance and the number of
enrollments is unclear in whether educational performance precedes the number of
enrolments or vise versa. Strictly speaking, the indicators lack validities in the
measurement of educational performance. Besides, the indicators may also have
reliability problems because students’ preference to some universities may directly
influence the number of enrollments in other universities in the country. The indicators of
intake of students can be separated into intake of bachelors and masters. Intake of
students in bachelor programs includes indicators such as the number of intake of 1st year
students, the number of intake of international students in bachelor programs and the
number of intake of EU students in bachelor programs. Intake of students in master
programs includes indicators such as the total number of intake of internal master
students, the number of intake of international masters and the number of intake of EU
master students. The indicators aim at measuring the demographic characters and
socio-economic backgrounds of students by classifying them into different groups. All the
indicators can be measured by the number of enrolments in universities. The
measurement can be compared with the actual number of intake of students against
university targets. Thus, it is a valid and reliable approach to measure intake of graduates
and undergraduates. The indicators provide university managers with a clear image of
coming student’s characteristics.
� The number of BA/MA degree programs
The indicator measures the total number of degrees in bachelor and master programs
that students can choose from. It emphasizes on the variety of degree programs to meets
diverse needs of students. An alternative measure may be students per degree programs.
The measurement can provide university managers with effective and reliable guidelines
in appropriate investment of resources in degree programs. Another alternative measure
may be the number of honor degrees. It measures the number of competitive honor
degree programs the university has to attract talent students. The honor degrees are great
acknowledgement of success to students with higher study results. It is more difficult for
students to achieve than normal degrees in bachelor and master level. Thus, the honor
degrees may mean higher level of educational performance for the university. The
measure provides the managers with a clear image of how competitive their degree
programs are.

45
� Staff FTE
The FTE may be a measure of staff’s involvement level in educational activities as well. It
is measured by the amount of time an employee is involving in educational activities. It is
similar to the researcher’s FTE discussed in the research dimension. By counting staff
with different scores, university managers may be able to know how many percentages of
academic staff are fully committed to educational activities or how many percentages of
academic staff are with different scores of FTE in educational activities. The FTE may
provide the managers with a valid and reliable measurement approach to distinguish staff
from different levels of involvement in educational activities.
� Student/ academic staff ratio
The student/ staff ratio indicates a general strength of teaching force to students in
education, which is also used in the University of Twente. The indicator can be measured
by the ratio of number of full-time students to academic staff. The measurement may
provide university managers with a ratio of how many academic staff is needed for the
number of full-time students on campus. Though the indicator provides a ratio of the
number of required academic staff to students, managers may not immediately take
actions to improve the ratio due to financial constraints and recruitment timing etc. Thus,
the usefulness of this indicator for university managers may be discounted.
5.2.3.2 Process indicators
Renaud and Murray (2007) justified the use of higher-order questions in assignments as a
process indicator in educational performance measurement and argued that the use of
higher-order questions will improve student’s critical thinking skills. Pascarella and
Terenzini (2005) presented that previous process indicators such as size of libraries and
facilities can not be seen as valid measures because they unlikely have a strong
connection with student outcomes. Their argument is further explained by Renaud and
Murray (2007) that pervious indicators on size of libraries and facilities are selected on the
basis of expediency and presumed relations with student outcomes. The indicators are far
removed from what are actual happening in classrooms. In this paper, the emphasis of
process indicators is on students because it believes students are the master of
themselves and they directly involve in the production of educational service. Their
satisfaction, complaints and overall opinions might directly affect their perceptions on the
quality of educational activities, which ought to be severed as more reliable process
indicators than the higher-order questions. Ruben (1999) noted that in many universities,
little attention has been paid to measuring expectations and satisfaction of students and
even less to the people working there.

46
� Student satisfaction
Student’s satisfaction toward educational activities is an important indicator in measuring
educational performance in universities. As both customers and producers, student’s
experiences and opinions can produce valuable information on the quality of educational
activities. The indicator is used both in CUC report (2006) and Australian Government
report in higher education (2005). It measures the student’s satisfaction level in the
educational process. It is a relative broad concept in measuring student’s satisfaction
toward variety of objects. Similar indicators are proportions of students satisfied with
overall facilities, proportions of students satisfied with teaching method, course programs,
and information services and so on. The measurements can be done by student’s
evaluations by internal surveys to cover a wide range of student populations. It is a valid
and economic method in measuring the satisfaction level of students. Though it is an easy
way in the measurement, cautions should be raised by the reliability of data from the
surveys. Data collected in the surveys may subject to all kinds of biases because of
subjective judgments by students. The perceptions by students on educational activities
are influenced by emotions, expectations and motivations overtime. Thus, the results from
the indicators can only be referential in educational performance measurement.
� Study efficiency
The indicator measures student’s efficiency of studies in universities. It can be measured
by the average amount of time students need to complete their study in bachelors,
research masters and non-research masters programs. A similar indicator is progress rate
from Australian Government report in higher education (2005). It provides a basis on
which student’s efficiency of studies can be compared with the required amount of time.
For example, the bachelor programs are 3-year study programs in the University of
Twente. The longer the students need to complete beyond the required amount of time,
the low efficiency of their studies could be. Thus, the measurement could be a valid
approach in measuring study efficiency of students. However, in some cases, students
may choose to work ahead of having their diplomas. The reliability of the measurement in
efficiency of studies may not be overestimated. For university management, it provides a
helpful tool to get to know what the average amount of time each category of students are
needed to complete their studies.
� Retention rate
The indicator measures the percentages of students who remain in study from first year to
second year in the same institution. It is a measure to see how many percentages of
students have progressed after first year’s study or how attractive a university to students
could be. It is also used in the Australian government in higher education (2005).
Student’s retention rate is not only affected by educational performance perceived by
students in the first year’s study, but also is affected by student’s behaviors and other
academic mechanisms by principals. The retention rate might be especially useful for

47
Hogeschools whose policy of minimum 48 credits will screen a lot of students out after first
year’s study. The indicator can be used as a quality control mechanism in educational
process especially in Hogeschools. To universities in the Netherlands, effects from the
indicator in application might not be obvious. In rare situation, the retention rate may drop
significantly without such a screening policy.
� Drop-out rate
The indictor measures the percentages of students who have dropped out during their
studies for various reasons. It is an opposite indicator to the retention rate. It is calculated
by the number of drop-out students divided by the annual number of enrollments. The
indicator can be measured in bachelor and master levels. Though the number of drop-out
students may not directly relate to the educational performance of a university, it might be
an important indicator to see how the university has made efforts in keeping their students
on campus. The measurement by different degree programs provides a detailed
assessment on the drop-out rate in the university.
� Average contact hours
The indicator is measured by the average amount of time per week that academic staff set
aside for bachelor and master students to discuss problems in study. During the
scheduled contact hours, students can directly go to teachers’ offices to discuss any study
problems face to face. Thus, the measurement by average contact hour per week may
produce clear information of what the university has contributed to students during the
process of education. The average contact hours might be used as a mechanism in
universities to increase the study performance of students but the actual efficiency of how
students has utilized contact hours are unknown to university managers. The effect of
indicator for management use is limited.
5.2.3.3 Outcome indicator
Output and outcome indicators are prevailing in all kinds of performance measurement
reports (CUC report 2006, Australian Government 2005, etc). Most widely used indicators
in these reports cover graduation and employment.
� Graduation
Graduation is a direct output of educational activities in universities. The Indicator can be
measured by graduation rate in percentage of students who complete their studies on time.
It is an effective measure to calculate how many percentage students have managed to
graduate as a result of educational services in universities. Similar measures are the
number of diplomas and the number of students graduated yearly. Results from the
measures may fluctuate year by year due to the size of student population, delays in

48
studies and continuing studies etc. Therefore, the reliability of the measurement might be
compromised. Universities may even purposely loosen graduation criteria for sheer
increase in the number of graduates if too much emphasis is put on the indicator.
� Graduation satisfaction
Graduation satisfaction is an outcome indicator which measures the general satisfaction
among alumni to universities. It produces an overview of graduation satisfaction usually
months after students who graduate. The indicator can cover a broad range of topics
including skills and knowledge, preparation for jobs and their opinions of educational
programs in universities etc. The measurement can be done by asking students to register
in alumni websites or using surveys. Thus, the measurement can provide valuable
feedbacks for university managers in evaluation of university services from student’s
perspectives. Because of subjective judgments by students, the results from the surveys
may only be referential.
� Employment
Employment rate measures the percentages of graduated students who are employed full
time after graduation to the total number of graduates. It shows the competitiveness of
graduates from universities in labor market as part results of educations and training.
However, results from the indicator only represent a narrow picture of graduate’s
employment’s situation. Student’s employment is affected by factors such as
self-employment and continuing studies. Thus the reliability of employment rate as an
indicator in educational performance measurement should not be overestimated. One
alterative measurement of employment is the average level of starting salaries that
students are able to get from their first jobs after graduation. Due to broad economic
influences on employment, the reliability of the measurement should not be
over-estimated. However, the measurement can generate much information about starting
salaries by students with different degree programs in labor markets. Student’s
employment situation can also be measured by employer’s feedbacks about student’s
working capabilities. The feedbacks may provide some helpful information about
employer’s general satisfaction toward students on the job but the reliability of information
in measuring employment situation might be compromised by size of surveys and
employer’s subjective adjustments etc.

49
5.3 Management Performance indicators
When universities develop policies and take actions toward achieving organizational goals
in management, they may thirst for information that could both predict future directions
and justify their past actions. In universities, the task might be complicated and difficult.
Managers may face constant less input of resources but increasing demands for outputs
with desired outcomes. Managers needs to be cautious of every move in developing,
planning and execution of university policies and tasks. Performance indicators can
provide university managers with early warnings if things go wrong and directions where
actions can be taken.
5.3.1 Financial performance
Research activities in universities require considerable capital investment. Abundance of
funds may play a critical role in research outputs and hence the level of research
performance in the universities. Thus, the amount of financial resources is critical to the
university’s academic performance. Besides, effective financial management of resources
is also important to the financial performance of universities. Financial performance
indicators will focus on these two aspects in the universities.

50
Table 3 Financial performance indicators
Performance
areas
Indicators Measurement alternatives Pros and Cons for management
Annual granted research funds and
contracted funds
Amount of research
income
(CUC report 2006) Annual research income from
commercialization (patents, license
agreement, spinout companies etc)
The indicator discloses a symbol of financial strength in providing
resources for research activities. It is also a capability of acquiring
resources by commercialization of research outputs. However, a research
project with large amount of research funds granted may take years for a
research group to complete before any new funds that might be
contracted. Therefore, university managers may need to pay attentions to
the influence of large research programs that affect the subsequent
capabilities in contracting new research funds. The reliability of indicator in
financial performance measurement might be compromised.
Research indirect
cost recovery
(University of
Edinburgh)
Indirect cost/ contracted income The higher indirect cost recovery, the less cost a university needs to bear.
It is a helpful indicator to measure financial performance in terms of
acquirement of financial resource. The reliability of the measure may be
affected by the maximum amount of funds the sponsors can supply with.
The indicator can provide university managers with a basic percentage
from historical data to see how much funds are required to contract.
% third party funding Share in third-party
and share in
governmental
funding to university
income
% governmental funding
It signals a kind of capability and competitiveness for universities to
acquire diverse sources of financial resources. It is also an ambition for
universities to be self-sufficient. By means of the indicators, managers can
directly know their weights to the total amount of funding. The higher the
percentage of third-party and government funding, the higher financial
performance the universities could be.
Fees from national bachelors
Financial
resources
Income from tuition
fees and other Fees from international and EU bachelors
The measures provide university managers with a classified source of
income from different groups of students and other university services.
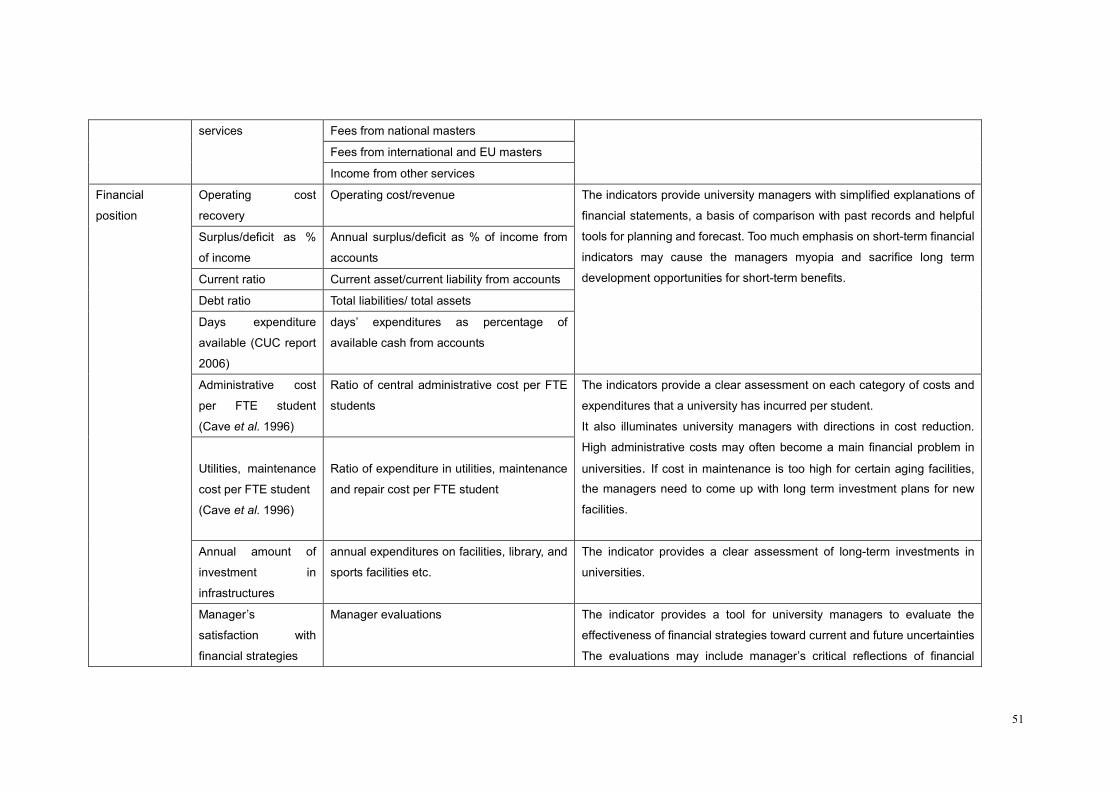
51
Fees from national masters
Fees from international and EU masters
services
Income from other services
Operating cost
recovery
Operating cost/revenue
Surplus/deficit as %
of income
Annual surplus/deficit as % of income from
accounts
Current ratio Current asset/current liability from accounts
Debt ratio Total liabilities/ total assets
Days expenditure
available (CUC report
2006)
days’ expenditures as percentage of
available cash from accounts
The indicators provide university managers with simplified explanations of
financial statements, a basis of comparison with past records and helpful
tools for planning and forecast. Too much emphasis on short-term financial
indicators may cause the managers myopia and sacrifice long term
development opportunities for short-term benefits.
Administrative cost
per FTE student
(Cave et al. 1996)
Ratio of central administrative cost per FTE
students
Utilities, maintenance
cost per FTE student
(Cave et al. 1996)
Ratio of expenditure in utilities, maintenance
and repair cost per FTE student
The indicators provide a clear assessment on each category of costs and
expenditures that a university has incurred per student.
It also illuminates university managers with directions in cost reduction.
High administrative costs may often become a main financial problem in
universities. If cost in maintenance is too high for certain aging facilities,
the managers need to come up with long term investment plans for new
facilities.
Annual amount of
investment in
infrastructures
annual expenditures on facilities, library, and
sports facilities etc.
The indicator provides a clear assessment of long-term investments in
universities.
Financial
position
Manager’s
satisfaction with
financial strategies
Manager evaluations The indicator provides a tool for university managers to evaluate the
effectiveness of financial strategies toward current and future uncertainties
The evaluations may include manager’s critical reflections of financial

52
strategies and thereby it leads to a chance of revising current financial
strategies. However, because of manager’s subjective judgments, the
measurement may encounter reliability issues. The indicator should be of
cautiousness in the measurement.

53
5.3.1.1 Financial resources
� Amount of research income
The indicator counts total the amount of income related to research activities in
universities, which is also used in CUC report (2006). It can be measured by the amount
of research granted funds and research incomes. The amount of research granted funds
counts the total amount of funds from research applications and sponsors. It discloses a
symbol of research strength in financial point of view. The amount of research income
from commercial activities counts the total income from trade of patents and license
agreements etc. There are two sources of income for research activities. The indicator
hints an important financial capability of universities in acquiring resources for research
activities. However, a research project with large amounts of research funding granted
may take years for a research group to complete before any new funds that might be
contracted. Therefore, university managers may need to pay attentions to the influence of
large research programs that affect the subsequent capabilities in contracting research
funds. The reliability of indicator in measuring financial performance in universities might
be compromised.
� Research indirect cost recovery
One notable indicator related to contracting research funds is research indirect cost
recovery contribution as percentages of total research income. The indicator has been
used in the performance measurement in University of Edinburgh. The indicator measures
the amount of contributions paid for research indirect cost recovery to the total research
income contracted. The research grants and research contracted funds usually account
for a certain percentage of research full direct cost. The remaining cost must be covered
by universities. The indicator is especially useful in contracting research funds for
university managers. The higher the indirect cost recovery, the less cost the universities
needs to bear. It is a valid indicator to measure financial performance in terms of
acquirement of financial resource. The reliability of this measure may be affected by the
maximum amount of funds the sponsors can supply with. The indicator can provide the
managers with a basic percentage from historical data to check how many new funds are
required to contract.
� Share in third-party funding and share in governmental funding
Diversity of funding sources may be becoming an important criterion in financial
performance measurement in universities. It signals a kind of capability and
competitiveness of universities in acquiring diverse sources of financial resources. It is
also an ambition for universities to be self-sufficient and secure in funds sourcing. The
indicator of third-party funding measures the percentages of funding to universities from
competitive funding sources. Third-party funding may include funds from private
companies, research councils and donors etc. The indicator of share in governmental
54
funding measures the percentage of funds directly from the governments. The higher the
percentage of third-party and governmental funding, the higher financial performance the
universities could be. As a financial indicator, the results from the indicator may fluctuate
by the amount of funds the sponsors can supply with.
� Income from tuition fees and other services
Tuition fees are one of the main sources of financial resources to universities. It can be
measured by the amount of tuition fees in categories of national bachelors, international
and European bachelors, national masters, international and European Masters and other
university services etc. Income from other university services may include income from
renting facilities, income from retail services within university etc. The measurement
provides university managers with classified sources of income from different groups of
students and other university services. Therefore, the managers are able to know what
the exact amount of income from these specific sources is.
5.3.1.2 Financial position
Financial position or financial condition may be an overall indicator in financial
performance measurement. It contains both short-term and long-term financial position.
Short-term financial position primarily concerns financial condition of an organization
within one year. Accounting ratios and financial results are main tools in the
measurement. Long term financial position is about strategic and long-term financial
status of an organization for more than one year. Effective financial strategies are vital to
lead managers to achieve long-term financial health in the organization. University
managers may look at these indicators as a preliminary diagnosis of whether a university
is able to be financially sustainable toward its objectives.
Short-term financial position
The kinds of financial results and accounting ratios to be used as financial indicators are
institutionally defined. They depend on university environments and managerial choices.
The CUC report (2006) and University of Edinburgh provide some financial indicators that
include operating cost recovery, surplus/deficit as % of income and current ratio. Besides,
ratios such as administrative cost per FTE student, utilities and maintenance cost per FTE
student and other expenditures per FTE student are also used in the measurement of cost
varieties in universities. (Cave et al. 1996)
� Operating cost recovery
Operating costs are expenses that are related to university’s operating activities. They
include all kinds of variable operating costs such as maintenance cost and repairing cost.

55
Operating costs usually vary with the level of university outputs. To offset the recovery of
operating cost from associated benefits in use, the operating costs are recovered from
university’s revenue. The indicator is measured by the ratio of operating costs to total
university revenues. It is an indicator to measure how much revenue is needed for
matching the incurred operating cost in the university operating.
� Surplus/deficit as % of income
The indicator measures a percentage of surplus or deficit in proportion to total university
income. The surplus or deficit is the difference between university income and university
expenditures. When measured by percentage of income, it indicates the percentage of
surplus can be left for next year’s operating or the amount of deficit must be covered by
next year’s revenue. It is very helpful for university managers to use the indicator as a
control mechanism in budget planning.
� Current ratio
The indicator measures the financial strength of universities to see how much current
liabilities are covered by current assets. Because universities barely have any inventories,
most current assets are quick assets that are easily convertible into cash. The larger the
ratio, the great financial strength of the universities is.
� Debt ratio
The indicator indicates a percentage of university assets are provided by debts. It is
measured by the ratio of total liabilities to total university assets. The larger the ratio, the
higher amount of assets is financed by liabilities in the university. A high debt ratio might
cause university managers loose control on expenses and discourage lenders from loans
in the future.
All these short-term financial indicators are frequently used in the measurements in
universities. They provide helpful tools for university managers to measure financial
positions in universities. The reliability of the measurements by financial indicators
depends on the accuracy of information published in financial statements and reports in
universities. The indicators also provide the managers with simplified explanations of
financial statements, a basis of comparison with past records and helpful tools in planning
and forecast. One potential disadvantage on financial indicators is that too much
emphasis on financial indicators may cause the managers myopia and may sacrifice long
term development opportunities for short-term benefits.
Long-term financial position
Long term financial position is about strategic and long-term financial status of an
56
organization for more than one year. Like other non-profit organizations in public sector,
universities may need financial strategies to guide managers in appropriate financial
management with lower risks. University’s long term financial position may be measured
by the effectiveness of financial strategies in severing financial management. The
measurement is an ongoing and empirical process to see whether financial strategies
have provided constructive contributions to university financial management. Another
alternative measurement is by the amount of investment in infrastructures. The
infrastructures provide the basic needs for universities to achieve long term development.
The investments will also affect the long-term financial position in the universities.
� Manager’s satisfaction toward financial strategies
It is an approach by measuring manager’s satisfaction toward current financial strategies.
The purpose of this indicator is to see whether a university has proven strategies that
could effectively lead managerial behaviors to meet current and future challenges.
Manager’s opinions can serve as valid measures in the measurement of effectiveness of
financial strategies. The indicator can be measured by manager’s evaluations on the
current financial strategies. The evaluations may include manager’s critical reflections of
financial strategies and thereby it may leads to a chance of revising current financial
strategies. However, because of manager’s subjective judgments, the measurement may
encounter reliability issues. The measurement should be of cautiousness.
� Annual amount of investment in infrastructures
The indicator measures the total expenditures on infrastructures in universities. The
infrastructures provide the basic needs for universities to achieve long term development.
It will also affect the long term financial positions in the universities. In CUC report (2006),
a similar indicator is total cost of remedial investment on estates and infrastructure.
5.3.2 Human Resource (employee)
The relation between human resource management and organizational performance has
well been examined in human resource literatures (Huselid, 1995, Rogers and Wright
1998). However, the systematic performance measurement on human resource might be
very rare at this moment. Wright and McMahan (1992) defined strategic human resource
to organizational performance as planned human resource deployment and activities that
enable organizations to achieve goals. As universities do not have clear goals, it is difficult
to measure the extent to which the goals are achieved by means of human resource
management. Performance measurement on human resource might be more appropriate
to measuring human capital and effectiveness of policies and practices in universities.
They are two important criteria in evaluation of human resource performance.

57
Table 4 Human Resource Indicators
Performance areas Indicators Measurement alternatives Pros and Cons for management
Success rate in
recruitment
% of full time recruitment It provides university managers with a signal in whether
more resources are needed in this area to increase the
success rate to recruit more amount of human capital
% of English speaking employees
The number of PhD students
The number of Professors
The number of assistant professors
with or without PhD
The number of lecturers
The number of supportive staff
Staff skills and staff
diversity
(CUC report 2006)
Academic /non-academic staff ratio
The indicator of staff skills and staff diversity is a
measurement of staff force in universities but it may have
difficulties in how actual these skills can be measured
objectively. For example, it might be not practical to ask all
employees to take part in an English test to justify their
English-speaking capacity.
Human Capital
Employee’s age
distribution
(CUC report 2006)
% of employee in age span e.g.
30-40 or over 60
It provides university managers with an image of growth
patterns in the age distribution among university
employees. Once the average age of employees is
becoming old and is at the cost of university outputs,
recruitments for new employees may get important in
manager’s agendas. One potential pitfall is unclear what
the average age is ideal to university staff with optimal
level of experiences and outputs. Thus, the validity of this
indicator to university managers is compromised.
Effectiveness of HR policies
and practices on Job
performance
Expenditures on training
and development
(CUC report 2006)
Annual expenditure on training and
development
Expenditures on training and development have large
influence on organizational productivity. However, it may
take overtime before any significant job performance might
be seen from employees as a result of training and

58
development programs. The effect of the indicator to
university managers in measuring job performance might
not be obvious
% of employee satisfied with
welfare, promotion and pension
Employee motivation or
satisfaction (CUC report
2006) Employee turnover and sick leave
Employee motivation is an important factor in job
performance but results from the indicator may only be
referential because of subjective judgments by employees.
For university managers, it is an easy and quick method
for detecting employee’s satisfaction toward relevant
policies and practices.
59
5.3.2.1 Human capital
The importance of human capital to universities builds on whether the universities can
provide with qualitative and competitive academic personnel to meet the needs of
academic activities. Human capital can be seen as the stocks of skills and knowledge that
are capable of producing value. These skills and knowledge are embodied in people.
� Percentage of Success in recruitment
Recruitment is important for universities to store and maintain a certain level human
capital for university services. It caters for the needs of universities to fulfill its available job
positions. Recruitments can be divided into full-time and part-time recruitments. Fulltime
recruitments to the universities mean more than souring for candidates to do the jobs. It
means a strong fit between job positions with required knowledge, skills and experience.
Thus, the indicator might be more appropriate and valid here for the universities to
measure the performance in human capital. The indicator measures the successful rate
in the total fulltime recruitments. The results from the indicator may fluctuate because of
the number of available job positions. Thus, the reliability of the measurement in
recruitment ought not to be overestimated. It provides university managers with a signal of
whether more resources are needed in this area to increase the success rate.
� Staff skills and staff diversity
Staff skills are broad and can be measured by variety of skills related to staff capabilities.
The indicator is also used in CUC report (2006). One of methods in the measurement is by
staff’s language skills. As universities with large number of international students on
campus, communication in English is becoming important to university staff in services.
For example, percentage of staff who can speak English with min. 5.5 in IELTS (an
English proficiency test) might be a valid and reliable measure in this respect but it might
not be very practical in application. It needs all staff to take part in the English test, which
might be very costly. Staff diversity is also an important indicator in staff composition in
universities. It can be measured by counting the number of PhD students, professors
and assistant professors, the number of academic staff, supportive staff, lecturers and
ratio of academic staff to non-academic staff etc. As knowledge and skills are embodied in
people, the indicator also provides university managers with a clear image of academic
capabilities in terms of human capital stored in university staff. The measurement is a
quick snapshot of how diverse of university staff could be. The indicator of staff skills and
staff diversity is a helpful measurement of staff composition and staff capabilities in
universities but it may also encounter difficulties in how actual these skills can be
measured objectively.
� Employee’s age distribution
Employee’s age distribution measures the average age among different groups of
60
academic and non-academic employees. On one hand, the increasing average age of
employees may decrease in university capabilities and outputs. On the other hand, it also
signals the increasing experiences among university employees. The validity of this
indicator in human capital may not be overestimated. It is unclear what level of average
age is ideal to employees with optimal level of experiences and outputs. The employee’s
age distribution can be measured by percentages of employees in different age spans in
the division of gender, e.g. % of male employee in age 30-40 and % of employee over age
50 or 60. It provides university managers with an image of growth patterns in age
distribution among university employees. The measurement is a valid and reliable
presentation of university employee’s age distribution. Once the managers think the
average age of employees is becoming old and is at the cost of university outputs,
recruitments for new employees may get important in their agendas.
5.3.2.2 HR policies and practices
The effectiveness of human resource policies and practices may be measured by how
these policies and practices have helped in increasing employee’s job performance in
addition to human capital. The importance of job performance related to organizational
performance in service industry is widely documented in human resource literatures.
Schneider and Bowen (1993) attributed this important connection to the uniqueness of
service industry that features a flimsy and permeable boundary between organizations
and their customers. Thorsten (2004) argued that customers often depend on the
behaviors of service employees in judging the quality of service. Hence service
employee’s level of customer orientation becomes a key driver for customer satisfaction.
Service employee’s level of customer orientation can also be regarded as a leverage of
service organization’s economic success (Bitner et.al, 1990). Therefore, the effectiveness
of human resource policies and practices play a critical role in universities. The level of
individual job performance might decide what amounts of value can be created in
organizational service.
Universities have both academic employees and non-academic employees. A common
problem is that people’s job performance can not be directly measured. For example, how
can you measure an academic employee who is sitting 10 hours a day in his office as
good or bad performance? University managers can not directly measure the
performance of the employee unless his paper is published by a well-known journal at
some day. There is a long lagging time between inputs of time and efforts into making
the paper and the outcome of the paper. People are not machines which their job
performance can be directly seen.
Before the development of performance indicators, we must first get to know what job
performance is and what constitutes and affects the performance of employees in
universities. A well known model derived from Harold Kelley's theory of causal schemata
in relationship between performance, ability and effort information (motivation) offers a

61
great help in explanation. Job performance can be configured into:
Performance = ability * motivation
Campbell et al. (1993) defined a more complicated definition of job performance as
individual behavior variables that compose knowledge, skills, abilities and motivations
toward organizational goals. The definition highlights the importance of employee abilities,
skills, knowledge and motivations in job performance toward organizational goals. While
in Kelley’s model, the ability is a bigger word that contains knowledge, skills and
nature-born abilities. The development of performance indicators will focus on these
aspects that potentially affect employee’s ability and motivation in human resource
management.
� Expenditures on training and development
Ability can be generally defined as someone’s capability of doing something, which is
similar to the concept of human capital discussed above. One important indicator related
to ability is employ’s training and development. It can be measured by annual
expenditures on employee’s training and career development in universities. The indicator
is also used in CUC report (2006). The expenditures on job training, career development
and opportunities can have a directly impact on employee’s job performance. Bartel (1994)
argue that the relationship between training and labor productivity exists not only at
individual level but also at organizational level. However, the effect of training and
development to employee’s job performance should not be overestimated. It is only one
of the factors that may affect on employee’s job performance. Besides, it may take
overtime before any significant job performance might be seen from employees as a result
of training and development programs.
� Employee motivation
Motivation is another factor that may has a great influence on employee’s job performance.
Brewer and Selden (2000) identified several kinds of motivations associated with
employee’s job performance in government agencies, including structure of task/work,
task motivation, public service motivation and individual motivation. The motivations can
be grouped into intrinsic and extrinsic motivations. Motivation factors vary, which may
include all sorts of briefs, values, needs and wants. Without motivation, employee’s job
performance might be comprised and may not last longer, no matter how hard employees
are forced to work and how talent, experienced and skillful the employees are.
Employee’s extrinsic motivation can be measured by their level of satisfaction toward
university human resource policies and practices. The use of survey is a qualitative
method for detecting employee’s satisfaction toward the policies and practices such as
welfare, promotion and pension etc. The policies and practices may construct the main
source of extrinsic motivation factors. The use of survey by employee evaluations is a
62
useful mechanism to know what employee’s general opinions in these aspects. For
university management, the data from the indicator may only be referential because of
subjective judgments by employees. Besides, employee’s motivation may also be
measured by employee’s turnover and sick leave. Employees with less motivation may
negatively quit the job or be sick leave. Their behaviors will result in a higher turnover and
sick leave rate. The employee’s turnover and sick leave provides a helpful mean for
university managers to measure employee’s motivation by their associated behaviors.
However, it might be not very reliable. Even if employees with low motivation, they may
still go to work on time by the enforcement of rigid labor contracts. The measurement also
needs considerable efforts in collecting data every day and thus it may cause extra
workloads for employees.
5.4 Conclusion
In this section, we have presented the performance indicators that can be useful for each
dimension. The performance indicators are discussed in terms of pros and cons for
university management. They have partly answered the third research question. In the
following section, we are going to summarize the interviews in the University of Twente.
The interviews will shed lights on the usefulness of the performance indicators in
university settings.

63
Part ⅢⅢⅢⅢ
6. Managerial evaluation of performance indicators
In Part Ⅱ, performance indicators in each dimension have been discussed in terms of
pros and cons for university management. In this part, the performance indicators will be
evaluated by university managers to see whether they are appropriate to managerial use
in a university setting. The evaluations are done by the interviews in the University of
Twente. In the following sections, the results will be summarized from the evaluations. A
complete summary of managerial comments is presented in Appendix 2.
6.1 Managerial evaluation of research indicators
Table 5 Summary of research performance indicators evaluated by UT managers
Evaluation by Managers in UT
Current use KPI Future use
Research dimension
1. Researchers FTE √√√√ 2. The number of researchers from sponsors
3. The number of successful research granted applications
a) The number of successful application by programs
b) € amount of research grants √√√√
4. The number of Strategic partnerships
5. The number of publications by research unit √√√√ √√√√
(ISI, non-ISI journals, conference, books, chapters and others)
6. The number of doctorate conferred √√√√ √√√√
7. Exploitation of IP
a) The number of spin-off companies √√√√
b) The umber of license agreements √√√√
c) The number of patents or output of patents √√√√
8. The number of successful entrepreneurs
9. Citation
a) Impact score √√√√
b) H index
11. Membership of research council or editorship of journals √√√√
12. Awards
a) NWO Spinoza Prize √√√√
b) Simon Stevin Prize √√√√
13. Research ranking
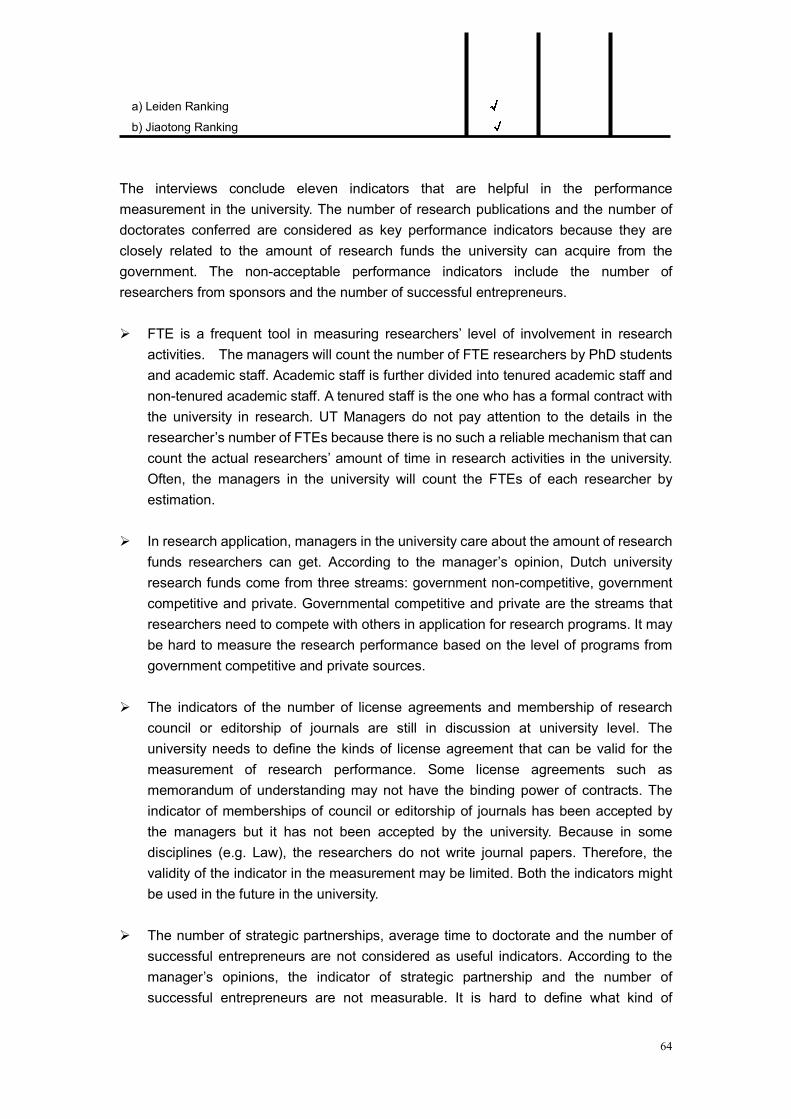
64
a) Leiden Ranking √√√√
b) Jiaotong Ranking √√√√
The interviews conclude eleven indicators that are helpful in the performance
measurement in the university. The number of research publications and the number of
doctorates conferred are considered as key performance indicators because they are
closely related to the amount of research funds the university can acquire from the
government. The non-acceptable performance indicators include the number of
researchers from sponsors and the number of successful entrepreneurs.
� FTE is a frequent tool in measuring researchers’ level of involvement in research
activities. The managers will count the number of FTE researchers by PhD students
and academic staff. Academic staff is further divided into tenured academic staff and
non-tenured academic staff. A tenured staff is the one who has a formal contract with
the university in research. UT Managers do not pay attention to the details in the
researcher’s number of FTEs because there is no such a reliable mechanism that can
count the actual researchers’ amount of time in research activities in the university.
Often, the managers in the university will count the FTEs of each researcher by
estimation.
� In research application, managers in the university care about the amount of research
funds researchers can get. According to the manager’s opinion, Dutch university
research funds come from three streams: government non-competitive, government
competitive and private. Governmental competitive and private are the streams that
researchers need to compete with others in application for research programs. It may
be hard to measure the research performance based on the level of programs from
government competitive and private sources.
� The indicators of the number of license agreements and membership of research
council or editorship of journals are still in discussion at university level. The
university needs to define the kinds of license agreement that can be valid for the
measurement of research performance. Some license agreements such as
memorandum of understanding may not have the binding power of contracts. The
indicator of memberships of council or editorship of journals has been accepted by
the managers but it has not been accepted by the university. Because in some
disciplines (e.g. Law), the researchers do not write journal papers. Therefore, the
validity of the indicator in the measurement may be limited. Both the indicators might
be used in the future in the university.
� The number of strategic partnerships, average time to doctorate and the number of
successful entrepreneurs are not considered as useful indicators. According to the
manager’s opinions, the indicator of strategic partnership and the number of
successful entrepreneurs are not measurable. It is hard to define what kind of

65
strategic partnerships are important to the university. It is also hard to define the
categories of entrepreneurs. For example, students may work as taxi drivers in their
studies. They can also be seen as entrepreneurs. Thus, the reliability of the indicator
is discounted. Besides, the managers generally do not pay attention to details in how
much time PhD students may need to achieve their diplomas.
� In citation, UT managers tend to use impact score as the only measure in citation.
Though the impact score may have some reliability issues in the measurement of
citation, the managers still consider it as the relative best and most convenient
approach. The impact score is a widely accepted measure in other universities as
well, which makes the comparisons of the performance in citation easy.
� In award, UT managers are inclined to use NWO Spinoza Prize and Simon Stevin
Prize as measures. In research rankings, the managers use leiden and jiaotong
rankings.
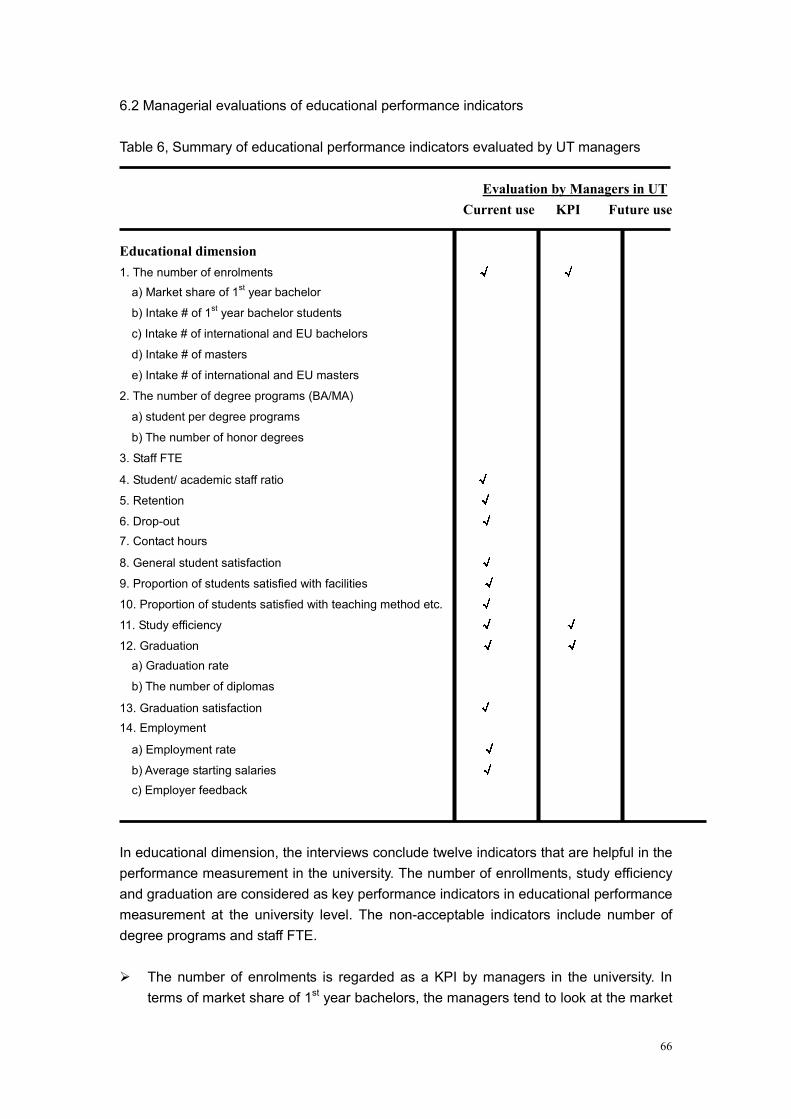
66
6.2 Managerial evaluations of educational performance indicators
Table 6, Summary of educational performance indicators evaluated by UT managers
Evaluation by Managers in UT
Current use KPI Future use
Educational dimension
1. The number of enrolments √√√√ √√√√
a) Market share of 1st year bachelor
b) Intake # of 1st year bachelor students
c) Intake # of international and EU bachelors
d) Intake # of masters
e) Intake # of international and EU masters
2. The number of degree programs (BA/MA)
a) student per degree programs
b) The number of honor degrees
3. Staff FTE
4. Student/ academic staff ratio √√√√
5. Retention √√√√
6. Drop-out √√√√
7. Contact hours
8. General student satisfaction √√√√
9. Proportion of students satisfied with facilities √√√√
10. Proportion of students satisfied with teaching method etc. √√√√
11. Study efficiency √√√√ √√√√
12. Graduation √√√√ √√√√
a) Graduation rate
b) The number of diplomas
13. Graduation satisfaction √√√√
14. Employment
a) Employment rate √√√√
b) Average starting salaries √√√√
c) Employer feedback
In educational dimension, the interviews conclude twelve indicators that are helpful in the
performance measurement in the university. The number of enrollments, study efficiency
and graduation are considered as key performance indicators in educational performance
measurement at the university level. The non-acceptable indicators include number of
degree programs and staff FTE.
� The number of enrolments is regarded as a KPI by managers in the university. In
terms of market share of 1st year bachelors, the managers tend to look at the market

67
share of bachelors at program level. UT managers are also interested in student’s
pervious education background e.g. HAVO or VWO. For master programs, the
managers measure master students by internal, national masters (HBO, WO) and
international masters.
� The number of degree programs is not considered as a very helpful educational
performance indicator because they may be closely related to university intentions in
the mission statement and the amount of resource available.
� The usefulness of Staff FTEs is very limited because university academic staff does
not tell their managers how much time they spend on educational activities or how
much time they spend on research. Therefore, managers may usually get the results
of staff FTE by estimation. There is no such a reliable mechanism that can count the
actual staff’ amount of time in academic activities in the university.
� Managers do use student/ academic staff ratio but they do not pay much attention to
the result from the indicator in the university. The indicator only provides managers
with a general idea of comparison between the number of students and academic
staff.
� Contact hours are not considered as a valid indicator because there is not just one
educational model. Every program has its own curriculum and the building blocks of
curriculum are different. The indicator is not very measurable.
� The indicators of student satisfactions are becoming important in universities. In the
University of Twente, student satisfaction is measured both by new students in first
year and students in last years. Though the reliability of measurement may be
compromised by student’s subjective judgments, the managers believe that the
measurement can still produce valuable information especially when questionnaires
are handed out to large amount of the student population on campus.
� Graduation satisfaction and employment are two important indicators in educational
outcome. The measurement is done by Dutch Higher Education Monitor System
“WO” which contains questionnaires about employment and average starting salaries
to national higher education students. The indicators provide managers with valuable
information of student’s after-university life but employer feedback is not practical due
to the difficulties in information collection.

68
6.3 Managerial evaluations of financial performance indicators
Table 7 Summary of financial performance indicators evaluated by UT managers
Evaluation by Managers in UT
Current use KPI Future use
Financial dimension
1. Amount of research income √√√√ √√√√
a) Annual granted research funds
b) Annual research income from commercialization
2. Research indirect cost recovery
3. Share in third-party & share in governmental funding √√√√
4. Income from tuition fees and other service √√√√
5. Operating cost recovery
6. Surplus/deficit as % of income √√√√ √√√√
7. Current ratio √√√√ √√√√
8. Debt ratio √√√√ √√√√
9. Day’s expenditure available
10. Administrative cost per FTE student
11. Utilities, maintenance cost per FTE student
12. Annual amount of investment in infrastructures
13. Manager’s satisfaction with financial strategies √√√√
In financial dimension, the interviews conclude six performance indicators that are useful
in the financial performance measurement in the university. From the indicators, the
amount of research income, surplus/ deficit as % of income, current ratio and debt ratio
are considered as key performance indicators in financial performance measurement at
university level. Except for the indicator of the amount of research income, the remaining
three KPIs will be reported to the Minster of Education. The non-acceptable indicators
include research indirect cost recovery, day’s expenditure available, administrative
cost/utilities, maintenance cost per FTE student, annual amount of investment in
infrastructure and manager’s satisfaction with financial strategies.
� To research indirect cost recovery, the managers do not see it as a useful indicator
because the amount of research funds the university can get might be beyond the
managerial control. Thus, in calculating of research indirect cost recovery, the
reliability of the indicator in the measurement might be compromised.
� To income from tuition fees and other services, the managers need only to count the
number of students in calculating the total amount of tuition fees. Tuition fees from
69
national bachelor students are fixed
� With regard to indicators of No.5, 9, 10, 11.12 in table 7, UT managers do not
consider them as useful indicators in financial performance measurement. They are
not the aspects that the university managers are interested in. In university
departments, the managers tend to use profit and loss account as the measure in
financial performance measurement.
� With regard to the indicator of manager’s satisfaction with financial strategies, it might
be a helpful financial indicator in the future. In the manager’s opinions, current
financial management is relatively old-fashioned in the university. The way to
evaluate the effectiveness of financial strategies is based on the evaluation of
university financial performance which requires the change in governmental
mechanisms. It might be taken place but the progress of governmental procedure is
slow right now.

70
6.4 Managerial evaluations of human resource indicators
Table 8 Summary of HR performance indicators evaluated by UT managers
Evaluation by Managers in UT
Current use KPI Future use
Human Resource dimension
1. Success rate in recruitment
2. Staff skills and staff diversity √√√√
a) % of English-speaking employees
b) The number of PhD students
c) The number of professors (Prof.)
d) The number of assistant professors (UHD)
e) The number of lecturers (UD)
f) The number of supportive staff
g) ratio of academic staff/non-academic staff √√√√
3. Employee’s age distribution √√√√
4. Expenditures on training and development
5. Employee motivation or satisfaction √√√√
a) % of employees satisfied with welfare etc.
b) Employee turnover and sick leave
In human resource dimension, the interviews conclude four indicators that are useful in
the performance measurement in the university. Among the four indicators, the ratio of
academic and non-academic staff is regarded as a key performance indicator in human
resource. The non-acceptable indicators include success rate in recruitment and
expenditures on training and development
� With regard to the indicator of success rate in recruitment, managers do not see it as
an important indicator in human resource. Recruitments do not take place every year.
Thus, the reliability of the indicator in the measurement of human resources might be
compromised.
� With regard to the indicator of staff skills and staff diversity, English tests are
conducted every year as a measure of employee’s proficiency of English language in
the university. The tests can either be TOFEL or IELTS. Besides, the managers
regard the ratio of academic and non-academic staff as a key performance indicator
in human resource.
� Managers in the university do not measure the expenditures on training and
development separately. The indicator is measured by average expenditure per FTE
the university has spent on salaries, desks and computers etc.

71
� Employee’s satisfaction in the university is measured by an external institution every
two or three years. The measurement provides an external evaluation mechanism for
the university managers in the measurement of employee satisfaction.
6.5 Conclusion
From this section, we summarize a list of performance indicators that can be used in
university settings. The evaluations by the managers in the University of Twente have
made the usefulness of performance indicators in the four dimensions clear. However,
questions may be raised by the extent to which the performance indicators in the study
can be used for other universities and the extent to which the framework can be used in
university settings. From the evaluations, most performance indicators are relevant but
some are not. In the following section, we are going to discuss the relevant questions.

72
Part ⅣⅣⅣⅣ
7. Discussion
In the following section, several questions might be raised after the research.
1. How robust can the performance dimensions and the framework from this
research be used in universities?
In this research, we endeavor to find a solution to performance measurement in
universities. Universities are characterized by gal ambiguity and goal diversity. Therefore,
it is difficult to capture performance dimensions from the ambiguous goals. This paper
argues that the performance of universities can be measured by the extent to which each
of university functions is maintained toward the university goals. Based on this argument,
the academic dimension and management dimension are developed to capture the
performance. The two dimensions can be further divided into four sub-dimensions. They
are research, education, finance and human resources. The development of the main and
sub-dimensions may not be exhausted to universities. For example, in University of
Twente, valorization is an increasingly important dimension to the performance in the
university. The development of the dimensions in the framework may not be the ultimate
solution to capture all performance areas but it hopes to find key and common grounds
that may be interested by managers in most universities. The performance framework
developed is the integration of both performance dimensions and indicators. The four
dimensions represent a balanced concept to university managers in performance
measurement. As mentioned that the development of the dimensions in the framework are
not exclusive, the framework may also be modified to incorporate more dimensions that
managers are interested in universities.
2. Are the performance indicators evaluated by managers in UT suitable for other
universities in the country?
In developing performance indicators for each dimension, we endeavor to cover the key
performance areas in university activities. Besides, we have also studied other
performance measurement literatures to see how performance indicators are developed
in universities in United kingdoms and Australia. The list of developed performance
indicators might not be 100% exclusive for each dimension but we have tried to develop
indicators as many as we can from a managerial perspective in university management.
The evaluation of performance indicators is done by the managers in the University of
twente, which is to justify the validity of indicators from real managerial perspectives in
university management. Because of subjective judgments, it may cause discrepancies in
the choice of performance indicators by managers in different universities. It is also one of
the limitations in this research. Therefore, it may also happen that the indicators in the

73
paper will not be endorsed by people in other universities. The use of performance
indicators might be institutionally defined in universities. It might be very likely be a result
of managerial discretions based on the analysis of environments and technologies used in
universities.
3. What particular findings might be raised from the research?
There are some indicators from the literatures that have not been chosen in the
evaluations by the managers in UT. For example, the indicator of research indirect cost
recovery has been used in the University of Edinburgh. It is an important indicator in the
measurement of financial performance in the university. The indicator measures the
percentage of indirect cost that can be recovered from the grants and contracts in
research activities. The higher the ratio, the less cost the university need to bear in
associated research activities. One possible explanation might come from the reliability of
the indicator in the measurement of financial performance. When the university in
contracting research funds and applying for research applications, the amount of research
finding granted might be beyond the control of the university. The required amount of
funding may exceed the maximum amount of funds the sponsors can supply with.
Therefore, the reliability of the indicator in financial performance measurement in
university might be compromised. Another possible explanation might be that the
managers in the University of Twente have not realized the indicator because of different
environments in comparison to those of the University of Edinburgh.
Another indicator worth mentioning is the staff FTE. The use of FTE is a popular tool in the
measurement of employee’s involvement in activities. From the interviews, we know that
the managers in UT will not count the details of staff FTE because the staff usually does
not tell their managers how much time they spend on educational activities or how much
time they spend on research activities. Therefore, the managers tend to estimate the
staff’s involvement in percentages. The difficulties in counting concrete academic staff
FTE might come from the different kinds of staff on job positions in the university. The
university has full–time tenured academic staff positions, full-time non-tenured academic
staff positions, part-time academic positions (less than one year) etc. The mix of staff on
different positions may make the university difficulties on the establishment of FTE
standards. For example, the full–time tenured academic staff may have FTE of 1. A
part-time staff may have less than FTE of 1 but it is unknown whether the FTE of part-time
staff can be 0.5 or 0.7 or something else. Therefore, the university may need to set up a
few guidelines or standards in order to measure the concrete FTEs of staff.

74
8. Conclusion
In this section, we are going to conclude the whole research by answering to the research
questions in the first part.
The main objective of this research is to look at a managerial perspective of performance
measurement and try to develop a tailored framework in university settings. Based on this
objective, we developed the main research question as:
“To what extent can a tailored performance measurement framework along the
lines of BSC be developed for performance measurement in university settings?”
In order to answer the main research question, we will answer the sub-research questions
first.
Sub-research Q 1) how can the performance of universities be captured using
comprehensive dimensions?
Universities are characterized by goal ambiguity and goal diversity. Thus performance
measurement in universities is not an easy task. The difficulties arrive at how the
performance can be captured into appropriate dimensions. This paper argues that
universities with ambiguous goals can be measured by the extent to which each of
university functions is maintained toward the university goals. Based on this argument, the
performance can be mainly captured into academic dimension and management
dimension. The academic performance is the core and the management performance is
the enabler to the performance in universities. The two main dimensions can be further
divided into four sub-dimensions. They are research, education, finance and human
resources, which the research and educational performance is the core and the financial
and human resource performance is the enablers. Research and educational activities
are most common activities in wide categories of universities. Financial and human
resources are very important to university management. The development of
sub-dimensions may not be for capturing all the performance areas but it hopes to find key
and common grounds in most universities.
Sub-research Q 2) in which way can a comprehensive PM framework be set up for
application along the lines of BSC in university settings?
From the balanced scorecard, we are able to know that the performance of an
organization can be captured into the dimensions of financial, learning and growth,
customer and internal business. The customer and internal business process
perspectives are the actual performance areas in the organization. The financial and
learning and growth perspectives are the enablers to the organizational performance. As

75
the BSC is originated from the for-profit settings, the application without modifications may
cause difficulties in universities.
Based on the notion of pyramid from Cross and Lynch (1992), we complete a similar
pyramidal performance measurement framework with the balanced scorecard concept
(See Figure 3). The pyramid is a work of systemic integration of performance
dimensions and indicators into a complete performance measurement framework. At the
top of the framework, it is the university vision with two main performance dimensions
(academic and management). Academic performance is the core and management
performance is the enabler to the performance in universities. The two main dimensions
are divided into four sub-dimensions (research, education, finance, human resource). The
four dimensions construct a balanced scorecard concept in the framework. Therefore, it
brings with a more strategic performance measurement to managers with key
performance indicators. At the middle and bottom of the pyramid, other indicators in four
sub-dimensions construct an operational view of performance measurement for managers
in universities. Information from the indicators at each sub-dimension will be summarized
and reviewed by high-level university managers to form a main measurement on
academic and management performance in universities. Performance measurement
follows a measure-up model in the framework.
Sub-research question 3) which performance indicators in the literatures (esp. PM in
public organizations) along with own performance indicators could be used in
university settings?
In this research, we developed a portfolio of performance indicators that could be used by
university managers in each dimension (Table 1, Table 2, Table 3 and Table 4). These
indicators are discussed in terms of pros and cons for management. From the interviews
in the University of Twente, the performance indicators are evaluated and selected. The
interview with Dr. Stolk especially generated much helpful information about the selection
of performance indicators. Both in Part Ⅲ and appendix, the results from the evaluations
are presented. Most performance indicators are relevant to the university but some are
not. One possible explanation is the use of performance indicators might be institutionally
defined in universities. It might be very likely be a result of managerial discretions based
on the analysis of environments and technologies used in universities. It also might be the
development of performance indicators in the paper is not good enough.
The main research question,) “To what extent can a tailored performance
measurement framework along the lines of BSC be developed for performance
measurement in university settings?”
In this paper, a pyramidal performance measurement framework based on the notion of
Cross and lynch can be developed to match the university structures in performance

76
measurement. The pyramid is a work of systemic integration of performance dimensions
and indicators into a complete performance measurement framework. Within the
framework, the balanced scorecard concept can be applied to the four performance
dimensions to capture the key performance areas in universities. By means of integrating
the balanced scorecard concept into the pyramidal framework, we develop a tailored
performance measurement framework that could be used in university settings.

77
Reference
AUCC Research file, Association of Universities and Colleges of Canada, June 1995 •
Volume 1, No. 2, PDF available at:
http://www.aucc.ca/_pdf/english/publications/researchfile/1995-96/vol1n2_e.pdf
Auger N., Roy D.A., 2004, the Balanced Scorecard: A Tool for Health Policy
Decision-making, Canadian Journal of Health, vol. 95, No.3, pp. 233-234
Adriana T. Reka T, V., Vasile C., Alexandra M., 2008, Implementing the balanced
scorecard in public institutions for higher education in Romania—an innovative project,
European Journal of Management, available at :
http://findarticles.com/p/articles/mi_6772/is_2_8/ai_n31029532/
Balanced scorecard
http://www.balancedscorecard.org/BSCResources/AbouttheBalancedScorecard/tabid/55/
Default.aspx
Barbara. S and Richard I. M 1999, Adaptive University Structures: An Analysis of
Adaptation to Socioeconomic Environments of US and European Universities, Publisher:
Jessica Kingsley publishers, Pub. Date: 1999, pp25
Barnabe F. and Riccaboni A. 2007, “which role for performance measurement systems in
higher education? Focus on quality assurance in Italy, Studies in Educational Evaluation
33, 302-319
Brewer G.A and Selden S.C., 2000, Why Elephants Gallop: Assessing and Predicting
Organizational Performance in Federal Agencies. Journal of public administration:
research and theory Vol. 10, No. 4, p. 685-712
Bartel A. P., 1994. Productivity gains from the implementation of employee training
programs. Industrial Relations, vol.33, no.4. pp. 411-425.
Brickner W.H., 1981, “Innoventures: A Case for Public Policy Reform, Colummbia Journal
of World Business, vol.16, pp.77-90
Broadbent J., 2007, Performance measurement system in and of Higher education
institutions in England: Professionalism, managerialism and management, Roehampton
Research Paper. Available at: http:/rrp.roehampton.ac.uk/bsspapers/3
Bitner M.J., Booms B.H., and Tetreault M.S., (1990), “The service encounter: diagnosing
favorable and unfavorable incidents”, Journal of Marketing, Vol. 54, January, pp. 71-84.

78
CUC Report on the Monitoring of Institutional Performance and the Use of Key
Performance Indicators, 2006, available at: www.shef.ac.uk/cuc/pubs/KPI_Booklet.pdf
Cave M., Kogan M. & Hanney S. The use of performance indicators in higher education:
the challenge of quality management, 3rd
edition Jessica Kingsley Publisher 1996, pp50
Carmona M. and Sieh L., 2004, Measuring Quality in Planning: Managing the
Performance Process, Publisher: Taylor & Francis, Inc, pp101
Campbell J. P., McCloy R.A. Oppler S. H, & Sager C. E., 1993. A theory of performance: In
N. Schmitt & W. C. Borman (Eds.), Personnel Selection in Organizations (pp. 35-70). San
Francisco: Jossey-Bass.
Cross K.F. and Lynch R.L., 1992, “For good measure”, CMA Magazine, Vol. 66, No.3, pp.
20-24
Chen S.H., Yang C.C., Shiau J. Y., 2006, the application of balanced scorecard in the
performance evaluation of higher education, The TQM Magazine, V18, pp: 190-205
De Boer H. F., Ender J. and Leisyte L. 2007, Public Sector Reform In Dutch Higher
Education: The Organizational Transformation of the University, Public Adminstration Vol.
85, No.1, pp 27-46
Dowling B. and Richardson R. 1997, “Evaluating performance related pay for managers in
the National Health Service”, The international Journal of Human Resource Management,
vol. 8, No. 3, pp. 348-366
Fitz-Gibbon C.T., 1990, Performance Indicators, Publisher: Multilingual Matters Ltd, Pub.
Date: January 1990, pp.1.
Fitzgerald L., Johnson R., Brignall T. J., Silvestro R. and Voss C, 1991, “Performance
measurement in Service Business” The Chartered Institute of Management Accounts,
London.
Ghalayini A.M. and Noble J.S., Crowe T.J., 1997, “An integrated dynamic performance
measurement system for improving manufacturing competitiveness” International Journal
of Production Economics, vol 48, pp: 207--225
Higgins J.C., 1989, Performance measurement in universities, European Journal of
Operational Research 38, 358-368 North-Holland
Heller D.E, 2001, The States and Public Higher Education Policy: Affordability, Access,
and Accountability, Johns Hopkins University Press, Pub. Date: January 2001
79
Hirsch J. E, 2005. “An index to quantify an individual's scientific research output”. PNAS
102 (46): 16569–16572
Hasenfeld Y., 1983, Human Service Organizations. Englewood Cliffs, NJ: Prentice Hall
Huselid M. A., 1995, The Impact of Human Resource Management Practices on Turnover,
Productivity and Corporate Financial Performance, Academic of management Journal, vol,
38, No.3, pp: 635-672
Jarratt A. 1985, Report of Steering Committee for Efficiency Studies in University,
Committee of Vice Chancellor and Principles, London
Kaplan R.S. and Norton D.P. 1992, the balanced scorecard-Measures that drive
performance, Harvard Business Review, January-February, pp. 71-79
Lawernce S. and Sharma U. 2002, Commodification of Education and Academic
labour—Using Balanced Scorecard in a University Setting, Critical perspective on
Accounting, 13, 661-677
Lenmann S., JACKSON A.D. and Lautrup B. E., A quantitative analysis of indicators of
scientific performance, Scientometrics, Vol. 76, No. 2 pp. 369–390
McKinney J.B. 2004, Effective Financial Management in Public and Nonprofit Agencies, 3
rd edition, Greenwood Publishing Group, Pub. Date: April 2004, pp. 250
Morden T. 2007, Principles of strategic management, chapter 3, 3rd edition, Publisher:
Ashgate Publishing, Limited, Pub. Date: April 2007
McGregor E.B., 1988. The Public Sector Human Resource Puzzle- Strategic Management
of A Strategic Resource, Public Administration Review 48 (6): 941-950
Metawie, M. and Gilman M. (2005); “Problems with the implementation of performance
measurement systems in the public sector where performance is linked to pay: A literature
review drawn from the UK”. 3rd conference on Performance Measurements and
Management Control (Nice September 22-23, 2005)
Neely A.D., Greory M., Platts K., 1995 “Performance Measurement System Design:
Theory and practices” International Journal of operational & Production Management,
vol.15(4)
Neely A.D., Adams C. and Crowe P., 2001, “The performance prism in practice”,
Measuring Business Excellence, vol.5, pp.5-14
Neely A.D, 1998, Measuring Business Performance – Why, What, How, Profile Books Ltd,

80
London pp.5
Neely A.D, 2007, Business Performance Measurement: Unifying Theory and Integrating
Practice, 2nd
edition Cambridge University Press, Pub. Date: November 2007, pp. 202
Neumann R. and Guthrie J. 2002. The corporatization of research in Australian higher
education, Critical Perspectives on Accounting (2002) 13, 721–741
Performance pyramid
http://www.accaglobal.com/students/acca/exams/p5/technical_articles/2950514
Performance measurement in University of Edinburgh
http://www.planning.ed.ac.uk/Strategic_Planning/BSC/0708BSC.htm
Parmenter D, 2007, Key Performance Indicators (KPI): Developing, Implementing and
Using Winning KPIs, Wiley, John & Sons, Incorporated, Pub. Date: January 2007, pp.3
Propper C. and Wilson D. 2003, The Use and Usefulness of Performance Measures in
the Public Sector, CMPO Working paper Series No. 03/073
Pascarella E. T. and Terenzini P. T. 2005. How College Affects Students: A Third Decade
of Research, (Vol. 2), Jossey-Bass, San Francisco.
Price J.L. 1972, The study of organizational effectiveness. Sociological Quarterly 13, 3-15
Phillips J.K., 2004, An application of the balanced scorecard to public transit system
performance assessment, Transportation Journal, Vol. 43 No.1, pp. 26-55
Ruben B. D., 1999, Toward a Balanced Scorecard for Higher Education: Rethinking the
College and University Excellence Indicators Framework, Higher Education Forum,
Center for organizational Development and Leadership. Rutgers Univeristy. Available at :
www.odl.rutgers.edu/resources/pdf/score.pdf
Roger E. W. and Wright P.M., 1998, Measuring Organizational Performance in Strategic
Human Resource Management: Problems, prospects, and performance information
markets, Human Resource Management Review 8 (3): pp. 311-331
Review of higher education outcome performance indicators 2005, Australian
Government report, available at:
www.dest.gov.au/.../review_higher_ed_outcome_performance_indicators_re.pdf
Schneider B. and Bowen D.E., 1993. The Service Organization: Human resource
Management is crucial. Organizational Dynamics, Vol. 21, No.4. PP. 39-52
Sypsa V. and A. Hatzakis 2009, Assessing the impact of biomedical research in academic
81
institutions of disparate sizes, BMC Medical Research Methodology doi:
10.1186/1471-2288-9-33
Sizer J., 1979, “Assessing institutional performance-an overview” European Journal of
Institutional Management in Higher Education 3: 49-75
Sowa J.E, Selden S.C & Sandfort J.R. 2004, “No longer unmeasurable? A
Multidimensional Integrated Model of nonprofit Organizational effectiveness” Nonprofit
Voluntary Sector Quarterly, vol.33,no.4, 711-728
Silvi R., MacrìD.M and Tagliaventi M.R. 2004, Performance Measurement Systems:
Putting Organizational Effectiveness Ahead (June 30, 2004). Available at SSRN:
http://ssrn.com/abstract=1012622
Seashore S.E. and Yuchtman E. 1967 Factorial analysis of Organizational performance,
Administrative Science Quarterly, 12, 377-395
Thorsten H.T., 2004, Customer Orientation of Service Employee: its impact on customer
satisfaction, commitment and retention, International Journal of service industry
management, vol.15. No.5
University of Twente,
http://www.utwente.nl/corporate/en/informatie/mission_statement.doc/
Wisniewski M. and Dickson A., 2001, Measuring Performance in Dumfries and Galloway
Constabulary with the Balanced Scorecard, The Journal of the Operational Research
Society, Vol. 52, No. 10, pp. 1057-1066
Wright P.M. and McMahan G.C.,1992. “Theoretical Perspective for Strategic Human
Resources Management”, Journal of Management, vol, 18. No.2. Pp. 295-320
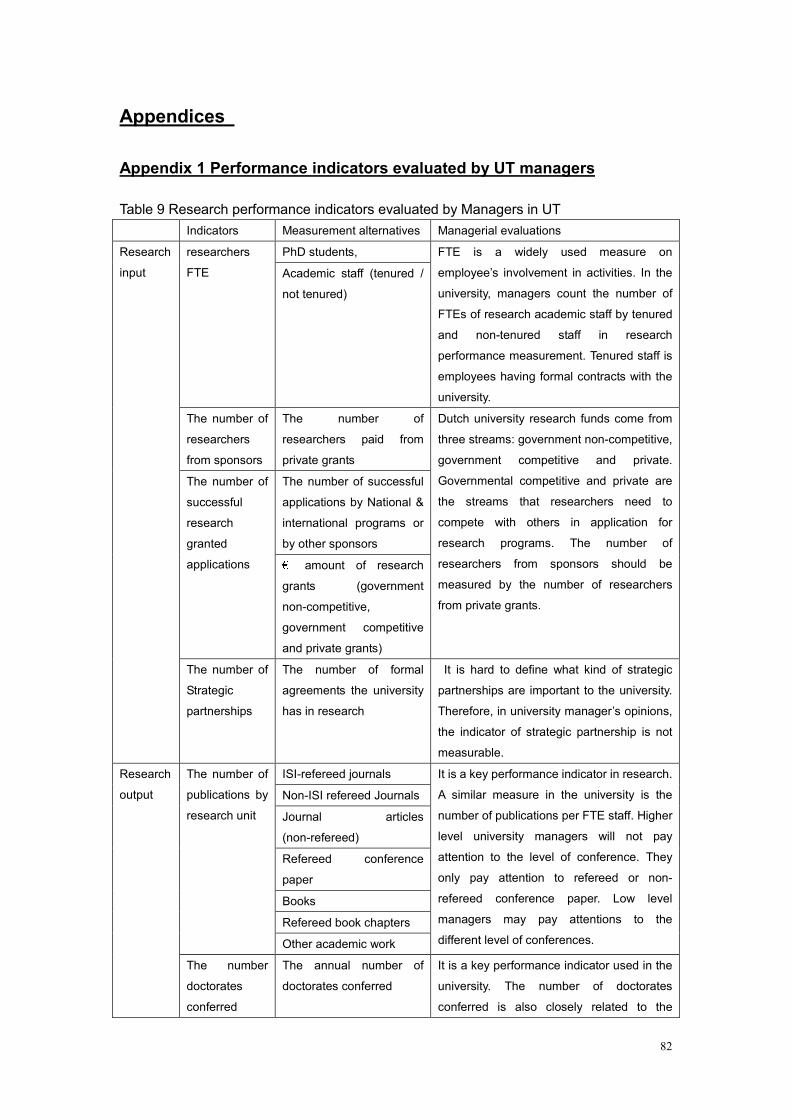
82
Appendices
Appendix 1 Performance indicators evaluated by UT managers
Table 9 Research performance indicators evaluated by Managers in UT
Indicators Measurement alternatives Managerial evaluations
PhD students, researchers
FTE Academic staff (tenured /
not tenured)
FTE is a widely used measure on
employee’s involvement in activities. In the
university, managers count the number of
FTEs of research academic staff by tenured
and non-tenured staff in research
performance measurement. Tenured staff is
employees having formal contracts with the
university.
The number of
researchers
from sponsors
The number of
researchers paid from
private grants
The number of successful
applications by National &
international programs or
by other sponsors
The number of
successful
research
granted
applications € amount of research
grants (government
non-competitive,
government competitive
and private grants)
Dutch university research funds come from
three streams: government non-competitive,
government competitive and private.
Governmental competitive and private are
the streams that researchers need to
compete with others in application for
research programs. The number of
researchers from sponsors should be
measured by the number of researchers
from private grants.
Research
input
The number of
Strategic
partnerships
The number of formal
agreements the university
has in research
It is hard to define what kind of strategic
partnerships are important to the university.
Therefore, in university manager’s opinions,
the indicator of strategic partnership is not
measurable.
ISI-refereed journals
Non-ISI refereed Journals
Journal articles
(non-refereed)
Refereed conference
paper
Books
Refereed book chapters
The number of
publications by
research unit
Other academic work
It is a key performance indicator in research.
A similar measure in the university is the
number of publications per FTE staff. Higher
level university managers will not pay
attention to the level of conference. They
only pay attention to refereed or non-
refereed conference paper. Low level
managers may pay attentions to the
different level of conferences.
Research
output
The number
doctorates
conferred
The annual number of
doctorates conferred
It is a key performance indicator used in the
university. The number of doctorates
conferred is also closely related to the

83
amount of research funding that the
university is able to acquire from the
governments.
The number of Spin-off
companies
The number of License
agreements
Exploitation of
IP
The number of Patents
The university counts number of spin-off
companies and output of patents in
measuring research performance. The use
of number of license agreements is still in
discussion in the university.
The number of
successful
entrepreneurs
(start-up
companies)
Annual growth of
successful entrepreneurs
It is not very useful to university managers
because it is hard to define the categories of
entrepreneurs. For example, students may
work as taxi drivers in their studies. They
can also be seen as entrepreneurs.
Impact score Citation
H index
The managers tend to choose impact score
as the only measure in citation because they
consider it as the best and most convenient
approach among others. It is also very
comparable when other universities use the
same measure in citation.
Membership of
research
council or
editorship of
journals
The number of board
members in research
council and editors in
journals
The managers do count the number of
membership of research council and editors
in journals in research performance
measurement but the indicator has not been
officially accepted at the university level as a
mean to compare the performance between
universities. Some disciplines such as Law,
researchers do not write journals and
conference paper. Therefore, editorships of
journals are not applicable for law
disciplines. The validity of the indicator is
limited.
Awards NWO Spinoza Prize or
others (e.g. European
Science Awards)
The indicator is used in performance
measurement in the university. In addition to
Spinoza prize, the university also
emphasizes on Simon Stevin Prize in the
country.
Research
outcome
Research
ranking
(Leiden
ranking)
Leiden ranking In addition to Leiden ranking, Jiaotong
Ranking is another measure that university
managers use. It provides an external view
of university research performance.
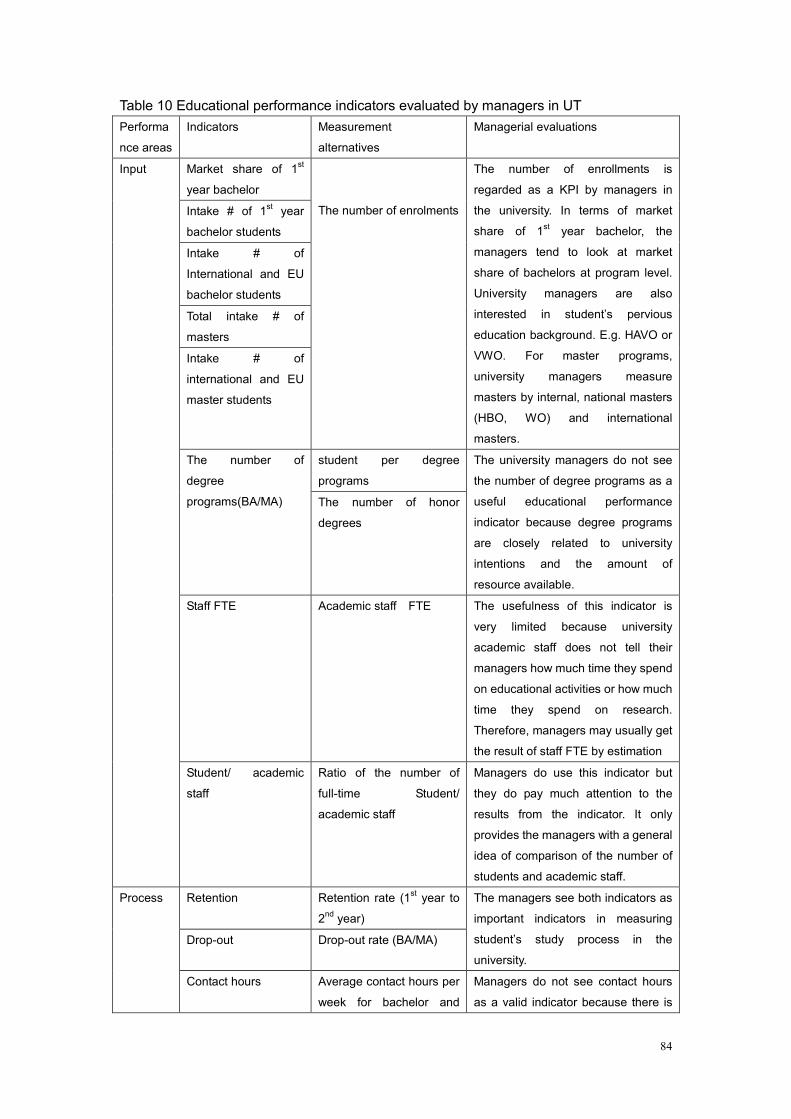
84
Table 10 Educational performance indicators evaluated by managers in UT
Performa
nce areas
Indicators Measurement
alternatives
Managerial evaluations
Market share of 1st
year bachelor
Intake # of 1st year
bachelor students
Intake # of
International and EU
bachelor students
Total intake # of
masters
Intake # of
international and EU
master students
The number of enrolments
The number of enrollments is
regarded as a KPI by managers in
the university. In terms of market
share of 1st year bachelor, the
managers tend to look at market
share of bachelors at program level.
University managers are also
interested in student’s pervious
education background. E.g. HAVO or
VWO. For master programs,
university managers measure
masters by internal, national masters
(HBO, WO) and international
masters.
student per degree
programs
The number of
degree
programs(BA/MA) The number of honor
degrees
The university managers do not see
the number of degree programs as a
useful educational performance
indicator because degree programs
are closely related to university
intentions and the amount of
resource available.
Staff FTE Academic staff FTE The usefulness of this indicator is
very limited because university
academic staff does not tell their
managers how much time they spend
on educational activities or how much
time they spend on research.
Therefore, managers may usually get
the result of staff FTE by estimation
Input
Student/ academic
staff
Ratio of the number of
full-time Student/
academic staff
Managers do use this indicator but
they do pay much attention to the
results from the indicator. It only
provides the managers with a general
idea of comparison of the number of
students and academic staff.
Retention Retention rate (1st year to
2nd
year)
Drop-out Drop-out rate (BA/MA)
The managers see both indicators as
important indicators in measuring
student’s study process in the
university.
Process
Contact hours Average contact hours per
week for bachelor and
Managers do not see contact hours
as a valid indicator because there is

85
master students not only one model of education.
Every program has its own curriculum
and the building blocks of curriculum
are different. The indicator is not very
measurable.
General student
satisfaction
Student evaluation by
Internal survey
proportion of students
satisfied with overall
facilities (classrooms,
libraries etc)
Student evaluation by
Internal survey
proportion of student
satisfied with teaching
method, course
programs, and
information services
etc.
Student evaluation by
Internal survey
They are important indicators in
measuring student’s opinions toward
the university. It is measured both by
fresh students in first year and
students in last years. Though the
reliability of the measurement by
survey may be compromised by
student’s subjective judgments, the
measurement can still tell something
valuable information especially when
questionnaires are handed out to the
large number of student population
Study efficiency avg. time to complete for
bachelors, research and
non-research masters
The indictor can also be called as
study speed in the university. It is a
key performance indicator in
educational performance
measurement. In the university, an
alterative measure is the number of
European credits per average
student by different programs.
Graduation rate Graduation
The number of diplomas
issued (BA, MA)
Graduation indicator is regarded as a
KPI in educational performance
measurement. It helps university
managers to measure the level of
university outputs.
Graduation
satisfaction
Student graduation
evaluation by survey
Employment rate
Average starting salaries
Output
&Outcom
e
Employment
Employer feedback
They are two important outcome
indicators. The measurement is done
by Dutch Higher Education Monitor
System “WO” which contains
questionnaires about employment
and average starting salaries to
national higher education students.
The indicators provide the managers
with valuable information of student’s
after-university life but the
measurement of employer feedback
is not practical due to difficulties in
information collection.
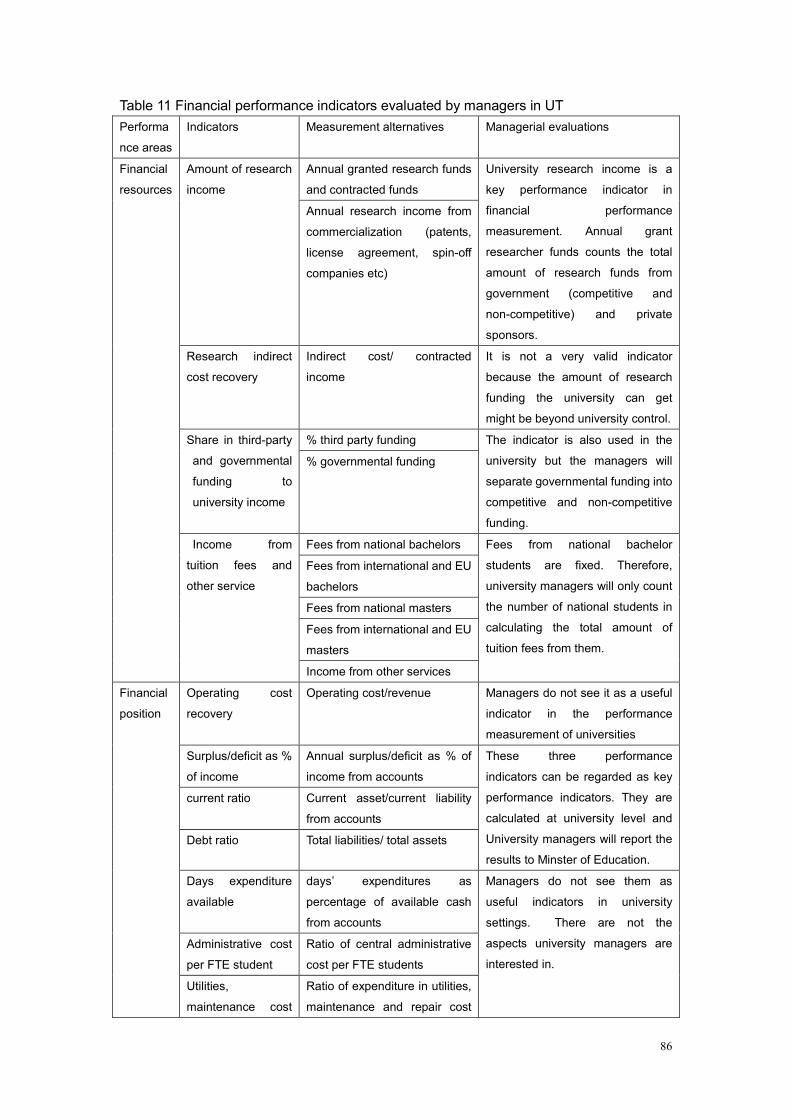
86
Table 11 Financial performance indicators evaluated by managers in UT
Performa
nce areas
Indicators Measurement alternatives Managerial evaluations
Annual granted research funds
and contracted funds
Amount of research
income
Annual research income from
commercialization (patents,
license agreement, spin-off
companies etc)
University research income is a
key performance indicator in
financial performance
measurement. Annual grant
researcher funds counts the total
amount of research funds from
government (competitive and
non-competitive) and private
sponsors.
Research indirect
cost recovery
Indirect cost/ contracted
income
It is not a very valid indicator
because the amount of research
funding the university can get
might be beyond university control.
% third party funding Share in third-party
and governmental
funding to
university income
% governmental funding
The indicator is also used in the
university but the managers will
separate governmental funding into
competitive and non-competitive
funding.
Fees from national bachelors
Fees from international and EU
bachelors
Fees from national masters
Fees from international and EU
masters
Financial
resources
Income from
tuition fees and
other service
Income from other services
Fees from national bachelor
students are fixed. Therefore,
university managers will only count
the number of national students in
calculating the total amount of
tuition fees from them.
Operating cost
recovery
Operating cost/revenue Managers do not see it as a useful
indicator in the performance
measurement of universities
Surplus/deficit as %
of income
Annual surplus/deficit as % of
income from accounts
current ratio Current asset/current liability
from accounts
Debt ratio Total liabilities/ total assets
These three performance
indicators can be regarded as key
performance indicators. They are
calculated at university level and
University managers will report the
results to Minster of Education.
Days expenditure
available
days’ expenditures as
percentage of available cash
from accounts
Administrative cost
per FTE student
Ratio of central administrative
cost per FTE students
Financial
position
Utilities,
maintenance cost
Ratio of expenditure in utilities,
maintenance and repair cost
Managers do not see them as
useful indicators in university
settings. There are not the
aspects university managers are
interested in.

87
per FTE student per FTE student
Expenditure on
computer service,
library and sports
facilities per FTE
student
Ratio of expenditure on
computer service, library, and
sports facilities per FTE
student
Manager’s
satisfaction with
financial strategies
Manager evaluation by
self-assessment
With regard to the indicator of
manager’s satisfaction with
financial strategies, managers
might see this as a helpful financial
indicator in the future but current
financial management is relatively
old-fashioned in the university. The
way to evaluate effectiveness of
financial strategies is abased on
the evaluation of university
financial performance which
requires the change in current
governmental mechanism. It might
be taken place in the future in
manager’s opinions but the
progress of governmental
procedure is slow.

88
Table 12 Human resources indicator evaluated by UT managers
Performance
areas
Indicators Measurement alternatives Managerial evaluations
Success rate in
recruitment
% of full time recruitment The Managers do not see it as
an important indicator in human
resource. Recruitments do not
take place every year.
% of English speaking
employees
The number of PhD students
The number of Professors,
The number of assistant
professors with or without PhD
The number of lecturers
Staff skills and
staff diversity
The number of supportive staff
Employee’s English-speaking
capability is measured by
English tests such as TOFEL
and IELTS in the university. The
managers see the ratio of
academic staff to non-academic
staff (supportive staff) as a key
performance indicator in human
resource.
Human
Capital
Employee’s age
distribution
% of employee in age span e.g.
30-40 or over 60
The indicator is used in annual
social report in the university as
a measure of employee’s age
distribution
Expenditures on
training and
development
Annual expenditure on training
and development
Managers in the university do
not measure expenditures on
training and development
separately. They are measured
by average expenditure per FTE
the university has spent on
salaries, desks, computers etc.
% of employee satisfied with
welfare, promotion and pension
HR policies
and
practices on
Job
performance
Employee
motivation or
satisfaction Employee turnover and sick
leave
Employee’s satisfaction is
evaluated at every two or three
years by an external institution.