Embed Size (px)
Citation preview

Running head: CONVERGENT EVIDENCE SCALING 1
Please use the following citation when referencing this work:
McGill, R. J., & Busse, R. T. (2014). An evaluation of multiple single-case outcome indicators using convergent evidence scaling. Contemporary School Psychology, 18, 13-23. doi: 10.1007/s40688-013-0004-4
The final publication is available at Springer via http://dx.doi.org/10.1007/s40688-013-0004-4.
An Evaluation of Multiple Single-Case Outcome Indicators Using Convergent Evidence
Scaling
Ryan J. McGill
R. T. Busse
Chapman University

CONVERGENT EVIDENCE SCALING 2
Abstract
The purpose of this article is to evaluate the consistency of five single-case outcome
indicators, used to assess response-to-intervention data from a pilot Tier 2 reading intervention
that was implemented at an elementary school. Using convergent evidence scaling, the indicators
were converted onto a common interpretive scale for each case (N = 5). None of the quantitative
effect size measures converged with summary visual inspection ratings. Lack of convergence
was also observed between parametric and non-parametric effect size estimates. Within this
study, indicator selection had a significant impact on individual treatment evaluations.
Implications for professional practice and program evaluation are discussed.
Keywords: single-case, evaluation, effect sizes, outcomes

CONVERGENT EVIDENCE SCALING 3
An Evaluation of Multiple Single-Case Outcome Indicators Using Convergent Evidence
Scaling
A major function of school psychologists is to utilize data to make important educational
decisions within school systems. Historically, most of this work has been focused on utilizing
assessment within problem identification and traditional classification models. However, since
the re-authorization of the Individuals with Disabilities Education Act in 2004, many school
districts have implemented multi-tiered intervention systems (e.g., response to intervention or
RTI) which utilize low inference assessment technologies, such as curriculum-based
measurement (CBM) probes, to assess student response to instruction. Accordingly, school
psychologists have been tasked with using their assessment and consultation skills to help
intervention teams evaluate treatment outcomes for individual students.
School-based data teams often utilize single-case design (SCD) technologies to analyze
the results of progress monitoring data to make distinctions between those students who are
benefiting from interventions and those who are in need of more intensive and/or alternative
means of psychoeducational support. For the better part of the last decade, much of the school
psychology literature has focused on implementation issues related to academic intervention
systems (Fuchs & Deshler, 2007). Only recently have scholars shifted their attention toward
investigating the adequacy of guidelines for what constitutes best practice when evaluating the
outcomes of prescribed interventions via SCD. As a result, questions have been raised about
common methods for evaluating the SCD data that often is obtained within educational settings
(e.g., conventional RTI graphs).
Although there are several methods for analyzing these data, the techniques generally can
be characterized as idiographic or quantitative in nature. A commonly utilized quantitative
CONVERGENT EVIDENCE SCALING 4
method is the calculation of a line of best fit using baseline and intervention data. Lines of best
fit or “trend lines” forecast expected performance on the dependent variable or outcome measure
based upon observed scores. If there is significant improvement in the slope or trajectory from
baseline then the intervention is deemed to have been effective. Trend lines are commonly
calculated using regression via the ordinary least squares (OLS) method. Unfortunately, many
questions remain about what measurement conditions are needed to calculate a reliable line of
best fit utilizing OLS with progress monitoring data. Researchers have shown that the reliability
of OLS trend lines for oral reading fluency probes (CBM-R) can be significantly impacted by a
number of factors, including passage variability, setting variance, and the psychometric
properties of the probe set (Hintze & Christ, 2004). In some cases, the error term may be
substantial enough to call into question observed treatment gains. Furthermore, consensus as to
how many data points are needed to calculate a robust trend line have yet to be established. For
years, a conventional guideline (e.g., Brown-Chidsey & Steege, 2010) has been that treatment
decisions can be made after the collection of 6 to 10 CBM probes, however recent investigations
call into question such recommendations. Christ and Coolong-Chaffin (2007) estimated that the
average standard error of measurement (SEM) for CBM-R under optimum testing conditions was
approximately 5 to 9 words read correctly per minute (WRCM). These SEM estimates
correspond to 95% confidence band ranges of plus or minus 9.8 to 17.64 WRCM. It should be
noted that reliability is improved incrementally with longer durations of progress monitoring,
specifically 14 or more data points (Christ, Zopluoglu, Long, & Monaghen, 2012). The overall
lack of stability of such methods makes it very difficult for stakeholders to determine whether
students have met prescribed school or normative benchmarks when conducting brief analyses of
single-case data.
CONVERGENT EVIDENCE SCALING 5
The most common idiographic methods of analysis are visual inspection and the
calculation of goal lines. In the goal line approach, a line can be drawn from the median of the
baseline data using established normative rates of expected weekly improvement (e.g.,
Hasbrouck & Tindal, 2006). Performance on subsequent progress monitoring probes is then
referenced to the goal line to determine if the student is progressing as expected. If a series of
successive data points fall below the goal line, changes to the intervention should be considered.
Despite the availability of several popular normative and goal setting rubrics, consensus on how
much growth one should expect an individual student to make at a specific grade level remains
elusive, so much so that Shinn (2007) called for the development of local norms due to
significant variation in student performance from school to school. Global norms also fail to
reflect recent changes in the assessment of local curriculum practices that are the byproduct of
federal reading intervention programs such as Reading First. As a result of these programs,
schools have focused almost exclusively on the development of reading fluency, which has led to
rapid increases in grade-level fluency rates over the last decade, quickly rendering grade-level
benchmark estimates on standardized assessments obsolete (Mathson, Solic, & Allington, 2006).
Thus, practitioners who are utilizing out of date norms may be vulnerable to Type II errors (false
negatives) when evaluating student academic progress.
Visual inspection requires the evaluation of a single-case graph for trend, variability,
mean shifts, and immediacy of intervention effects to make a subjective decision as to whether
the intervention had the desired impact on student performance. Although the use of visual
inspection has been well established in allied disciplines such as precision teaching and applied
behavior analysis, the subjective nature of such evaluations casts doubt as to whether it should
be utilized alone as a method to make important treatment decisions (Riley-Tillman & Burns,

CONVERGENT EVIDENCE SCALING 6
2009). In a meta-analysis of 14 quantitative studies, Ottenbacher (1993) found that multiple
raters using the same visual inspection methods to evaluate a common dataset disagreed almost
half of the time. Interestingly, the disagreement rate remained consistent regardless of whether
raters received training prior to their evaluations or whether graphs included trend lines.
The argument for more robust methods of estimating single-case intervention effects has
been debated within the scientific literature for decades, resulting in the development of several
parametric and non-parametric single-case effect sizes. Whereas the appeal of relying on
statistical reasoning alone is seductive, virtually all single-case effect sizes demonstrate some
form of methodological shortcoming which impacts the reliability researchers and practitioners
can assign to interpretations of such statistics (Kratochwill et al., 2010; Riley-Tillman & Burns,
2009; Shadish, Rindskopf, & Hedges, 2008;). Furthermore, significant questions have been
raised about the reliability and validity of utilizing these methods in isolation to evaluate
intervention effects (Brossart, Parker, Olson, & Mahadevan, 2006).
Professionals are implored through best practice texts (Shapiro, 2010), and regulatory
statutes (McBride, Dumont, & Willis, 2011) to consider multiple pieces of evidence when
making diagnostic decisions. However practitioners often approach treatment outcome
evaluations (e.g., evaluation of RTI graphs) in an unsystematic manner, with an overreliance on
subjective decision making techniques such as teacher report of outcomes and/or visual
inspection. Several decades ago, practitioners had limited options for assessing SCD outcomes
via quantitative measures (e.g., effect size estimates), now there are multiple methods that have
been proposed in the literature for estimating SCD effects. As a result, practitioners have been
encouraged to utilize these methods to supplement visual analysis when evaluating single-case
intervention outcomes (Gast, 2009).
CONVERGENT EVIDENCE SCALING 7
Despite the increase in the number of indicators that are now available for school
psychologists to utilize when appraising SCD data, questions have been raised about the stability
of multiple indicators when applied to the same data set. In a simulation study conducted by
Parker, Vannest, and Davis (2011), significant discrepancies were observed between several
quantitative indicators, indicating that the choice of a particular effect size estimate by a
practitioner may have a substantial impact on the outcome of a treatment evaluation. As an
example, the choice to utilize an overlap statistic by a school psychologist to evaluate SCD
intervention data may indicate that a treatment was ineffective whereas the use of a mean
difference effect size on the same dataset may indicate that the treatment was effective. Although
such discrepancies have been demonstrated in simulation studies, Brossart and colleagues (2006)
warn that little is known about the stability of indicators when utilized to assess data obtained
from clinical settings.
The purpose of this investigation was to assess the stability of multiple single-case
indicators, when applied to progress monitoring data obtained from five children who were
selected to participate in a pilot Tier 2 reading intervention at an elementary school. Several
commonly utilized quantitative measures were relied upon to supplement visual analysis and
assessments of generalization/social validity by stakeholders. The goal of the current study was
to examine relationships between outcome indicators, and the relative efficacy of various
methods for evaluating school-based intervention outcomes.
Because each indicator has its own set of interpretive guidelines, it is necessary to
convert all of the measures onto a common interpretive scale, similar to a traditional meta-
analysis. Using the logic of goal attainment scaling, Busse, Elliott, and Kratochwill, (2010)

CONVERGENT EVIDENCE SCALING 8
proposed a method for synthesizing multiple single-case indicators into a common framework to
evaluate intervention outcomes, which they dubbed Convergent Evidence Scaling (CES).
Briefly, goal attainment scaling is a rating method that utilizes a criterion-referenced approach to
evaluate treatment outcomes within clinical settings. Although CES was originally developed
for evaluating school consultation outcomes, McGill and Busse (2011) successfully utilized it as
a meta-analytic tool for evaluating the efficacy of single-case interventions for treating autism. It
is believed that CES is a viable tool for synthesizing multiple single-case outcome measures.
CES requires that effects be operationally defined using a numerical 5 point scale that
ranges from -2 to +2 utilizing the conventional interpretation guidelines proposed for each
measure. The results from each indicator can then be converted into a CES rating, which is then
averaged to form an overall CES value to summarize treatment effects. Potential assessment
indicators can include any number of parametric and non-parametric measures. CES may be
particularly useful for quantifying assessments of generalization/social validity, which are rarely
reported in school-based intervention research (Gresham & Lopez, 1996).
Despite its intuitive appeal, clinical applications of CES are needed to validate the
method. Although the purpose of this article is to investigate whether variability among
treatment outcome indicators renders reliance on one source of data untenable for making
treatment decisions, a secondary purpose is to present the results of a study utilizing CES in an
applied educational setting. This study is one of the first to assess single-case academic
intervention data with multiple effect sizes that also includes estimates of generalization effects.
Due to the variability across single-case outcome indicators that has been demonstrated in
simulation studies, we hypothesized that similar variability would be demonstrated across the
measures included in this study.

CONVERGENT EVIDENCE SCALING 9
Method
Participants
Five students, ages 9 to 11, were assessed using the CES framework from a pilot Tier 2
reading intervention model that was implemented by the lead author, who was assigned as the
site school psychologist at the elementary school that served as the project site. Demographic
characteristics for the intervention group are listed in Table 1. The students were identified as
intervention candidates by the principal and school psychologist from the results of universal
screening data, utilizing standardized measures of reading fluency from the DIBELS assessment
system (Good & Kaminski, 2002). To qualify for a reading intervention, students had to score
within the bottom 10% of their grade level on the reading fluency screening measure. The
students were assembled into an upper elementary (4th through 6th grade) intervention group (N =
5). The group met twice per week for hour-long sessions, which were led by the school reading
coach who utilized the Language! (Greene, 2005) curriculum, along with supplemental
phonemic awareness exercises from the Sounds and Letters for Readers and Spellers (Greene,
1997) program. Although the intervention component is not the primary focus of this article, it is
worth noting that interventions materials were selected to help support growth in the core areas
identified by the national reading panel (i.e., phonemic awareness, alphabetic principal, fluency,
vocabulary, comprehension; National Institute of Child Health and Human Development, 2000).
Written parental consent was obtained for each student by the school principal.
Prior to the implementation of the intervention, each student was administered 3 grade
level DIBELS oral reading fluency (ORF) benchmark probes over successive days to establish
baseline reading levels. Once the intervention sessions commenced, DIBELS ORF progress

CONVERGENT EVIDENCE SCALING 10
monitoring probes were administered on a weekly basis. The utility of CBM for this purpose is
well established within the scientific literature (Deno, Fuchs, Marston, & Shin, 2001). All of the
probes were administered and scored by the school psychologist who had received advanced
training in the administration and interpretation of CBM in addition to being a certified DIBELS
mentor. Weekly treatment fidelity checks were conducted by the school psychologist to ensure
intervention integrity and student attendance. Fidelity was operationally defined as the correct
use of the prescribed intervention materials as well as attendance by all group members. All of
the students were in attendance and the appropriate intervention curriculum was utilized during
all six of the integrity checks. It is important to note that although the data obtained from this
study came from the intervention described above, the primary purpose of this study is to
evaluate the stability of various single-case outcome measures and not to make inferences
regarding the relative effectiveness of academic RTI or specific Tier 2 interventions. The
intervention team, comprised of the school psychologist, principal, reading coach, resource
specialist, and grade-level teacher, met after six weeks of intervention sessions to assess each
student’s progress.
The school psychologist compiled the assessment data, created single-case graphs, and
calculated effect sizes for each case, to be analyzed by the intervention team during the team
meeting. Prior to the team meeting, the school psychologist conducted a brief training for team
members on how to evaluate single-case data through visual inspection. The didactic training
focused on taking into account data variability, mean shifts, immediacy of effect, and
demonstration of experimental control when appraising visual data.
The single-case graphs that were presented to the intervention team are displayed in
Figure 1. Each case utilized an AB design with three data points in each baseline phase. Each

CONVERGENT EVIDENCE SCALING 11
intervention phase lasted six weeks with corresponding data points for each week of progress
monitoring. Although we stipulate that the design and amount of data compiled for evaluation
are considered weak according to contemporary single-case research standards (e.g., Kratochwill
et al., 2012), we believe that the analysis of these designs is still beneficial as they represent the
level of data that often are obtained by practitioners (Kratochwill et al., 2010). The school
psychologist was responsible for compiling and assembling all progress monitoring data for each
student into a computer database.
Outcome Indicators and Data Analysis
Five outcome indicators were selected for inclusion in this study. Indicators were
selected to provide a multi-component assessment of intervention effects. Quantitative effect
sizes (e.g., no assumptions effect size, overlap indices) were selected on the basis of their
popularity within the single-case literature and the ease with which they can be calculated by
practitioners. Although potentially more robust, several SCD effect size statistics (e.g., Phi
coefficient, Allison-MT) were not included in this analysis because it is our opinion that the
technical sophistication required to calculate these measures diminishes their potential utility in
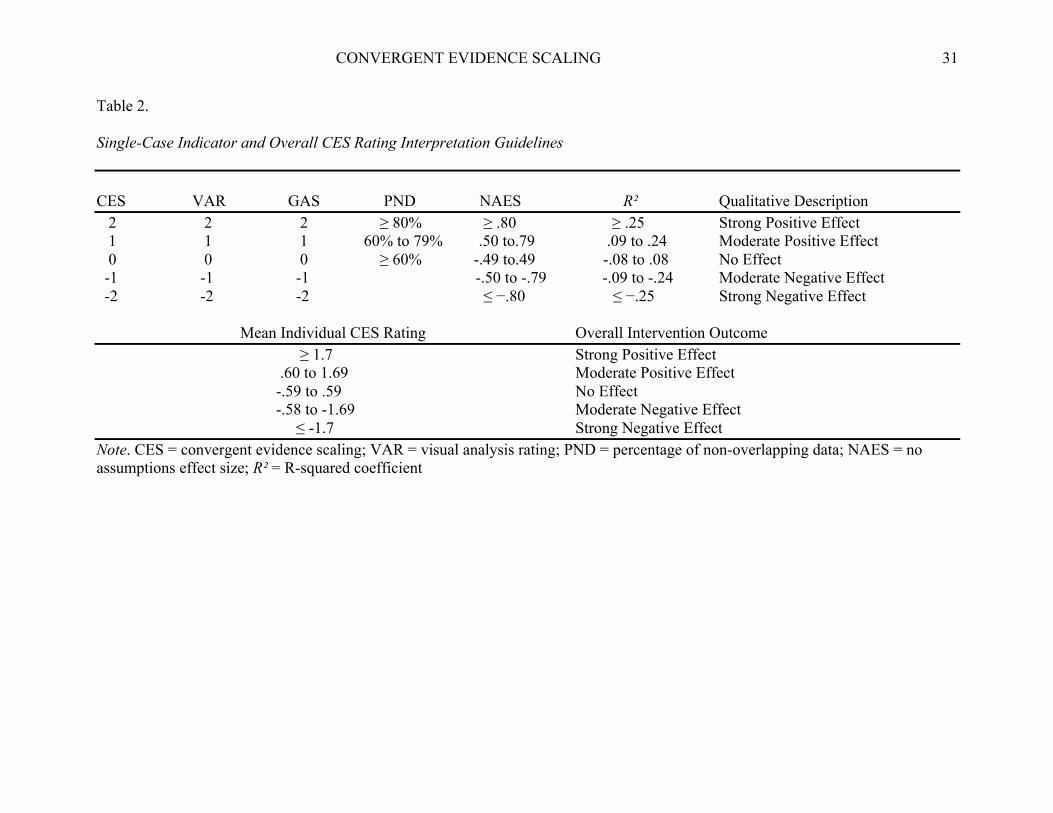
clinical practice. The indicators were then converted to a CES value that corresponded to
conventional interpretation guidelines (e.g., Cohen, 1988). The CES values were then averaged
to create an overall mean CES rating (similar to a meta-analysis) and interpreted using a criterion
framework. Indicator conversion weights as well as overall CES outcome interpretive guidelines
are provided in Table 2. An integrity check conducted by the lead author on the CBM database,
and all the effect size calculations resulted in 100% agreement.
Visual Analysis Ratings. As previously discussed, visual inspection is a prominent
method of analysis used within applied behavior analysis and consists of subjective inspection of
CONVERGENT EVIDENCE SCALING 12
visually presented data to answer the question of whether intervention data indicate that an
intervention was effective. For this study, Visual Analysis Ratings (VAR; Busse & Kennedy;
2011) were adapted for CES to evaluate treatment outcomes. Members of the intervention team,
who were trained in visual inspection, were presented with graphed data for each student and
asked to rate progress according to the following guidelines: Great improvement (+2); moderate
improvement (+1); little to no improvement (0); moderate regression (-1); significant regression
(-2). Individual team member ratings were then averaged for each case. To eliminate the
potential for ocular bias, all of the graphs were fitted with the same ordinate axis. The graphs
also included least squares trend lines for both the baseline and intervention phases. The
strengths of VAR are that it is a relatively simple method, and it may be useful with limited data
points. The limitations are that it may be less robust at discriminating small effects and its
reliability and validity have not been established within the technical literature.
Goal Attainment Scaling. Goal attainment scaling (GAS; Kiresuk & Sherman, 1968) was
originally developed to assess mental health outcomes, however it can be used within a school
based single-case framework as a convenient method for assessing potential generalization of the
performance area addressed by an intervention. A GAS rating was completed by the general
education teacher for each student as a summary rating of how effective the intervention was at
improving classroom reading performance. When administered in such a manner, GAS ratings
can also be utilized to assess potential generalization effects to other settings (e.g., from the
therapy room to the student’s classroom). The following guidelines were utilized for this study:
Large positive impact on classroom reading performance (2); Moderate positive impact on
classroom reading performance (1); Little to no impact on classroom reading performance (0);
Classroom reading performance is somewhat worse (-1); Classroom reading performance is

CONVERGENT EVIDENCE SCALING 13
significantly worse (-2).
The strengths of the GAS method are that it: a) Is time efficient; b) can be used
individually or for groups; c) can be used as a self-monitoring tool; d) can be used to repeatedly
monitor progress; e) is easy to graph and interpret; and f) can be used across settings and sources.
The limitations of GAS are that ratings are summary observations, and that subjectivity may be
involved in deciding the level of goal attainment.
Percentage of Nonoverlapping Data. Percentage of nonoverlapping data (PND; Scruggs,
Mastropieri, & Casto, 1987) is one of the easiest single-case analytic methods to compute and it
is often presented in empirical educational intervention studies (see Bellini, Peters, Benner, &
Hopf, 2007). Whereas there are several variations of PND, the most parsimonious method is to
divide the total number of treatment data points that do not overlap with the highest (or lowest if
decreasing behavior) baseline data point by the total number of treatment points, and then
multiplying the product by 100. The resulting percentage is interpreted as an effect size. PNDs
greater than or equal to 80 are indicative of a strong effect, 60 to 79 is a moderate effect, and
PNDs below 60 indicate no effect. The strengths of PND are that it is simple to compute, and it
is unaffected by nonlinearity and heterogeneity. The limitations are that it is potentially
oversensitive to atypical baseline data, it is adversely affected by trends, and that it ignores all
baseline data except for a single data point. PND conversions to corresponding CES values are
also restricted due to the fact that it is not possible to have a negative PND. Thus, the lowest
CES value assignable is a score of 0 (for PND values less than or equal to 60). Although some
researchers have questioned the use of PND as an effect size measure (e.g., Parker & Vannest,
2009), it remains one of the most popular overlap indices reported in the empirical literature
(Parker, Vannest, & Davis, 2011).
CONVERGENT EVIDENCE SCALING 14
It should be noted that there are several variations of overlap indices that have been
developed since PND, all with their own individual strengths and weaknesses. The most
promising appears to be percentage of all non-overlapping data (PAND; Parker, Hagan-Burke, &
Vannest, 2007). PAND is an improvement over PND because accounts for all data points, and it
can be converted into a traditional Cohen’s d effect size using the phi coefficient, and is
associated with a known sample distribution thereby allowing for the calculation of confidence
intervals. However, PAND requires at least 20 data points and thus could not be utilized with
the current data set.
Mean Difference Effect Size. The no-assumptions effect size (NAES; Busk & Serlin,
1992) was used to evaluate mean phase differences in this study. The NAES operates much like
a traditional effect size (e.g., Cohen’s d) for single-case designs. The effect size is calculated by
subtracting the baseline mean from the treatment mean and dividing by the standard deviation of
the baseline data, with no assumptions made about the homogeneity of the phase variances. The
strengths of the NAES method are that it provides a means for quantifying single-case outcomes,
and the effect size can be interpreted much like a z score. The limitations are that the effect size
estimates do not account for trend or autocorrelation and the phase means may be affected by
outliers. Cohen (1988) recommended that practitioners interpret effect sizes of .80 as “large,”
.50 as “moderate,” and .20 and below as “small.” Although these guidelines were developed for
between-group analysis, they are commonly utilized in single-case research designs.
R². The R² statistic differs from the other outcome indicators in this study because it relies
on regression. R² often is utilized as a measure to establish concurrent validity of newly
developed single-case effect size measures. When applied to single-case designs, R² can be
interpreted as the proportion of the score obtained on an outcome measure that is attributable to
CONVERGENT EVIDENCE SCALING 15
the phase change or treatment delivery (Parker et al., 2007). An R² effect size can be interpreted
using Cohen’s (1988) guidelines of .25 as “large,” .09 as “moderate,” and .01 as “small.” The
strengths of the R² statistic are that is it relatively easy to calculate using conventional computer
programs, it utilizes all data points from both phases, and it allows for the calculation of
confidence intervals. Notable limitations are that the assumptions for parametric analysis are
rarely met in single-case designs and that R² can be influenced by outlying scores in the baseline
and treatment phases.
Ipsative Analysis. Ipsative analysis, or the creation of difference scores, provides a
potentially useful method for evaluating the degree to which individual measures vary from a
derived global score (Davis, 1959). For the purposes of the current study, ipsative analysis was
utilized to assess the variability of individual indicators from estimated treatment effect summary
ratings. Higher difference scores indicate greater variability from the mean of all indicators for a
particular data set. To calculate ipsative values for each individual outcome measure, the
difference between CES conversion ratings and the overall CES mean for each individual case
were averaged for each outcome indicator. For our purposes, the direction of the discrepancy
was not important, thus all ipsative difference scores, or i values, were transformed into positive
values. For example, a difference score of -.5 was converted to .5). The corresponding i values
can be interpreted as CES units.
Results
Effect sizes and corresponding CES conversions for the five intervention cases can be
found in Table 3. The table is organized by case and provides a summary of the various outcome
indicators for each student. CES conversions are listed in parenthesis next to each outcome
measure statistic. At the bottom of the table the mean or grand CES is provided, along with the
CONVERGENT EVIDENCE SCALING 16
corresponding qualitative description of the CES outcome.
Individual Outcome Indicator Results
VAR. VAR was the most liberal indicator as all cases received positive ratings from the
intervention team. VAR ratings were clustered with a range of 1 to 2, indicating that the
members of the intervention team generally rated the graphic displays of cases as demonstrating
moderate to strong treatment effects. The mean VAR rating (M = 1.8; CES = 1) can be
interpreted as indicating a moderate, positive effect across cases.
GAS. Variability among the generalization ratings from teachers was more pronounced.
The GAS scores spanned the entire evaluation range from -2 to +2, indicating that the teachers
rated the reading intervention as having inconsistent impact across cases. The mean GAS rating
(M = .4, CES = 0) reflects no discernible treatment effect overall. Interestingly, for one of the
cases (Oscar), the teacher rated the generalization effects of the intervention negatively whereas
all of the remaining outcome indicators were relatively positive. Overall, GAS ratings indicated
that positive generalization effects were observed in the classroom setting in 60% of the cases.
PND. PND values ranged from 17% to 50%, all falling below conventional guidelines
for demonstrating minimal positive effects. The low PND values are buttressed by the
significant variability that was observed across the baseline phases for all of the cases. The
overall mean PND of 36.6% (CES = 0) reflects no discernible treatment effect for the group as a
whole. PND was the most conservative estimator of effect with all cases falling within the
lowest CES interpretive criterion.
Mean Difference Effect Size. Traditional mean-difference effect sizes demonstrated the
most variability and largest magnitude of all of the outcome indicators, with values ranging from
-4.21 to 2.45. Significant positive effects were found for 60% of the cases. Interpretation of
CONVERGENT EVIDENCE SCALING 17
these values is difficult given that they reflect positive and negative outcomes that exceed almost
2.5 standard deviations, although such results often are obtained in single-case research (Burns &
Wagner, 2008). The mean NAES across cases (M = .05, CES = 0) indicated no significant
treatment effects for the intervention group as a whole.
R². Regression-based effect sizes ranged from .001 to .49, indicating outcomes that
varied from no discernible effect to a strong, positive effect. The mean R² value of .23 (CES = 1)
across cases is interpreted as evidence of a moderate, positive effect. Large positive effects were
calculated for 60% of the cases. However, the corresponding 95% confidence intervals were
large enough to call into question any discernible intervention effects demonstrated through the
R² statistic. Of the 3 cases for which strong R² effects were obtained, only the tail end of
Robert’s 95% CI (.19 - .77) continued to fall within the moderate to strong effect range using
Cohen’s (1988) interpretive guidelines.
Group Analysis
Although not traditionally the focus of single-case research designs, CES provides a
potential vehicle for evaluating the efficacy of group interventions by synthesizing single-case
data across cases. To evaluate the effectiveness of the Tier 2 reading intervention as a whole,
individual CES ratings were pooled and then averaged to create a grand CES aggregate score for
each case. The aggregate score for each case was then averaged to create a pooled grand CES
for the entire group. This process resulted in a pooled grand CES of .84, indicating that the
group as a whole demonstrated moderate, positive effects across indicators. Individual grand
CES values ranged from -.6 to 1.6. Utilizing the CES outcome framework, positive treatment
effects were demonstrated in 80% of the cases. One case (Eliam) resulted in no progress from
baseline observations across indicators.
CONVERGENT EVIDENCE SCALING 18
Idiographic Variation across Measures
Ipsative score values (i) for each outcome indicator are found in Table 4. Significant
variability across measures was evident via ipsative analysis. The average variability within
each case was almost an entire CES classification (Mean i = .92). Among the individual
measures, R² demonstrated the least amount of variance from the overall grand CES (i = .68) and
GAS and PND demonstrated the greatest variability across cases (i = 1.08). For each individual
case, reliance on any one of the outcome measures to evaluate treatment effects may have
resulted in an entirely different evaluative outcome. It is intriguing to note that there seemed to
be an inverse relationship between treatment outcomes and within-case variability. Danielle
demonstrated the largest grand CES value within the group and, consequentially, had the lowest
ipsative score of the group (i = .64). Robert had the second largest grand CES value of the
group, and had the second lowest ipsative score (i = .72). Conversely, Eliam had the smallest
grand CES value within the group and presented with the second largest idiographic variability
across measures (i = 1.08).
Discussion
As a result of the implementation of many multi-tiered support systems (e.g., RTI) across
the country, the use of single-case methods to assess intervention data is ubiquitous within the
field of school psychology (Neef, 2009). Despite their widespread use, consensus has yet to be
reached as to which interpretative strategies are best for evaluating SCD data (Kratochwill et al.,
2010). Popular techniques such as trend line analysis and visual inspection may be inadequate
for individual decision-making (Riley-Tillman & Burns, 2009). A number of quantitative effect
size measures for use with single-case data have been developed over the past two decades in an
effort to supplement existing interpretation strategies (e.g., visual inspection). Unfortunately,

CONVERGENT EVIDENCE SCALING 19
significant differences have been observed when calculating multiple single-case effect sizes for
the same dataset in simulation studies (e.g., Parker, Vannest, & Davis, 2011). As a result,
practitioners have a difficult choice to make when selecting an outcome indicator when
evaluating their single-case data. In an effort to provide additional information to practitioners
regarding the efficacy of various single-case effect size measures, this study was designed to
examine whether variability was demonstrated across several indicators used to evaluate clinical
outcomes. Parametric and non-parametric outcome indicators were assessed utilizing a common
qualitative framework (CES).
In this study, significant variability was observed when multiple outcome indicators were
utilized to assess conventional RTI graphs. Whereas summary visual analysis ratings indicated
that individual students demonstrated moderate to large increases in reading performance, PND
statistics for the same graphs were not as robust. Other quantitative and qualitative indicators
(e.g., GAS, R², NAES) were mixed, with some interpretations indicating positive effects and
others indicating negative performance outcomes. The results of this study indicate that a
practitioner’s choice of an outcome indicator for evaluating single-case data may impact the
result of a treatment evaluation. As an example, reliance on visual inspection, with the present
dataset, resulted in a positive treatment evaluation across cases whereas the use of the PND
statistic resulted in negative appraisals for the very same cases. Selection of any one of the
remaining indicators resulted in a portion of the cases reflecting positive treatment effects.
Across all of the cases VAR was somewhat inflated, as evidenced in the case of Oscar
where the intervention team estimated large positive effects through VAR (2), yet PND (37%)
and GAS (-1) ratings indicated otherwise. Although it is intuitive to interpret such findings as
indicative of the subjective nature of visual analysis, we caution against such an interpretation

CONVERGENT EVIDENCE SCALING 20
and believe that the VAR results are better explained by poor carryover of visual inspection
training by members of the problem solving team to live data analysis situations. Visual
inspection of the graphs reveals overlap in baseline and intervention data across several cases
which masked any significant mean changes. In addition, there is evidence of trend overlap in
some of the cases, which calls into question the immediacy of the intervention effects. These
interpretive considerations did not appear to be taken into account by members of the
intervention team in their analyses. Indeed, when the authors independently rated the graphs, the
VAR outcomes were quite different, with 80% agreement obtained on ratings of 0 for the first 3
cases, and 1 for the 4th case. The authors disagreed on case 5 (Robert) with ratings of 0 and 1 (all
of which are significantly different than the intervention teams’ ratings). It is also hypothesized
that the inclusion of trend lines in the intervention phase may have contributed to the positive
bias that was observed in the summary ratings.
As noted previously, the magnitude of NAES effects were quite large in both directions,
to the point of being uninterruptable using conventional guidelines. This finding is consistent
with other applied research (e.g., Chenier et al., 2012) in which similarly inflated estimates of
effect were obtained utilizing mean difference methods. As Burns and Wagner (2008) noted,
these results indicate that the guidelines commonly utilized within the field for evaluating NAES
effect sizes may need revision to be more useful.
It is also worth noting that the reliability of the R² statistic was limited, as evidenced by
large confidence intervals across cases. This finding is most likely the product of both a
relatively small amount of data per case and significant variability within the cases themselves.
If the R² statistic is utilized with a small data set, practitioners are encouraged to calculate
confidence intervals and limit their interpretations and/or to weigh the statistic accordingly.

CONVERGENT EVIDENCE SCALING 21
Ultimately, the results of this study raise more questions than answers with respect to
appraising single-case intervention data. All of the quantitative indicators failed to sufficiently
converge with visual inspection ratings. Furthermore, non-parametric measures, such as PND,
failed to converge with the parametric effect sizes estimates. On the basis of these results, our
hypothesis that significant variability would be observed across multiple single-case outcome
indicators was retained.
The publishing of technical guidelines for interpreting single-case studies by the federal
Institute of Educational Sciences (IES) has reinvigorated the single-case effect size debate within
the scientific community. Even with the development of several new single-case effect size
measures, the IES has yet to endorse a specific statistical method for evaluating intervention
effects. Recent efforts to develop a more robust single-case effect size have done little to stem
the controversy of utilizing such measures in single-case research. In fact, the authors of
contemporary single-case texts (e.g., Johnston & Pennypacker, 2009; Kennedy, 2005) have
continued to argue that statistical analysis is antithetical to the spirit of SCD. Although such
controversy is unlikely to be settled in the near future, we believe that the results obtained in this
study are relevant to practitioners and researchers who fall on either side of this vigorous debate.
Limitations and Future Directions
This study is of course not without limitations. Most notably, our findings are based on
only five cases with three baseline data points. Although cases such as these that have limited
data points may be representative of typical school-based practice, the cases lacked strong
experimental control and may not generalize beyond this study. With regard to sample size, a
conventional guideline (e.g., Barlow, Nock, & Hersen, 2008) is that 3 to 5 cases are sufficient for
establishing effects via SCD. Though the sample in the present study was adequate for the

CONVERGENT EVIDENCE SCALING 22
analytical strategies that were utilized, it is important to note that the logic of SCD poses
limitations for making inferences regarding population parameters.
It also should be noted that the homogenous demographics for the sample participants are
a reflection of local norms. Accordingly, additional research is needed to determine whether
similar variability is observed with multiple indicators across different populations and clinical
conditions (e.g., behavioral intervention data). Additionally, the potential effects (e.g., inflating
Type I error) of conducting multiple statistical tests with the same single-case dataset are in need
of additional investigation.
Experimental control was difficult to establish due to the presence of significant
variability in baseline data conditions, which may have impacted the reliability of statistical
inferences. Whereas we acknowledge the importance of baseline control and internal validity
within single-case research, establishing such control in practice may be difficult as there are
inherent ethical and social pressures to begin interventions as soon as individuals present with
significant academic (or behavioral) problems. Despite best practice recommendations in such
scenarios, extended baseline phases within academic intervention programs are rarely undertaken
outside of those that are established for research purposes. Consequently, we believe these data
are a more accurate representation of the types of cases which school-based intervention teams
are likely to face.
Finally, to include a variety of outcome indicators, such as NAES and R², it was
necessary to violate some of the assumptions of parametric analysis. Whereas we acknowledge
that the utilization of parametric statistical techniques with single-case data is controversial, the
impact of these practices is yet to be clearly understood (Huitema, 1988). Nevertheless, we

CONVERGENT EVIDENCE SCALING 23
believe that such cautions are worth noting and are buoyed by the recent development of a
variety of powerful non-parametric indicators from which practitioners can now select.
Implications for Practice
Despite these limitations, we believe that the results obtained in this study are relevant to
school-based practitioners. The results obtained in this study contribute to the growing literature
base on the efficacy of various single-case outcome indicators. Based upon the variability that
has been demonstrated in simulation studies and clinical applications, it is recommended that
practitioners cautiously incorporate statistical strategies for evaluating single-case data. Despite
the recommendation from Gast (2009) that practitioners should supplement visual inspection of
single-case data with statistical effect size estimates, empirical evidence for the incremental
validity provided by these procedures has yet to be provided. According to Parsonson and Baer
(1992), in single-case design “there is no single process called statistical analysis to provide the
putative standard or truth; there are many of them, which in their diversity often allow quite
different conclusions…thus, a supposedly objective, uniform process becomes instead a matter
of individual scientific judgment” (p. 21). As a result, we believe that a multi-component
evaluation utilizing assessments of generalization/social validity to supplement visual inspection
is sufficient for individual decision-making with single-case data.

CONVERGENT EVIDENCE SCALING 24
References
Barlow, D. H., Nock, M. K., & Hersen, M. (2008). Single-case experimental designs: Strategies for Studying behavior change. Boston, MA: Pearson. Bellini, S., Peters, J., Benner, L., & Hopf, A. (2007). A meta-analysis of school-based social skills interventions for children with autism spectrum disorders. Journal of Remedial and Special Education, 28, 153-162. doi: 10.1177/07419325070280030401 Brossart, D. F., Parker, R. I., Olson, E. A., & Mahadevan, L. (2006). The relationship between visual analysis and five statistical analyses in a simple AB single-case research design. Behavior Modification, 30, 531-563. doi: 10.1177/0145445503261167 Brown-Chidsey, R., & Steege, M. W. (2010). Response to intervention: Principles and strategies for effective practice (2nd ed.). New York: Guilford Press. Burns, M. K., & Wagner, D. (2008). Determining an effective intervention within a brief experimental analysis for reading: A meta-analytic review. School Psychology Review, 37, 126-136. Retrieved from http://www.nasponline.org Busk, P. L., & Serlin, R. C. (1992). Meta-analysis for single-case research. In T. R. Kratochwill
and J. R. Levin (Eds.), Single-case research design and analysis: New directions for psychology and education (pp. 187-212). Hillsdale, NJ: Erlbaum.
Busse, R. T., & Kennedy, K. (2011, April). Methods for assessing response to intervention. Workshop presented at the annual convention of the California School Psychologists Association, Costa Mesa, CA. Busse, R. T., Elliott, S. N., & Kratochwill, T. K. (2010). Convergent evidence scaling for multiple assessment indicators: Conceptual issues, application, and technical challenges. Journal of Applied School Psychology, 26, 149-161. doi: 10.1080/15377901003712728

CONVERGENT EVIDENCE SCALING 25
Chenier, J., Hunter, K., Fischer, A. J., Patty, E., O’Leary, K., York, H., Robichaux, N., Liu, J., Dressler, T., Hartman, K., & Gresham, F. (2012, February). Meta-analysis of social skills interventions using single subject design. Paper presented at the meeting of the National Association of School Psychologists, Philadelphia, PA. Christ, T. J., & Coolong-Chaffin, M. (2007). Interpretations of curriculum-based measurement outcomes: standard error and confidence intervals. School Psychology Forum, 1 (2), 75- 86. Retrieved from http://www.nasponline.org Christ, T. J., Zopluoglu, C., Long, J. D., & Monaghen, B. D. (2012). Curriculum-based measurement of oral reading: Quality of progress monitoring outcomes. Exceptional Children, 78, 356-373. Retrieved from http://www.cec.metapress.com Cohen, J. (1988). Statistical power analysis for the behavioral sciences (2nd ed.). Hillsdale, NJ: Erlbaum. Davis, F. B. (1959). Interpretation of differences among averages and individual test scores.
Journal of Educational Psychology, 50, 162-170. doi: 10.1037/h0044024 Deno, S. L., Fuchs, L. S., Marston, D., & Shin, J. (2001). Using curriculum-based measurement to establish growth standards for students with learning disabilities. School Psychology Review, 35, 85-98. Retrieved from http://www.nasponline.org Fuchs, D., & Deshler, D. D. (2007). What we need to know about responsiveness to intervention (and shouldn't be afraid to ask). Learning Disabilities Research & Practice, 22, 129-136. doi: 10.1111/j.1540-5826.2007.00237.x Gast, D. L. (2009). Single-subject research methodology in behavioral sciences. New York: Routledge. Good, R. H., & Kaminski, R. A. (Eds.). (2002). Dynamic Indicators of Basic Early Literacy

CONVERGENT EVIDENCE SCALING 26
Skills (6th ed.). Eugene, OR: Institute for the Development of Educational Achievement. Greene, J. F. (1997). Sounds and Letters for Readers and Spellers: Phonemic awareness drills for teachers and speech-language pathologists. Longmont, CO: Sopris-West. Greene, J. F. (2005). Language!. Dallas, TX. Voyager Learning. Gresham, F. M., & Lopez, M. F. (1996). Social validation: A unifying concept for school-based consultation research and practice. School Psychology Quarterly, 11, 204-227. doi: 10.1037/h0088930 Hasbrouk, J., & Tindal, G. A. (2006). Oral reading fluency norms: A valuable assessment tool for reading teachers. The Reading Teacher, 59, 636-644. doi: 10.1598/RT.59.7.3 Hintze, J. M., & Christ, T. J. (2004). An examination of variability as a function of passage variance in CBM progress monitoring. School Psychology Review, 33, 204-217. Retrieved from http:www.nasponline.org Huitema, B. E. (1988). Autocorrelation: 10 years of confusion. Behavioral Assessment, 10, 253- 294. Johnston, J. M., & Pennypacker, H. S. (2009). Strategies and tactics of behavioral research (3rd ed.). New York: Routledge. Kennedy, G. H. (2005). Single-case designs for educational research. Boston: Allyn & Bacon. Kiresuk, T. J., & Sherman, R. E. (1968). Goal attainment scaling: A general method for
evaluating community mental health programs. Community Mental Health Journal, 4, 443-453. doi:10.1007/BF01530764
Kratochwill, T. R., Hitchcock, J., Horner, R. H., Levin, J. R., Odom, S. L., Rindskopf, D. M., & Shadish, W. R. (2010). Single-case designs technical documentation. Retrieved from http://ies.ed.gov/ncee/wwc/pdf/wwc_scd.pdf

CONVERGENT EVIDENCE SCALING 27
Kratochwill, T. R., Hitchcock, J. H., Horner, R. H., Levin, J. R., Odom, S. L., Rindskopf, D. M., & Shadish, W. R. (2012). Single-case intervention research design standards. Remedial and Special Education, 34, 26-38. doi: 10.1177/0741932512452794 Mathson, D. V., Solic, K. L., & Allington, R. L. (2006). Hijacking fluency and instructionally informative assessment. In T. Rasinski, C. Blachowicz, & K. Lems (Eds.), Fluency instruction: Research-based best practices (pp. 109–116). New York: Guilford. McBride, G., Dumont, R., & Willis, J. O. (2010). Essentials for IDEA for assessment professionals. Hoboken, NJ: John Wiley. McGill, R. J., & Busse, R. T. (2011, February). A meta-analytic review of social stories research: Examining interventions for decreasing problem behavior. Paper session presented at the annual meeting of the National Association of School Psychologists. San Francisco, CA. National Institute of Child Health and Human Development. (2000). Report of the National Reading Panel. Teaching children to read: An evidence-based assessment of the scientific research literature on reading and its implications for reading instruction. Washington, DC: U.S. Government Printing Office. Neef, N. A.(2009). Advances in single-subject designs. In T. B. Gutkin & C. R. Reynolds (Eds.), The handbook of school psychology (4th ed., pp. 54-64). Hoboken, NJ: John Wiley. Ottenbacher, K. J. (1993). Interrater agreement of visual analysis in single subject decisions: Quantitative review and analysis. American Journal on Mental Retardation, 98, 135-142. Parker, R. I., Hagan-Burke, S., & Vannest, K. (2007). Percent of all non-overlapping data (PAND): An alternative to PND. Journal of Special Education, 40, 194-204. doi:
CONVERGENT EVIDENCE SCALING 28
10.1177/00224669070400040101 Parker, R. I., & Vannest, K. (2009). An improved effect size for single-case research: Nonoverlap of all pairs. Behavior Therapy, 40, 357-367. doi: 10.1016/j.beth.2008.10.006 Parker, R. I., Vannest, K. J., & Davis, J. L. (2011). Effect size in single-case research: A review of nine nonoverlap techniques. Behavior Modification, 35, 303-322. doi: 10.1177/0145445511399147 Parsonson, B. S., & Baer, D. M. (1992). The visual analysis of data and current research into the stimuli controlling it. In T. R. Kratochwill & J. R. Levin (Eds.), Single-case research design and analysis: New directions for psychology and education (pp. 15-40). Hillsdale, NJ: Erlbaum
Riley-Tillman, T. C., & Burns, M. K. (2009). Evaluating educational interventions: Single-case
design for measuring response to intervention. New York: Guilford.
Scruggs, T. E., Mastropieri, M. A., & Casto, G. (1987). The quantitative synthesis of single-
subject research: Methodology and validation. Remedial and special education, 8, 24-33. doi: 10.1177/074193258700800206
Shadish, W. R., Rindskopf, D. M., & Hedges, L. V. (2008). The state of the science in the meta- analysis if single-case experimental designs. Evidence-Based Communication Assessment and Intervention, 2, 188-196. doi: 10.1080/17489530802581603 Shapiro, E. S. (2010). Academic skills problems: Direct assessment and intervention (4th ed.). New York: Guilford.
Shinn, M. R. (2007). Identifying students at risk, monitoring performance, and determining eligibility within response to intervention: Research on educational need and benefit from academic intervention. School Psychology Review, 36, 601-617. Retrieved from

CONVERGENT EVIDENCE SCALING 29
http://www.nasponline.org

CONVERGENT EVIDENCE SCALING 30
Table 1. Demographic Information for Participants Daniel Eliam Itzel Oscar Robert Sex Male Male Female Male Male Age 9 10 11 10 10 Grade 4 4 6 5 6 Ethnicity Hispanic Hispanic Hispanic Hispanic Hispanic ELL Status Yes Yes Yes Yes No Retained No Yes No No No Note. Retention status refers to whether a student was retained at any point prior to receiving Tier 2 intervention. All names are pseudonyms.
CONVERGENT EVIDENCE SCALING 31
Table 2. Single-Case Indicator and Overall CES Rating Interpretation Guidelines CES VAR GAS PND NAES R² Qualitative Description 2 2 2 ≥ 80% ≥ .80 ≥ .25 Strong Positive Effect 1 1 1 60% to 79% .50 to.79 .09 to .24 Moderate Positive Effect 0 0 0 ≥ 60% -.49 to.49 -.08 to .08 No Effect -1 -1 -1 -.50 to -.79 -.09 to -.24 Moderate Negative Effect -2 -2 -2 ≤ −.80 ≤ −.25 Strong Negative Effect Mean Individual CES Rating Overall Intervention Outcome ≥ 1.7 Strong Positive Effect .60 to 1.69 Moderate Positive Effect -.59 to .59 No Effect -.58 to -1.69 Moderate Negative Effect ≤ -1.7 Strong Negative Effect Note. CES = convergent evidence scaling; VAR = visual analysis rating; PND = percentage of non-overlapping data; NAES = no assumptions effect size; R² = R-squared coefficient

CONVERGENT EVIDENCE SCALING 32
Table 3. Individual Case Outcomes Indicator Danielle Eliam Itzel Oscar Robert VAR 2 (2)¹ 1 (1) 2 (2) 2 (2) 2 (2) GAS 2 (2) -2 (-2) 2 (2) -1 (-1) 1 (1) PND 50% (0) 33% (0) 17% (0) 33% (0) 50% (0) NAES 2.45 (2) -4.21 (-2) -.20 (0) .85 (2) 1.35 (2) R² .35 (2) .001 (0) .05 (0) .32 (2) .49 (2) Mean CES 1.6 -.6 .8 1 1.4 Outcome Moderate Effect No Effect Moderate Effect Moderate Effect Moderate Effect Note. CES = convergent evidence scaling; VAR = visual analysis rating; PND = percentage of non-overlapping data; NAES = no assumptions effect size; R² = R-squared coefficient. ¹CES conversions are listed alongside outcomes in parenthesis.

CONVERGENT EVIDENCE SCALING 33
Table 4. Ipsative Values for Single-Case Indicators Indicator Mean i Score VAR .92 GAS 1.08 PND 1.08 NAES .84 R² .68 Mean .92 Note. i scores represent the distance in CES units, for individual indicators, from the grand CES for each individual case. CES = convergent evidence scaling; VAR = visual analysis rating; PND = percentage of non-overlapping data; NAES = no assumptions effect size; R² = R-squared coefficient

CONVERGENT EVIDENCE SCALING 34
Danielle
Eliam
Itzel
Oscar
Robert
Figure 1. Graphic display of intervention outcomes