Embed Size (px)
Citation preview
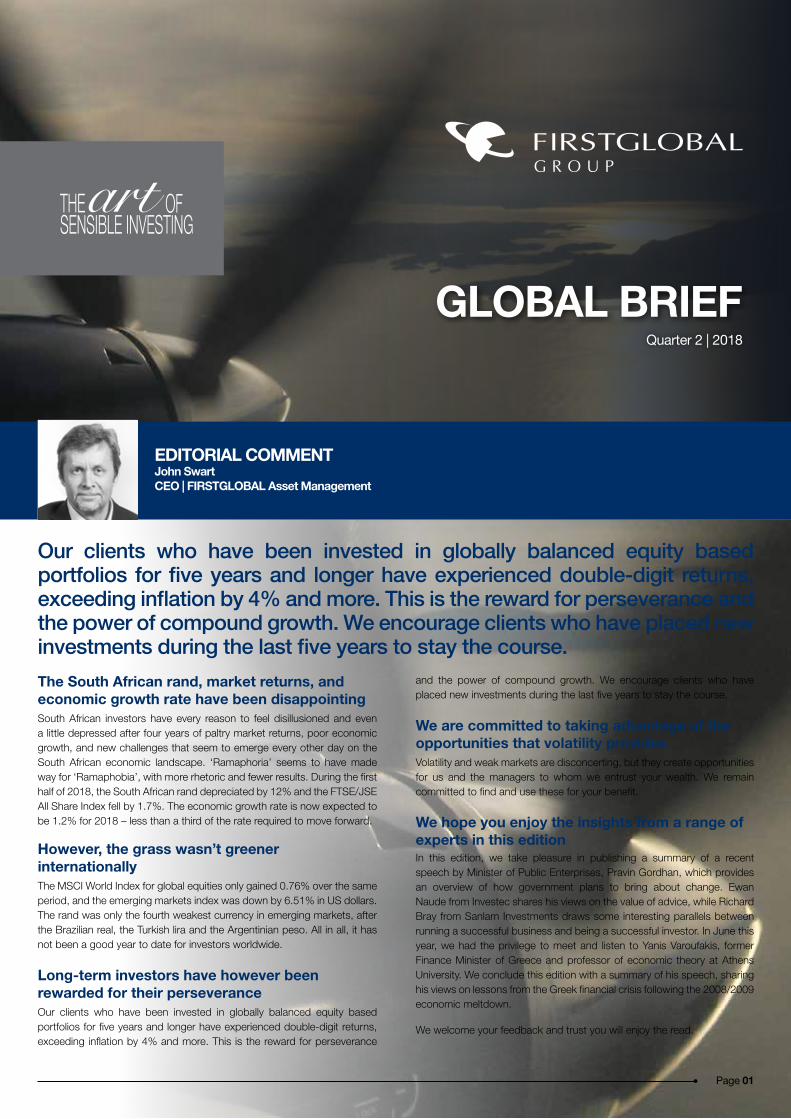
GLOBAL BRIEF
The South African rand, market returns, and economic growth rate have been disappointingSouth African investors have every reason to feel disillusioned and even a little depressed after four years of paltry market returns, poor economic growth, and new challenges that seem to emerge every other day on the South African economic landscape. ‘Ramaphoria’ seems to have made way for ‘Ramaphobia’, with more rhetoric and fewer results. During the first half of 2018, the South African rand depreciated by 12% and the FTSE/JSE All Share Index fell by 1.7%. The economic growth rate is now expected to be 1.2% for 2018 – less than a third of the rate required to move forward.
However, the grass wasn’t greener internationallyThe MSCI World Index for global equities only gained 0.76% over the same period, and the emerging markets index was down by 6.51% in US dollars. The rand was only the fourth weakest currency in emerging markets, after the Brazilian real, the Turkish lira and the Argentinian peso. All in all, it has not been a good year to date for investors worldwide.
Long-term investors have however been rewarded for their perseveranceOur clients who have been invested in globally balanced equity based portfolios for five years and longer have experienced double-digit returns, exceeding inflation by 4% and more. This is the reward for perseverance
Our clients who have been invested in globally balanced equity based portfolios for five years and longer have experienced double-digit returns, exceeding inflation by 4% and more. This is the reward for perseverance and the power of compound growth. We encourage clients who have placed new investments during the last five years to stay the course.
and the power of compound growth. We encourage clients who have placed new investments during the last five years to stay the course.
We are committed to taking advantage of the opportunities that volatility providesVolatility and weak markets are disconcerting, but they create opportunities for us and the managers to whom we entrust your wealth. We remain committed to find and use these for your benefit.
We hope you enjoy the insights from a range of experts in this editionIn this edition, we take pleasure in publishing a summary of a recent speech by Minister of Public Enterprises, Pravin Gordhan, which provides an overview of how government plans to bring about change. Ewan Naude from Investec shares his views on the value of advice, while Richard Bray from Sanlam Investments draws some interesting parallels between running a successful business and being a successful investor. In June this year, we had the privilege to meet and listen to Yanis Varoufakis, former Finance Minister of Greece and professor of economic theory at Athens University. We conclude this edition with a summary of his speech, sharing his views on lessons from the Greek financial crisis following the 2008/2009 economic meltdown.
We welcome your feedback and trust you will enjoy the read.
Page 01
Quarter 2 | 2018
EDITORIAL COMMENTJohn Swart CEO | FIRSTGLOBAL Asset Management

GLOBAL BRIEFQuarter 2 | 2018
Today investors have a much more complex task than a few years agoGeopolitics is important. For example, as in 2010, with the current US-Iran conflict South Africa needs to look again at where it will get its oil from. Right-wing populism is on the rise and markets are not solely ruling the world. Rather, citizens across the globe are raising concerns that they are not benefiting from the economic growth figures published; they need a different proposition. We are also in the middle of a crisis in corporate governance. The audit profession is already in trouble and the legal profession will be too.
In terms of good governance, we’re battling state capture and ‘corporate capture’This is the result of intelligent business people not seeing through the fraudulent schemes of executives and directors. The truth is corruption is everywhere. Elite groups all over the world have the potential to turn corrupt. We are seeing that among the oil barons in the US now and in what’s happening in Iran. Can we think twice about where and in what we are investing?
The modern stage of capitalism is given to extreme greedWe saw it in the build-up to the Global Financial Crisis and we’ve seen it in the behaviour of certain areas of the financial sector. In the world of state-owned enterprises (SOEs) we would typically ask the boards: what kind of incentives do you provide? What behaviour do you drive? But we also have inequality in the distribution of income inside corporates. In the private sector investors need to ask similar questions to those we pose to SOEs. We are all responsible for creating fair outcomes for all.
How did we get here and what do we need to do differently?We need to limit the discretionary power of executives and governing boards. The search for economic rent will continue; those benefiting from state (and corporate) capture will do everything in their power to keep their benefits. State capture had opportunity costs. That which has been stolen is lost to the people. As we progress our clean-up, the money can be recovered. There has to be legal consequences and we need to start the process of repatriating this money.
As far as SOEs are concerned, we are determined to root out corruptionWe are nearly done reviewing all boards, and the new boards, together with government, must review the management of SOEs. In the state capture process, the good guys were kicked out or marginalised and the bad guys still facilitate the capture process through procurement and consulting contracts. Ultimately, the minister is looking at the business models of these entities. Can they generate sufficient revenue for their own stability and cut their reliance on the fiscus? SOE management is already changing and processes are deeply investigated. Some interesting announcements will follow soon.
As South Africans we are also captive to historyThere are many fault lines in our economy. Whether it’s a land problem, unemployment or property, it’s not just about repositioning the current economy, but about addressing and healing the past. We need to pay attention to history’s impact on current generations. In South Africa the economy remains an odd-ball pyramid and our economy can only function to its full potential if we liberate it from its past.
The following are economic imperatives:
1. Inclusive growth
2. Job creation
3. Increased capability of the state (service delivery that makes a difference in people’s daily lives)
4. The end of corporate and state corruption
Unemployment is a breeding ground for populist rhetoricHaving three-quarters of your population outside of the economy is a recipe for disaster. We desperately need skills training and there are several programmes underway, such as the government-private sector initiative, the Youth Employment Service. Once legislation has passed, a million young people will be employed either by a large corporate or a small- or medium-sized enterprise. Once you have one job, that formidably increases your chances of getting another job. Where skills exist, there are gaps we need to bridge to make us internationally competitive, specifically in the sectors with the largest potential to compete: tourism, agriculture and new types of manufacturing. We have also fallen behind in terms of our research and development spending, currently standing at only 0.7% of GDP while the global average is 1.5%.
Page 02
A NEW DAWN NEEDS CONTINUED GOOD INVESTMENT DECISIONSAdapted from a speech by Public Enterprises Minister Pravin Gordhan
How do we, as investors, encourage innovation?The immediate challenges that we face are: fiscal constraints, tax administration problems, the burden of increased fuel prices on the poor, and low levels of investment into the country. Investment in bigger emerging markets equals 30% to 50% of GDP (China at its peak). South Africa is below 20% currently. Without investment there is no growth and no job creation. For this reason, government has several investment conventions planned for 2018.
If you invest in South Africa now, you start a virtuous cycleYou create jobs, you change the narrative and the numbers, you encourage growth and begin to solve some of the historical problems. There are interesting prospects ahead of us and an exciting period that will not be shut down anytime soon.
On the other hand, it’s important to have a balanced portfolioFirstly, don’t put everything in cash – distribute it among the different asset classes. And secondly, geography is important too. Lastly, as investors, we must take into account our history and our current situation and prepare our new generation for an uncertain but exciting future. A new dawn does not happen with the wave of a wand. Each one of us must be involved in cleansing ourselves of the recent capture.
GLOBAL BRIEFQuarter 2 | 2018
Page 03
A NEW DAWN NEEDS CONTINUED GOOD INVESTMENT DECISIONSAdapted from a speech by Public Enterprises Minister Pravin Gordhan

Growing up I was a huge tennis fan and Andre Agassi was my absolute hero. I watched every match he was part of and longed to own the luminous yellow and black HEAD tennis racquet he used to use.
I was also very entrepreneurial, and I used to sell chocolates from a local supplier that were perfectly edible but couldn’t be sold by retailers because they were imperfectly shaped. My success in selling ‘reject’ Cadbury’s products on our school grounds even resulted in the headmaster shutting down my operation. His rationale was that he didn’t want to turn the schoolyard into a marketplace, but I suspect it was because the tuckshop’s revenue was taking a beating since I had encroached on their turf.
Before my capitalist dream was shattered by our headmaster, I was able to generate enough revenue to buy the tennis racquet I so longed for. I remember like yesterday walking into Louis Sports, and as I entered the store I saw a pair of Nike tennis shoes that took my breath away. I ended up buying the shoes and a vastly inferior racquet. A week later, after tennis practice, I left the racquet in my mom’s car in the middle of a scorching Eastern Cape summer’s day and the racquet frame melted, completely altering its shape. That was my first lesson in ‘goedkoop koop is duurkoop’, which loosely translated means buying cheap can cost you in the long run.
There is no doubt that the financial advice and wealth management space has become increasingly competitive over the years. Each provider seeks to differentiate itself, whether it’s through client service, investment process or geographical reach. What is noticeable is that over the past few years some advisors have tried to differentiate themselves through lower fees, a move that is symptomatic of the low-return environment we have been in. There is no doubt that fees are a critical component of investor returns. Where there is an opportunity to save for a client this should always be considered, but fees should never (within reason) be the tail that wags the investment dog and should never be a cornerstone of your value proposition.
Fees should never (within reason) be the tail that wags the investment dog and should never be a cornerstone of a value proposition.
PriceMetrix, which is part of McKinsey and Company, puts together an annual wealth management report that focuses on US independent wealth managers and financial advisors. In the 2017 report, PriceMetrix maintains that lowering fees is not an effective way of asset and revenue growth. The results are not unique to the year in question but have become a trend.
Discounting fees may work in attracting clients in the short term. But to retain them, a well-balanced value proposition is necessary.
GLOBAL BRIEFQuarter 2 | 2018
Page 04
GOEDKOOP KOOP IS DUURKOOPEwan NaudeHead of Intermediary Strategy at Investec Wealth & Investment.
GOEDKOOP KOOP IS DUURKOOPEwan NaudeHead of Intermediary Strategy at Investec Wealth & Investment

Thriving businesses set appropriate goals, have a clear strategy and remain focusedTo create a successful business strategy, you need to set the right goals and actually reach them – but this is easier said than done. Business execution for results written by Stephen Lynch is a guide to building a better business. It offers a practical plan for setting appropriate goals and performing the necessary analyses to create a winning business strategy that will lead your company to success.
Setting and staying committed to ambitious goals is importantAccording to Lynch, you need to define and stay excited about ‘big, hairy audacious goals’ or ‘BHAGs’. This phrase was coined by Jetty I. Porras and Jim Collins in their book, Built to last. To qualify as a BHAG, it needs to be very big, take years to accomplish, be a little bit elusive in terms of the best way to achieve it, but must be easy to tell if it’s been achieved or not. Consider Walmart. After World War II, Sam Walton set a BHAG. He wanted to turn his store into the most profitable one in the entire state. At the time he was selling cheap T-shirts and fishing rods in a tiny variety store in Newport, Arkansas. By 1948, Walton had achieved his vision, but he kept setting BHAGs. Decades down the line, by 2002, Walmart had become the largest company in the world.
Consider your environment to make informed decisions and determine your differentiatorCreate a framework made up of political, economic, industry-specific, social and technological factors to recognise opportunities and threats. Listing these factors and how they may influence your business will help you identify something that Lynch refers to as your ‘value discipline’. This is the thing that makes you stand out from your competitors. It may be operational excellence (low costs), product leadership (creating the newest and best products), or customer intimacy (producing solutions tailored to the problems your customers face). Once you have the focus of a value discipline, trying to be all things to all people becomes less important and you can focus your resources.
Sometimes you must be willing to make a short-term sacrifice for long-term successIf we go back to Sam Walton, in the early 1960s he decided to focus on offering a low-cost option so that everybody could afford shopping at Walmart. He made the decision to spend some of his own savings to be able to offer rock-bottom prices to his customers. By sticking to his value discipline Walton differentiated Walmart and created the foundation for its resounding success. Are you prepared to invest in your business’s chosen value discipline over the short term to achieve long-term success?
Input and buy-in from your team and being aligned on values are criticalAs a leader, you not only have to have a clear vision, but you also need to bring your team along on the journey. After all, your success is dependent on them to execute the strategy. If they aren’t aligned or don’t understand why key outcomes are important, chances are that they will become demoralised and demotivated and you will end up frustrated. To build commitment and keep your team on track you must have:
1. A clear core purpose (informed by your value discipline)
2. Explicit core values (to ensure consistent decision-making, including hiring and firing decisions)
But investing only in your own business is riskyAll businesses have cycles of expansion and contraction – with resultant higher and lower (or no) returns. Successful and forward-looking business people will therefore always invest in other businesses alongside their own, so that – in the bigger financial picture - their own business becomes one part of a greater, diversified and therefore more sustainable investment portfolio.
Carefully consider every factor when choosing an investment manager It pays to choose your investment manager wisely. Ask the right questions and demand clear answers. One of the most common mistakes that investors make is to choose a fund manager purely on the grounds of good returns. Even a long track record by an award-winning fund can hide a multitude of sins. You want to be sure that your fund manager takes no undue risk, invests in a sound mix of high-quality (sometimes lower-yielding) counters and lower-quality (but higher-yielding) counters, and that you are sufficiently compensated for the risk in your portfolio.
Your investment manager should have a disciplined and repeatable processAs one example, and in so far as equity investments are concerned, Patrice Rassou, Head of Equities at Sanlam Investments, and his team apply a disciplined process to determine the quality of a company:
• The past financial returns of the company, using as much financial history as you can obtain
• The track record of company management with respect to capital allocation
• The level of corporate governance within the company, by interacting with the boards of the companies they invest in.
This process helps ensure that they invest only in the highest-quality companies that will support the set investment objectives.
GLOBAL BRIEFQuarter 2 | 2018
Page 05
WINNING IN BUSINESS AND INVESTINGRichard BrayHead of Strategy and Client Solutions at Sanlam Investments

Conviction in a single investment can differentiate results, but diversification provides insuranceA focused, high-conviction investment – just like a value discipline in business – will help you achieve differentiated results. However, when investing, there are a wide range of factors outside of your control, and you cannot predict with certainty how your investments would react to these factors. This requires a counterbalance to ensure that your overall wealth outcome isn’t dependent on one potential outcome. Different asset classes and investment instruments react differently to the same environment changes, which is why diversification should be the backbone of your overall portfolio.
Exercising patience is critical to achieving your long-term goals It took over 50 years for Walmart to become the largest company in the world. Similarly, when you invest, time in the market is important. When the equity market corrects, very few share prices remain unscathed. Defensive portfolios normally experience a lower-than-market-average drop in value, but it could take several months – even years – for an investor who invested just before a crash to get his money back, let alone show a real return. Investors who don’t have the time to mend their sails should rather choose the safe harbour of more conservative investments.
GLOBAL BRIEFQuarter 2 | 2018
Page 06
WINNING IN BUSINESS AND INVESTINGRichard BrayHead of Strategy and Client Solutions at Sanlam Investments
There are several similarities between Greece and South AfricaOur countries exhibit great income disparities, with immense pockets of wealth juxtaposed with large tracts of devastation and hopelessness. It is widely accepted that South Africa will have to address inequality to prosper, but redistributive efforts could be hamstrung by global shocks to the economy.
We are vulnerable to global forcesOne future scenario sees a concerted attack by international investors on South Africa’s currency and bond markets. South Africa will face major fluctuations to the exchange rate that will be a major impediment to strategies for development, given that macroeconomics in the US and the EU are moving against South Africa. Macroeconomic policy responses are limited to expending the central bank’s foreign exchange reserves to support the rand, pushing interest rates to levels that choke local development, or introducing stricter capital controls. The outlook for emerging markets is heavily influenced by economic and political developments in global centres of power, including the US, the Eurozone and China.
The US and Eurozone are experiencing major political upheaval at presentThis is evidenced by Donald Trump’s 2016 presidential election win and the more recent success of Matteo Salvini, leader of Italy’s ‘euro-sceptic’ Northern League, who wishes to split up not only the European Union but also Italy. These victories can be attributed to changes in sentiment amongst the respective electorates. Trump’s ‘make America great’ slogan resonated with the country’s middle class at a time when median earnings were in a multi-year decline. In 2016, it was the first time since 1929 that more than half of American families could not afford an entry level car; they neither had the cash nor the creditworthiness to secure funding for the approximate $14 000 sticker price. And the US is a country in which everyone needs a car. Of equal concern was the fact that the sub-prime crisis of 2008 had decimated the wealth ‘stored’ by most US families in their homes.
Tails Trump wins, heads the liberals lose!The US liberal establishment believes that further economic malaise or a stock market collapse will unseat Trump, but they could be in for a surprise. If Trump’s policies lead to a recovery, especially in middle America where he concentrated his election promises, he will get the credit for it; if there is a crisis, he will deflect the blame to the liberal establishment.
Political developments in Italy could destabilise the entire EurozoneAs the fourth largest economy in the region, Italy is sitting on a debt time-bomb with €463 billion owed by the Italian central bank to the German Bundesbank alone. Italy is too large to bully, too large to fail, and too large to bail out. A financial crisis, which for Greece was a nightmare, would be a dream for Italy’s new leadership. Salvini does not need to run a political campaign to get Italy out of the euro; he needs only to allow for a financial crisis to develop and capital controls to be applied – and Italy would be out of the Eurozone.
Trump’s global trade wars will be of far greater concern to South AfricaThe latest move in Trump’s ‘game’ of aggressive capitalism is to target German car exports to the US, but he has China in his sights too. One of his apparent goals is to liberalise the Chinese financial services sector to give access to Wall Street firms. If this happens, South Africa and the rest of the emerging market countries will be in serious trouble. Capital will simply flow out of China, the renminbi will fall, the US dollar will strengthen, and emerging markets will be crushed.
We need a new Bretton Woods: a global agreement to create shared prosperity The world is still struggling with the after effects of the 2008 Global Financial Crisis, but the next crisis is already looming. Countries that face similar problems could insulate against future financial crises by creating common instruments to absorb external shocks, particularly from the US, but this would not be as effective as a new fiscal agreement between the major global powers. The only way to establish shared prosperity in the world is to move in the direction of a new Bretton Woods, an agreement to coordinate global investment in a way that ends the incongruity between savings and investments and at the same time coordinates fiscal policy.
Page 07
GLOBAL BRIEFQuarter 2 | 2018
OWNERSHIP OF PRODUCTION, NOT LAND, NEEDED TO TACKLE POVERTY AND INEQUALITYAdapted from a speech by Yanis Varoufakis, former Finance Minister of Greece and professor of Economic Theory at Athens University

www.fgam.co.za
JOHANNESBURG:
Bear Vision Investment Services (Pty) LtdKlaas Venter: [email protected] Venter: [email protected]: 011 431 1201
FIRSTGLOBAL Investment Counsel (Pty) LtdHennie Fourie: [email protected] Kemp: [email protected]: 011 782 1200
Finleks (Pty) LtdJacques du Plessis: [email protected]: 011 552 7345
FIRSTGLOBAL Capital (Pty) LtdErnst Beukes: [email protected]: 011 476 0676
DURBAN:
Borland Financial Services Group (Pty) LtdMike Borland: [email protected] Drake: [email protected] Loots: [email protected] Sunny: [email protected]: 031 202 9113
Harcourt Martens & Associates (Pty) LtdSandy Aitken-Rose: [email protected]: 082 576 2371
PRETORIA:
FIRSTGLOBAL Capital (Pty) LtdJohn Swart: [email protected] Labuschagne: [email protected] Venter: [email protected]: 012 460 5007
CAPE TOWN:
FIRSTGLOBAL Wealth Management (Pty) LtdJacques Hattingh: [email protected] Engelbrecht: [email protected] Liebenberg: [email protected]: 021 914 8701
RICHARDS BAY:
Harcourt Martens & Associates (Pty) LtdMike Harcourt: [email protected] Badenhorst: [email protected] Marais: [email protected]: 035 789 8525
All of our members are licensedFinancial Services Providers (FSPs)
DISCLOSURE: Collective Investment Schemes are generally medium to long term investments. The value of participatory interests or the investment may go down as well as up. Past performance is not necessarily a guide to future performance. Collective investment schemes are traded at ruling prices and can engage in borrowing and scrip lending. A schedule of fees and charges and maximum commissions is available on request from the manager. The Manager does not provide any guarantee either with respect to the capital or the return of a portfolio. Fund of funds and feeder funds invest in portfolios of other Collective Investment Schemes that levy their own charges, which could result in a higher fee structure for the fund of funds. The Manager retains full legal responsibility for the Fund, regardless of Co-Naming arrangements. Transaction cutoff time is 14:30 daily. Each portfolio may be closed for new investments. Valuation time is 15:00 (17h00 at quarter end) and 20:00 for fund of funds and certain funds with significant investments in CIS. Prices are published daily and available newspapers countrywide, as well as on request from the Manager. IP Management Company (RF) Pty Ltd is the authorised Manager of the Scheme – contact 021 673 1340 or [email protected]. Standard Bank is the trustee / custodian – contact [email protected]. Additional information including application forms, the annual report of the Manager and detailed holdings of the portfolio as at the last quarter end are available, free of charge, from [email protected]. IP Management Company is a member of ASISA. Financial Advisor fees as agreed between the Investor and the Advisor may apply and payment to the Advisor will be facilitated on behalf of the Investor. A statement of changes in the composition of the portfolio during the reporting period is available on request. The portfolio may include foreign investments and the following additional risks may apply: liquidity constraints when selling foreign investments and risk of non-settlement of trades; macroeconomic and political risks associated with the country in which the investment is made; risk of loss on foreign exchange transactions and investment valuation due to fluctuating exchange rates; risk of foreign tax being applicable; potential limitations on availability of market information which could affect the valuation and liquidity of an investment. All of these risks could affect the valuation of an investment in the fund.
DISCLAIMER: This document is for information purposes only and is not intended for the solicitation of new business. FIRSTGLOBAL Asset Management shall not accept any liability or responsibility of whatsoever nature and however arising in respect of any claim, damage loss or expense relating to or arising out of or in connection with the reliance by anyone on the contents of this document. FIRSTGLOBALAssset Management is a licenced Financial Services Provider FSP number 20987.
MEMBERS OF THE FIRSTGLOBAL GROUP
GLOBAL BRIEFQuarter 2 | 2018
FIRSTGLOBAL Asset Management is an authorised financial services provider FSP nr 20987
Quarter 2 | 2018
FIRSTGLOBAL ASSET MANAGEMENT QUARTERLY REPORT
QUARTERLY REPORTQuarter 2 | 2018
Page 02
MARKET COMMENTARYEdrich JansenMCom Finance (UP) | PG Dip Financial Planning (UFS)
When things are uncertain, we long for the ‘good old days’ Over time most things have a tendency to revert back to the mean or, put differently, return to normal. To avoid starting a philosophical debate about what ‘normal’ is, for this article let us call it ‘the way things used to be’. If one looks at the current state of the world, and more specifically geo-political developments and economics, things look distorted, worrisome, and out of place. Ironically, we can however ask the question: when has the world not been in such a state? People generally do not like this chaos and want things to go back to the way they used to be, ‘the good old days’.
Nobody knows what the scale of the impact of increasing interests rates will beThe biggest central banks around the world, specifically the US Federal Reserve and the European Central Bank (ECB), have either started or will soon begin their attempts to restore things to the way they used to be by normalising (increasing) interest rates. On a historical basis, developed market interest rates are exceptionally low. The magnitude of the impact that the normalisation of rates will have on the world economy is uncertain, simply because the world has never been in a similar situation before. Increasing rates will inevitably affect bond yields, and in turn rising bond yields will affect the stockmarket. At its June meeting, the ECB announced plans to wind down its R31 trillion quantitative easing programme by year end, but it maintained rates at current levels. The US Federal Reserve increased interest rates by 25 basis points at their June meeting.
Recent positive market sentiment has pushed the local equity market upInvestor sentiment improved at the start of the second quarter following positive first-quarter earnings in the US, with 79% of companies posting results that exceeded expectations. A successful summit between the leaders of North and South Korea, and (at that stage) fears of a global trade war abating further supported the positive market sentiment. The ten-year US treasury yield breached the significant 3% threshold for the first time in over four years in April as the market factored increased inflation expectations into tighter US monetary policy. The higher bond yields put pressure on the rand but at the same time pushed the local equity market up by 5% during the month.
Trade concerns and the Italian crisis prompted a flight to safety The theme of higher volatility during the first quarter continued during the second, with the bears looking for catalysts to push the market down. During May the catalysts materialised in the form of the Italian crisis and trade concerns. The crisis in Italy (the eurozone’s third-largest economy) threw global markets into turmoil during the last week of May. European markets wrestled with the potential implications of an Italian crisis. This sent its government bonds plummeting and put pressure on the euro and other risk assets. Brent crude prices rallied for most of May and broke through the $80 per barrel level for the first time in three years. Trade concerns continued to weigh on sentiment after Trump imposed tariffs on steel and aluminium imports from the European Union, Canada and Mexico. Volatility increased further during the latter part of
the quarter amid continued fears about a possible trade war between the US and China. Markets saw a flight to safety in the US, whilst emerging markets (EM), including South Africa, remained under pressure for most of the second quarter.
Trump’s protectionist policies and trade wars will hurt the US, China, and the rest of the worldThe irony is that Trump’s protectionist policies and escalating trade wars, which he argues will make America great again, are hurting the US. The US imports around $500 billion in goods from China annually, and exports only around $130 billion to China. American exports to China account for less than 1% of US GDP, while Chinese exports to the US account for around 4% of Chinese GDP. What the trade balance numbers don’t capture is the substantial presence American multinationals have in China, with billions of dollars in sales to Chinese consumers. General Motors (GM), for instance, sells more cars in China than in the US. These cars don’t count towards US exports as they are made in China, but the revenues accrue to GM shareholders. Arguably, the bigger impact of the tariffs is not directly on trade volumes, but rather the uncertainty it creates for businesses with complex value chains that span several countries. A further escalation of the trade dispute would be negative for the US and Chinese economies, and by implication the world economy. Therefore, it is in the interests of both countries to step back from the brink.
Despite the trade war jitters during the quarter, the Nasdaq Composite Index reached new all-time highs and recorded its eighth straight quarter of gains, climbing 6.3% over the tumultuous three months. The S&P 500 and the Dow Jones Industrial Average rose 2.9% and 0.7% respectively over the quarter, but they remain well below their January records.
Locally, record foreign outflows have resulted in the rand depreciatingThe local market was primarily driven by global sentiment and, as mentioned already, the past quarter was a period of risk aversion and a flight to safety away from EM. The negative EM sentiment started in Argentina, and Brazil and Turkey soon followed suit. South Africa was dragged along, and record foreign outflows resulted in the rand depreciating by approximately 15% over the second quarter. Readers will recall that I referred to euphoria being dispensed in small quantities last quarter. Well, ‘Ramaphoria’ most certainly has metamorphosed into ‘Ramareality’. The rand has lost almost all the ground it made after the Ramaphosa victory, but it would be erroneous to deduce that it is because his attempts at stabilising government and the economy are failing. Firstly, it is too early to tell, and secondly, when the US sneezes the rest of the world catches a cold.
The last quarter proved again that it is dangerous to try and time the marketOn the last day of the quarter the local market (as measured by the FTSE/JSE All Share Total Return Index) jumped 3.25%. Studies have shown that, over the long term, the majority of returns can be explained by a small percentage of days, meaning that not only is it virtually impossible to time the market to include these days, but also once you miss it, you miss out - forever.

QUARTERLY REPORTQuarter 2 | 2018
MARKET COMMENTARYEdrich JansenMCom Finance (UP) | PG Dip Financial Planning (UFS)
Our funds have shown resilience and have already started to reward patient investors
Page 03
All the FG IP Fund of Funds outperformed their peer group averages over the second quarter and investors in FG IP International Flexible Fund of Funds were rewarded with a quarterly return of more than 15%. Despite recent headwinds in the form of Steinhoff and the local property market, the FG funds have shown resilience and have already started to reward the patient investor prepared to withstand the inevitable market volatility. Investors should have by now started to adjust their return expectations lower, and for those who are waiting for things to return to the good old days of annual returns of more than 15-20%, here is some food for thought:
1. We might never get back to the good old days.
2. These days may indeed be the good old days!
FOR PERIODS UNTIL 30 JUNE 2018
QUARTERLY REPORTQuarter 2 | 2018
Page 04
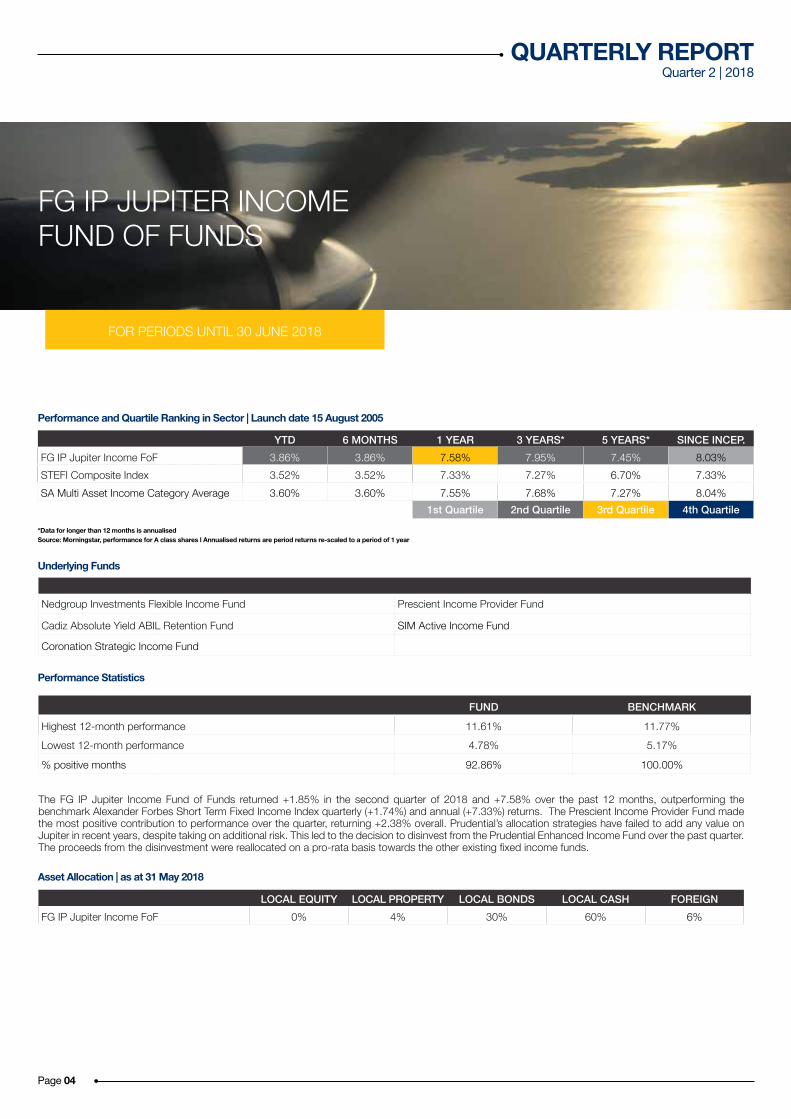
YTD 6 MONTHS 1 YEAR 3 YEARS* 5 YEARS* SINCE INCEP.FG IP Jupiter Income FoF 3.86% 3.86% 7.58% 7.95% 7.45% 8.03%STEFI Composite Index 3.52% 3.52% 7.33% 7.27% 6.70% 7.33%SA Multi Asset Income Category Average 3.60% 3.60% 7.55% 7.68% 7.27% 8.04%
1st Quartile 2nd Quartile 3rd Quartile 4th Quartile
Source: Morningstar, performance for A class shares l Annualised returns are period returns re-scaled to a period of 1 year
LOCAL EQUITY LOCAL PROPERTY LOCAL BONDS LOCAL CASH FOREIGNFG IP Jupiter Income FoF 0% 4% 30% 60% 6%
Nedgroup Investments Flexible Income Fund Prescient Income Provider Fund
Cadiz Absolute Yield ABIL Retention Fund SIM Active Income Fund
Coronation Strategic Income Fund
FUND BENCHMARK
Highest 12-month performance 11.61% 11.77%Lowest 12-month performance 4.78% 5.17%
% positive months 92.86% 100.00%
Performance and Quartile Ranking in Sector | Launch date 15 August 2005
Asset Allocation | as at 31 May 2018
Underlying Funds
Performance Statistics
The FG IP Jupiter Income Fund of Funds returned +1.85% in the second quarter of 2018 and +7.58% over the past 12 months, outperforming the benchmark Alexander Forbes Short Term Fixed Income Index quarterly (+1.74%) and annual (+7.33%) returns. The Prescient Income Provider Fund made the most positive contribution to performance over the quarter, returning +2.38% overall. Prudential’s allocation strategies have failed to add any value on Jupiter in recent years, despite taking on additional risk. This led to the decision to disinvest from the Prudential Enhanced Income Fund over the past quarter. The proceeds from the disinvestment were reallocated on a pro-rata basis towards the other existing fixed income funds.
FG IP JUPITER INCOME FUND OF FUNDS
*Data for longer than 12 months is annualised

YTD 6 MONTHS 1 YEAR 3 YEARS* 5 YEARS* SINCE INCEP.FG IP Venus Cautious FoF 0.96% 0.96% 5.54% 6.36% 8.54% 8.87%SA Multi Asset Income Category Average 1.50% 1.50% 6.89% 5.73% 7.30% 7.75%
1st Quartile 2nd Quartile 3rd Quartile 4th Quartile
FOR PERIODS UNTIL 30 JUNE 2018
QUARTERLY REPORTQuarter 2 | 2018
Source: Morningstar, performance for A class shares l Annualised returns are period returns re-scaled to a period of 1 year
LOCAL EQUITY LOCAL PROPERTY LOCAL BONDS LOCAL CASH FOREIGNFG IP Venus Cautious FoF 16% 8% 13% 42% 21%
36ONE BCI Equity Fund Old Mutual Global Equity Fund
ABSA Property Equity Fund Prescient Income Provider Fund
Coronation Optimum Growth Fund Saffron SCI Opportunity Income Fund
Coronation Strategic Income Fund Sesfikile SCI Property Fund
Investec Diversified Income Fund SIM Active Income Fund Nedgroup Investments Entrepreneur Fund Cadiz Absolute Yield ABIL Retention Fund
Nedgroup Investments Opportunity Fund
FUND BENCHMARK
Highest 12-month performance 15.12% 16.56%Lowest 12-month performance -1.41% -2.82%
% positive months 71.21% 71.97%
Performance and Quartile Ranking in Sector | Launch date 15 August 2005
Asset Allocation | as at 31 May 2018
Underlying Funds
Performance Statistics
The FG IP Venus Cautious Fund of Funds returned +3.25% in the second quarter of 2018 and +5.54% over the past 12 months, outperforming the benchmark peer group average quarterly return of +2.81%, but underperforming the 12-month return of +6.89%. The Old Mutual Global Equity Fund made the biggest positive contribution to performance, returning +18.31% over the quarter. The tactical reallocation from the ABSA Property Equity Fund into the income funds earlier in the year, were reinvested again into the Sesfikile BCI Property Fund. The property sector offers attractive value after the significant sell-off, and Sesfikile BCI Property Fund provides the property market beta but at a lower risk relative to the ABSA Property Equity Fund. The decision was made to disinvest from the Prudential Enhanced Income Fund on Venus due to the fact that, despite taking on additional risk, the Fund has failed to add any value to Venus in recent years. The funds were reallocated between the existing fixed income funds.
FG IP VENUS CAUTIOUS FUND OF FUNDS
Page 05
*Data for longer than 12 months is annualised

YTD 6 MONTHS 1 YEAR 3 YEARS* 5 YEARS* SINCE INCEP.FG IP Saturn Flexible FoF 1.57% 1.57% 6.06% 5.64% 8.48% 10.71%SA Multi Asset Medium Equity Category Average 0.50% 0.50% 6.88% 4.80% 7.57% 9.33%
1st Quartile 2nd Quartile 3rd Quartile 4th Quartile
FOR PERIODS UNTIL 30 JUNE 2018
QUARTERLY REPORTQuarter 2 | 2018
Page 06
Source: Morningstar, performance for A class shares l Annualised returns are period returns re-scaled to a period of 1 year*Data for longer than 12 months is annualised
LOCAL EQUITY LOCAL PROPERTY LOCAL BONDS LOCAL CASH FOREIGNFG IP Saturn Flexible FoF 40% 5% 13% 17% 25%
36ONE BCI Flexible Opportunity Fund PSG Flexible Fund
Coronation Market Plus Fund Rezco Value Trend Fund
Investec Opportunity Fund SIM Inflation Plus Fund
Nedgroup Investments Opportunity Fund Truffle SCI Flexible Fund
Matrix Defensive Balanced Fund
FUND BENCHMARK
Highest 12-month performance 31.40% 26.41%Lowest 12-month performance -18.22% -15.68%
% positive months 69.48% 66.23%
Performance and Quartile Ranking in Sector | Launch date 15 August 2005
Asset Allocation | as at 31 May 2018
Underlying Funds
Performance Statistics
The FG IP Saturn Flexible Fund of Funds returned +4.31% in the second quarter of 2018 and +6.06% over the past 12 months, outperforming the benchmark peer group average quarterly return of +3.49%, but underperforming the 12-month return of +6.88%. The Rezco Value Trend Fund, with its comparatively high offshore allocation, was the best performing underlying fund over the quarter returning +7.92%, aided by the depreciation of the rand against the US dollar. With the aim to improve Saturn’s overall underlying fund diversification, a reallocation from the SIM Inflation Plus Fund towards the Matrix Defensive Balanced Fund was made.
FG IP SATURN FLEXIBLE FUND OF FUNDS

YTD 6 MONTHS 1 YEAR 3 YEARS* 5 YEARS* SINCE INCEP.FG IP Neptune Growth FoF 0.79% 0.79% 9.54% 6.04% N/A 6.32%SA Multi Asset High Equity Category Average -0.19% -0.19% 7.21% 4.63% N/A 5.35%
1st Quartile 2nd Quartile 3rd Quartile 4th Quartile
FOR PERIODS UNTIL 30 JUNE 2018
QUARTERLY REPORTQuarter 2 | 2018
Source: Morningstar, performance for A class shares l Annualised returns are period returns re-scaled to a period of 1 year*Data for longer than 12 months is annualised
LOCAL EQUITY LOCAL PROPERTY LOCAL BONDS LOCAL CASH FOREIGNFG IP Neptune Growth FoF 45% 6% 7% 15% 27%
ABSA Property Equity Fund Old Mutual Global Equity Fund
Catalyst Global Real Estate Prescient Feeder Fund Prudential Balanced Fund
Coronation Strategic Income Fund PSG Flexible Fund
Fairtree Equity Prescient Fund Rezco Value Trend Fund
Investec Equity Fund Truffle SCI General Equity Fund
Laurium Flexible Prescient Fund
FUND BENCHMARK
Highest 12-month performance 14.27% 12.31%Lowest 12-month performance 0.30% -0.62%
% positive months 63.04% 60.87%
Performance and Quartile Ranking in Sector | Launch date 1 September 2014
Asset Allocation | as at 31 May 2018
Underlying Funds
Performance Statistics
The FG IP Neptune Growth Fund of Funds returned +5.58% over the second quarter of 2018 and +9.54% over the past 12 months, outperforming the benchmark peer group average quarterly return of +3.52%, as well as the 12-month return of +7.21%. The Catalyst Global Real Estate Prescient Feeder Fund was the best performing underlying fund over the past quarter, with the Fund returning +21.78%. No changes were made to the Fund over the past quarter.
FG IP NEPTUNE GROWTH FUND OF FUNDS
Page 07

YTD 6 MONTHS 1 YEAR 3 YEARS* 5 YEARS* SINCE INCEP.FG IP Mercury Equity FoF -1.67% -1.67% 7.98% 2.86% 8.33% 10.94%FTSE/JSE Africa All Share (Total Return) -1.70% -1.70% 15.02% 6.69% 11.05% 13.81%SA Equity General Category Average -3.68% -3.68% 7.91% 2.67% 7.89% 11.20%
1st Quartile 2nd Quartile 3rd Quartile 4th Quartile
FOR PERIODS UNTIL 30 JUNE 2018
QUARTERLY REPORTQuarter 2 | 2018
Page 08
Source: Morningstar, performance for A class shares l Annualised returns are period returns re-scaled to a period of 1 year*Data for longer than 12 months is annualised
LOCAL EQUITY LOCAL PROPERTY LOCAL BONDS LOCAL CASH FOREIGNFG IP Mercury Equity FoF 73% 7% 0% 7% 13%
36ONE BCI Equity Fund Nedgroup Private Wealth Core Equity FundCoronation Optimum Growth Fund Nedgroup Investments Entrepreneur Fund
Fairtree Equity Prescient Fund Old Mutual Global Equity Fund
Gryphon All Share Tracker Fund Prudential Equity Fund
Investec Equity Fund Sesfikile BCI Property Fund
PSG Equity Fund Truffle SCI General Equity Fund
FUND BENCHMARK
Highest 12-month performance 41.30% 48.30%Lowest 12-month performance -31.68% -37.60%
% positive months 62.99% 62.34%
Performance and Quartile Ranking in Sector | Launch date 15 August 2005
Asset Allocation | as at 31 May 2018
Underlying Funds
Performance Statistics
The FG IP Mercury Equity Fund of Funds returned +2.61% in the second quarter of 2018 and +7.98% over the past 12 months, underperforming the quarterly and 12-month return of the benchmark FTSE/JSE All Share Total Return Index, which returned +4.54% and +9.60% over the respective periods. Mercury have however managed to outperform the peer group average return over both periods. The majority (6/8) of Mercury’s underlying local general equity funds finished in the top quartile over the past quarter, while the Old Mutual Global Equity Fund made the biggest positive contribution, returning +18.31%. The Foord Equity Fund has had key personnel changes since the initial investment in December 2013, and the growing size of its AUM has inhibited the Fund’s ability to produce alpha off small- and mid-cap stocks as it had done previously. After being under review for an extended period of time, the decision was made to disinvest from the Fund. For more than a year the investment committee have been contemplating adding a property allocation on Mercury. The current attractiveness of the property sector as a result of the selloff that started in January provided the opportunity. The property allocation on Mercury was made by way of the Sesfikile BCI Property Fund which provides property market beta but with lower risk.
FG IP MERCURY EQUITY FUND OF FUNDS
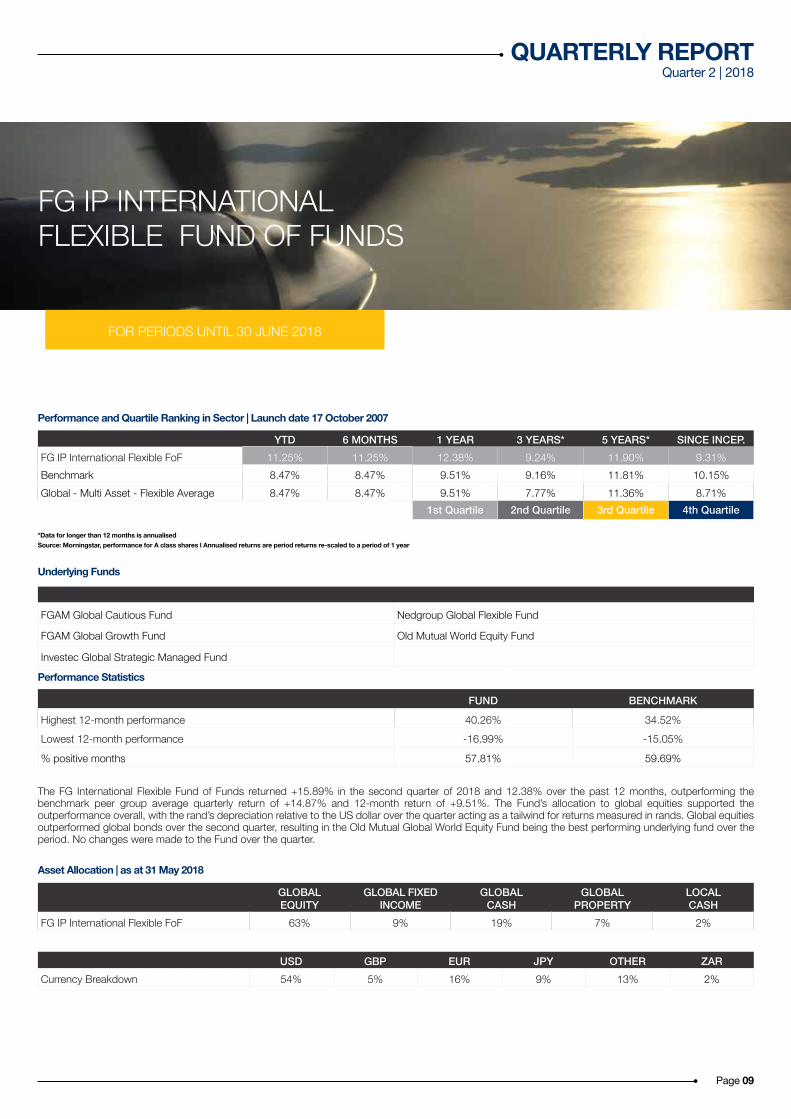
YTD 6 MONTHS 1 YEAR 3 YEARS* 5 YEARS* SINCE INCEP.FG IP International Flexible FoF 11.25% 11.25% 12.38% 9.24% 11.90% 9.31%Benchmark 8.47% 8.47% 9.51% 9.16% 11.81% 10.15%Global - Multi Asset - Flexible Average 8.47% 8.47% 9.51% 7.77% 11.36% 8.71%
1st Quartile 2nd Quartile 3rd Quartile 4th Quartile
FOR PERIODS UNTIL 30 JUNE 2018
QUARTERLY REPORTQuarter 2 | 2018
Source: Morningstar, performance for A class shares l Annualised returns are period returns re-scaled to a period of 1 year*Data for longer than 12 months is annualised
GLOBAL EQUITY
GLOBAL FIXED INCOME
GLOBAL CASH
GLOBAL PROPERTY
LOCAL CASH
FG IP International Flexible FoF 63% 9% 19% 7% 2%
USD GBP EUR JPY OTHER ZARCurrency Breakdown 54% 5% 16% 9% 13% 2%
FGAM Global Cautious Fund Nedgroup Global Flexible Fund
FGAM Global Growth Fund Old Mutual World Equity Fund
Investec Global Strategic Managed Fund
FUND BENCHMARK
Highest 12-month performance 40.26% 34.52%Lowest 12-month performance -16.99% -15.05%
% positive months 57.81% 59.69%
Performance and Quartile Ranking in Sector | Launch date 17 October 2007
Asset Allocation | as at 31 May 2018
Underlying Funds
Performance Statistics
The FG International Flexible Fund of Funds returned +15.89% in the second quarter of 2018 and 12.38% over the past 12 months, outperforming the benchmark peer group average quarterly return of +14.87% and 12-month return of +9.51%. The Fund’s allocation to global equities supported the outperformance overall, with the rand’s depreciation relative to the US dollar over the quarter acting as a tailwind for returns measured in rands. Global equities outperformed global bonds over the second quarter, resulting in the Old Mutual Global World Equity Fund being the best performing underlying fund over the period. No changes were made to the Fund over the quarter.
FG IP INTERNATIONAL FLEXIBLE FUND OF FUNDS
Page 09

QUARTERLY REPORTQuarter 2 | 2018
Page 10
MARKETPERFORMANCE
INDEX ASSET CLASS 2Q 2017 3Q 2017 4Q 2017 1Q 2018 YTD 2018*
STEFI Composite Index Local Cash 1.84% 1.80% 1.76% 1.74% 3.52%
BEASSA ALBI Total Return Local Bonds 3.68% 2.22% 8.06% -3.78% 3.97%
FTSE/JSE SA Listed Property (Total Return) Local Property 5.73% 8.32% -19.61% -2.19% -21.37%
FTSE/JSE Africa All Share (Total Return) Local shares 8.91% 7.44% -5.97% 4.54% -1.70%
JP Morgan World Govt Bond index (USD) Global Bonds 1.65% 0.99% 2.17% -3.04% -0.93%
MSCI AC World (USD) Global Shares 4.69% 5.37% -1.41% -0.12% -1.53%
USD/ZAR (+ weaker, - stronger) Exchange Rate 3.13% -8.74% -3.81% 15.70% 11.28%
*(Return until 30 June 2018)
www.fgam.co.za
JOHANNESBURG:
Bear Vision Investment Services (Pty) LtdKlaas Venter: [email protected] Venter: [email protected]: 011 431 1201
FIRSTGLOBAL Investment Counsel (Pty) LtdHennie Fourie: [email protected] Kemp: [email protected]: 011 782 1200
Finleks (Pty) LtdJacques du Plessis: [email protected]: 011 552 7345
FIRSTGLOBAL Capital (Pty) LtdErnst Beukes: [email protected]: 011 476 0676
DURBAN:
Borland Financial Services Group (Pty) LtdMike Borland: [email protected] Drake: [email protected] Loots: [email protected] Sunny: [email protected]: 031 202 9113
Harcourt Martens & Associates (Pty) LtdSandy Aitken-Rose: [email protected]: 082 576 2371
PRETORIA:
FIRSTGLOBAL Capital (Pty) LtdJohn Swart: [email protected] Labuschagne: [email protected] Venter: [email protected]: 012 460 5007
CAPE TOWN:
FIRSTGLOBAL Wealth Management (Pty) LtdJacques Hattingh: [email protected] Engelbrecht: [email protected] Liebenberg: [email protected]: 021 914 8701
RICHARDS BAY:
Harcourt Martens & Associates (Pty) LtdMike Harcourt: [email protected] Badenhorst: [email protected] Marais: [email protected]: 035 789 8525
All of our members are licensedFinancial Services Providers (FSPs)
DISCLOSURE: Collective Investment Schemes are generally medium to long term investments. The value of participatory interests or the investment may go down as well as up. Past performance is not necessarily a guide to future performance. Collective investment schemes are traded at ruling prices and can engage in borrowing and scrip lending. A schedule of fees and charges and maximum commissions is available on request from the manager. The Manager does not provide any guarantee either with respect to the capital or the return of a portfolio. Fund of funds and feeder funds invest in portfolios of other Collective Investment Schemes that levy their own charges, which could result in a higher fee structure for the fund of funds. The Manager retains full legal responsibility for the Fund, regardless of Co-Naming arrangements. Transaction cutoff time is 14:30 daily. Each portfolio may be closed for new investments. Valuation time is 15:00 (17h00 at quarter end) and 20:00 for fund of funds and certain funds with significant investments in CIS. Prices are published daily and available newspapers countrywide, as well as on request from the Manager. IP Management Company (RF) Pty Ltd is the authorised Manager of the Scheme – contact 021 673 1340 or [email protected]. Standard Bank is the trustee / custodian – contact [email protected]. Additional information including application forms, the annual report of the Manager and detailed holdings of the portfolio as at the last quarter end are available, free of charge, from [email protected]. IP Management Company is a member of ASISA. Financial Advisor fees as agreed between the Investor and the Advisor may apply and payment to the Advisor will be facilitated on behalf of the Investor. A statement of changes in the composition of the portfolio during the reporting period is available on request. The portfolio may include foreign investments and the following additional risks may apply: liquidity constraints when selling foreign investments and risk of non-settlement of trades; macroeconomic and political risks associated with the country in which the investment is made; risk of loss on foreign exchange transactions and investment valuation due to fluctuating exchange rates; risk of foreign tax being applicable; potential limitations on availability of market information which could affect the valuation and liquidity of an investment. All of these risks could affect the valuation of an investment in the fund.
DISCLAIMER: This document is for information purposes only and is not intended for the solicitation of new business. FIRSTGLOBAL Asset Management shall not accept any liability or responsibility of whatsoever nature and however arising in respect of any claim, damage loss or expense relating to or arising out of or in connection with the reliance by anyone on the contents of this document. FIRSTGLOBALAssset Management is a licenced Financial Services Provider FSP number 20987.
MEMBERS OF THE FIRSTGLOBAL GROUP
GLOBAL BRIEFQuarter 2 | 2018