Embed Size (px)
Citation preview

Otis W. Brawley, M.D.Chief Medical OfficerExecutive Vice PresidentAmerican Cancer Society
Professor of Hematology, Oncology, Medicine and
Epidemiology
Emory University

Higher Per Capita Spending in the U.S. does notTranslate into Longer Life ExpectancyThe Cost of a Long Life
Life Expectancy – Per Capita Spending
2006 CIA FACTBOOK
Aver
age
Life
Exp
ecta
ncy
(yea
rs)
Per C
apita
Spe
ndin
g in
USD
74
75
76
77
78
79
80
81
82
Japa
nSan
Mari
noMon
aco
Switzerl
and
Austra
liaSwed
enIce
land
Andor
raCan
ada
France Italy
Austria
Spain
Norway
Singap
oreIsr
ael
Luxe
mbourg
New Zea
land
Netherl
ands
German
yGre
ece
Malta
Belgium
Finlan
d
United
King
dom
Denmark
United
Stat
esCub
aCyp
rus
Irelan
dPort
ugal
0
500
1000
1500
2000
2500
3000
3500
4000
4500
5000
United States

Disparities in Health
• Some consume too much – (Unnecessary care given)
• Some consume too little– (Necessary care not given)
• We could decrease the waste and improve overall health!!!!

• Are American’s willing to be scientific, accept scientific reality and
Give up “faith based medicine”
and
Adopt “evidence based medicine?”
“Americans cannot handle the truth!!!”

Disparities in Health
• The concept that some populations (however defined) do worse than others
• Populations can be defined or categorized by:– Race– Culture– Area of geographic origin– Socioeconomic Status
Disparities in Health
• The concept that some populations (however defined) do worse than others
• The measure can be:– Incidence– Mortality– Survival– Quality of life

All Sites – Cancer Mortality Rates 1973-2004By Race, Males and Females
100
150
200
250
300
'75 '78 '81 '84 '87 '90 '93 '96 '99 '02
Year
Rat
e
Incidence and mortality rates per 100,000 and age-adjusted to 2000 US standard populationSEER Cancer Statistics Review 1975-2004.
African American
Caucasian
AI/ANHispanic
API

Disparities in Health
• We need to approach this issue logically and rationally
• We must focus on what we can change and not on what we cannot change
• We must define social and logistical issues versus scientific issues.

My Concern
• “Equal treatment yields equal outcome among equal patients”
• There is not equal treatment
• There is not enough concern about nor emphasis on the fact that there is not equal treatment

How can we provide adequate high quality care (to include preventive care) to a population that has so often not received it?

Colorectal Cancer Mortality(Male) Annualized 2001-2005
Race/Ethnicity Rate per 100,000Age-adjusted to 2000 standard
White 23.3
Black 32.7
Asian/Pacific Isl. 15.0
Native American 15.9
Hispanic 17.0

Colorectal Cancer Mortality(Female) Annualized 2001-2005
Race/Ethnicity Rate per 100,000Age-adjusted to 2000 standard
White 16.2
Black 22.9
Asian/Pacific Isl. 10.3
Native American 10.8
Hispanic 11.1


Adjusted Colorectal Cancer Survival by Stages and Insurance Status, among Patients Diagnosed in 1999-2000 and Reported to the NCDB

All Races combined
0
10
20
30
40
50
60
70
0-11 12 13-15 16+
%
Insured
Uninsured
Colorectal Cancer Screening*, in Adults, ages 50-64, by Years of Education and Insurance Status, NHIS 2005
*Either a fecal occult blood test within the past year or an endoscopy within the past ten years.
Source: National Health Interview Survey 2005, National Center for Health Statistics, Centers for Disease Control and Prevention,
2006.

Total Number of Cancer Deaths Avoided from 1991 to 2004 in men and 1992 to 2004 in Women
1975
1980
1985
1990
1995
2000
2004
0
160000
180000
200000
220000
240000
260000
280000
300000
320000
340000
360000
Num
ber o
f dea
ths
Year of death
1975
1980
1985
1990
1995
2000
2004
0
160000
180000
200000
220000
240000
260000
280000
300000
320000
340000
360000
Year of death
408,400Cancer deaths
136,100 Cancer deaths
Men Women
The blue line represents the actual cancer deaths recorded in each year and the red line represents the expected number of cancer deaths if cancer mortality rates had remained the same since 1991/1992.

Colorectal Cancer
• It is estimated that 77,000 colorectal cancer deaths were averted between 1990 and 2005 due to screening, early detection, and aggressive treatment.
• Colorectal cancer screening rates have actually gone down during the period 2000 to 2005

Colorectal Cancer
• Imagine a world in which
– Colorectal cancer screening rates were greater than 80%
– All men and women with an abnormal screen got it evaluated
– All with colorectal cancer got optimal therapy

We know what to do, We just need to do it!!!

How can we provide adequate high quality care (to include preventive care) to a population that has so often not received it?

A Note about Smoking and Tobacco
There has been a tremendous positive culture change in
the U.S.
This is our greatest cancer control legacy

Lung Cancer Mortality Annualized 2001-2005
Race/Ethnicity Rate per 100,000Age-adjusted to 2000 standard
White 25.5
Black 33.8
Asian/Pacific Isl. 12.6
Native American 13.9
Hispanic 16.1

Female Breast Cancer Death Ratesby Race and Ethnicity, US, 1975-2004
0
5
10
15
20
25
30
35
40
45
1975 1978 1981 1984 1987 1990 1993 1996 1999 2002
Year
Rat
e pe
r 100
,000
African Americans
Whites
Hispanic/Latina
American Indian/Alaska Native
Asian American/Pacific Islander
American Cancer Society, Surveillance Research, 2007
2004

Breast Cancer PathologyRacial Issues
• At diagnosis the Black population with breast cancer has disproportionately more:– Advanced disease– Higher grade tumors within stage– Less ER + tumors– Younger women (age 35 to 44)
SEER data 1973 to 1997

Breast Cancer PathologySocioeconomic Issues
• Lower SES white women present with disproportionately more:– Advanced disease– Higher grade tumors within stage– Less ER+ tumors– Younger women (age 35 to 44)
Gordon Am.J.Epidemiol., 1995

Breast Cancer Gene-Environment Interaction
• Social deprivation studies in Europe and U.S. suggest more virulent ER negative tumors in the poor.
• Several studies suggest a correlation between higher body mass index and higher stage at presentation (higher BMI can be a cultural phenomenon).

Risk Factors for Cancer Death
• Among women diagnosed with a premenopausal breast cancer, a body mass index of >30 at diagnosis of cancer is a risk factor for breast cancer death HR 2.22 95% CI(1.45-3.40)
– Abrahamson et al, Ca Epi Biomarkers Prev 2006

Female Obesity Trends 1986 to 2003

Equal Treatment Yields Equal Outcome among equal patients?
• No racial differences in survival HR 1.08 95% CI (0.97-1.2) after adjusting for– Mammography screening– Tumor characteristics– Biologic markers– Treatment– Comorbidity– Demographics
• Curtis et al, Cancer 2008

Breast Cancer Quality of Care
• There are more than two dozen patterns of care studies to show racial disparities in care received. – Delayed treatment– No adjuvant chemotherapy– Dose reductions of chemotherapy– No hormonal therapy– No surgery– No radiation when it was appropriate
• The poor of all races also have similar patterns of care.

Breast Cancer Quality of Care
• In a SEER Study of more than 870 Blacks and 2430 Whites treated in 2000 to 2001
– Blacks were 4 to 5 fold more likely to get definitive treatment more than 60 days after initial consultation
– Of patient treated with lumpectomy 61% of Blacks and 72% of whites received radiation
– 7.5% of Blacks with clinically localized disease got no surgical therapy vs 1.5% of whites• Lund et al Breast Ca Res Treat, 2007

Breast Cancer Quality of Care
• In a study of women breast cancer patients aged 20 to 54, a higher proportion of Blacks had a greater than three month delay to treatment from initial consultation.
– 22.4% of Blacks
– 14.3% of Whites
• Gwyn et al, Cancer 2004

Breast Cancer Quality of Care
• Receipt of “minimum expect care” in SEER-Medicare data 1992-1999
• Blacks less likely 0.67 95% CI (.59-.76)
• Hispanics less likely 0.77 95% CI (.66-.90)
• Haggstrom, Cancer 2005

Multivariate Analysis of Initial Breast Cancer Chemotherapy Dose < 85% of Standard N = 737
Odds Ratio 95% CI
Normal BMI 1.00
Overweight 1.18 0.74 to 1.87 P=.65
Obese 2.47 1.36 to 4.51 P=.003
Severely obese 4.04 1.46 to 11.19 P=.007
Griggs et al, JCO v25, 2007

Multivariate Analysis of Initial Breast Cancer Chemotherapy Dose < 85% of Standard N = 737
Odds Ratio 95% CI
Education Less than High School
3.07 1.57 to 5.99 P=.001
Griggs et al, JCO v25, 2007
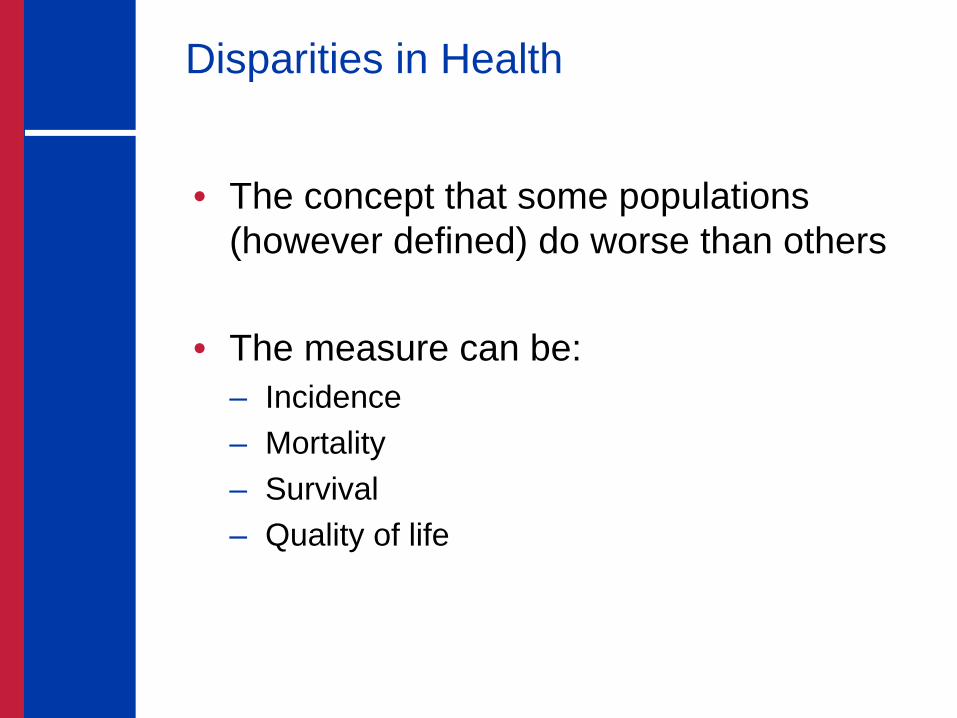
Multivariate Logistic Regression for BCa Treatment with Nonstandard Breast Cancer Regimen N=957
Odds Ratio 95% CI
College Graduate 1.00 _
High School Graduate 1.80 1.08 to 3.00 TrendP=.024
Less than High School 3.24 1.17 to 9.00
Black Race 1.93 1.11 to 3.36 P=.02
Controlling for geographic region, job category, employment status, insurance status
Griggs et al, JCO v 18, 2007

Breast CancerThe Reality
• From 1993 to 1997, 561 Black women died of breast cancer in Atlanta.
• If Atlanta’s Black population had the Department of Defense Health System Black rate, 330 would have died (231 less)
Breast CancerThe Reality
• In 2000, 7.5% of Black Women in Atlanta diagnosed with localized highly curable breast cancer did not receive a surgical removal of the tumor.
• Do we in science worry too much about differences in biology and not worry enough about realities of disparities in healthcare.

The Meaning of Race in Science and Medicine
• Differences in patterns of care by race documented in:– Prostate Cancer– Colon Cancer– Breast Cancer– Lung Cancer
• The full reasons for the differences have yet to be explained

Equal Treatment Yields Equal OutcomeThere is not Equal Treatment
• Studies suggest that disparities in treatment may be due to:
– Cultural differences in acceptance of therapy.
– Disparities in comorbid diseases making aggressive therapy inappropriate.
– Lack of convenient access to therapy.
– Racism and SES discrimination.

How Can We Provide Adequate High Quality Care (to Include Preventive Care) to a Population That Has So Often Not Received It?

Cancer Survival and Deprivation in Scotland
5yr survival Affluent Deprived
Breast 58% 48% Colon 40% 34%
Lymphoma 58% 42%Prostate 45% 36%Bladder 70% 58%
Melanoma 84% 69%

Survival Rates RMS TitanicConcept of Dr. Lisa Newman
First Class 60%
Second Class 43%
Third Class 20%

U.S. deaths avoided in one year (age 25-64) if everyone had the same death rate as the most educated?
• African American (Non-Hispanic)– Men 52% (28,216)– Women 33% (12,624)
• White (Non-Hispanic)– Men 48% (106,146)– Women 40% (55,134)
• Hispanic– Men 39% (9,337)– Women 30% (3,825)
A. Jemal ACS Epi Program

Trends in Obesity* Prevalence (%), By Gender, Adults Aged 20 to 74, US, 1960-2006†
*Obesity is defined as a body mass index of 30 kg/m2 or greater. † Age adjusted to the 2000 US standard population. Source: National Health Examination Survey 1960-1962, National Health and Nutrition Examination Survey, 1971-1974, 1976-1980, 1988-1994, 1999-2002, National Center for Health Statistics, Centers for Disease Control and Prevention, 2002, 2004. 2003-2004, 2005-2006: National Health and Nutrition Examination Survey Public Use Data Files, 2003-2004, 2005-2006, National Center for Health Statistics, Centers for Disease Control and Prevention, 2006, 2007.
1311
161512
1715
13
17
2321
26
3128
3433 323535 34
36
0
5
10
15
20
25
30
35
40
45
Both sexes Men Women
Prev
alen
ce (%
)
NHES I (1960-62) NHANES I (1971-74) NHANES II (1976-80) NHANES III (1988-94)NHANES 1999-2002 NHANES 2003-2004 NHANES 2005-2006

Trends in Obesity* Prevalence (%), Children and Adolescents, by Age Group, US, 1971-2006
*Body mass index (BMI) at or above the sex-and age-specific 95th percentile BMI cutoff points from the 2000 sex-specific BMI-for-age CDC Growth Charts. Note: Previous editions of Cancer Statistics used the term “overweight” to describe youth in this BMI category.Source: National Health and Nutrition Examination Survey, 1971-1974, 1976-1980, 1988-1994, 1999-2002, National Center for Health Statistics, Centers for Disease Control and Prevention, 2002, 2004. 2003-2006: Ogden CL, et al. High Body Mass Index for Age among US Children and Adolescents, 2003-2006. JAMA 2008; 299 (20): 2401-05.
54
65
75
7
11 1110
16 16
12
1718
0
5
10
15
20
2 to 5 years 6 to 11 years 12 to 19 years
Prev
alen
ce (%
)
NHANES I (1971-74) NHANES II (1976-80) NHANES III (1988-94)NHANES 1999-2002 NHANES 2003-2006

Otis W. Brawley, M.D.Chief Medical OfficerExecutive Vice PresidentAmerican Cancer Society
Professor of Hematology, Oncology, Medicine and
Epidemiology
Emory University