Embed Size (px)
Citation preview
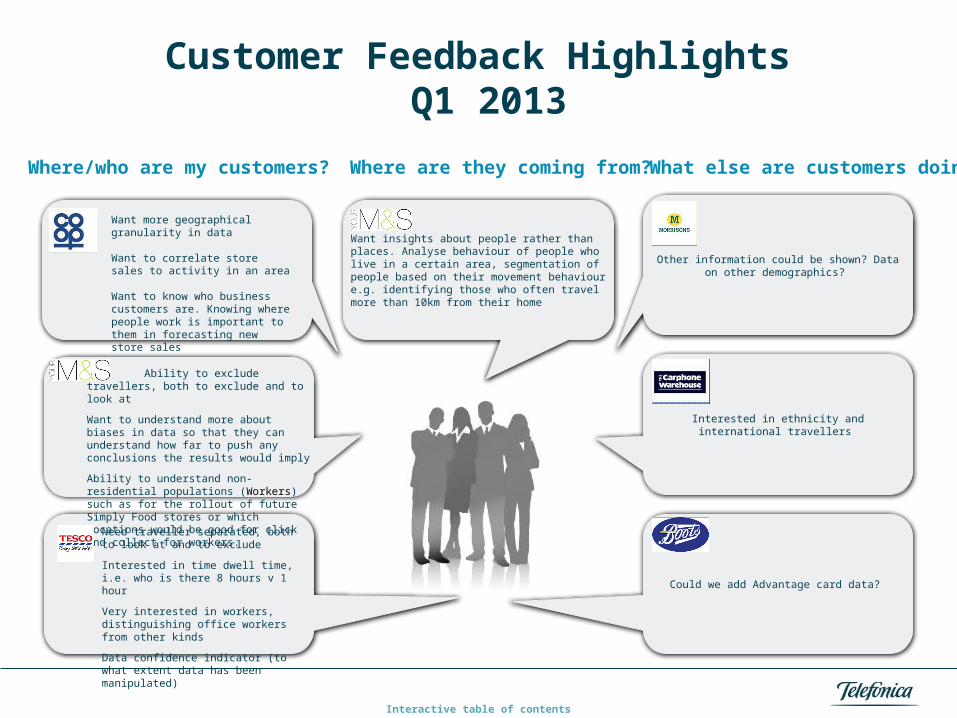
Other information could be shown? Data on other demographics?
Interested in ethnicity and international travellers
Could we add Advantage card data?
Want insights about people rather than places. Analyse behaviour of people who live in a certain area, segmentation of people based on their movement behaviour e.g. identifying those who often travel more than 10km from their home
What else are customers doing?Where are they coming from?Where/who are my customers?
Customer Feedback Highlights Q1 2013
Interactive table of contents
Want more geographical granularity in data
Want to correlate store sales to activity in an area
Want to know who business customers are. Knowing where people work is important to them in forecasting new store sales
Ability to exclude travellers, both to exclude and to look at
Want to understand more about biases in data so that they can understand how far to push any conclusions the results would imply
Ability to understand non-residential populations (Workers) such as for the rollout of future Simply Food stores or which locations would be good for click and collect for workers.
Need traveller separated, both to look at and to exclude
Interested in time dwell time, i.e. who is there 8 hours v 1 hour
Very interested in workers, distinguishing office workers from other kinds
Data confidence indicator (to what extent data has been manipulated)
After the prototype was deemed fit for purpose, it was taken out into the market to show to customers
Struggling understand numbers and what they represent.
Secondary supportive source of info rather than a decision-driving
data and insight for customers
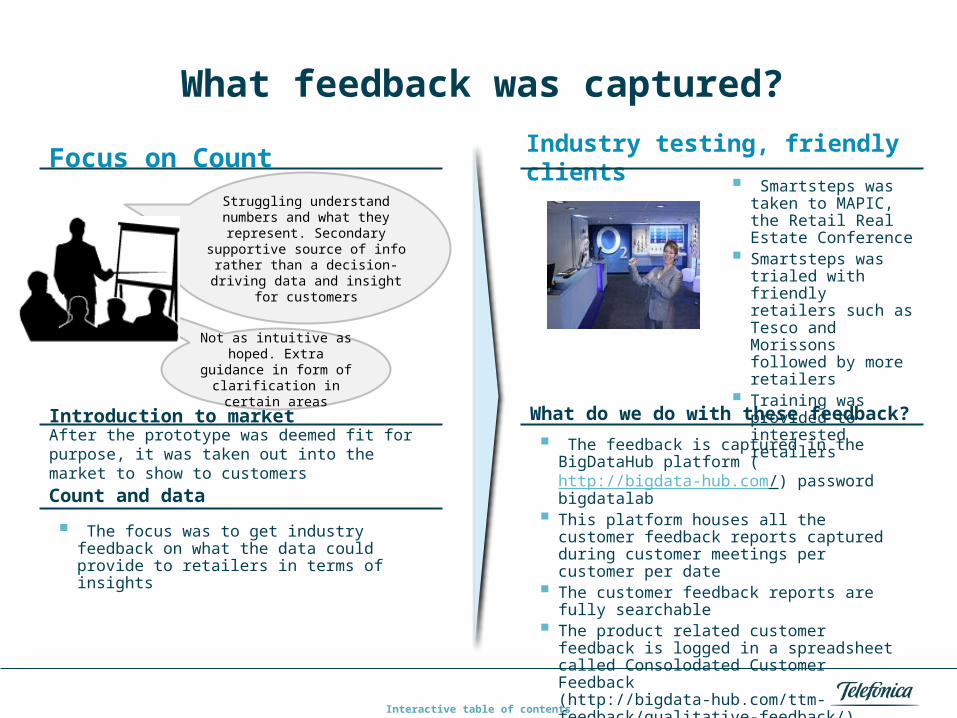
Focus on Count
Introduction to market
Industry testing, friendly clients Smartsteps was taken
to MAPIC, the Retail Real Estate Conference
Smartsteps was trialed with friendly retailers such as Tesco and Morissons followed by more retailers
Training was provided to interested retailers
The focus was to get industry feedback on what the data could provide to retailers in terms of insights
Count and data
Not as intuitive as hoped. Extra guidance in form of
clarification in certain areasWhat do we do with these feedback? The feedback is captured in the BigDataHub
platform (http://bigdata-hub.com/) password bigdatalab
This platform houses all the customer feedback reports captured during customer meetings per customer per date
The customer feedback reports are fully searchable
The product related customer feedback is logged in a spreadsheet called Consolodated Customer Feedback (http://bigdata-hub.com/ttm-feedback/qualitative-feedback/)
What feedback was captured?
Interactive table of contents
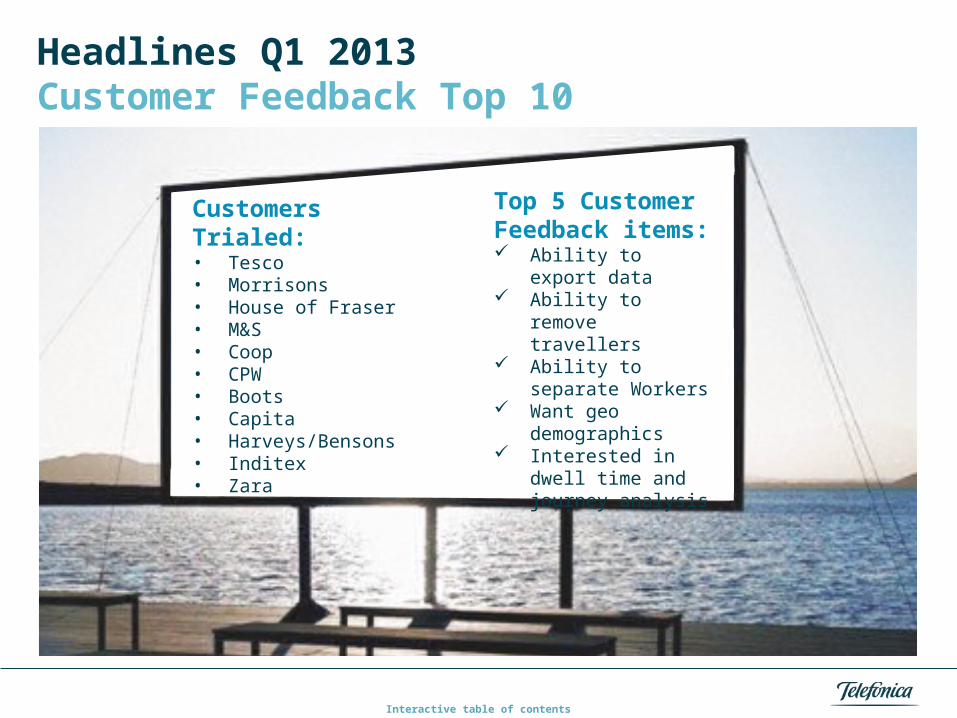
Headlines Q1 2013Customer Feedback Top 10
Interactive table of contents
Customers Trialed:• Tesco• Morrisons• House of Fraser• M&S• Coop• CPW• Boots• Capita• Harveys/Bensons• Inditex• Zara
Top 5 Customer Feedback items: Ability to export data Ability to remove
travellers Ability to separate
Workers Want geo
demographics Interested in dwell
time and journey analysis
High street stores interested in number of people walking past store, and want demograpraphic data. People who are travelling past in cars, or bus, taxi etc. are not of interest as they won‘t be entering their store. Hence need to separate out ‚transient‘ visitors, those who are travelling at a speed greater than 5 miles an hour.
Customers like the insights the product is providing and like that it is a one-stop-shop. They have access to similar insights, but from different sources and at a cost with time limitations. Want to have ability to use our data to verify against own data and to use it in decision making process for e.g. opening new stores.
Retailers want more information about the types of people who are passing their stores in terms of geo demographics. They want to know socioeconomic status, cultural background, household economic factors etc. We have to look at ways of broadening our insights by partnering with other companies for example or looking at other data sources. The lab is currently analysing combining locality spend data with our crowd data so that we can provide insights on how much people are spending in an area.
Retailers are interested in knowing the numbers of people who are working in the vicinity of a store, or future store. Workers buy lunch close to where they work or do a quick shop on the way home. The type of worker they are interested in is the office worker. This is a big market for them. Hence the need for data science work (in lab) to see how these workers can be split out. We also need to think about the best way to display this data.
Retailers are also telling us they want to know how long people are spending on the high street. They are interested in knowing if their store is in an area where people spend more time as well as benchmarking their store location against competitor stores. They also want to know what the popular routes are that people walk whilst shopping as well as the most frequently used travel routes to get to the store and where people are coming from. These are valuable insights which we want to be able to provide. They are being researched in the lab as complex data science algorithims need to be developed to give us this data.
What does this mean for productWhat did we learn?
Interactive table of contents