Embed Size (px)
Citation preview

OTC Derivatives Reforms: Considerations and Challenges
ESRC Conference on Diversity in MacroeconomicsMark Manning, Reserve Bank of Australia

Overview
• Policy motivation
• An initial contribution
− Methodology
− Exposures and collateral demands
− Financial stability under different clearing
structures
• Policy messages and future work

Policy Motivation
• Fundamental changes to core financial markets
− G20 financial reform agenda
− Strengthen risk management; reduce
interconnectedness
• Collateralisation and central clearing
− Trade-off between counterparty risk and liquidity
risk
− Encumbrance; funding and liquidity
• Assess implications for stability, market functioning
and real economic outcomes

Initial Contribution
• OTC Derivatives: Netting and Networks
− Joint work with Alex Heath and Gerard Kelly
• Simulation approach
− Static: Exposures and collateral demands
− Dynamic: Financial stability
• Flexible, but stylised
• Can examine a variety of clearing structures
• Stylised ‘world’: network structure; balance
sheets

Links to Literature
• Duffie and Zhu (2011)
− Model dealer exposures in alternative clearing
settings; consider fragmentation and un-netting
• Macroeconomic Assessment Group on Derivatives
(2013)
− Examine costs/benefits of G20 reforms: net long-
run impact on GDP
• Duffie (2014)
− Model collateral demand in alternative clearing
settings using bilateral CDS exposure data

Basic set-up
• Two agent types: banks (b) and investors (i)
• Core/Periphery network structure
• Draw derivative positions from a transaction matrix

Static Analysis: Exposure and Collateral
• Bilateral clearing:
• Central clearing, single CCP:
• Central clearing, separate CCPs:
• Mixed clearing:
• Split clearing: and
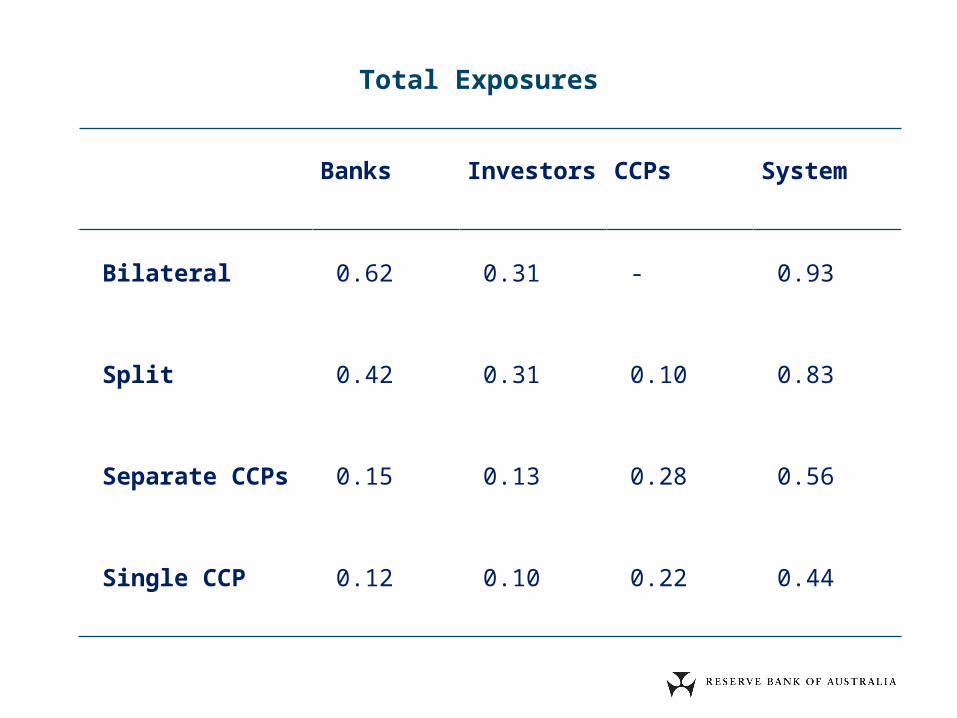
Banks Investors CCPs System
Bilateral 0.62 0.31 - 0.93
Split 0.42 0.31 0.10 0.83
Separate CCPs 0.15 0.13 0.28 0.56
Single CCP 0.12 0.10 0.22 0.44
Total Exposures

Changing the Size of the CoreExposure relative to notional outstanding
2 4 6 8 10 120
1
2
3
4
5
0
1
2
3
4
5
Number of banks
Single CCP
%
Separate CCPs
Bilateral
Split clearing
%

Changing the Directionality of the PeripheryExposure relative to notional outstanding
0 6 12 18 24 300
1
2
3
4
5
0
1
2
3
4
5
Number of directional investors
Single CCP
%
Separate CCPs
Bilateral
%

Dynamic Analysis: Networks (1)
Previous model extended by giving agents balance
sheets
• Banks and investors hold a composite ‘illiquid
asset’
• Can be sold/transformed into a ‘liquid asset’ to
meet collateral needs
• Liabilities comprise debt and equity for banks and
equity only for investors
− Both banks and investors can default due to
illiquidity; banks can also default due to
insolvency
Dynamic Analysis: Networks (2)
Models the dynamic interaction between derivative
exposure and other balance sheet items under
alternative clearing arrangements
• Focus is on how price shocks are transmitted to
balance sheets and how they may trigger liquidity
shortages or defaults
• Examines also the dynamics of collateral
transformation

Simulation and Timeline
Monte Carlo simulation with 70 000 iterations. Seven
steps:
• Populate transaction matrix
• Draw illiquid asset price change
• Draw derivative price change
• Calculate variation margin payment obligations
• Sell/transform illiquid assets to obtain liquidity for
variation margin payments; could trigger default
• Default could impose losses on others
• Update balance sheets

Bank Default and Collateral CoverageExpected number of defaults
Bilateral
50.00 69.15 84.13 93.32 97.72 99.38 99.87 99.985
6
7
8
9
10
5
6
7
8
9
10
Coverage level (%)
Mixed clearing
Single CCP
No No

Policy Messages
• The appropriate scope of central clearing and
collateralisation will depend on product and agent
characteristics
• There is likely to be an ‘optimal’ level of
collateralisation, which will vary with the structure
of clearing arrangements

Future Work
• Economic significance of the results
− Take the model to ‘real’ data
• Add richness to banks’ and investors’ balance
sheets
• Endogenise pricing and agents’ trading choices


![[ESRC][K55]TankGame Project](https://img.pdfslide.us/doc/110x75/577cd6c01a28ab9e789d27bf/esrck55tankgame-project.jpg)


![ESRC Report [English]](https://img.pdfslide.us/doc/110x75/577d1fa91a28ab4e1e910c34/esrc-report-english.jpg)