Embed Size (px)
Citation preview
on August 31, 2018http://rsif.royalsocietypublishing.org/Downloaded from
rsif.royalsocietypublishing.org
Research
Cite this article: Timmins LH, Molony DS,
Eshtehardi P, McDaniel MC, Oshinski JN,
Giddens DP, Samady H. 2017 Oscillatory wall
shear stress is a dominant flow characteristic
affecting lesion progression patterns and
plaque vulnerability in patients with coronary
artery disease. J. R. Soc. Interface 14:
20160972.
http://dx.doi.org/10.1098/rsif.2016.0972
Received: 4 December 2016
Accepted: 6 January 2017
Subject Category:Life Sciences – Engineering interface
Subject Areas:biomedical engineering, biomechanics,
bioengineering
Keywords:atherosclerosis, coronary artery disease,
computational fluid dynamics,
haemodynamics, intravascular ultrasound,
wall shear stress
Author for correspondence:Lucas H. Timmins
e-mail: [email protected]
†Now affiliated with the Department of
Bioengineering, University of Utah,
Salt Lake City, UT, USA.
& 2017 The Author(s) Published by the Royal Society. All rights reserved.
Oscillatory wall shear stress is a dominantflow characteristic affecting lesionprogression patterns and plaquevulnerability in patients with coronaryartery disease
Lucas H. Timmins1,2,3,†, David S. Molony2,3, Parham Eshtehardi2, MichaelC. McDaniel2, John N. Oshinski1,3, Don P. Giddens3 and Habib Samady2
1Department of Radiology and Imaging Sciences, and 2Division of Cardiology, Department of Medicine,Emory University School of Medicine, Atlanta, GA 30322, USA3Wallace H. Coulter Department of Biomedical Engineering, Georgia Institute of Technology and EmoryUniversity School of Medicine, Atlanta, GA 30322, USA
LHT, 0000-0002-8707-8120
Although experimental studies suggest that low and oscillatory wall shear
stress (WSS) promotes plaque transformation to a more vulnerable phenotype,
this relationship has not been examined in human atherosclerosis progression.
Thus, the aim of this investigation was to examine the association between
oscillatory WSS, in combination with WSS magnitude, and coronary athero-
sclerosis progression. We hypothesized that regions of low and oscillatory
WSS will demonstrate progression towards more vulnerable lesions, while
regions exposed to low and non-oscillatory WSS will exhibit progression
towards more stable lesions. Patients (n ¼ 20) with non-flow-limiting coronary
artery disease (CAD) underwent baseline and six-month follow-up angio-
graphy, Doppler velocity and radiofrequency intravascular ultrasound
(VH-IVUS) acquisition. Computational fluid dynamics models were con-
structed to compute time-averaged WSS magnitude and oscillatory WSS.
Changes in VH-IVUS-defined total plaque and constituent areas were quanti-
fied in focal regions (i.e. sectors; n ¼ 14 235) and compared across
haemodynamic categories. Compared with sectors exposed to low WSS mag-
nitude, high WSS sectors demonstrated regression of total plaque area
( p , 0.001) and fibrous tissue ( p , 0.001), and similar progression of necrotic
core. Sectors subjected to low and oscillatory WSS exhibited total plaque area
regression, while low and non-oscillatory WSS sectors demonstrated total
plaque progression ( p , 0.001). Furthermore, compared with low and
non-oscillatory WSS areas, sectors exposed to low and oscillatory WSS demon-
strated regression of fibrous ( p , 0.001) and fibrofatty ( p , 0.001) tissue and
similar progression of necrotic core ( p ¼ 0.82) and dense calcium ( p ¼ 0.40).
Herein, we demonstrate that, in patients with non-obstructive CAD, sectors sub-
jected to low and oscillatory WSS demonstrated regression of total plaque,
fibrous and fibrofatty tissue, and progression of necrotic core and dense
calcium, which suggest a transformation to a more vulnerable phenotype.
1. IntroductionDespite genetic and systemic risk factors, coronary atherosclerotic lesions are dis-
cretely distributed within the epicardial coronary vessels [1] with a predilection
towards focal sites of complex haemodynamics, i.e. regions exposed to low time-
averaged magnitude and temporally oscillatory wall shear stress (herein, low and
oscillatory WSS) [2,3]. WSS is a spatially localized vector quantity, defined by
both magnitude and direction, that is time-varying due to the pulsatile nature
VH-IVUSimageslumen
clinical data
angiography
VH-IVUS imaging
haemodynamics
catheter
geometry reconstruction computational mesh
flowextension
main body
quantify haemodynamicparameters
calculate flow field
velocity vectorswall shear stress
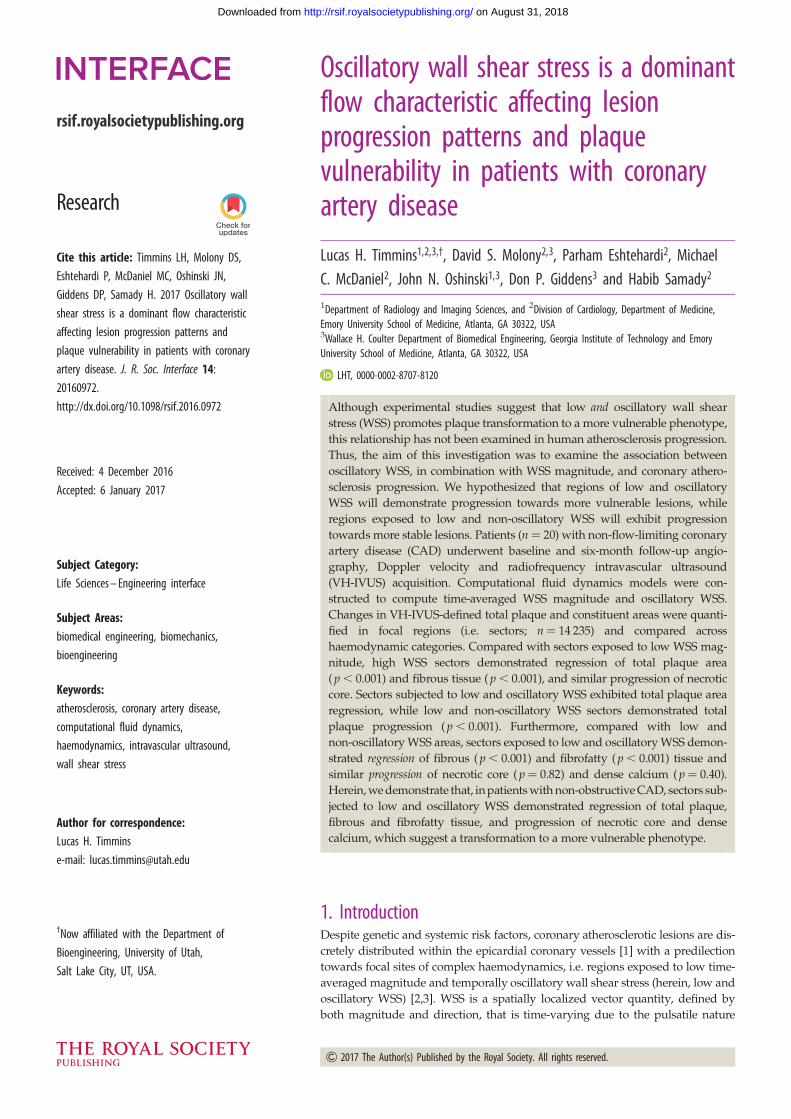
Figure 1. Schematic of the presented study. Multi-modal clinical imaging data and intracoronary haemodynamic measures were collected in the cardiac cathe-terization laboratory. The imaging data were used to construct the 3D lumen geometry, flow extensions were added and the geometry discretized. Acquired patient-specific haemodynamic data were prescribed as boundary conditions, and pulsatile simulations were performed to evaluate the flow field. These computed data werepost-processed to quantify the haemodynamics metrics of interest (e.g. wall shear stress).
rsif.royalsocietypublishing.orgJ.R.Soc.Interface
14:20160972
2
on August 31, 2018http://rsif.royalsocietypublishing.org/Downloaded from
of arterial blood flow. Thus, complete evaluation of the local
blood flow environment requires characterization of vector
magnitudes and directional changes across the cardiac cycle.
In vitro studies have demonstrated that low and oscillatory
WSS creates a pro-atherogenic environment for lesion develop-
ment mediated through altered endothelial cell gene
expression [4] and function [4,5]. Furthermore, a recent porcine
study reported that regions exposed to low and oscillatory
WSS resulted in the formation of advanced atherosclerotic
plaques, including thin cap fibroatheromas (TCFAs) [6].
Clinical studies have demonstrated plaque progression in
coronary segments exposed to low time-averaged WSS mag-
nitude [7,8] and increased plaque vulnerability in regions of
high WSS [7]. However, the impact of oscillatory WSS and
the co-localization of regions of low and oscillatory WSS
has not been investigated in the clinical setting of plaque pro-
gression. We hypothesized that co-localized regions of low
and oscillatory WSS will exhibit progression of necrotic core
with regression of total plaque and fibrous tissue area, sugges-
tive of greater plaque vulnerability, while regions exposed to
low and non-oscillatory WSS will demonstrate progression of
total plaque and fibrous tissue area, suggestive of progression
towards more stable lesions. Accordingly, we employed our
recently developed framework [9], which allows for the focal
quantification of coronary haemodynamics and plaque pro-
gression, to investigate the relationship between oscillatory
WSS in combination with WSS magnitude and coronary artery
disease (CAD) progression in patients with non-obstructive
CAD treated with optimal medical therapy.
2. Material and methods2.1. Study population and clinical data acquisitionPatients (n ¼ 20) enrolled in a prospective study evaluating the
association between WSS and radiofrequency intravascular ultra-
sound (i.e. virtual histology–intravascular ultrasound; VH-IVUS)
defined plaque progression were included in this investigation
[7]. Patients presenting with an abnormal non-invasive stress test
or stable angina and determined to have a non-obstructive
lesion requiring physiological evaluation were enrolled. Patients
underwent baseline and six-month follow-up biplane angio-
graphic and IVUS image (phased-array 20 MHz Eagle Eyew
Gold Catheter; Volcano Corp., San Diego, CA, USA) acquisition
(figure 1). Electrocardiogram-gated greyscale and radiofrequency
data were continuously acquired (0.5 mm s21 motorized pullback)
from the distal left anterior descending (LAD) coronary artery up
to the guide catheter in the aorta, sampling approximately 60 mm
of the proximal vessel and stored for offline analysis. Doppler-
derived velocity data were acquired in the left main (LM) coronary
arteries with a 0.01400 (0.3556 mm) monitoring guidewire
(ComboWire; Volcano Corp.). Lipid profiling was performed at
baseline and follow-up, and patients received optimal medical
therapy for cardiovascular risk factors, including 80 mg atorvasta-
tin daily. Emory University’s Institutional Review Board approved
the study and each patient provided informed consent.
2.2. Anatomical reconstruction and computational fluiddynamics modelling
The end-diastolic three-dimensional (3D) coronary geometry was
constructed by fusion of angiographic views and lumen contours
segmented from IVUS images as previously described [7,9].
Biplane angiographic images of the IVUS catheter in its most
distal position in the LAD prior to pullback were acquired. The
3D spatial position of the catheter was determined via back-
projection image analysis (QAngio XA 3D RE; Medis, Lieden,
The Netherlands) and served as the backbone for vessel recon-
struction. An experienced IVUS reader segmented the lumen
and external elastic membrane (EEM) contours from each
frame of the IVUS pullback (echoPlaque 4.0; INDEC Medical
Systems, Santa Clara, CA, USA). Contours were stacked perpen-
dicular to the catheter centreline at specific locations determined
by the catheter pullback speed and identified time step of each
image (figure 1). As a result of catheter torsion during the pull-
back, the relative orientation of each contour was quantified by
the sequential triangulation algorithm derived from differential
geometry [10]. Major coronary branching vessels (e.g. left

wall shear stress magnitude(time-averaged WSS)
dynes cm–2
50
40
30
20
10
0
degrees
0
40
80
120
160
oscillatory wall shear stress(wall shear stress angle deviation; WSSAD)
low and oscillatory wall shear stress(WSS < 10 dynes cm–2 and oscillatory WSS > 90°)
yesno
B
A
location A(low WSS; high oscill. WSS)
30°
210°
60°
240°
90°
270°
120°
300°
150°
180° 0°
330°
location B(inter. WSS; low oscill. WSS)
instantaneousWSS vectors
time-averagedWSS vector
20
40
60
246810
Figure 2. Example time-averaged WSS (magnitude), oscillatory WSS and co-localized regions of low WSS and high oscillatory WSS (i.e. low and oscillatory WSS)distributions. Polar plots indicate the time-varying changes in WSS magnitude and direction throughout the cardiac cycle; 08 indicates the time-averaged WSS vectordirection. Note the large variation in instantaneous WSS vector directions (high oscillatory WSS) and low WSS magnitudes in a region immediately near branchingvessels (location A), while WSS vectors have a uniform direction (low oscillatory WSS) with instantaneous magnitudes . 50 dynes cm22 in a straight segment notnear a coronary branch (location B).
rsif.royalsocietypublishing.orgJ.R.Soc.Interface
14:20160972
3
on August 31, 2018http://rsif.royalsocietypublishing.org/Downloaded from
circumflex, diagonal, septal coronary arteries) were included in
the reconstructions through extraction of diameter and orien-
tation information from angiographic and IVUS data.
Incorporation of branch vessels in the computational geometry
is critical to ensure correct flow rates in distal vessels through
branching flow divisions, and to avoid incorrectly high flow
rates (and WSS values) in these distal regions [11]. The
reconstruction algorithm resulted in an anatomically correct 3D
geometry of the indexed coronary artery.
Computational fluid dynamics (CFD) techniques were
employed, as described previously in detail [9], to quantify the
patient-specific haemodynamic environment and quantify WSS
metrics throughout the reconstructed artery (figure 1). Briefly,
a surface was fitted to the reconstructed lumen surface

chan
ge in
are
a (m
m2 )
0.3
0.2
0.1
–0.1
–0.2
–0.3
–0.4
fibroustotal plaque
fibro-fattynecrotic coredense calcium
0
S1 S2 S3 S4 S5 S6 S7 S8sector number
S3
S4 S1
S2
S6
S5
S7
S8
S3
S4 S1
S2
S6
S5
S7
S8
baselineimage
co-registeredfollow-up image
(a)
(b)
Figure 3. Evaluation of focal coronary artery disease progression. (a) Baselineand co-registered follow-up images divided into focal regions (sectors).(b) Quantification of focal (sector) changes in total plaque and VH-IVUS-definedconstituent areas. (Online version in colour.)
rsif.royalsocietypublishing.orgJ.R.Soc.Interface
14:20160972
4
on August 31, 2018http://rsif.royalsocietypublishing.org/Downloaded from
(Geomagic Studio 11; Geomagic, Inc., Research Triangle Park,
NC, USA) and flow extensions were added to the inlet (one
diameter) and outlets (seven diameters). Preliminary investi-
gations confirmed that the inlet extension length allowed
viscous effects to slightly develop the spatially uniform velocity
profile into a blunted profile at the coronary main body
(figure 1), which agrees with experimental observations [3],
and that outlet extension length was sufficiently long not to
affect the flow field in the region of interest (coronary main
body) and for flow to be fully developed at all outlets [7]. The
volume was discretized with tetrahedral and prismatic elements,
which were located adjacent to the lumen boundary, and the
average mesh size was approximately 1.2 million elements per
computational domain (ICEM CFD, ANSYS 15; Ansys, Inc.,
Canonsburg, PA, USA). The computational mesh was imported
into a commercial software package (Fluent 15; ANSYS 15) to
numerically solve the Navier–Stokes and continuity equations.
Patient-specific pulsatile velocity values were extracted from
Doppler data acquired in the LM coronary artery and applied
as a series of spatially uniform profiles (i.e. plug flow) at the
inlet. All outlets were assumed pressure-free (traction-free). Pre-
liminary validation studies were performed to confirm that
application of a pressure-free boundary condition reproduced
the in vivo haemodynamic environment, as quantified with inva-
sive intracoronary measurements, throughout the coronary
territory of interest. Blood was assumed to be an incompressible
Newtonian fluid (r ¼ 1.06 g cm23, m ¼ 3.5 cP). Following sol-
ution convergence, flow-field data were post-processed to
quantify instantaneous WSS vectors at all surface nodes. Vector
WSS magnitudes were temporally averaged across the cardiac
cycle (i.e. time-averaged WSS; figure 2). Temporal oscillatory WSS
was quantified at time points (n) throughout the cardiac cycle by
the WSS angle deviation (WSSAD) [12], which is defined as
WSSADn ¼ arccosti � tj
jtij � jtjj
� �,
where ti and tj are the instantaneous and time-averaged WSS vec-
tors, respectively. At each node, the maximum WSSAD across the
cardiac cycle was used to characterize the oscillatory haemodynamic
environment (figure 2). Previously analysis demonstrated solution
independence from the mesh resolution, as sector time-averaged
WSS values were less than 4% when mesh volume size was reduced
by 50% (3.75� initial mesh size) [9]. Note that oscillatory shear index
(OSI) [2] values were not quantified due to a lack of a predominant
axial direction in the coronary arteries and the difficulty in defining
a positive flow direction in a model with multiple outlets; however,
analogous to OSI, WSSAD quantifies the deviation of an instan-
taneous WSS vector (or vector components) from the temporal
mean vector (WSSAD . 908 � OSI . 0).
Given the positive correlation previously reported bet-
ween low and oscillatory WSS and atherogenesis [2,3,13],
haemodynamic data were categorized, based on previous exper-
imental [5,14] and clinical studies [7,8], to identify sectors
exposed to this WSS environment. Time-averaged WSS
magnitude values were defined as low (,10 dynes cm22), inter-
mediate (10–25 dynes cm22) or high (.25 dynes cm22), and
oscillatory WSS (i.e. WSSAD) values were categorized as low
(,458), intermediate (45–908) or high (.908). Note that an oscil-
latory WSS value . 908 indicates that flow reversal occurred
during the cardiac cycle (i.e. an instantaneous WSS vector was
directed in the opposite direction of the time-averaged WSS
vector; figure 2, location A), which is a flow characteristic com-
monly observed in regions of atherosclerosis development [2],
and high oscillatory WSS largely occurs in a low time-averaged
WSS environment, where fluid momentum is low and flow direc-
tional changes are possible. Finally, sectors were identified that
exhibited both low time-averaged WSS magnitude and high
oscillatory WSS values (i.e. low and oscillatory WSS; figure 2).
2.3. Focal plaque progression and haemodynamicsanalysis
VH-IVUS data were derived from offline analysis of each
acquired image (echoPlaque 4.0; INDEC Medical Systems).
Briefly, VH-IVUS is an imaging technique that uses an auto-
mated plaque tissue classification scheme, which identifies
fibrous, fibrofatty, necrotic core and dense calcium tissues, to
create tissue maps (see figures 1 and 3) from spectral analysis
of the IVUS backscatter data [15]. The imaging modality has
been validated in ex vivo and in vivo studies [16,17], and
employed in several prospective clinical trials to evaluate the
prognostic accuracy of VH-IVUS-defined plaque phenotypes
for major adverse cardiac events [18,19]. Acquired image data
were analysed, in accordance with consensus documents [20],
by a single experienced investigator, who demonstrated strong
reproducibility for total plaque and necrotic core areas [7,21].
Serial imaging data were co-registered in the axial and circum-
ferential directions to quantify changes in total plaque and
constituent (fibrous tissue, fibrofatty tissue, necrotic core and
dense calcium) areas. An experienced analyst manually co-
registered the baseline and follow-up images in the axial
direction with the aid of fiduciary anatomic landmarks [7]. Sub-
sequently, paired axial images were automatically co-registered
in the circumferential direction by employing a multi-variate
normalized cross-correlation algorithm, which has been verified
and validated across multiple lesion types [22]. Images were
divided into eight sectors (458 intervals), and VH-IVUS-derived
total plaque and constituent areas were quantified in each
sector (figure 3a). Area changes were determined by taking
the difference in values between corresponding sectors in co-
registered images (figure 3b). Progression was defined as a
positive change in plaque or constituent area from baseline to
follow-up, while regression was defined as a negative change.
Note that, because VH-IVUS images are acquired at approxi-
mately 0.5 mm intervals, plaque progression in the axial
direction, between consecutive images, is not captured. Note,
S4 S1S2S3
S5S6 S7
S80
20
40
60
80
excluded sectorsthat lie in branchS1
S2S3S4
S5S6 S7
S8
15
10
5
0
30
25
20
35
40
45cross-section C
151050
302520
354045
50
WSS
(dy
nes
cm–2
)
WSS
(dy
nes
cm–2
)
cross-section B
S1 S2 S3 S4 S5 S6 S7 S8sector number
S1 S2 S3 S4 S5 S6 S7 S8sector number
0
20
40
60
80
time-averaged WSS magnitude
0
30
60
90
180
120
150
WSS
AD
(de
gree
s)
5
0
15
10
20
25cross-section C
WSS
AD
(de
gree
s)
60
40
20
0
120
100
80
140
160
180cross-section B
oscillatory WSS
branchlocation
branchlocation
WSS(dynes cm–2)
WSS(dynes cm–2)
S1 S2 S3 S4 S5 S6 S7 S8sector number
S1 S2 S3 S4 S5 S6 S7 S8sector number
WSSAD(degrees)
(a)
(b)
(c)
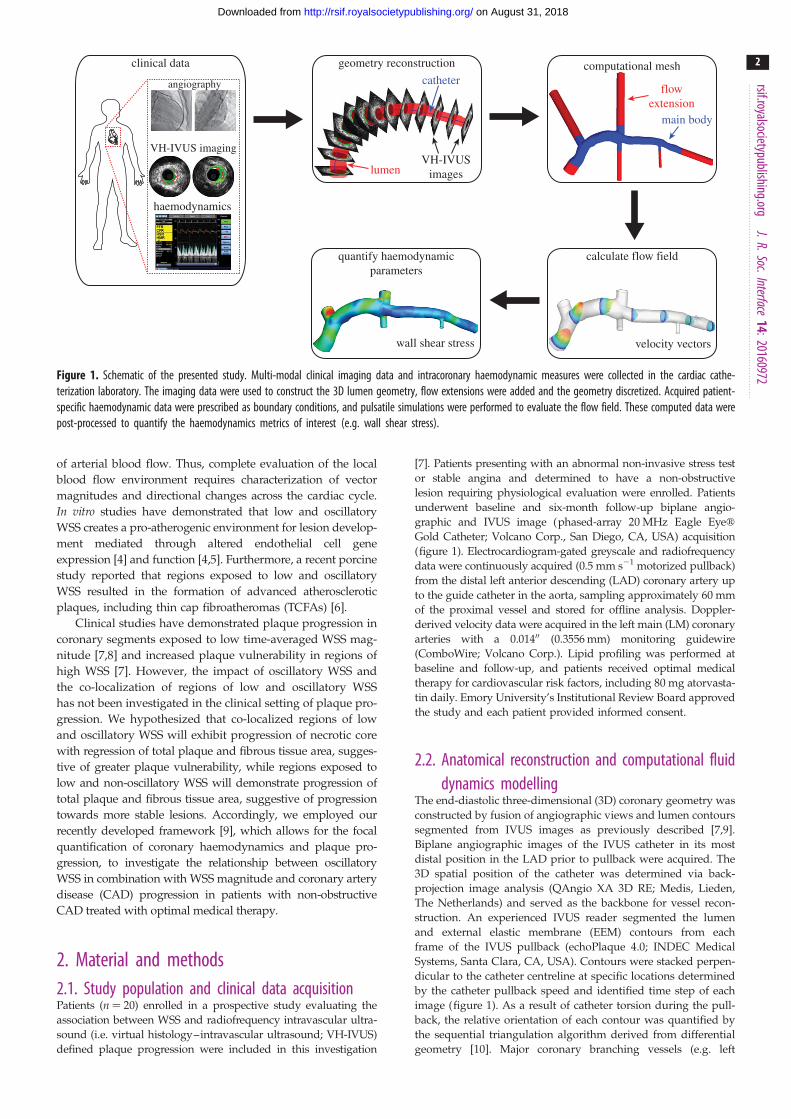
Figure 4. Quantification of the focal haemodynamic environment. (a) WSS data are extracted from the computational geometry at the location of the VH-IVUSimages. (b,c) Time-averaged WSS magnitude and oscillatory WSS data are divided up into sectors, and values are averaged within each sector. Sectors with nodeswithin branching vessels were excluded from the analysis.
rsif.royalsocietypublishing.orgJ.R.Soc.Interface
14:20160972
5
on August 31, 2018http://rsif.royalsocietypublishing.org/Downloaded from
too, that because changes in plaque areas are evaluated in focal
regions, which cover approximately one-eighth of the artery cir-
cumference, reported values are an order of magnitude less than
if evaluated around the complete circumference [7].
The spatial location of each VH-IVUS image was identified in
the computational geometry, and values of WSS magnitude and
oscillation were extracted at these locations and divided into
equivalent sectors (figure 4a). Thus, each sector had one value
each for time-averaged WSS magnitude, oscillatory WSS and
changes in total plaque and VH-IVUS-derived constituent
areas. Sectors that resided within a branching vessel were
excluded from the analysis; however, other sectors within that
cross-section were included (figure 4b,c). Furthermore, only
data in the LAD were included in the analysis, due to the difficul-
ties associated with co-registering VH-IVUS images in the LM
coronary artery, and imaging data were excluded if accurate

Table 1. Patient demographic and clinical characteristics. Continuous dataare reported as median (interquartile range). CAD, coronary artery disease.
characteristic all patients (n 5 20)
age (years) 54 (46 – 68)
male, n (%) 13 (65)
white, n (%) 14 (70)
body mass index (kg m21) 30 (27 – 36)
hypertension, n (%) 14 (70)
current smoking, n (%) 5 (25)
diabetes mellitus, n (%) 7 (35)
family history of CAD, n (%) 8 (40)
previous myocardial infarction, n (%) 2 (10)
coronary flow reserve 2.35 (2.03 – 2.59)
fractional flow reserve 0.90 (0.82 – 0.96)
baseline lipid profile
total cholesterol (mg dl21) 186.0 (168.0 – 212.5)
triglycerides (mg dl21) 115.5 (83.5 – 158.8)
high-density lipoprotein (mg dl21) 39.5 (33.3 – 52.8)
low-density lipoprotein (mg dl21) 118.5 (105.3 – 140.5)
C-reactive protein (mg l21) 2.7 (1.5 – 7.2)
follow-up lipid profile
total cholesterol (mg dl21) 139.0 (124.3 – 151.3)
triglycerides (mg dl21) 107.0 (75.8 – 138.8)
high-density lipoprotein (mg dl21) 42.5 (31.3 – 57.3)
low-density lipoprotein (mg dl21) 70.5 (54 – 87.5)
low WSS andoscillatory WSS
intermediatelow
high
time-averagedWSS
oscillatoryWSS
perc
enta
ge o
f se
ctor
s
inter. oscillationlow oscillation
high oscillation90 14
12
10
8
6
4
2
0
80
70
60
50
40
30
20
10
0
(a) (b)
Figure 5. Distribution of sectors across haemodynamic classifications. (a) Time-averaged WSS and oscillatory WSS categories. (b) Co-localization of lowtime-averaged WSS and oscillatory WSS categories. (Online version in colour.)
rsif.royalsocietypublishing.orgJ.R.Soc.Interface
14:20160972
6
on August 31, 2018http://rsif.royalsocietypublishing.org/Downloaded from
axial and circumferential co-registration could not be perfor-
med (e.g. mismatch of baseline and follow-up images
acquired between identified landmarks, poor circumferential
co-registration correlation value [22]).
2.4. Statistical analysisContinuous data are reported as mean+ s.d. or median and
interquartile range as appropriate. Categorical variables are pre-
sented as counts and proportions. To correct for systematic error,
introduced due to repeated measures within subjects, a random-
effects ANOVA was employed. p-values were adjusted for
multiple comparisons with the method of Scheffe. All statistical
tests were two-tailed, and p-values were derived from com-
parisons between haemodynamic categories. p , 0.05 was
established as the level of statistical significance. Statistical ana-
lyses were performed using the statistical package SPSS (v. 21;
IBM Corp., Armonk, NY, USA).
3. ResultsBaseline and follow-up data were evaluated in the proximal
LAD of 20 patients. No adverse clinical events occurred in
the enrolled patient cohort during the study. Baseline demo-
graphic and clinical characteristics of the study cohort are
presented in table 1. A total of 1840 serial VH-IVUS image
pairs (median: 107; Q1–Q3: 63–122 per artery; 31.5–61 mm)
were analysed and divided into 14 235 sectors (median: 792;
Q1–Q3: 495–955 per artery) to examine the focal relationship
between baseline haemodynamics and six-month changes in
plaque area and composition. Sectors were distributed across
the three time-averaged WSS classifications with 22%, 42%
and 36% sectors in the low, intermediate and high time-
averaged WSS classifications, respectively (figure 5a), with
average values of 6.59+2.00, 16.67+4.21 and 45.24+20.55 dynes cm22, respectively ( p , 0.0001, table 2). Sectors
were largely exposed to low oscillatory WSS with 83%, 7%
and 10% of sectors in the low, intermediate and high oscillatory
WSS categories, respectively (figure 5a). Furthermore, low
time-averaged WSS magnitude co-localized with high oscil-
latory WSS (i.e. low and oscillatory WSS) in 7% of sectors
and low oscillatory WSS (i.e. low and non-oscillatory WSS)
in 13% of sectors (figure 5b). Baseline VH-IVUS image charac-
teristics stratified by haemodynamic classifications are
presented in tables 2 and 3.
3.1. High time-averaged wall shear stress magnitudeleads to total plaque area regression and necroticcore progression
Baseline time-averaged WSS magnitude greatly influenced
total plaque area progression and changes in VH-IVUS-
derived plaque constituent areas over the six-month
follow-up. Sectors subjected to low WSS magnitude demon-
strated a trend towards an increase in total plaque area
(0.007+0.010 mm2), which was significantly different from
the progression patterns observed in areas of intermediate
(20.032+0.006 mm2; p , 0.001) and high WSS (20.028+0.007 mm2; p , 0.001), both of which exhibited a decrease
in total plaque area ( p ¼ 0.64; figure 6a). Evaluation of
changes in plaque constituent areas revealed that sectors
exposed to low WSS magnitude exhibited a significant
increase in necrotic core ( p , 0.001) and dense calcium
( p , 0.05) area compared with areas of intermediate WSS
(figure 6b). However, no significant change in fibrous tissue
area was observed in the low WSS group, while significant
regression occurred in the intermediate WSS group ( p ,
0.001). Comparison of changes in constituent areas between
intermediate and high WSS magnitude sectors revealed
greater progression of necrotic core ( p , 0.001) and dense

Table 2. Baseline VH-IVUS data stratified by haemodynamic classifications. Data are reported as mean+ s.d. WSS, wall shear stress.
low WSS intermediate WSS high WSS p-valuea
sectors, n 3127 5964 5144
WSS magnitude (dynes cm22) 6.59+ 2.00 16.67+ 4.21 45.24+ 20.55 ,0.0001
oscillatory WSS (8) 56.14+ 56.99 23.12+ 33.18 11.65+ 17.66 ,0.0001
plaque area (mm2) 0.40+ 0.53 0.43+ 0.58 0.49+ 0.66 0.11
fibrous area (mm2) 0.25+ 0.34 0.26+ 0.36 0.28+ 0.38 0.52
fibrofatty area (mm2) 0.05+ 0.11 0.04+ 0.01 0.06+ 0.14 0.02
necrotic core (mm2) 0.07+ 0.15 0.09+ 0.17 0.11+ 0.18 0.08
dense calcium (mm2) 0.03+ 0.11 0.04+ 0.01 0.05+ 0.12 0.13aDerived from comparison across three WSS categories.
Table 3. Baseline VH-IVUS data stratified by oscillatory WSS classifications in low time-averaged WSS magnitude sectors. Data are reported as mean+ s.d.WSS, wall shear stress.
low WSS magnitude andlow oscillatory WSS
low WSS magnitude andintermediate oscillatory WSS
low WSS magnitude andhigh oscillatory WSS p-valuea
sectors, n 1785 413 929
WSS (dynes cm22) 6.98+ 1.86 6.17+ 2.05 6.02+ 2.08 ,0.0001
oscillatory WSS (8) 12.42+ 10.96 67.53+ 13.23 135.08+ 25.62 ,0.0001
plaque area (mm2) 0.25+ 0.40 0.45+ 0.56 0.66+ 0.64 0.001
fibrous area (mm2) 0.17+ 0.26 0.25+ 0.33 0.41+ 0.42 ,0.0001
fibrofatty area (mm2) 0.03+ 0.09 0.05+ 0.16 0.07+ 0.13 0.01
necrotic core (mm2) 0.04+ 0.10 0.09+ 0.16 0.13+ 0.20 0.21
dense calcium (mm2) 0.01+ 0.05 0.06+ 0.15 0.05+ 0.15 0.60aDerived from comparison across three haemodynamic categories.
rsif.royalsocietypublishing.orgJ.R.Soc.Interface
14:20160972
7
on August 31, 2018http://rsif.royalsocietypublishing.org/Downloaded from
calcium ( p , 0.001) in sectors exposed to high WSS. Similar
to sectors exposed to low WSS, high WSS sectors demon-
strated necrotic core progression (0.008+0.004 versus
0.015+0.004 mm2; p , 0.05); however, sectors subjected to
high WSS demonstrated greater regression of fibrous tissue
than low WSS sectors (20.031+0.006 versus 20.002+0.007 mm2; p , 0.001).
3.2. Coincidence of low and oscillatory wall shear stresspromotes total plaque area regression and necroticcore progression
In a low time-averaged WSS magnitude environment, the
presence or absence of oscillatory WSS resulted in distinct
VH-IVUS-defined plaque progression patterns over six
months. Sectors exposed to low and oscillatory WSS demon-
strated total plaque area regression (20.026+0.020 mm2),
while areas of low and non-oscillatory WSS exhibited an
increase in total plaque area (0.028+ 0.010 mm2; p , 0.001;
figure 7). Examination of changes in VH-IVUS-defined con-
stituent areas revealed that low and oscillatory WSS was
associated with a significant decrease in fibrous ( p , 0.001)
and fibrofatty ( p , 0.001) tissue areas when compared
with sectors subjected to low and non-oscillatory WSS
(figure 7), with similar progression of necrotic core ( p ¼0.82) and dense calcium ( p ¼ 0.40). Figure 8 presents repre-
sentative IVUS images that include sectors exposed to
baseline haemodynamic values across the haemodynamic
classifications, as well as the co-registered follow-up image
and the sector progression values.
4. DiscussionThis is the first clinical study to investigate the effect of
low and oscillatory WSS on plaque progression and trans-
formation in patients with CAD treated with optimal
medical therapy. We observed that sectors exposed to low
and oscillatory WSS were associated with regression of total
plaque, fibrous and fibrofatty tissue area, but progression of
necrotic core and dense calcium, whereas sectors subjected
to low and non-oscillatory WSS demonstrated progression
of total plaque, fibrous tissue, necrotic core and calcium
and regression of fibrofatty tissue (figure 7). Similarly, high
time-averaged WSS magnitude demonstrated plaque
regression, as well as progression of necrotic core and
dense calcium (figure 6).
Our results are consistent with previous clinical studies
reporting that baseline low WSS magnitude promotes total
plaque area progression and high WSS leads to plaque area
reduction [7,8,23]. However, these studies employed spatially
averaged haemodynamic data, either around the lumen cir-
cumference or within a coronary segment, thus limiting the
range of WSS values evaluated and the focal nature of these
data. Employing a developed framework that allows for the

chan
ge in
tota
l pla
que
area
(m
m2 )
chan
ge in
pla
que
area
(m
m2 )
low WSS
(<10 dynes cm–2)
inter. WSS
(10–25 dynes cm–2)
high WSS
(>25 dynes cm–2)
p < 0.001
p = 0.64
p < 0.001
fibroustotal plaque
fibro-fattynecrotic coredense calcium
low WSS inter. WSS high WSS
*
*
*
*
#
0.02
0.01
0
–0.01
–0.02
–0.03
–0.04
#
0.02
0.01
0
–0.01
–0.02
–0.03
–0.04
(a)
(b)
Figure 6. Changes in plaque area in low, intermediate and high time-averaged WSS sectors over six months. (a) Total plaque area. (b) VH-IVUS-derived plaqueconstituents. Sectors exposed to intermediate or high WSS were associated with a decrease in total plaque area, while sectors exposed to high WSS sectors demon-strated an increase in necrotic core and dense calcium. Error bars are 95% CIs. p , 0.05: low versus intermediate (*), intermediate versus high (#) and low versushigh WSS (†).
rsif.royalsocietypublishing.orgJ.R.Soc.Interface
14:20160972
8
on August 31, 2018http://rsif.royalsocietypublishing.org/Downloaded from
examination of the focal association between haemodynamics
and VH-IVUS-defined plaque progression (figures 3 and 4),
our observations confirm that WSS magnitude modulates
changes in total plaque size and VH-IVUS-defined constitu-
ent areas. Further, we now demonstrate for the first time in
humans that oscillatory WSS significantly affects CAD pro-
gression patterns. Notably, our data indicate that WSS
magnitude and oscillation may act cooperatively in affecting
coronary lesion progression. Specifically, in areas of low WSS
we observed necrotic core progression and total plaque size
regression or progression depending on the presence or
absence of oscillatory WSS, respectively. Thus, these data
suggest that a haemodynamic environment characterized
by either low and oscillatory WSS or high time-averaged
WSS magnitude is associated with transformation towards
a more vulnerable plaque phenotype [24].
In addition to the compelling experimental evidence
linking haemodynamics to atherogenesis and early lesion
formation [25], the data also suggest a role of WSS in
atherosclerosis progression and plaque vulnerability. In a
pro-atherogenic region, low time-averaged WSS has been
linked to increased expression of matrix metalloproteinases
(MMPs) [26], changes in endothelial cell morphology [27],
and vascular smooth muscle cell (VSMC) migration and
proliferation [28]. A study that used a perivascular cast to
induce altered haemodynamics in a mouse model of athero-
sclerosis demonstrated a vulnerable plaque phenotype in
areas of lowered WSS and more stable lesions in areas of oscil-
latory, but not lowered, WSS [29], which contrasts the
presented results; however, limitations exist in studying
atherosclerosis in murine models [30]. In diabetic, hypercholes-
terolaemic pigs, arterial segments exposed to persistently low
WSS magnitude showed increased plaque size, decreased inti-
mal VSMC content, increased expression of collagenases and
collagenolytic activity and thinning of the fibrous cap [31].
These observations are consistent with data from the present
study, as we observed total plaque progression in areas of
low WSS. However, the role of oscillatory WSS could not be
determined in that study [31], as the computational methods
were limited by a steady flow assumption. Thus, it is possible

chan
ge in
pla
que
area
(m
m2 )
low and non-oscillatory WSS
low andoscillatory WSS
p < 0.001
p < 0.001
fibroustotal plaque
fibro-fattynecrotic coredense calcium
p < 0.001
0.04
0.03
0.02
0.01
0
–0.01
–0.02
–0.03
–0.04
–0.05
Figure 7. Changes in total plaque and VH-IVUS derived plaque constituentareas in sectors subjected to low and non-oscillatory (low time-averagedWSS, low oscillatory WSS) or low and oscillatory (low time-averaged WSS,high oscillatory WSS) WSS. Notably, focal regions of low and oscillatory WSSdemonstrated regression of total plaque, fibrous and fibrofatty tissue area,and progression of necrotic core and dense calcium, suggestive of atransformation to a more vulnerable phenotype. Error bars are 95% CIs.
rsif.royalsocietypublishing.orgJ.R.Soc.Interface
14:20160972
9
on August 31, 2018http://rsif.royalsocietypublishing.org/Downloaded from
that lesions in two different haemodynamic environments, low
WSS and low and oscillatory WSS, were collectively analysed.
More recently, it was observed in proprotein convertase
subtilisin/kexin type 9 (PCSK9) ‘gain-of-function’, hypercho-
lesterolaemic minipigs that regions of low and multi-
directional WSS, which was quantified by transverse WSS
(transWSS) [32], led to the formation of advanced coronary
lesions, including TCFAs [6], which supports the clinical obser-
vations presented here. Furthermore, the study [6] showed that
transWSS alone led to distinct plaque phenotypes, high-
lighting the role of WSS magnitude, oscillatory WSS and
their combination in atherosclerosis progression and plaque
vulnerability. We note that transWSS and WSSAD are analo-
gous haemodynamic parameters in identifying focal regions
where there exist large deviations of instantaneous WSS vectors
from the main flow direction. Finally, our observation that sec-
tors exposed to high WSS magnitude demonstrated progression
patterns towards lesions with high-risk features is supported by
experimental data that we have previously discussed in detail
[7]. It has been shown that high WSS promotes increased pro-
duction of plasmin, transforming growth factor-b, nitric oxide,
bone morphogenic protein-4 and MMPs [33–35], each of
which contribute to increased lesion vulnerability.
It cannot be overemphasized that CAD progression, vul-
nerable plaque formation and plaque rupture are focal
pathophysiological episodes. Indeed, atherosclerotic lesions
are classified by focal morphological and histological features
[36] and plaque ruptures are a local disruption of a thin fibrous
cap overlying a large necrotic core [37]. Thus, examination of
variables that influence these events should be evaluated at
an equivalent scale. We acknowledge that previous investi-
gations have provided a critical understanding of the role of
WSS in the natural history of coronary atherosclerosis; how-
ever, nearly all studies evaluating the relationship between
WSS and CAD progression spatially averaged the data over
the lumen circumference [7], axial ‘strips’ [38] or coronary seg-
ments [8], all of which reduce data width and the spatial
dependence of the associations [39].
We have previously observed a threefold reduction in the
range of time-averaged WSS values when data are averaged
around the circumference versus evaluation in focal regions,
and considerable differences between the two analysis tech-
niques in the association of WSS and VH-IVUS-defined
plaque progression [9]. In the current investigation, averaging
time-averaged WSS and oscillatory WSS data around the cir-
cumference yielded no segments of low and oscillatory WSS,
which highlights the advantage of our analysis framework to
capture local flow features (figure 2). Our current data indicate
that CAD progression and plaque phenotypic transformation,
which were evaluated at a focal level, are associated with the
baseline haemodynamic environment that was quantified at
the same length scale. The novel approach presented herein
provides motivation for future investigations that seek to
identify asymptomatic coronary lesions that precede rapid
lumen obstruction or an acute thrombotic event.
As coronary plaque rupture is the underlying aetiology for
a majority of acute coronary syndromes [37], early identifi-
cation of these high-risk plaques is of significant clinical
importance. Adverse clinical outcomes have been individually
associated with plaque burden, composition and pheno-
type; vessel remodelling patterns; and the surrounding
haemodynamic environment. Studies have shown that the
combination of distinct lesion characteristics demonstrates
higher predictive value than a single characteristic in identify-
ing lesions at greatest risk for future cardiac events [40].
However, to date, the required tools to identify focal WSS
patterns at an individual coronary lesion have been absent.
As a result, the complexity of the haemodynamic environ-
ment that includes focal regions of high WSS (plaque throat)
juxtaposed to focal regions of low and oscillatory WSS
(downstream of plaque), both of which are linked to plaque-
destabilizing pathobiological mechanisms [35], cannot be
accurately captured and characterized in humans. Our present
findings demonstrate that WSS magnitude and oscillation are
critical in identifying progression patterns of increased vulner-
ability and suggest that identification of these unique WSS
patterns, in conjunction with other lesion characteristics, will
afford increased predictive value and clinical prognostication
of high-risk coronary lesions.
4.1. Study limitationsThe limitations of this study should be noted. First, the limited
study size of patients with stable, non-obstructive CAD
treated with aggressive medical therapy resulted in no clinical
events in the study cohort during the investigation. Neverthe-
less, our novel analysis techniques afforded the statistical
power to detect significant changes in total plaque and con-
stituent areas across the haemodynamic categories. Second,
we used serial radiofrequency intravascular ultrasound ima-
ging (i.e. VH-IVUS) to quantify CAD progression. Although
one study questioned the accuracy of VH-IVUS in identify-
ing necrotic core size [41], several identified flaws limit the
clinical significance of the conclusions [42]. Furthermore, the
PROSPECT study identified VH-IVUS-defined TCFAs in com-
bination with greyscale as an independent predictor of plaque
rupture [18]. Third, we acknowledge that arterial remodelling,
which is defined as the change in EEM area from baseline to
follow-up, is an important component of CAD progression
and clinical manifestation of the disease [43]; however, as
this study was focused on the focal association between

low WSS and low oscillatory WSS
oscillatory WSSWSS magnitude
WSS
(dy
nes
cm–2
) an
d o
scill
ator
y W
SS (
°)
WSS
(dy
nes
cm–2
) an
d o
scill
ator
y W
SS (
°)
WSS
(dy
nes
cm–2
) an
d o
scill
ator
y W
SS (
°)
chan
ge in
pla
que
area
(m
m2 )
chan
ge in
pla
que
area
(m
m2 )
chan
ge in
pla
que
area
(m
m2 )
chan
ge in
pla
que
area
(m
m2 )
fibroustotal plaque
fibro-fattynecrotic coredense calcium
baseline follow-up
low WSS andhigh oscillatory WSS
WSS
(dy
nes
cm–2
) an
d os
cilla
tory
WSS
(°)
baseline follow-up
intermediate WSS andlow oscillatory WSS
baseline follow-up
high WSS andlow oscillatory WSS
baseline follow-up
7
6
5
4
3
2
1
0
70
60
50
40
30
20
10
0
0.05
0.04
0.03
0.02
0.01
0
120
100
80
60
40
20
0
0.40
0.30
0.20
0.10
0
–0.10
–0.20
–0.30
–0.10
0
–0.20
–0.30
–0.40
–0.50
–0.60
–0.70
50
40
30
20
10
0
0.06
0.04
0.02
0
–0.02
–0.04
–0.06
–0.08
Figure 8. Example IVUS images at baseline and follow-up demonstrating focal changes in plaque area (greyscale IVUS) and constituents (VH-IVUS) stratified byhaemodynamic categories. Sectors exposed to low time-averaged WSS and oscillatory WSS or high time-averaged WSS exhibited a decrease in total plaque area withprogression of necrotic core and dense calcium tissue.
rsif.royalsocietypublishing.orgJ.R.Soc.Interface
14:20160972
10
on August 31, 2018http://rsif.royalsocietypublishing.org/Downloaded from
haemodynamics and CAD progression, we chose not to
analyse remodelling or other circumferentially defined par-
ameters that confound the focal analysis. Fourth, there are
limitations in our computational methods that should be
acknowledged. Blood was assumed to be an incompressible
Newtonian fluid; however, the Reynolds (Re) numbers in

rsif.royalsocietypublishing.orgJ.R.Soc.Interface
14:2016097
11
on August 31, 2018http://rsif.royalsocietypublishing.org/Downloaded from
these models were moderate (Re � 250–400), where the non-
Newtonian behaviour of blood is minimal [44], and an
exploratory study in one of our models resulted in minimal
differences (less than 1%) in time-averaged WSS values
when incorporating a non-Newtonian fluid model (Carreau
model [45]). Also, we assumed a rigid wall and neglected cor-
onary motion. We acknowledge that these are a significant
approximation of in vivo conditions; yet, the lack of a validated
fluid–solid interaction computational framework to quantify
the 3D coronary artery mechanical environment and proces-
sing techniques to accurately quantify coronary motion from
cine angiography (currently) restricts inclusion of these
advanced modelling techniques. Finally, the results presented
do not establish a causal relationship between coronary
haemodynamics, CAD progression and plaque vulnerability
in humans. Experimental models are better suited to advance
mechanistic understanding of the role of haemodynamics in
atherosclerosis progression, and larger clinical trials deploying
such sophisticated methodology for evaluation of coronary
haemodynamics are challenging, but warranted.
2
5. ConclusionWe demonstrate that both WSS magnitude and oscillation are
closely associated with coronary plaque progression over six
months in patients with non-obstructive CAD treated with
optimal medical therapy. Using an analysis framework to
examine the focal association between coronary haemo-
dynamics and CAD progression, we report that, in a low
WSS environment, focal regions (sectors) subjected to an oscil-
latory WSS exhibit regression of total plaque area, while non-
oscillatory WSS sectors demonstrate total plaque progression.
Furthermore, sectors exposed to low and oscillatory WSS exhi-
bit a decrease in fibrous and fibrofatty tissue and an increase in
necrotic core and dense calcium, implying a phenotypic trans-
formation towards a more vulnerable phenotype [24]. Future
clinical studies that rigorously evaluate the haemodynamic
environment and CAD progression at the focal level will pro-
vide significant insight on the prognostic utility of WSS in
the early identification of high-risk coronary lesions.
Ethics. This study was approved by the Institutional Review Board atEmory University, and all patients provided informed consent.
Authors’ contributions. L.H.T. developed and performed the computations,performed the data analysis and prepared the manuscript. D.S.M.developed the computations, advised on data analysis, and providedfeedback and suggestions on the manuscript. P.E. assisted in clinicaldata collection, advised on data analysis, and provided feedback andsuggestions on the manuscript. M.C.M. assisted in clinical data collec-tion and provided feedback and suggestions on the manuscript. J.N.O.and D.P.G. advised on computational model development, data analy-sis, and provided feedback and suggestions on the manuscript. H.S.collected the clinical data, advised on the data analysis, and providedfeedback and suggestions on the manuscript.
Competing interests. We have no competing interests.
Funding. This research was supported by the American Heart Association(L.H.T.: 11POST7210012, D.S.M.: 13POST17110030), Georgia ResearchAlliance (D.P.G.), Pfizer Pharmaceuticals (H.S.) and Volcano Corp. (H.S.).
Acknowledgement. We thank the Emory interventional cardiology fellowsand catheterization staff for participation in the study performance.
References
1. Grottum P, Svindland A, Walloe L. 1983 Localizationof atherosclerotic lesions in the bifurcation of themain left coronary artery. Atherosclerosis 47,55 – 62. (doi:10.1016/0021-9150(83)90071-0)
2. Ku DN, Giddens DP, Zarins CK, Glagov S. 1985 Pulsatileflow and atherosclerosis in the human carotidbifurcation. Positive correlation between plaquelocation and low oscillating shear stress. Arteriosclerosis5, 293 – 302. (doi:10.1161/01.ATV.5.3.293)
3. He X, Ku DN. 1996 Pulsatile flow in the human leftcoronary artery bifurcation: average conditions.J. Biomech. Eng. 118, 74 – 82. (doi:10.1115/1.2795948)
4. Garcia-Cardena G, Comander J, Anderson KR,Blackman BR, Gimbrone Jr MA. 2001 Biomechanicalactivation of vascular endothelium as a determinantof its functional phenotype. Proc. Natl Acad. Sci. USA98, 4478 – 4485. (doi:10.1073/pnas.071052598)
5. Zhou J, Li YS, Chien S. 2014 Shear stress-initiatedsignaling and its regulation of endothelial function.Arterioscler. Thromb. Vasc. Biol. 34, 2191 – 2198.(doi:10.1161/ATVBAHA.114.303422)
6. Pedrigi RM et al. 2015 Inducing persistent flowdisturbances accelerates atherogenesis andpromotes thin cap fibroatheroma development inD374Y-PCSK9 hypercholesterolemic minipigs.Circulation 132, 1003 – 1012. (doi:10.1161/CIRCULATIONAHA.115.016270)
7. Samady H, Eshtehardi P, McDaniel MC, Suo J,Dhawan SS, Maynard C, Timmins LH, Quyyumi AA,Giddens DP. 2011 Coronary artery wall shear stressis associated with progression and transformation ofatherosclerotic plaque and arterial remodeling inpatients with coronary artery disease. Circulation124, 779 – 788. (doi:10.1161/CIRCULATIONAHA.111.021824)
8. Stone PH et al. 2012 Prediction of progression ofcoronary artery disease and clinical outcomes usingvascular profiling of endothelial shear stress andarterial plaque characteristics: the PREDICTIONStudy. Circulation 126, 172 – 181. (doi:10.1161/CIRCULATIONAHA.112.096438)
9. Timmins LH, Molony DS, Eshtehardi P, McDanielMC, Oshinski JN, Samady H, Giddens DP. 2015 Focalassociation between wall shear stress and clinicalcoronary artery disease progression. Ann. Biomed.Eng. 43, 94 – 106. (doi:10.1007/s10439-014-1155-9)
10. Wahle A, Prause PM, DeJong SC, Sonka M. 1999Geometrically correct 3-D reconstruction ofintravascular ultrasound images by fusion withbiplane angiography—methods and validation.IEEE Trans. Med. Imaging 18, 686 – 699. (doi:10.1109/42.796282)
11. Molony DS, Timmins LH, Rasoul-Arzrumly E,Samady H, Giddens DP. 2014 Investigation of theinfluence of side-branches on wall shear stress in
coronary arteries reconstructed from intravascularultrasound. In Computational biomechancis formedicine: fundamental science and patient-specificapplications (ed. B Doyle). New York, NY: Springer.
12. Timmins LH, Gupta D, Corban MT, Molony DS,Oshinski JN, Samady H, Giddens DP. 2015 Co-localization of disturbed flow patterns and oclusivecardiac allograft vasculopathy lesion formation inheart transplant patients. Cardiovasc. Eng. Technol.6, 25 – 35. (doi:10.1007/s13239-014-0198-2)
13. Moore Jr JE, Xu C, Glagov S, Zarins CK, Ku DN. 1994Fluid wall shear stress measurements in a model ofthe human abdominal aorta: oscillatory behavior andrelationship to atherosclerosis. Atherosclerosis 110,225 – 240. (doi:10.1016/0021-9150(94)90207-0)
14. Malek AM, Izumo S. 1996 Mechanism of endothelialcell shape change and cytoskeletal remodeling inresponse to fluid shear stress. J. Cell Sci. 109,713 – 726.
15. Nair A, Kuban BD, Tuzcu EM, Schoenhagen P, NissenSE, Vince DG. 2002 Coronary plaque classificationwith intravascular ultrasound radiofrequency dataanalysis. Circulation 106, 2200 – 2206. (doi:10.1161/01.cir.0000035654.18341.5e)
16. Nair A, Margolis MP, Kuban BD, Vince DG. 2007Automated coronary plaque characterisation withintravascular ultrasound backscatter: ex vivovalidation. EuroIntervention 3, 113 – 120.

rsif.royalsocietypublishing.orgJ.R.Soc.Interface
14:20160972
12
on August 31, 2018http://rsif.royalsocietypublishing.org/Downloaded from
17. Nasu K et al. 2006 Accuracy of in vivo coronaryplaque morphology assessment: a validation studyof in vivo virtual histology compared with in vitrohistopathology. J. Am. Coll. Cardiol. 47, 2405 – 2412.(doi:10.1016/j.jacc.2006.02.044)
18. Stone GW et al. 2011 A prospective natural-historystudy of coronary atherosclerosis. N. Engl. J. Med.364, 226 – 235. (doi:10.1056/NEJMoa1002358)
19. Calvert PA et al. 2011 Association between IVUSfindings and adverse outcomes in patients withcoronary artery disease: the VIVA (VH-IVUS invulnerable atherosclerosis) study. JACC Cardiovasc.Imaging 4, 894 – 901. (doi:10.1016/j.jcmg.2011.05.005)
20. Mintz GS, Garcia-Garcia HM, Nicholls SJ, WeissmanNJ, Bruining N, Crowe T, Tardif JC, Serruys PW. 2011Clinical expert consensus document on standards foracquisition, measurement and reporting ofintravascular ultrasound regression/progressionstudies. EuroIntervention 6, 1123 – 1130, 1129.(doi:10.4244/EIJV6I9A195)
21. Eshtehardi P et al. 2012 Association of coronary wallshear stress with atherosclerotic plaque burden,composition, and distribution in patients withcoronary artery disease. J. Am. Heart Assoc. 1,e002543. (doi:10.1161/JAHA.112.002543)
22. Timmins LH, Suever JD, Eshtehardi P, McDaniel MC,Oshinski JN, Samady H, Giddens DP. 2013Framework to co-register longitudinal virtualhistology-intravascular ultrasound data in thecircumferential direction. IEEE Trans. Med. Imaging32, 1989 – 1996. (doi:10.1109/TMI.2013.2269275)
23. Stone PH et al. 2003 Effect of endothelial shearstress on the progression of coronary artery disease,vascular remodeling, and in-stent restenosis inhumans: in vivo 6-month follow-up study.Circulation 108, 438 – 444. (doi:10.1161/01.CIR.0000080882.35274.AD)
24. Finn AV, Nakano M, Narula J, Kolodgie FD, VirmaniR. 2010 Concept of vulnerable/unstable plaque.Arterioscler. Thromb. Vasc. Biol. 30, 1282 – 1292.(doi:10.1161/ATVBAHA.108.179739)
25. Chiu JJ, Chien S. 2011 Effects of disturbed flow onvascular endothelium: pathophysiological basis andclinical perspectives. Physiol. Rev. 91, 327 – 387.(doi:10.1152/physrev.00047.2009)
26. Deguchi JO, Aikawa E, Libby P, Vachon JR, Inada M,Krane SM, Whittaker P, Aikawa M. 2005 Matrixmetalloproteinase-13/collagenase-3 deletion promotescollagen accumulation and organization in mouseatherosclerotic plaques. Circulation 112, 2708 – 2715.(doi:10.1161/CIRCULATIONAHA.105.562041)
27. Himburg HA, Grzybowski DM, Hazel AL, LaMack JA,Li XM, Friedman MH. 2004 Spatial comparisonbetween wall shear stress measures and porcinearterial endothelial permeability. Am. J. Physiol.Heart Circ. Physiol. 286, H1916 – H1922. (doi:10.1152/ajpheart.00897.2003)
28. Bentzon JF, Weile C, Sondergaard CS, Hindkjaer J,Kassem M, Falk E. 2006 Smooth muscle cells inatherosclerosis originate from the local vessel walland not circulating progenitor cells in ApoEknockout mice. Arterioscler. Thromb. Vasc. Biol. 26,2696 – 2702. (doi:10.1161/01.ATV.0000247243.48542.9d)
29. Cheng C, Tempel D, van Haperen R, van der Baan A,Grosveld F, Daemen MJ, Krams R, de Crom R. 2006Atherosclerotic lesion size and vulnerability aredetermined by patterns of fluid shear stress.Circulation 113, 2744 – 2753. (doi:10.1161/CIRCULATIONAHA.105.590018).
30. Seok J et al. 2013 Genomic responses in mousemodels poorly mimic human inflammatory diseases.Proc. Natl Acad. Sci. USA 110, 3507 – 3512. (doi:10.1073/pnas.1222878110)
31. Koskinas KC et al. 2013 Thin-capped atheromatawith reduced collagen content in pigs develop incoronary arterial regions exposed to persistently lowendothelial shear stress. Arterioscler. Thromb. Vasc.Biol. 33, 1494 – 1504. (doi:10.1161/ATVBAHA.112.300827)
32. Peiffer V, Sherwin SJ, Weinberg PD. 2013Computation in the rabbit aorta of a new metric—the transverse wall shear stress—to quantify themultidirectional character of disturbed blood flow.J. Biomech. 46, 2651 – 2658. (doi:10.1016/j.jbiomech.2013.08.003)
33. Casey PJ, Dattilo JB, Dai G, Albert JA, Tsukurov OI, OrkinRW, Gertler JP, Abbott WM. 2001 The effect ofcombined arterial hemodynamics on saphenous venousendothelial nitric oxide production. J. Vasc. Surg. 33,1199– 1205. (doi:10.1067/mva.2001.115571)
34. Kenagy RD, Fischer JW, Davies MG, Berceli SA,Hawkins SM, Wight TN, Clowes AW. 2002 Increasedplasmin and serine proteinase activity during flow-induced intimal atrophy in baboon PTFE grafts.Arterioscler. Thromb. Vasc. Biol. 22, 400 – 404.(doi:10.1161/hq0302.105376)
35. Slager CJ, Wentzel JJ, Gijsen FJ, Thury A, van derWal AC, Schaar JA, Serruys PW. 2005 The role ofshear stress in the destabilization of vulnerableplaques and related therapeutic implications. Nat.Clin. Pract. Cardiovasc. Med. 2, 456 – 464. (doi:10.1038/ncpcardio0298)
36. Virmani R, Kolodgie FD, Burke AP, Farb A, SchwartzSM. 2000 Lessons from sudden coronary death: acomprehensive morphological classification schemefor atherosclerotic lesions. Arterioscler. Thromb. Vasc.Biol. 20, 1262 – 1275. (doi:10.1161/01.ATV.20.5.1262)
37. Virmani R, Burke AP, Farb A, Kolodgie FD. 2006Pathology of the vulnerable plaque. J. Am. Coll.Cardiol. 47, C13 – C18. (doi:10.1016/j.jacc.2005.10.065)
38. Wentzel JJ, Janssen E, Vos J, Schuurbiers JC, KramsR, Serruys PW, de Feyter PJ, Slager CJ. 2003Extension of increased atherosclerotic wall thicknessinto high shear stress regions is associated with lossof compensatory remodeling. Circulation 108,17 – 23. (doi:10.1161/01.CIR.0000078637.21322.D3)
39. Peiffer V, Sherwin SJ, Weinberg PD. 2013 Does lowand oscillatory wall shear stress correlate spatiallywith early atherosclerosis? A systematic review.Cardiovasc. Res. 99, 242 – 250. (doi:10.1093/cvr/cvt044)
40. Corban MT et al. 2014 Combination of plaqueburden, wall shear stress, and plaque phenotypehas incremental value for prediction of coronaryatherosclerotic plaque progression and vulnerability.Atherosclerosis 232, 271 – 276. (doi:10.1016/j.atherosclerosis.2013.11.049)
41. Thim T, Hagensen MK, Wallace-Bradley D, GranadaJF, Kaluza GL, Drouet L, Paaske WP, Botker HE,Falk E. 2010 Unreliable assessment of necrotic coreby virtual histology intravascular ultrasound inporcine coronary artery disease. Circ. Cardiovasc.Imaging 3, 384 – 391. (doi:10.1161/CIRCIMAGING.109.919357)
42. Stone GW, Mintz GS. 2010 Letter by Stone andMintz regarding article, ‘unreliable assessment ofnecrotic core by virtual histology intravascularultrasound in porcine coronary artery disease’. Circ.Cardiovasc. Imaging 3, e4; author reply e5. (doi:10.1161/CIRCIMAGING.110.958553)
43. Glagov S, Weisenberg E, Zarins CK, StankunaviciusR, Kolettis GJ. 1987 Compensatory enlargement ofhuman atherosclerotic coronary arteries.N. Engl. J. Med. 316, 1371 – 1375. (doi:10.1056/NEJM198705283162204)
44. Ku DN. 1997 Blood flow in arteries. Annu. Rev. FluidMech. 29, 399 – 434. (doi:10.1146/annurev.fluid.29.1.399)
45. Cho YI, Kensey KR. 1991 Effects of the non-Newtonian viscosity of blood on flows in a diseasedarterial vessel. Part 1: steady flows. Biorheology 28,241 – 262.