Embed Size (px)
Citation preview

OSA: An Optical Switching Architecture for Data Center Networks withUnprecedented Flexibility
Kai Chen⋆, Ankit Singla†, Atul Singh‡, Kishore Ramachandran‡
Lei Xu‡, Yueping Zhang‡, Xitao Wen⋆, Yan Chen⋆
⋆Northwestern University, †UIUC, ‡NEC Labs America, Inc.
AbstractData center networks (DCNs) form the backbone in-frastructure of many large-scale enterprise applicationsas well as emerging cloud computing providers. Thispaper describes the design, implementation and evalua-tion of OSA, a novel Optical Switching Architecture forDCNs. Leveraging runtime reconfigurable optical de-vices, OSA dynamically changes its topology and linkcapacities, thereby achieving unprecedented flexibility toadapt to dynamic traffic patterns. Extensive analyticalsimulations using both real and synthetic traffic patternsdemonstrate that OSA can deliver high bisection band-width (60%-100% of the non-blocking architecture). Im-plementation and evaluation of a small-scale functionalprototype further demonstrate the feasibility of OSA.
1 Introduction
Many on-line services, such as those offered by Amazon,Google, FaceBook, and eBay, are powered by massivedata centers hosting hundreds of thousands of servers.The network interconnect of the data center plays a keyrole in the performance and scalability of these services.As the number of hosted applications and the amountof traffic grow, the industry is looking for larger server-pools, higher bit-rate network interconnects, and smarterworkload placement approaches to satisfy the demand.To meet these goals, a careful examination of traffic char-acteristics, operator requirements, and network technol-ogy rends is critical.Traffic characteristics. Several recent DCN proposalsattempt to provide uniformly high capacity between allservers [2, 16, 17, 28]. Given that it is not known a prioriwhich servers will require high speed connectivity, for astatic, electrical network, this appears to be the only wayto prevent localized bottlenecks. However, for many realscenarios, such a network may not be fully utilized at alltimes. For instance, measurement on a 1500-server Mi-
crosoft production DCN reveals that only a few ToRs arehot and most of their traffic goes to a few other ToRs [20].Likewise, an analysis of high-performance computingapplications shows that the bulk of inter-processor trafficis degree-bounded and slowly-changing [4]. Thus, evenfor a few thousand servers, uniformly high capacity net-works appear to be an overkill. As the size of the networkgrows, this weighs on the cost, power consumption andcomplexity of such networks.Dealing with the oversubscribed networks. Achiev-ing high performance for data center services is chal-lenging in the oversubscribed networks. One approachis to use intelligent workload placement algorithms toallocate network-bound service components to physicalhosts with high bandwidth connectivity [19], e.g., plac-ing these components on the same rack. Such work-loads exist in practice: dynamic creation and deletion ofVM instances in Amazon’s EC2 or periodic backup ser-vices running between an EC2 (compute) instance andan S3 (storage) bucket. An alternate approach is to flex-ibly allocate more network bandwidth to service compo-nents with heavy communications. If the network could“shape-shift” in such fashion, this could considerablysimplify the workload placement problem.Higher bit-rates. There is an increasing trend towardsdeploying 10 GigE NICs at the end hosts. In fact, Googlealready has 10 GigE deployments and is pushing the in-dustry for 40/100 GigE [22, 24, 30]. Deploying serverswith 10 GigE naturally requires much higher capacity atthe aggregation layers of the network. Unfortunately, tra-ditional copper-wire 10 GigE links are not viable for dis-tances over 10 meters [15] due to their high power budgetand larger cable size, necessitating the need to look foralternative technologies.
Optical networking technology is well suited to meetthe above challenges. Optical network elements sup-port on-demand provisioning of connectivity and capac-ity where required in the network, thus permitting theconstruction of thin, but flexible interconnects for large
1
server pools. Optical links can support higher bit-ratesover longer distances using less power than copper ca-bles. Moreover, optical switches run cooler than elec-trical ones [11], resulting in lower heat dissipation andcheaper cooling cost. The long-term advantage of opticsin DCNs has been noted in the industry [1, 11].
Recent efforts in c-Through [35] and Helios [15] pro-vide a promising direction to exploit optical networkingtechnology (e.g., one-hop high-capacity optical circuits)for building DCNs. Following this trailblazing research,we present OSA, a novel Optical Switching Architec-ture for DCNs. OSA achieves high flexibility by lever-aging and extending the techniques devised by previouswork, and further combining them with novel techniquesof its own. Similar to the previous work, OSA lever-ages reconfigurability of optical devices to dynamicallyset up one-hop optical circuits. Then, OSA employs thenovel hop-by-hop stitching of multiple optical links toprovide all-to-all connectivity for mice flows and burstycommunications, and also to handle workloads involvinghigh fan-in/out hotspots [18] that the existing one-hopelectrical/optical architectures cannot address efficientlyvia their optical interconnects1. Further, OSA dynam-ically adjusts the capacities on the optical links to sat-isfy changing traffic demand at a finer granularity. Addi-tionally, to make efficient use of expensive optical ports,OSA introduces Circulator (Sec. 2.2), a bi-directionality-enabling component for simultaneous transmission inboth directions over the same circuit, which potentiallydoubles the usage of MEMS ports.
Overall, the highlights of this paper are as follows.A flexible DCN architecture. Given a number N ofTop-of-Rack (ToR) switches and a design-time-fixed pa-rameter k, OSA can assume any k-regular topology overthe N ToRs. To illustrate how many options this givesus, consider that for just N=20, there are over 12 bil-lion (non-isomorphic) connected 4-regular graphs [25].In addition, OSA allows the capacity of each edge inthis k-regular topology to be varied from a few Gb/s toa few hundred Gb/s on-demand. Evaluation results inSec. 5.2.2 suggest an up to 150% and 50% performanceimprovement brought by flexible topology and flexiblelink capacity, respectively.An analysis of OSA-2560. We evaluate a particularinstance of container-size OSA architecture, OSA-2560(N=80, k=4), with 2560 servers via extensive simula-tions and analysis. Our evaluation results (Sec. 5.2)
1In the optical part of the existing hybrid electrical/optical archi-tectures, one ToR only connects to one other ToR at a time. While itcan connect to different ToRs at different times, the switching latencywould be around 10 ms. As we will introduce, in OSA, one ToR canconnect to multiple ToRs simultaneously at a time, and more impor-tantly, multi-hop connection exist between any pair of remote ToRs viahop-by-hop circuit stitching.
suggest that OSA-2560 can deliver high bisection band-width that is 60%-100% of the non-blocking networkand outperform the hybrid structures by 80%-250% forboth real and synthetic traffic patterns. Our analysis(Sec.3.3) shows that OSA incurs lower cost (∼38%),lower (∼37%) power consumption, and one order ofmagnitude simpler cabling complexity compared to anon-blocking Fattree [2] connecting a similar number ofservers. Furthermore, compared with the hybrid struc-tures, OSA has similar cost but consumes slightly lesspower. We believe that for data centers that expectskewed traffic demands, OSA provides a compellingtradeoff between cost, complexity and performance.An implementation of OSA prototype. We build asmall-scale 8-rack OSA prototype with real optical de-vices. Through this testbed, we evaluate the performanceof OSA with all software and hardware overheads. Ourresults show that OSA can quickly adapt the topologyand link capacities to meet the changing traffic patterns,and that it achieves nearly 60% of non-blocking band-width in the all-to-all communication. We further exam-ine the impact of OSA design on bulk data transfer andmice flows, and find that the overhead introduced by hop-by-hop routing on mice flows is small: a 2 ms additionallatency for a 7-hop routing with full background traffic.We also measure the device characteristics of the opti-cal equipment, evaluate the impact of multi-hop optical-electrical-optical (O-E-O) conversion, and discuss ourexperience building and evaluating the OSA prototype.Limitations. OSA, in its current form, has limitations.Small flows, especially those latency-sensitive ones, mayincur non-trivial penalty due to reconfiguration delays(∼10ms). While the fraction of such affected flows issmall (Sec. 7), we propose multiple avenues to solve thischallenge. The second challenge is to scale OSA froma container-size to a larger date center consisting of tensto hundreds of thousands of servers. This requires non-trivial efforts in both architecture and management de-sign, and is left as part of our ongoing investigation. Inthis paper, we describe OSA that is designed to connectfew thousands of servers in a container.Roadmap. In Sec. 2, we discuss the idea of OSA’s un-precedented flexibility, followed by background on op-tical technologies for OSA. Then we describe OSA ar-chitecture (Sec. 3) and its algorithm design (Sec. 4) inresponse to traffic patterns. In Sec. 5 and Sec. 6, we eval-uate OSA via extensive simulations and implementationrespectively. We discuss some design issues and relatedwork to OSA in Sec. 7 before concluding in Sec. 8.
2 Motivation and Background
We first use a motivating example to show what kind offlexibility OSA delivers. Then, we introduce the optical
2
C
G
F
A
H D
BE
HA G 10B 10C E 10
10FDB D 10
HA G 10B 10C E 10
GFB D 10
20
F
A
H D
BEC
G
A B
D C
GH
E F
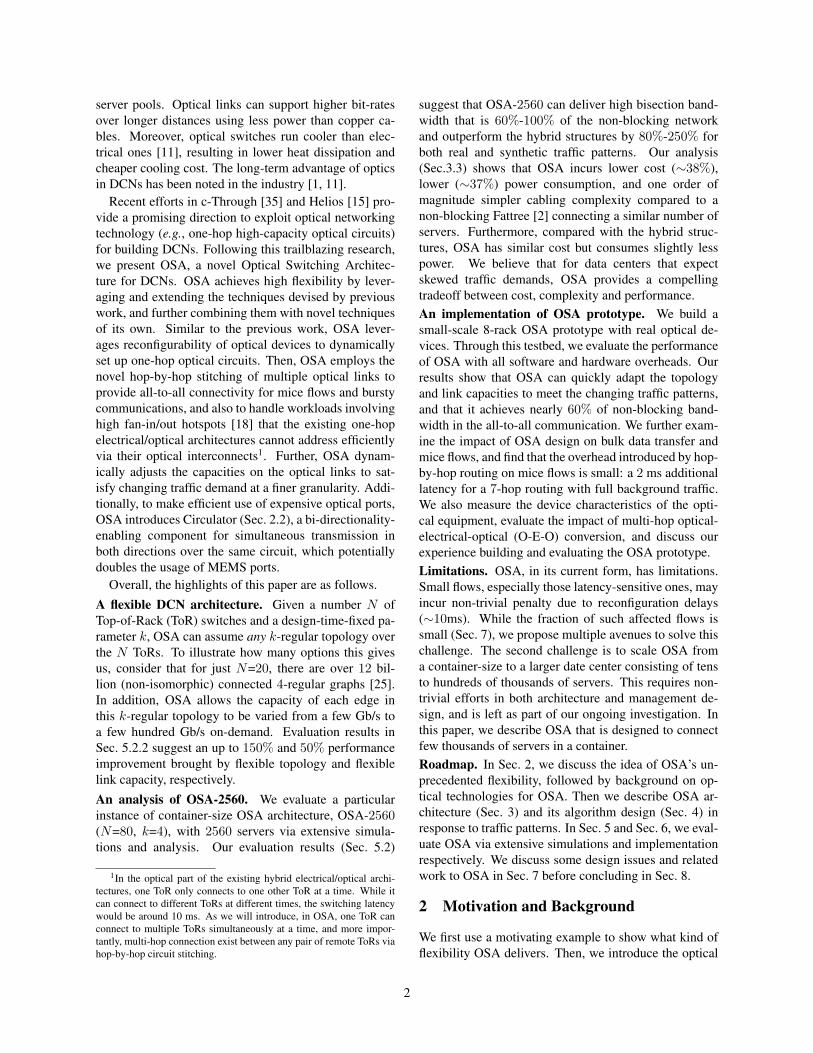
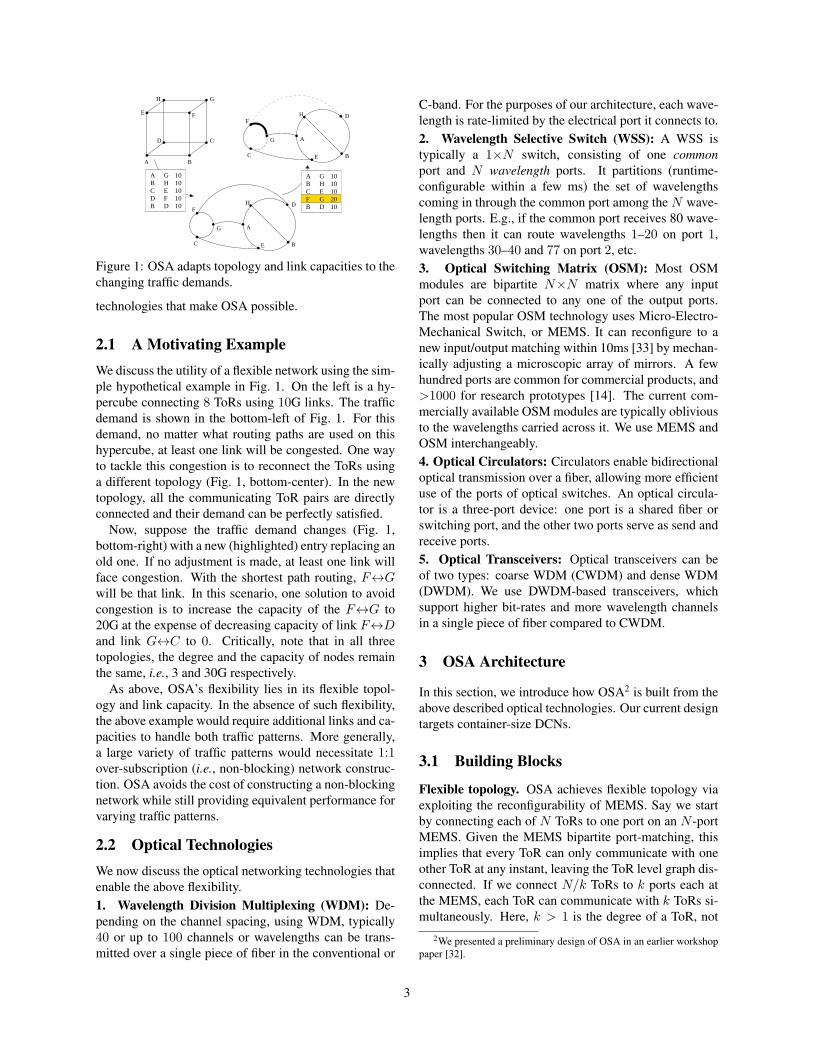
Figure 1: OSA adapts topology and link capacities to thechanging traffic demands.
technologies that make OSA possible.
2.1 A Motivating ExampleWe discuss the utility of a flexible network using the sim-ple hypothetical example in Fig. 1. On the left is a hy-percube connecting 8 ToRs using 10G links. The trafficdemand is shown in the bottom-left of Fig. 1. For thisdemand, no matter what routing paths are used on thishypercube, at least one link will be congested. One wayto tackle this congestion is to reconnect the ToRs usinga different topology (Fig. 1, bottom-center). In the newtopology, all the communicating ToR pairs are directlyconnected and their demand can be perfectly satisfied.
Now, suppose the traffic demand changes (Fig. 1,bottom-right) with a new (highlighted) entry replacing anold one. If no adjustment is made, at least one link willface congestion. With the shortest path routing, F↔Gwill be that link. In this scenario, one solution to avoidcongestion is to increase the capacity of the F↔G to20G at the expense of decreasing capacity of link F↔Dand link G↔C to 0. Critically, note that in all threetopologies, the degree and the capacity of nodes remainthe same, i.e., 3 and 30G respectively.
As above, OSA’s flexibility lies in its flexible topol-ogy and link capacity. In the absence of such flexibility,the above example would require additional links and ca-pacities to handle both traffic patterns. More generally,a large variety of traffic patterns would necessitate 1:1over-subscription (i.e., non-blocking) network construc-tion. OSA avoids the cost of constructing a non-blockingnetwork while still providing equivalent performance forvarying traffic patterns.
2.2 Optical TechnologiesWe now discuss the optical networking technologies thatenable the above flexibility.1. Wavelength Division Multiplexing (WDM): De-pending on the channel spacing, using WDM, typically40 or up to 100 channels or wavelengths can be trans-mitted over a single piece of fiber in the conventional or
C-band. For the purposes of our architecture, each wave-length is rate-limited by the electrical port it connects to.2. Wavelength Selective Switch (WSS): A WSS istypically a 1×N switch, consisting of one commonport and N wavelength ports. It partitions (runtime-configurable within a few ms) the set of wavelengthscoming in through the common port among the N wave-length ports. E.g., if the common port receives 80 wave-lengths then it can route wavelengths 1–20 on port 1,wavelengths 30–40 and 77 on port 2, etc.3. Optical Switching Matrix (OSM): Most OSMmodules are bipartite N×N matrix where any inputport can be connected to any one of the output ports.The most popular OSM technology uses Micro-Electro-Mechanical Switch, or MEMS. It can reconfigure to anew input/output matching within 10ms [33] by mechan-ically adjusting a microscopic array of mirrors. A fewhundred ports are common for commercial products, and>1000 for research prototypes [14]. The current com-mercially available OSM modules are typically obliviousto the wavelengths carried across it. We use MEMS andOSM interchangeably.4. Optical Circulators: Circulators enable bidirectionaloptical transmission over a fiber, allowing more efficientuse of the ports of optical switches. An optical circula-tor is a three-port device: one port is a shared fiber orswitching port, and the other two ports serve as send andreceive ports.5. Optical Transceivers: Optical transceivers can beof two types: coarse WDM (CWDM) and dense WDM(DWDM). We use DWDM-based transceivers, whichsupport higher bit-rates and more wavelength channelsin a single piece of fiber compared to CWDM.
3 OSA Architecture
In this section, we introduce how OSA2 is built from theabove described optical technologies. Our current designtargets container-size DCNs.
3.1 Building Blocks
Flexible topology. OSA achieves flexible topology viaexploiting the reconfigurability of MEMS. Say we startby connecting each of N ToRs to one port on an N -portMEMS. Given the MEMS bipartite port-matching, thisimplies that every ToR can only communicate with oneother ToR at any instant, leaving the ToR level graph dis-connected. If we connect N/k ToRs to k ports each atthe MEMS, each ToR can communicate with k ToRs si-multaneously. Here, k > 1 is the degree of a ToR, not
2We presented a preliminary design of OSA in an earlier workshoppaper [32].
3

its port count, in the ToR graph. The configuration of theMEMS determines which set of ToRs are connected; andOSA must ensure that the ToR graph is connected whenconfiguring the MEMS.
Given a ToR graph connected by optical circuitsthrough the MEMS, we use hop-by-hop stitching of suchcircuits to achieve network-wide connectivity. To reachremote ToRs that are not directly connected, a ToR usesone of its k connections. This first-hop ToR receives thetransmission over fiber, converts it to electrical signals,reads the packet header, and routes it towards the des-tination. At each hop, every packet is converted fromoptics to electronics and then back to optics (O-E-O)and switching at the ToR. Pure O-E-O conversion can bedone in sub-nanoseconds [21]. Note that at any port, theaggregate transit, incoming and outgoing traffic cannotexceed the port’s capacity in each direction. So, high-volume connections must use a minimal number of hops.OSA should manage the topology to adhere to this re-quirement. Evaluation in Sec. 6 quantifies the overhead(both O-E-O and switching) of hop-by-hop routing.Flexible link capacity. Every ToR has degree k. If eachedge had fixed capacity, multiple edges may need to beused for this ToR to communicate with another ToR at arate higher than a single edge supports. To overcome thisproblem, OSA combines the capability of optical fibersto carry multiple wavelengths at the same time (WDM)with the dynamic reconfigurability of the WSS. Conse-quently, a ToR is connected to the MEMS through a mul-tiplexer and a WSS unit.
Specifically, suppose ToR A wants to communicatewith ToR B using w times the line speed of a singleport. The ToR will use w ports, each associated witha (unique) wavelength, to serve this request. WDM en-ables these w wavelengths, together with the rest fromthis ToR, to be multiplexed into one optical fiber thatfeeds the WSS. The WSS splits these w wavelengths tothe appropriate MEMS port which has a circuit to ToRB (doing likewise for k − 1 other wavelengths). Thus, aw× (line-speed) capacity circuit is set up from A to B,at runtime. By varying the value of w for every MEMScircuit, OSA achieves dynamic capacity for every edge.
We note that a fiber cannot carry two channels over thesame wavelength in the same direction. Moreover, to en-able a ToR pair to communicate using all available wave-lengths, we require that each ToR port (facing the opti-cal interconnect) is assigned a wavelength unique acrossports at this ToR. The same wavelength is used to receivetraffic as well: each port thus sends and receives trafficat one fixed wavelength. The same set of wavelengthsis recycled across ToRs. This allows all wavelengths atone ToR to be multiplexed and delivered after demulti-plexing to individual ports at the destination ToR. Thiswavelength-port association is a design time decision.
Figure 2: The overall OSA architecture; detailed struc-ture is shown only for ToR1 for clarity.
Efficient port usage. To make full use of the MEMSports, we desire that each circuit over the MEMS be bidi-rectional. For this, we use optical circulators betweenthe ToR and the MEMS ports. A circulator connects thesend channel of the transceiver from a ToR to the MEMS(after the channel has passed through the WSS). It si-multaneously delivers the traffic incoming towards a ToRfrom the MEMS, to this ToR. Note that even though theMEMS edges are bidirectional, the capacities of the twodirections are independent of each other.
3.2 Putting it All Together: OSA-2560Fig. 2 illustrates the general OSA architecture. We nowdiscuss one specific instantiation, OSA-2560, with N =80 ToRs, W = 32 wavelengths and ToR degree k = 4using a 320-port MEMS to support 2560 servers.
Each ToR is a commodity electrical switch with 64 10-GigE ports [7]. 32 of these ports are connected to servers,while the remaining face the optical interconnect. Eachport facing the optical interconnect has a transceiver as-sociated with a fixed and unique wavelength for sendingand receiving data. The transceiver uses separate fibersto connect to the send and receive infrastructures.
The send fiber from the transceivers from each of the32 ports at a ToR is connected to an optical multiplexer.The multiplexer feeds a 1×4 WSS. The WSS splits theset of 32 wavelengths it sees into 4 groups, each groupbeing transmitted on its own fiber. These fibers are con-nected to the MEMS via circulators to enable bidirec-tional communications. The 4 receive fibers from 4 cir-culators are connected to a power coupler (similar to amultiplexer, but simpler), which combines their wave-lengths onto one fiber. This fiber feeds a demultiplexer,which splits each incoming wavelength to its associatedport on the ToR.
We point out two key properties of the above intercon-nect. First, each ToR can communicate simultaneouslywith any 4 other ToRs. This implies that the MEMS con-figuration allows us to construct all possible 4-regular
4
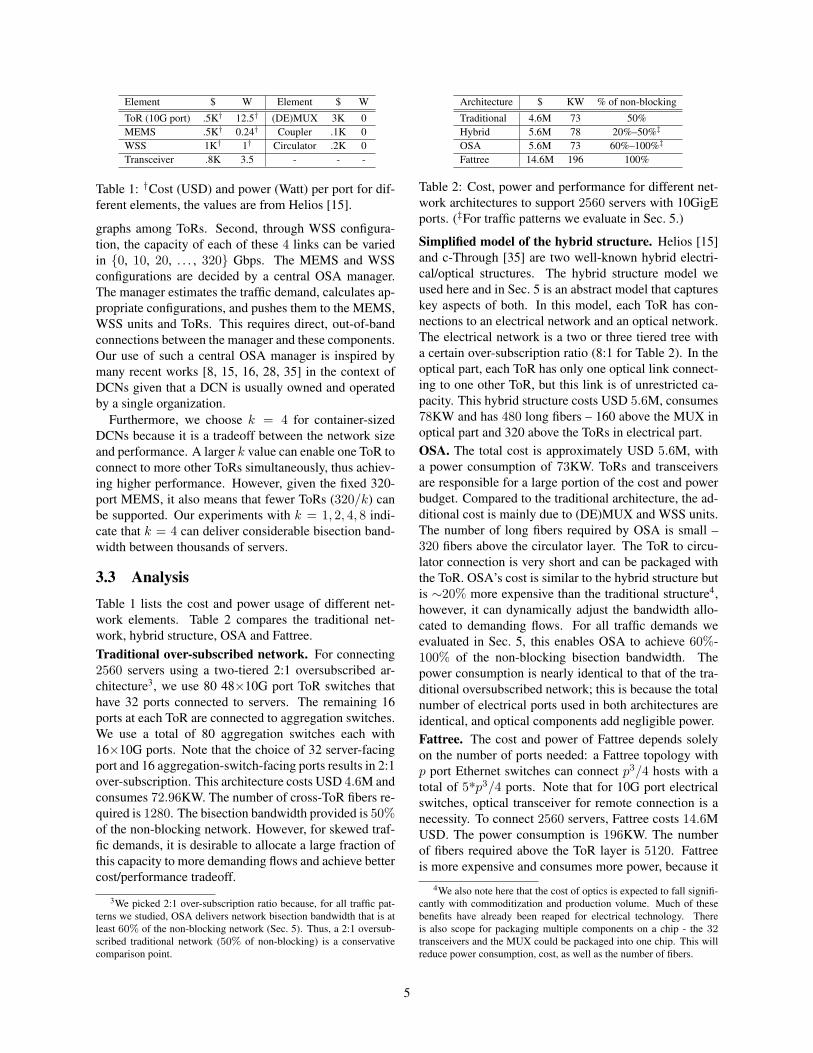
Element $ W Element $ W
ToR (10G port) .5K† 12.5† (DE)MUX 3K 0MEMS .5K† 0.24† Coupler .1K 0WSS 1K† 1† Circulator .2K 0Transceiver .8K 3.5 - - -
Table 1: †Cost (USD) and power (Watt) per port for dif-ferent elements, the values are from Helios [15].
graphs among ToRs. Second, through WSS configura-tion, the capacity of each of these 4 links can be variedin {0, 10, 20, . . . , 320} Gbps. The MEMS and WSSconfigurations are decided by a central OSA manager.The manager estimates the traffic demand, calculates ap-propriate configurations, and pushes them to the MEMS,WSS units and ToRs. This requires direct, out-of-bandconnections between the manager and these components.Our use of such a central OSA manager is inspired bymany recent works [8, 15, 16, 28, 35] in the context ofDCNs given that a DCN is usually owned and operatedby a single organization.
Furthermore, we choose k = 4 for container-sizedDCNs because it is a tradeoff between the network sizeand performance. A larger k value can enable one ToR toconnect to more other ToRs simultaneously, thus achiev-ing higher performance. However, given the fixed 320-port MEMS, it also means that fewer ToRs (320/k) canbe supported. Our experiments with k = 1, 2, 4, 8 indi-cate that k = 4 can deliver considerable bisection band-width between thousands of servers.
3.3 AnalysisTable 1 lists the cost and power usage of different net-work elements. Table 2 compares the traditional net-work, hybrid structure, OSA and Fattree.Traditional over-subscribed network. For connecting2560 servers using a two-tiered 2:1 oversubscribed ar-chitecture3, we use 80 48×10G port ToR switches thathave 32 ports connected to servers. The remaining 16ports at each ToR are connected to aggregation switches.We use a total of 80 aggregation switches each with16×10G ports. Note that the choice of 32 server-facingport and 16 aggregation-switch-facing ports results in 2:1over-subscription. This architecture costs USD 4.6M andconsumes 72.96KW. The number of cross-ToR fibers re-quired is 1280. The bisection bandwidth provided is 50%of the non-blocking network. However, for skewed traf-fic demands, it is desirable to allocate a large fraction ofthis capacity to more demanding flows and achieve bettercost/performance tradeoff.
3We picked 2:1 over-subscription ratio because, for all traffic pat-terns we studied, OSA delivers network bisection bandwidth that is atleast 60% of the non-blocking network (Sec. 5). Thus, a 2:1 oversub-scribed traditional network (50% of non-blocking) is a conservativecomparison point.
Architecture $ KW % of non-blocking
Traditional 4.6M 73 50%Hybrid 5.6M 78 20%–50%‡
OSA 5.6M 73 60%–100%‡
Fattree 14.6M 196 100%
Table 2: Cost, power and performance for different net-work architectures to support 2560 servers with 10GigEports. (‡For traffic patterns we evaluate in Sec. 5.)
Simplified model of the hybrid structure. Helios [15]and c-Through [35] are two well-known hybrid electri-cal/optical structures. The hybrid structure model weused here and in Sec. 5 is an abstract model that captureskey aspects of both. In this model, each ToR has con-nections to an electrical network and an optical network.The electrical network is a two or three tiered tree witha certain over-subscription ratio (8:1 for Table 2). In theoptical part, each ToR has only one optical link connect-ing to one other ToR, but this link is of unrestricted ca-pacity. This hybrid structure costs USD 5.6M, consumes78KW and has 480 long fibers – 160 above the MUX inoptical part and 320 above the ToRs in electrical part.OSA. The total cost is approximately USD 5.6M, witha power consumption of 73KW. ToRs and transceiversare responsible for a large portion of the cost and powerbudget. Compared to the traditional architecture, the ad-ditional cost is mainly due to (DE)MUX and WSS units.The number of long fibers required by OSA is small –320 fibers above the circulator layer. The ToR to circu-lator connection is very short and can be packaged withthe ToR. OSA’s cost is similar to the hybrid structure butis ∼20% more expensive than the traditional structure4,however, it can dynamically adjust the bandwidth allo-cated to demanding flows. For all traffic demands weevaluated in Sec. 5, this enables OSA to achieve 60%-100% of the non-blocking bisection bandwidth. Thepower consumption is nearly identical to that of the tra-ditional oversubscribed network; this is because the totalnumber of electrical ports used in both architectures areidentical, and optical components add negligible power.Fattree. The cost and power of Fattree depends solelyon the number of ports needed: a Fattree topology withp port Ethernet switches can connect p3/4 hosts with atotal of 5*p3/4 ports. Note that for 10G port electricalswitches, optical transceiver for remote connection is anecessity. To connect 2560 servers, Fattree costs 14.6MUSD. The power consumption is 196KW. The numberof fibers required above the ToR layer is 5120. Fattreeis more expensive and consumes more power, because it
4We also note here that the cost of optics is expected to fall signifi-cantly with commoditization and production volume. Much of thesebenefits have already been reaped for electrical technology. Thereis also scope for packaging multiple components on a chip - the 32transceivers and the MUX could be packaged into one chip. This willreduce power consumption, cost, as well as the number of fibers.
5
Estimate
traffic
demand
Compute
the
topology
Compute
the routes
Compute
wavelength
assignment
MEMS
configuration
ToR routing
configuration
WSS
configuration
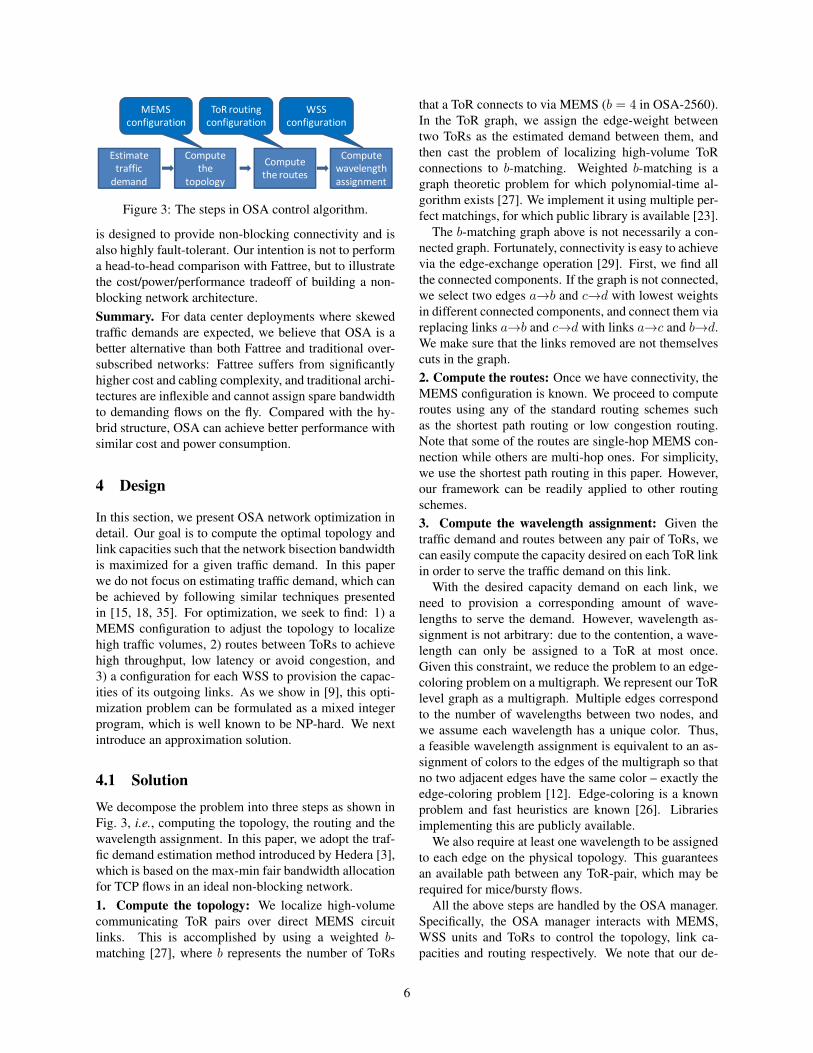
Figure 3: The steps in OSA control algorithm.
is designed to provide non-blocking connectivity and isalso highly fault-tolerant. Our intention is not to performa head-to-head comparison with Fattree, but to illustratethe cost/power/performance tradeoff of building a non-blocking network architecture.Summary. For data center deployments where skewedtraffic demands are expected, we believe that OSA is abetter alternative than both Fattree and traditional over-subscribed networks: Fattree suffers from significantlyhigher cost and cabling complexity, and traditional archi-tectures are inflexible and cannot assign spare bandwidthto demanding flows on the fly. Compared with the hy-brid structure, OSA can achieve better performance withsimilar cost and power consumption.
4 Design
In this section, we present OSA network optimization indetail. Our goal is to compute the optimal topology andlink capacities such that the network bisection bandwidthis maximized for a given traffic demand. In this paperwe do not focus on estimating traffic demand, which canbe achieved by following similar techniques presentedin [15, 18, 35]. For optimization, we seek to find: 1) aMEMS configuration to adjust the topology to localizehigh traffic volumes, 2) routes between ToRs to achievehigh throughput, low latency or avoid congestion, and3) a configuration for each WSS to provision the capac-ities of its outgoing links. As we show in [9], this opti-mization problem can be formulated as a mixed integerprogram, which is well known to be NP-hard. We nextintroduce an approximation solution.
4.1 Solution
We decompose the problem into three steps as shown inFig. 3, i.e., computing the topology, the routing and thewavelength assignment. In this paper, we adopt the traf-fic demand estimation method introduced by Hedera [3],which is based on the max-min fair bandwidth allocationfor TCP flows in an ideal non-blocking network.1. Compute the topology: We localize high-volumecommunicating ToR pairs over direct MEMS circuitlinks. This is accomplished by using a weighted b-matching [27], where b represents the number of ToRs
that a ToR connects to via MEMS (b = 4 in OSA-2560).In the ToR graph, we assign the edge-weight betweentwo ToRs as the estimated demand between them, andthen cast the problem of localizing high-volume ToRconnections to b-matching. Weighted b-matching is agraph theoretic problem for which polynomial-time al-gorithm exists [27]. We implement it using multiple per-fect matchings, for which public library is available [23].
The b-matching graph above is not necessarily a con-nected graph. Fortunately, connectivity is easy to achievevia the edge-exchange operation [29]. First, we find allthe connected components. If the graph is not connected,we select two edges a→b and c→d with lowest weightsin different connected components, and connect them viareplacing links a→b and c→d with links a→c and b→d.We make sure that the links removed are not themselvescuts in the graph.2. Compute the routes: Once we have connectivity, theMEMS configuration is known. We proceed to computeroutes using any of the standard routing schemes suchas the shortest path routing or low congestion routing.Note that some of the routes are single-hop MEMS con-nection while others are multi-hop ones. For simplicity,we use the shortest path routing in this paper. However,our framework can be readily applied to other routingschemes.3. Compute the wavelength assignment: Given thetraffic demand and routes between any pair of ToRs, wecan easily compute the capacity desired on each ToR linkin order to serve the traffic demand on this link.
With the desired capacity demand on each link, weneed to provision a corresponding amount of wave-lengths to serve the demand. However, wavelength as-signment is not arbitrary: due to the contention, a wave-length can only be assigned to a ToR at most once.Given this constraint, we reduce the problem to an edge-coloring problem on a multigraph. We represent our ToRlevel graph as a multigraph. Multiple edges correspondto the number of wavelengths between two nodes, andwe assume each wavelength has a unique color. Thus,a feasible wavelength assignment is equivalent to an as-signment of colors to the edges of the multigraph so thatno two adjacent edges have the same color – exactly theedge-coloring problem [12]. Edge-coloring is a knownproblem and fast heuristics are known [26]. Librariesimplementing this are publicly available.
We also require at least one wavelength to be assignedto each edge on the physical topology. This guaranteesan available path between any ToR-pair, which may berequired for mice/bursty flows.
All the above steps are handled by the OSA manager.Specifically, the OSA manager interacts with MEMS,WSS units and ToRs to control the topology, link ca-pacities and routing respectively. We note that our de-
6

composition heuristic is not optimal and there is room toimprove. However, it provides satisfactory gains as wewill see.
5 Simulation
In this section, we evaluate OSA-2560 via analytical sim-ulations. We start with the simulation methodology, andthen present the results.
5.1 Simulation Methods
Simulation goals: Since our testbed only has 8 ToRs(Sec. 6), to evaluate OSA’s capabilities at its intendedscale, we conduct analytical estimation of network bisec-tion bandwidth of OSA-2560 under various traffic pat-terns. Our results in this section are essentially compu-tations of the expected bisection bandwidth in the steadystate, ignoring software and hardware overheads whichare considered in our testbed experiments in Sec. 6. Wecompare OSA with a non-blocking network, a hybridnetwork with varied over-subscription ratios in the elec-trical part and a 2:1 oversubscribed traditional network.Communication patterns: We use the following realmeasurement traces and synthetic traffic data to evalu-ate the performance of OSA in the presence of changingcommunication patterns and traffic demands.
1. Mapreduce-demand: We collected real trafficmatrices in a production data center with around 400servers, which mainly runs Mapreduce applications5.We compute demands by averaging the traffic over 30-second periods. For each demand, we identify the com-munication pattern by filtering out mice flows and focus-ing on the elephant ones. We map these communicationpatterns onto OSA-2560 using spatial replication.
2. Measurement-based: Recent measurements [6, 18]reveal several data center traffic characteristics. One im-portant feature is that hotspot ToR links are often associ-ated with a high fan-in (or fan-out), and most of the traf-fic (80%) are within the rack, resulting in highly skeweddistribution. We synthesize this kind of traffic patternsby randomly choosing 12 hotspots out of 80 racks, witheach one connecting to 6-10 other randomly chosen ToRsrespectively. We intentionally assume all traffic exit therack in order to create intensive communications.
3. ToR Level Shifting: We index the ToR switchesfrom 0 to 79 and shift traffic round-by-round. Initially,all servers in ToR i talk to all servers in ToRs (i ± 1)mod 80 and (i ± 2) mod 80. Then we shift these com-munications to servers in the next ToR after each round.
4. Server Level Shifting: We index the servers from 0to 2559. We start with server i talking to 4 other servers:
5The name of the production data center company is anonymized.
(i ± 32) mod 2560 and (i ± 64) mod 2560. With 32servers in a rack, initially, this implies that each rackcommunicates with 4 other racks. In successive rounds,server i talks to (i±(32+s)) mod 2560 and (i±(64+s))mod 2560 (s = 4, 8, 12, · · · ). This implies that each rackcommunicates with 6 racks in most rounds, with traf-fic spread across these 6 connections increasing and de-creasing periodically.
5. Random Shifting: In each round, each server in ToRi talks to servers in up to 10 randomly selected ToRs. Inthis pattern, many ToRs may simultaneously talk to oneToR, creating hotspots and communication bottlenecks.
6. Increasing Destinations: We gradually increase thenumber of destinations for each ToR from 4 through 79(i.e., all-to-all communications) to further investigate theimpact of traffic spread on OSA performance.Evaluation metrics: First, we evaluate the network bi-section bandwidth provided by OSA for each communi-cation pattern. Then, we quantify the impact of flexibletopology and flexible link capacity within OSA architec-ture respectively. Finally, we measure time cost of thecontrol algorithm described in Sec 4.1. The experimentswere conducted on a Dell Optiplex machine with Intel2.33 GHz dual-core CPU and 4 GB Memory.The hybrid structure: We simulate the hybrid structuremodel introduced in Sec. 3.3 which captures the key fea-tures of c-Through and Helios. To optimize the networkto traffic, we run maximum weighted matching to deter-mine which optical circuits to establish. Then we calcu-late how much of the remaining demand can be satisfiedby the electrical network at best.Traditional 2:1 oversubscribed network: We also sim-ulate a 2:1 over-subscribed electrical network whose de-tails were described earlier in Sec. 3.3.
5.2 Evaluation Results
5.2.1 Performance of OSA
In this experiment, the topology and link capacities areadaptively adjusted to the current traffic pattern. As soonas traffic pattern changes, the network reconfigures itstopology instantaneously. In practice, the performanceof OSA would be also impacted by the time taken to esti-mate the traffic demand, the time taken by the algorithmsto identify the appropriate topology, and reconfigurationtime of optical devices. Experimental results from ourprototype will encompass these overheads (see Sec. 6).
Fig. 4 shows the average network bisection bandwidthover 100 instances of each traffic pattern obtained by dif-ferent DCN structures. Note that all the results are nor-malized by the bisection bandwidth of the non-blockingscenario. We make following observations.
7

Mapreduce−demand Measurement−based ToR−level shifting Server−level shifting Random shifting 0
0.2
0.4
0.6
0.8
1
Communication patterns
Ave
rage
bis
ectio
n ba
ndw
idth
Non−blocking OSA Traditional(2:1) Hybrid(8:1) Hybrid(16:1) Hybrid(32:1)
Figure 4: The average network bisection bandwidth (normalized) achieved for different communication patterns.
First, we find that OSA delivers high bisection band-width (60%-100% of non-blocking) for both real andsynthetic traffic patterns. Under the Mapreduce-demand,OSA can provide over 80% of the non-blocking band-width. This is because OSA adaptively changes its topol-ogy and link capacities according to the present trafficpattern. In our simulation setting, we choose 4-regulargraph for OSA. Because some ToRs talk to more than 4(up to 8) other ToRs, OSA cannot assign direct circuitsto feed all these communications. The multi-hop routingpossibly causes congestion on the intermediate switches,leading to performance degradation. That is why OSAis 20% from non-blocking. From the figure, we find thatOSA delivers higher bandwidth (90% of non-blocking)for the measurement-based pattern, because it has rela-tively less hotspots compared to the previous one.
Second, when each ToR communicates with 4 otherToRs (in the ToR-level shifting pattern), OSA achievesbisection bandwidth nearly identical to that of the non-blocking network. This result is not surprising given thatOSA allows a 4-regular graph and hence provides 4 opti-cal circuits at each ToR to perfectly support the demand.Note that the traditional 2:1 oversubscribed network de-livers 50% of non-blocking for all traffic patterns.
Third, in our results (not shown here due to lack ofspace), we observe that the bisection bandwidth achievedby OSA oscillates periodically from approximately 60%to 100% (with average at 80%) of non-blocking for theserver-level shifting pattern. This is because each ToRwould periodically communicate with 4 and 6 other ToRsin such traffic pattern. We further observe that the bisec-tion bandwidth obtained by OSA in the random shiftingpattern is the worst – 60% of non-blocking. This is ex-pected since the number of peers each ToR communi-cates with is larger than the other two shifting patterns.Specifically, for the ToR-level shifting, a ToR talks to4 other peers; For the server-level shifting, a ToR com-municates with 4-6 peers; While for the random shiftingpattern, a ToR communicates with 5-20 peers. As dis-cussed above, when the number of communication peersfor a ToR is larger than 4, some flows will necessarily
0 20 40 60 800
0.2
0.4
0.6
0.8
1
Number of communiciation peers per ToR
Bis
ectio
n ba
ndw
idth
OSA
Figure 5: Network bisection bandwidth with an increas-ing number of peers each ToR communicates with.
use multi-hop paths causing performance degradation.Concretely, for the ToR-level shifting most paths are di-rect, for the server-level shifting most paths are direct or2 hops, and for the random shifting most paths are in-creased to 2-6 hops. The multi-hop paths taken by someflows contend for the available bandwidth at intermediateswitches, thus limiting the peak achievable bandwidth.
Next, we present the bisection bandwidth achieved byOSA with an increasing number of inter-ToR commu-nications. As it moves gradually to all-to-all communi-cation (Fig. 5), as expected, the network bisection band-width drops due to extensive bandwidth contention at theToRs. Note that the traditional 2:1 oversubscribed net-work would continue to perform at 50% of non-blocking.This result is presented only for comparison purposessince OSA is not designed for all-to-all communication.
Furthermore, we note that OSA outperforms the hy-brid model by 80%-250% in our evaluation. This is nota surprising result because the hybrid model only has aperfect matching between ToRs in the optical part. Thismeans that one ToR is able to talk to one other ToR ata time. We increase over-subscription ratios in the elec-trical part from 32:1 to 8:1 and see only incremental im-provement due to the oversubscribed network. In con-trast, in OSA-2560, we have a 4-regular graph meaningone ToR can directly communicate with 4 other ToRs si-multaneously. Further, OSA also dynamically adapts itslink capacities to the traffic demand. The higher flexibil-ity of OSA leads to its better performance.
In Fig. 6, we inspect the performance delivered by
8
0 1 2 3 4 5 6 7 80
0.2
0.4
0.6
0.8
1
Number of hops traversedF
ract
ion
of tr
affic
1 2 4 80
0.2
0.4
0.6
0.8
1
k value
Bis
ectio
n ba
ndw
idth
k = 2k = 4k = 8
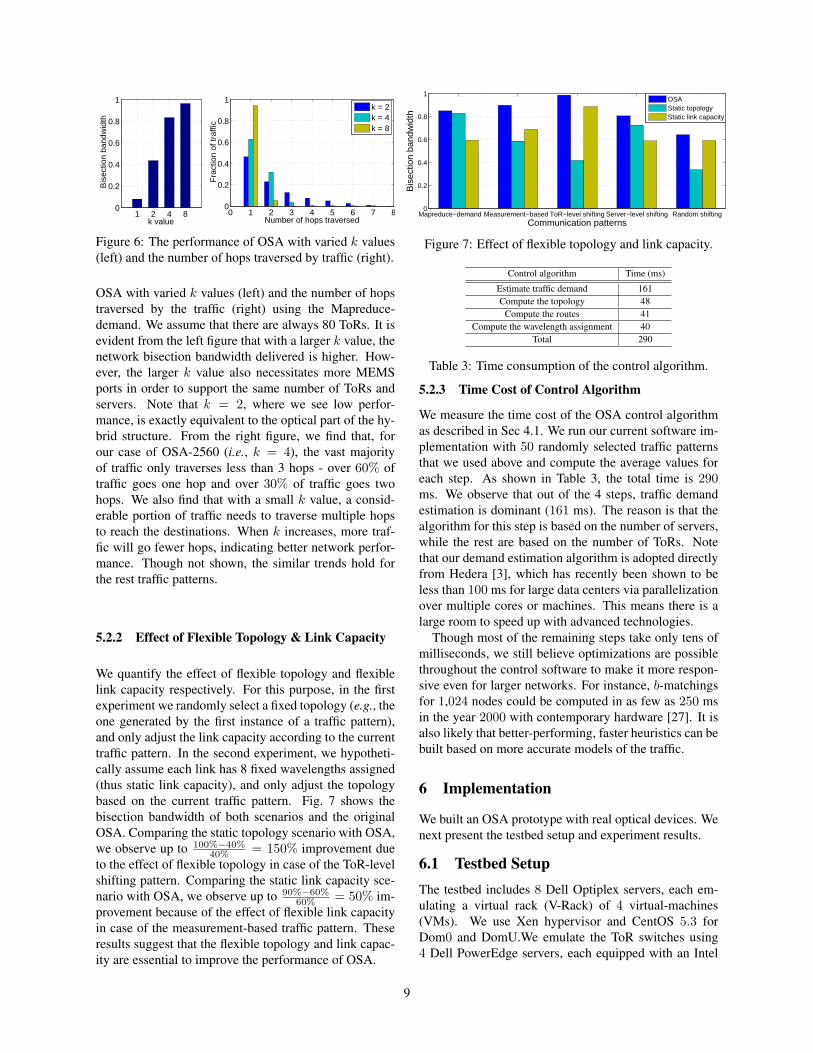
Figure 6: The performance of OSA with varied k values(left) and the number of hops traversed by traffic (right).
OSA with varied k values (left) and the number of hopstraversed by the traffic (right) using the Mapreduce-demand. We assume that there are always 80 ToRs. It isevident from the left figure that with a larger k value, thenetwork bisection bandwidth delivered is higher. How-ever, the larger k value also necessitates more MEMSports in order to support the same number of ToRs andservers. Note that k = 2, where we see low perfor-mance, is exactly equivalent to the optical part of the hy-brid structure. From the right figure, we find that, forour case of OSA-2560 (i.e., k = 4), the vast majorityof traffic only traverses less than 3 hops - over 60% oftraffic goes one hop and over 30% of traffic goes twohops. We also find that with a small k value, a consid-erable portion of traffic needs to traverse multiple hopsto reach the destinations. When k increases, more traf-fic will go fewer hops, indicating better network perfor-mance. Though not shown, the similar trends hold forthe rest traffic patterns.
5.2.2 Effect of Flexible Topology & Link Capacity
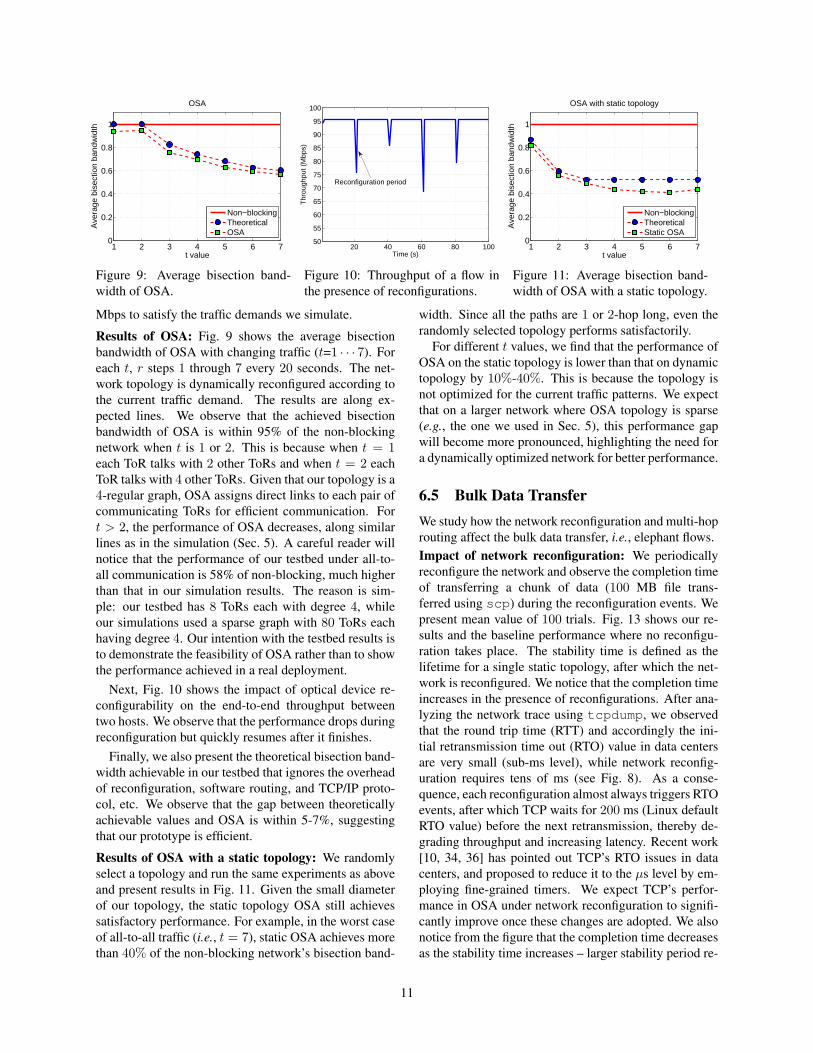
We quantify the effect of flexible topology and flexiblelink capacity respectively. For this purpose, in the firstexperiment we randomly select a fixed topology (e.g., theone generated by the first instance of a traffic pattern),and only adjust the link capacity according to the currenttraffic pattern. In the second experiment, we hypotheti-cally assume each link has 8 fixed wavelengths assigned(thus static link capacity), and only adjust the topologybased on the current traffic pattern. Fig. 7 shows thebisection bandwidth of both scenarios and the originalOSA. Comparing the static topology scenario with OSA,we observe up to 100%−40%
40% = 150% improvement dueto the effect of flexible topology in case of the ToR-levelshifting pattern. Comparing the static link capacity sce-nario with OSA, we observe up to 90%−60%
60% = 50% im-provement because of the effect of flexible link capacityin case of the measurement-based traffic pattern. Theseresults suggest that the flexible topology and link capac-ity are essential to improve the performance of OSA.
Mapreduce−demand Measurement−based ToR−level shifting Server−level shifting Random shifting 0
0.2
0.4
0.6
0.8
1
Communication patterns
Bis
ectio
n ba
ndw
idth
OSAStatic topologyStatic link capacity
Figure 7: Effect of flexible topology and link capacity.
Control algorithm Time (ms)
Estimate traffic demand 161Compute the topology 48
Compute the routes 41Compute the wavelength assignment 40
Total 290
Table 3: Time consumption of the control algorithm.
5.2.3 Time Cost of Control Algorithm
We measure the time cost of the OSA control algorithmas described in Sec 4.1. We run our current software im-plementation with 50 randomly selected traffic patternsthat we used above and compute the average values foreach step. As shown in Table 3, the total time is 290ms. We observe that out of the 4 steps, traffic demandestimation is dominant (161 ms). The reason is that thealgorithm for this step is based on the number of servers,while the rest are based on the number of ToRs. Notethat our demand estimation algorithm is adopted directlyfrom Hedera [3], which has recently been shown to beless than 100 ms for large data centers via parallelizationover multiple cores or machines. This means there is alarge room to speed up with advanced technologies.
Though most of the remaining steps take only tens ofmilliseconds, we still believe optimizations are possiblethroughout the control software to make it more respon-sive even for larger networks. For instance, b-matchingsfor 1,024 nodes could be computed in as few as 250 msin the year 2000 with contemporary hardware [27]. It isalso likely that better-performing, faster heuristics can bebuilt based on more accurate models of the traffic.
6 Implementation
We built an OSA prototype with real optical devices. Wenext present the testbed setup and experiment results.
6.1 Testbed SetupThe testbed includes 8 Dell Optiplex servers, each em-ulating a virtual rack (V-Rack) of 4 virtual-machines(VMs). We use Xen hypervisor and CentOS 5.3 forDom0 and DomU.We emulate the ToR switches using4 Dell PowerEdge servers, each equipped with an Intel
9

Figure 8: Switching time of our OSM and WSS.
2.4GHz quad-core CPU, 8GB DRAM and 12GigE NICs.Each server runs 2 VMs, giving us a total of 8 virtualToRs (V-ToRs). Each V-ToR binds to 6 NICs: one con-nected to one V-Rack, one used for a control connectionto OSA manager, and the remaining 4 used as upstreamlinks to reach other V-ToRs via optical elements.
On top of each V-ToR is a 1×4 CoAdna WSS, a cou-pler, a circulator, a 1×4 MUX and DEMUX pair, and 4transceivers (which are packaged into a media converted(MC) unit). As in Fig 2, each ToR uplink is connected toa transceiver, with the send-fiber of the transceiver con-nected through the MUX, the WSS and the circulator tothe OSM; and the receive-fiber connected to the same cir-culator through the coupler and the DEMUX. We use a1 Polatis series-1000 OSM with 32 ports which allows a16×16 bipartite interconnect. (Each V-ToR has 2 uplinksconnected to each of these two sets of 16 ports.) We use4 wavelengths: 1545.32, 1544.53, 1543.73 and 1542.94nm, corresponding to channel 40, 41, 42 and 43 of ITUgrid with 100 GHz channel spacing.
Further, in our testbed, OSA manager is a separateLinux server and talks to the OSM and ToRs via Ethernetports, and to the WSS units via RS-232 serial ports.
6.2 Understanding the Optical DevicesTwo critical optical devices in OSA are OSM and WSS.A common concern for them is the reconfiguration over-head. To measure the overhead, Fig. 8 (left) shows theoutput power level on two ports of the OSM over time,during a reconfiguration event. We see a clear transitionperiod, i.e., from the high→low output power level shifton one port, to the low→high output power level shift onthe other port. We observe that the switching delay ofour OSM is 9 ms, consistent with [15, 35].
Next, we measure the reconfiguration time of WSSby switching a wavelength channel between two outputports. As shown in Fig. 8 (right), this transition period isaround 14 ms. However, the reconfiguration of the OSMand WSS can be performed in parallel.
6.3 Understanding the O-E-O ConversionTo measure the impact of O-E-O conversion, we spe-cially connect 4 servers as in Fig. 12 (left). Two serversin the middle are configured as routers and equipped with
MC MC
MCMC
Electrical Optical
10 20 40 80 160 320 6400
100
200
300
400
500
late
ncy
(µ s
)
transmission rate (Mb/s)
Pure electricalHybrid optical/electrical
Figure 12: O-E-O conversion.
optical media converters. We create a routing loop byconfiguring the IP forwarding tables of the routers. Ineach router, we deploy a netfilter kernel moduleand utilize the NF_IP_PRE_ROUTING hook to inter-cept all IP packets. We record the time lag betweenthe instant when the packets first arrive in the networkand when their TTL expires. This way, we are able tomeasure the multi-hop latency for O-E-O conversion andcompare it with the baseline where all servers are di-rectly connected using only electrical devices. Resultsin Fig. 12 (right) compare the average one-hop switch-ing latency for both the hybrid optical/electrical and pureelectrical architectures under different traffic load. It isevident from the figure, that O-E-O conversion does notincur noticeable (the maximum deviation in the absolutevalue and standard deviation is 38 and 58 µs, respec-tively), if any, additional switching latency. demonstrat-ing feasibility of O-E-O employed by OSA.
6.4 OSA System Performance
We conduct two sets of experiments: one is for originalOSA and the other is OSA with static topology. We usesynthetic traffic patterns similar to Sec 5.1. More specif-ically, traffic is described by parameters (t, r): servers inToR i (i = 0 · · · 7) send traffic to servers in t ToRs, i.e.,[i+r, i+r+1, ..., i+r+(t−1)]. We change t from 1 to7 to generate different traffic loads (t=7 means all-to-allcommunication). For each t, we vary r from 1 to 7.
Our goal is to compare the achieved bisection band-width of OSA against that of a non-blocking network asthe traffic spread out (with increasing t), and to measurethe effect of topology reconfiguration. Note that varyingr with a fixed t does not produce fundamentally differ-ent traffic distributions, it merely permutes which ToRstalk with which other ToRs, thus necessitating a changeof topology without a change in traffic load or spread.
In our testbed, the NICs of servers support 10, 100,and 1000 Mbps full-duplex modes. In all our experi-ments, we limit the maximum sending rate of each flowto be 100 Mbps. This enables us to emulate a non-blocking network for comparison: for OSA, all the up-link ports of ToRs are set at 100 Mbps, while for non-blocking, we increase particular uplink ports to 1000
10
1 2 3 4 5 6 70
0.2
0.4
0.6
0.8
1
OSA
t value
Ave
rage
bis
ectio
n ba
ndw
idth
Non−blockingTheoreticalOSA
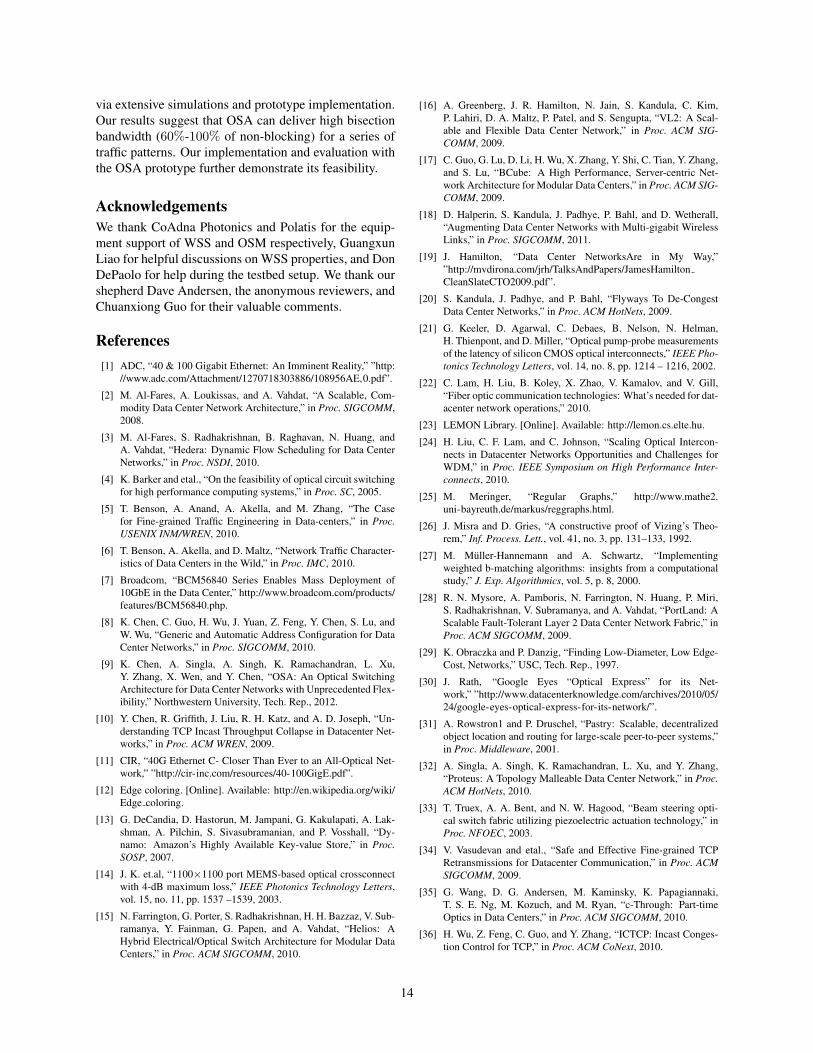
Figure 9: Average bisection band-width of OSA.
20 40 60 80 10050
55
60
65
70
75
80
85
90
95
100
Time (s)
Thr
ough
put (
Mbp
s)
Reconfiguration period
Figure 10: Throughput of a flow inthe presence of reconfigurations.
1 2 3 4 5 6 70
0.2
0.4
0.6
0.8
1
OSA with static topology
t value
Ave
rage
bis
ectio
n ba
ndw
idth
Non−blockingTheoreticalStatic OSA
Figure 11: Average bisection band-width of OSA with a static topology.
Mbps to satisfy the traffic demands we simulate.
Results of OSA: Fig. 9 shows the average bisectionbandwidth of OSA with changing traffic (t=1 · · · 7). Foreach t, r steps 1 through 7 every 20 seconds. The net-work topology is dynamically reconfigured according tothe current traffic demand. The results are along ex-pected lines. We observe that the achieved bisectionbandwidth of OSA is within 95% of the non-blockingnetwork when t is 1 or 2. This is because when t = 1each ToR talks with 2 other ToRs and when t = 2 eachToR talks with 4 other ToRs. Given that our topology is a4-regular graph, OSA assigns direct links to each pair ofcommunicating ToRs for efficient communication. Fort > 2, the performance of OSA decreases, along similarlines as in the simulation (Sec. 5). A careful reader willnotice that the performance of our testbed under all-to-all communication is 58% of non-blocking, much higherthan that in our simulation results. The reason is sim-ple: our testbed has 8 ToRs each with degree 4, whileour simulations used a sparse graph with 80 ToRs eachhaving degree 4. Our intention with the testbed results isto demonstrate the feasibility of OSA rather than to showthe performance achieved in a real deployment.
Next, Fig. 10 shows the impact of optical device re-configurability on the end-to-end throughput betweentwo hosts. We observe that the performance drops duringreconfiguration but quickly resumes after it finishes.
Finally, we also present the theoretical bisection band-width achievable in our testbed that ignores the overheadof reconfiguration, software routing, and TCP/IP proto-col, etc. We observe that the gap between theoreticallyachievable values and OSA is within 5-7%, suggestingthat our prototype is efficient.
Results of OSA with a static topology: We randomlyselect a topology and run the same experiments as aboveand present results in Fig. 11. Given the small diameterof our topology, the static topology OSA still achievessatisfactory performance. For example, in the worst caseof all-to-all traffic (i.e., t = 7), static OSA achieves morethan 40% of the non-blocking network’s bisection band-
width. Since all the paths are 1 or 2-hop long, even therandomly selected topology performs satisfactorily.
For different t values, we find that the performance ofOSA on the static topology is lower than that on dynamictopology by 10%-40%. This is because the topology isnot optimized for the current traffic patterns. We expectthat on a larger network where OSA topology is sparse(e.g., the one we used in Sec. 5), this performance gapwill become more pronounced, highlighting the need fora dynamically optimized network for better performance.
6.5 Bulk Data TransferWe study how the network reconfiguration and multi-hoprouting affect the bulk data transfer, i.e., elephant flows.Impact of network reconfiguration: We periodicallyreconfigure the network and observe the completion timeof transferring a chunk of data (100 MB file trans-ferred using scp) during the reconfiguration events. Wepresent mean value of 100 trials. Fig. 13 shows our re-sults and the baseline performance where no reconfigu-ration takes place. The stability time is defined as thelifetime for a single static topology, after which the net-work is reconfigured. We notice that the completion timeincreases in the presence of reconfigurations. After ana-lyzing the network trace using tcpdump, we observedthat the round trip time (RTT) and accordingly the ini-tial retransmission time out (RTO) value in data centersare very small (sub-ms level), while network reconfig-uration requires tens of ms (see Fig. 8). As a conse-quence, each reconfiguration almost always triggers RTOevents, after which TCP waits for 200 ms (Linux defaultRTO value) before the next retransmission, thereby de-grading throughput and increasing latency. Recent work[10, 34, 36] has pointed out TCP’s RTO issues in datacenters, and proposed to reduce it to the µs level by em-ploying fine-grained timers. We expect TCP’s perfor-mance in OSA under network reconfiguration to signifi-cantly improve once these changes are adopted. We alsonotice from the figure that the completion time decreasesas the stability time increases – larger stability period re-
11

1 2 3 4 5 6 7 8 9 100
1
2
3
4
5
Stability time (s)
Com
plet
ion
time
(s)
With reconfigurationBaseline (no reconfiguration)
Figure 13: Impact of topology recon-figuration on bulk data transfer.
0 1 2 3 4 5 6 7 80
1
2
3
4
5
Number of hops
Com
plet
ion
time
(s)
With full background trafficWith no background traffic
Figure 14: Impact of multi-hop rout-ing on bulk data transfer.
0 1 2 3 4 5 6 7 80
2
4
6
8
10
Number of hops
Rou
nd tr
ip ti
me
(ms)
With full background trafficWith no background traffic
Figure 15: Impact of multi-hop rout-ing on simulated mice flows.
sults in fewer network state changes and therefore fewerRTO events during the course of data transfer.
Impact of multi-hop routing: Our prototype topologyis a low-diameter network due to a 8-node 4-regulargraph. In order to evaluate the impact of multi-hop rout-ing on bulk data transfer, we intentionally rearrange our8 ToR switches in a line to form a linear topology withlarger diameter. In Fig. 14, we measure the completiontime of data transfer (100 MB file transferred using scp)in terms of the number of hops they pass through. Specif-ically, we consider two scenarios. In the first case, thenetwork is free of background traffic. In the second case,all the links in the network are saturated by other ele-phant TCP flows. From the figure, we find that in bothcases the completion time is relatively consistent regard-less of the hops. This gives us confidence that multi-hop routing does not affect the performance of bulk datatransfer seriously. We can further notice from the figurethat the influence of multi-hop O-E-O conversion dur-ing data transfer is negligible. We also observe a nearlyconstant gap between the two curves, which is due to dif-ferent link utilizations in the two experiments.
6.6 Mice Flow Transfer
After inspecting the performance of bulk data transfer,we further check the impact of multi-hop routing ontransferring mice flows. For this purpose, we use pingto emulate latency sensitive flows and evaluate its perfor-mance with/without background traffic as above. Fig. 15shows the average round trip time (RTT) of 100 pingpackets with varying path lengths. As expected, the RTTincreases with more hops. However, we find that the ab-solute increment is small: 1ms (without background traf-fic) and 2ms (with full background traffic), respectively,after 7 hops. These results suggest that the hop-by-hopstitching of optical paths is a feasible approach to provideoverall connectivity. We note that network reconfigura-tion may have non-trivial impact on the latency-sensitiveflows transfer, since it happens on the order of 10ms. Wefurther discuss options to handle such issue in Sec. 7.
1 2 3 4 5 6 7 8 9 100
0.010.020.030.040.050.06
Stability time (s)
Fra
ctio
n (f
low
#)
1 2 3 4 5 6 7 8 9 100
0.010.020.030.040.050.06
Stability time (s)F
ract
ion
(flo
w s
ize)
Figure 16: The potentially affected mice flows.
7 Discussion and Related Work
7.1 Mice Flow during Reconfiguration
OSA ensures that all ToRs are in a connected graphand uses hop-by-hop stitching of existing circuits to pro-vide overall network connectivity. However, during net-work reconfiguration, a pair of ToRs may be temporar-ily disconnected for around 10 ms. While this can belargely tolerated by latency-insensitive applications suchas Mapreduce or Dryad, it would affect those operatingwith latency-sensitive mice flows like Dynamo [13].
In Fig. 16, we estimate, in the worst case, how manymice flows (in terms of flow count and size) can be po-tentially affected due to the reconfiguration. We usedthe production data center traffic from Sec. 5.1 and used10 MB to differentiate elephant flows from small ones.We find that for this particular dataset, when the stabilitytime varies from 9 to 2 seconds, there are 1% to 4.5%of the mice flows that can be affected during the recon-figurations. This implies that as the network experiencesmore frequent reconfigurations, a larger fraction of miceflows may get affected. We next discuss two possibleoptions to handle this issue.
Our basic idea is to reserve a static, connected channelin the OSA network. To do so, we can reserve a smallnumber of wavelengths and MEMS/WSS ports that arenever reconfigured and mice flows are always sent overthem. Such a channel can be simply a spanning tree or
12

other connected topologies. Given the topology of thechannel is controlled by MEMS, we can arrange it in alow-diameter manner so that the transmission of miceflows is optimized. However, this approach consumesexpensive MEMS/WSS ports, which otherwise can bebetter utilized for other applications or at stable time.
An alternative approach to building the channel with-out using MEMS/WSS ports is directly connecting allthe ToRs together to form a ring or a star network. Forthe ring, we can reserve 2 ports on each ToR and directlyconnect them iteratively. In case of OSA-2560 with 80ToRs, the diameter is 40 hops. To reduce the path length,it is possible to reserve more ports on each ToR and con-nect them structurally using DHT techniques [31], e.g.,the diameter is expected to be 3-4 hops with high proba-bility for 80 ToRs if we reserve 4 ports on each ToR. An-other option is to employ one additional central electricalswitch – each ToR uses 1 port to connect to the centralswitch. Note that, in Helios or c-Through, the electricalswitches (usually forming tree or even multi-root tree)are used for overall connectivity among all Pods/ToRs.In OSA, the all-to-all connectivity is maintained by opti-cal components. A comprehensive evaluation and com-parison of these solutions is part of our ongoing work.
7.2 OSA Applicability vs Traffic PropertiesFor all-to-all traffic, the non-oversubscribed network isindeed more appreciated. However, such workloads areneither reflected in our dataset nor in measurements else-where [6, 16, 18]. Our flexible OSA architecture wouldwork best when traffic pattern is skewed and stable on theorder of seconds. It has been noted in [20] over measure-ments of a 1500-server production DCN that “Only a fewToRs are hot and most of their traffic goes to a few otherToRs.” Another study [16], also on a 1500-server pro-duction DCN, shows that more than 90% of bytes flowin elephant flows. Regarding traffic stability, a similarlysized study [5] shows that 60% of ToR-pairs see less than20% change in traffic demand for between 1.6 to 2.2 sec-onds on average. Despite these, we expect that OSA mayexhibit undesirable performance degradation if the traf-fic pattern is highly dynamic, in which case any topologyadaptation mechanism may be unsuitable as the situationchanges instantaneously. In practice, the infrastructuremanager should choose the proper sensitivity of OSA ac-cording to the operational considerations.
7.3 ScalabilityThe current OSA design focuses on container-sizeDCNs. To scale, we may confront several challenges.The first one is the MEMS’s port density. While the1000-port MEMS is theoretically feasible, the largest
MEMS as of today has 320 ports. One natural way toincrease the port density is via interconnecting multiplesmall MEMS switches. However, this poses additionalrequirement for fast coordinated circuit switching. Sec-ondly, larger network size necessitates more control andmanagement. In our OSA-2560 with 80 ToRs, all the in-telligences, e.g., network optimization and routing, arehandled by OSA manager. How to handle such tasks in alarger DCN with thousands of ToRs is an open questionespecially when the network environment is dynamic.Further, circuit visit delay [35] is another issue to noticewhen scaling. We are considering all these challenges inour continuous effort designing a scalable optical DCN.
7.4 Closely Related WorkOSA’s design goals are closely related to those of c-Through [35] and Helios [15]. In both approaches, flowsrequiring high bandwidth are dynamically provisionedon optical circuits while a parallel electrical network isused to provide overall connectivity. OSA differs fromthese prior proposals in its degree of flexibility and itsarchitecture. Both Helios and c-Through achieve sometopology flexibility via a limited number of single-hopoptical links. OSA can assume an arbitrary topologyfrom a large class of k-regular connected graphs, whilesimultaneously allowing dynamic link capacities. Fur-thermore, unlike these architectures, OSA avoids usingelectrical components other than the ToR switches.
OSA is more comparable to c-Through than Helios,because its current target is inter-rack DCNs with a fewthousand servers unlike Helios’ inter-container mega-DCN scale. Qualitatively, OSA provides more flexibil-ity than either Helios or c-Through and is able to serve alarger space of skewed traffic demands with performancesimilar to that of non-blocking interconnects. We presenta coarse quantitative comparison with an abstract hybridarchitecture model in Sec. 5, showing that OSA achievessignificantly higher bisection bandwidth.
Recently, Kandula et al. [18, 20] proposed dynam-ically configuring 60GHz short-distance multi-Gigabitwireless links between ToRs to provide additional band-width for hotspots. Optical and wireless interconnectsprovide different trade-offs. For example, wired opticalinterconnects can deliver much more bandwidth at lowerpower usage over long distance, while wireless has lowercosts and is easier to deploy though management and in-terference are challenging issues to deal with.
8 Conclusion
In this paper, we presented OSA, a novel Optical Switch-ing Architecture for DCNs. OSA is highly flexible be-cause it can adapt its topology as well as link capaci-ties to different traffic patterns. We have evaluated OSA
13
via extensive simulations and prototype implementation.Our results suggest that OSA can deliver high bisectionbandwidth (60%-100% of non-blocking) for a series oftraffic patterns. Our implementation and evaluation withthe OSA prototype further demonstrate its feasibility.
AcknowledgementsWe thank CoAdna Photonics and Polatis for the equip-ment support of WSS and OSM respectively, GuangxunLiao for helpful discussions on WSS properties, and DonDePaolo for help during the testbed setup. We thank ourshepherd Dave Andersen, the anonymous reviewers, andChuanxiong Guo for their valuable comments.
References[1] ADC, “40 & 100 Gigabit Ethernet: An Imminent Reality,” ”http:
//www.adc.com/Attachment/1270718303886/108956AE,0.pdf”.
[2] M. Al-Fares, A. Loukissas, and A. Vahdat, “A Scalable, Com-modity Data Center Network Architecture,” in Proc. SIGCOMM,2008.
[3] M. Al-Fares, S. Radhakrishnan, B. Raghavan, N. Huang, andA. Vahdat, “Hedera: Dynamic Flow Scheduling for Data CenterNetworks,” in Proc. NSDI, 2010.
[4] K. Barker and etal., “On the feasibility of optical circuit switchingfor high performance computing systems,” in Proc. SC, 2005.
[5] T. Benson, A. Anand, A. Akella, and M. Zhang, “The Casefor Fine-grained Traffic Engineering in Data-centers,” in Proc.USENIX INM/WREN, 2010.
[6] T. Benson, A. Akella, and D. Maltz, “Network Traffic Character-istics of Data Centers in the Wild,” in Proc. IMC, 2010.
[7] Broadcom, “BCM56840 Series Enables Mass Deployment of10GbE in the Data Center,” http://www.broadcom.com/products/features/BCM56840.php.
[8] K. Chen, C. Guo, H. Wu, J. Yuan, Z. Feng, Y. Chen, S. Lu, andW. Wu, “Generic and Automatic Address Configuration for DataCenter Networks,” in Proc. SIGCOMM, 2010.
[9] K. Chen, A. Singla, A. Singh, K. Ramachandran, L. Xu,Y. Zhang, X. Wen, and Y. Chen, “OSA: An Optical SwitchingArchitecture for Data Center Networks with Unprecedented Flex-ibility,” Northwestern University, Tech. Rep., 2012.
[10] Y. Chen, R. Griffith, J. Liu, R. H. Katz, and A. D. Joseph, “Un-derstanding TCP Incast Throughput Collapse in Datacenter Net-works,” in Proc. ACM WREN, 2009.
[11] CIR, “40G Ethernet C- Closer Than Ever to an All-Optical Net-work,” ”http://cir-inc.com/resources/40-100GigE.pdf”.
[12] Edge coloring. [Online]. Available: http://en.wikipedia.org/wiki/Edge coloring.
[13] G. DeCandia, D. Hastorun, M. Jampani, G. Kakulapati, A. Lak-shman, A. Pilchin, S. Sivasubramanian, and P. Vosshall, “Dy-namo: Amazon’s Highly Available Key-value Store,” in Proc.SOSP, 2007.
[14] J. K. et.al, “1100×1100 port MEMS-based optical crossconnectwith 4-dB maximum loss,” IEEE Photonics Technology Letters,vol. 15, no. 11, pp. 1537 –1539, 2003.
[15] N. Farrington, G. Porter, S. Radhakrishnan, H. H. Bazzaz, V. Sub-ramanya, Y. Fainman, G. Papen, and A. Vahdat, “Helios: AHybrid Electrical/Optical Switch Architecture for Modular DataCenters,” in Proc. ACM SIGCOMM, 2010.
[16] A. Greenberg, J. R. Hamilton, N. Jain, S. Kandula, C. Kim,P. Lahiri, D. A. Maltz, P. Patel, and S. Sengupta, “VL2: A Scal-able and Flexible Data Center Network,” in Proc. ACM SIG-COMM, 2009.
[17] C. Guo, G. Lu, D. Li, H. Wu, X. Zhang, Y. Shi, C. Tian, Y. Zhang,and S. Lu, “BCube: A High Performance, Server-centric Net-work Architecture for Modular Data Centers,” in Proc. ACM SIG-COMM, 2009.
[18] D. Halperin, S. Kandula, J. Padhye, P. Bahl, and D. Wetherall,“Augmenting Data Center Networks with Multi-gigabit WirelessLinks,” in Proc. SIGCOMM, 2011.
[19] J. Hamilton, “Data Center NetworksAre in My Way,””http://mvdirona.com/jrh/TalksAndPapers/JamesHamiltonCleanSlateCTO2009.pdf”.
[20] S. Kandula, J. Padhye, and P. Bahl, “Flyways To De-CongestData Center Networks,” in Proc. ACM HotNets, 2009.
[21] G. Keeler, D. Agarwal, C. Debaes, B. Nelson, N. Helman,H. Thienpont, and D. Miller, “Optical pump-probe measurementsof the latency of silicon CMOS optical interconnects,” IEEE Pho-tonics Technology Letters, vol. 14, no. 8, pp. 1214 – 1216, 2002.
[22] C. Lam, H. Liu, B. Koley, X. Zhao, V. Kamalov, and V. Gill,“Fiber optic communication technologies: What’s needed for dat-acenter network operations,” 2010.
[23] LEMON Library. [Online]. Available: http://lemon.cs.elte.hu.
[24] H. Liu, C. F. Lam, and C. Johnson, “Scaling Optical Intercon-nects in Datacenter Networks Opportunities and Challenges forWDM,” in Proc. IEEE Symposium on High Performance Inter-connects, 2010.
[25] M. Meringer, “Regular Graphs,” http://www.mathe2.uni-bayreuth.de/markus/reggraphs.html.
[26] J. Misra and D. Gries, “A constructive proof of Vizing’s Theo-rem,” Inf. Process. Lett., vol. 41, no. 3, pp. 131–133, 1992.
[27] M. Muller-Hannemann and A. Schwartz, “Implementingweighted b-matching algorithms: insights from a computationalstudy,” J. Exp. Algorithmics, vol. 5, p. 8, 2000.
[28] R. N. Mysore, A. Pamboris, N. Farrington, N. Huang, P. Miri,S. Radhakrishnan, V. Subramanya, and A. Vahdat, “PortLand: AScalable Fault-Tolerant Layer 2 Data Center Network Fabric,” inProc. ACM SIGCOMM, 2009.
[29] K. Obraczka and P. Danzig, “Finding Low-Diameter, Low Edge-Cost, Networks,” USC, Tech. Rep., 1997.
[30] J. Rath, “Google Eyes “Optical Express” for its Net-work,” ”http://www.datacenterknowledge.com/archives/2010/05/24/google-eyes-optical-express-for-its-network/”.
[31] A. Rowstron1 and P. Druschel, “Pastry: Scalable, decentralizedobject location and routing for large-scale peer-to-peer systems,”in Proc. Middleware, 2001.
[32] A. Singla, A. Singh, K. Ramachandran, L. Xu, and Y. Zhang,“Proteus: A Topology Malleable Data Center Network,” in Proc.ACM HotNets, 2010.
[33] T. Truex, A. A. Bent, and N. W. Hagood, “Beam steering opti-cal switch fabric utilizing piezoelectric actuation technology,” inProc. NFOEC, 2003.
[34] V. Vasudevan and etal., “Safe and Effective Fine-grained TCPRetransmissions for Datacenter Communication,” in Proc. ACMSIGCOMM, 2009.
[35] G. Wang, D. G. Andersen, M. Kaminsky, K. Papagiannaki,T. S. E. Ng, M. Kozuch, and M. Ryan, “c-Through: Part-timeOptics in Data Centers,” in Proc. ACM SIGCOMM, 2010.
[36] H. Wu, Z. Feng, C. Guo, and Y. Zhang, “ICTCP: Incast Conges-tion Control for TCP,” in Proc. ACM CoNext, 2010.
14