Embed Size (px)
Citation preview

Vadose Zone Journal | Advancing Critical Zone Science
Capacity and Distribution of Water Stored in the Vadose Zone of the Chinese Loess PlateauYuanjun Zhu, Xiaoxu Jia,* Jiangbo Qiao, Andrew Binley, Robert Horton, Wei Hu, Yunqiang Wang, and Ming’an ShaoWater stored in the vadose (unsaturated) zone provides the majority of water required by plants and buffers water resources; thus, it is central to understand-ing ecological and hydrological processes in the Chinese Loess Plateau (CLP) with its thick loess deposits. We used multisource data on soil water content (SWC) and vadose zone thickness, combined with a spatial interpolation method, to quan-tify the vadose zone water and further deduce the water resource composition in the CLP. Vadose zone water is approximately 3.1 ´ 1012 m3 (±27.5%) in the CLP, 92.4% of which is stored in the deep vadose zone (>5 m and above the ground-water table). The water resources composition of the CLP comprises precipitation, river water, vadose zone water, and the saturated zone water (shallow groundwa-ter), accounting for 2.1, 0.1, 42.1, and 55.7%, respectively. Although a large amount of water exists in the vadose zone, the SWCs in the upper (<5 m) and deep vadose zones are 47.4 and 65.3%, respectively, of the mean field capacity, both being at a low level. Our findings bridge the knowledge gaps on the deep vadose zone water and water resources composition in the CLP, providing the basis for deci-sion-making on balancing revegetation and water resources conservation.
Abbreviations: BD, bulk density; CLP, Chinese Loess Plateau; GWT, groundwater table; RBFI, radial basis function interpolation; SWC, soil water content; WS, water storage; WSC, water storage capacity.
Vadose (unsaturated) zone water accounts for only a small proportion (3.8%) of the Earth’s land surface freshwater (Gleick, 1993), but it plays a vital role in terres-trial ecosystems by supplying the majority of water required by plants (Federer, 1979; Schlesinger and Jasechko, 2014), regulating water f lows in the soil–plant–atmosphere continuum (Gardner and Ehlig, 1963; Passioura, 1982), and linking the components of the water cycle (precipitation, runoff, evapotranspiration, and groundwater) (Federer, 1979; Yang et al., 2000; Chen et al., 2008). Quantifying this water is, thus, the basis of understanding soil water–plant relationships, water-based processes in the soil–plant–atmosphere continuum, and the water cycle. For such a quantification, both soil water content (SWC) and the depth of the vadose zone are required, and various methods and techniques are applied to obtain SWC in a profile (Dalton et al., 1984; Zhou, 2001; Huisman et al., 2003; Wang and Qu, 2009). However, the quantification is still typically limited to shallow soil, ranging from a very thin depth (5 cm) to a normal rooting depth (typically up to 4 m) and the depth of deep-rooted plants (21 m), due to the limitations of sampling depth and SWC measurement techniques (Wang et al., 2011, 2015; McColl et al., 2017).
Loess is a clastic, predominantly silt-sized sediment that is formed by the accumula-tion of wind-blown dust, and it or similar sediments cover 10% of the Earth’s land surface (Liu, 1985; Smalley et al., 2011). The Chinese Loess Plateau (CLP) has the largest and thickest loess deposits (92.2 m on average) around the world and is implementing reveg-etation to remediate its fragile ecosystem under the conditions of limited water resources, soil erosion, and highly frequent human activities (Liu, 1985; Fu et al., 2017; Zhu et al., 2018, 2019). The revegetation, i.e., the “Grain for Green” initiative, has greatly changed the ecological and hydrological systems in the CLP, typically represented by a significant
Core Ideas
•Vadose zone water is up to 3.1 ´ 1012 m3 in the Chinese Loess Plateau.
•The deep vadose zone (below 5 m) stores 92.4% of the total vadose zone water.
•Vadose zone water distribution is uneven, depending on loess thick-ness and precipitation.
•Vadose zone water accounts for 42.1% of water resources in the Chinese Loess Plateau.
Y. Zhu, J. Qiao, and M. Shao, State Key Lab. of Soil Erosion and Dryland Farming on the Loess Plateau, Northwest A&F Univ., Yan-gling Shaanxi, 712100, China; X. Jia, Key Lab. of Ecosystem Network Observation and Modeling, Institute of Geographic Sciences and Natural Resources Research, Chinese Academy of Sciences, Beijing, 100101, China; A. Binley, Lancaster Environment Centre, Lancaster Univ., Bailrigg Lancaster, LA1 4YQ, UK; R. Horton, Dep. of Agronomy, Iowa State Univ., Ames, Iowa, 50011-1010; W. Hu, New Zealand Institute for Plant & Food Research Limited, Private Bag 4704, Christchurch 8140, New Zealand; Y. Wang, Institute of Earth Environment, Chinese Academy of Sciences, Xi’an Shaanxi, 710061, China. *Corresponding author ([email protected]).
Received 20 Nov. 2018.Accepted 9 Aug. 2019.
Citation: Zhu, Y., X. Jia, J. Qiao, A. Binley, R. Hor-ton, W. Hu, Y. Wang, and M. Shao. 2019. Capacity and distribution of water stored in the vadose zone of the Chinese Loess Plateau. Vadose Zone J. 18:180203. doi:10.2136/vzj2018.11.0203
Original Research
© 2019 The Author(s). This is an open access article distributed under the CC BY-NC-ND license (http://creativecommons.org/licenses/by-nc-nd/4.0/).

VZJ | Advancing Critical Zone Science p. 2 of 10
increase in vegetation coverage, widely distributed dried soil layers, and sharp decreases in runoff and sediment discharging into the Yellow River (Wang et al., 2009, 2016; Feng et al., 2016; Wei et al., 2016). Therefore, there is growing concern about the rational use of water resources to achieve sustainable development of the ecosystem (Li, 1982; Yang, 2001; Feng et al., 2016; Fu et al., 2017; Jia et al., 2019).
Vadose zone water is central to this issue. First of all, it is almost the only water source available to crops and other vegeta-tion in the CLP (Huang et al., 2003; Li and Huang, 2008), thus directly and intensively affecting crop production and revegeta-tion performance (Hou et al., 1991; Li, 2001; Chen et al., 2015). The revegetation could, in turn, consume an immense amount of soil water to meet increased transpiration needs (Feng et al., 2016; Li et al., 2016; Jia et al., 2017; Ren et al., 2018), leading to a rapid reduction of soil water in the root zone, further affecting vegetation succession and percolation (Hou et al., 1991; Huang and Gallichand, 2006; Jia et al., 2017). This kind of water is mostly stored in the root zone, usually in the upper loess layers. The water stored in the deep vadose zone (beyond root depth) also has impor-tant ecological and hydrological functions. It is a potential and precious water source for some deeply rooted plants (e.g., forest and shrub vegetation), especially as the upper soil water is largely consumed (Li et al., 2008; Liu et al., 2010; Cheng et al., 2014; Wang et al., 2015). Also, it can buffer water resources (storing pre-cipitation) and thus become a primary source of recharge to the deep soil water and groundwater (Huang and Gallichand, 2006; Gao et al., 2015; Li et al., 2017), impacting base flow to rivers and discharge of the rivers into the Yellow River, which has reportedly decreased in recent decades (Li et al., 2016; Wang et al., 2016). A few efforts have been made to quantify vadose zone water at various scales in the CLP (Li and Huang, 2008; Chen et al., 2010; Wang et al., 2011, 2015; Jian et al., 2015; Jia et al., 2017). Observations from the north–south sampling sites in the CLP have shown that 0- to 5-m soil water storage varies from 61 to 277 mm m−1 soil, depending on veg-etation type and climate (Jia et al., 2017). However, the maximum depth of SWC observation reported is only 21 m (far less than the average loess thickness) and the observed sites are few, coupled with a of technology for deep SWC observation, resulting in little informa-tion on the water stored in the deep loess vadose zone. Hence, quantifying water in the vadose zone of the CLP can bridge the gap in current knowledge of deep vadose zone water and provide necessary data for cal-culating water fluxes in the loess profiles and regional water resources composition that are fundamental for understanding ecological and hydrological processes to promote current revegetation and water resources management for the CLP.
We used SWC data from multiple sources and vadose zone thickness data, combined with a spatial interpolation method, to estimate the water stored in
the vadose zone of the CLP. The objectives of this study were to: (i) calculate the capacity of water in the vadose zone, (ii) evaluate the spatial distribution of the vadose zone water, and (iii) deduce the water resources composition in the CLP.
Materials and MethodsStudy Area
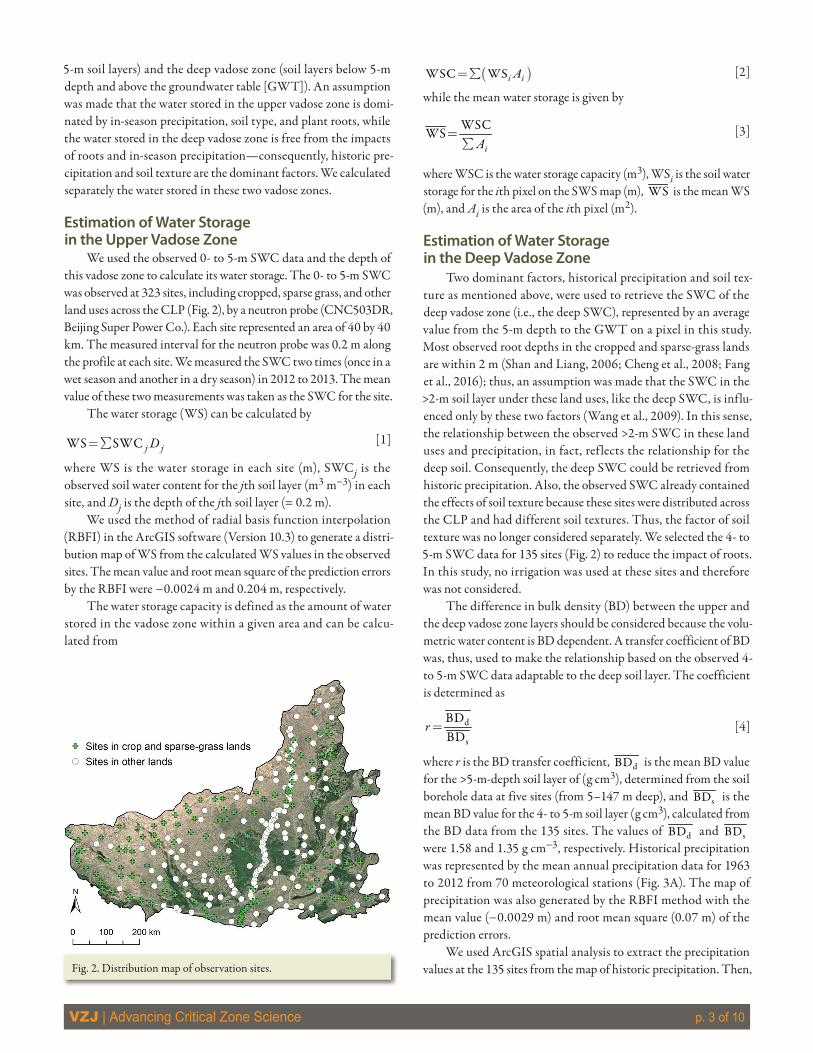
The CLP is located in the middle reaches of the Yellow River and covers an area of 6.4 ´ 105 km2 (Fig. 1). It is not completely covered by loess because of the effects of soil genesis and landforms. The northwest part of the CLP is covered by aeolian sandy soil due to its short distance to the source of loess and its low precipitation. The westernmost part is mainly desert soil, and the southernmost and easternmost parts are mainly stony soils. The region exclusive of the areas with aeolian sand, desert, and stony soils is the typi-cal loess region of the CLP, with an area of 3.6 ´105 km2 (Fig. 1). In addition, there are mountains inside the typical loess region. The loess is does not easily accumulate in these mountainous areas because of steep slopes and forest vegetation. These areas, with an area of 3.5 ´104 km2, were excluded in our analysis. Hence, the determination of vadose zone water was conducted throughout the typical loess region with the thick and continuous loess deposits, with an area of 3.2 ´105 km2 (Fig. 1).
Water Storage Estimation MethodsThe loess vadose zone is very deep. Previous studies have
shown that the depths of most plant roots and precipitation infil-tration are within 5 m (Shan and Liang, 2006; Cheng et al., 2008; Zhao et al., 2012; Zhang et al., 2014; Bai et al., 2016; Fang et al., 2016; Jia et al., 2019). With this consideration, the loess vadose zone was divided into two layers: the upper vadose zone (the upper
Fig. 1. Location of the Chinese Loess Plateau and the region investigated for water storage determination.
VZJ | Advancing Critical Zone Science p. 3 of 10
5-m soil layers) and the deep vadose zone (soil layers below 5-m depth and above the groundwater table [GWT]). An assumption was made that the water stored in the upper vadose zone is domi-nated by in-season precipitation, soil type, and plant roots, while the water stored in the deep vadose zone is free from the impacts of roots and in-season precipitation—consequently, historic pre-cipitation and soil texture are the dominant factors. We calculated separately the water stored in these two vadose zones.
Estimation of Water Storagein the Upper Vadose Zone
We used the observed 0- to 5-m SWC data and the depth of this vadose zone to calculate its water storage. The 0- to 5-m SWC was observed at 323 sites, including cropped, sparse grass, and other land uses across the CLP (Fig. 2), by a neutron probe (CNC503DR, Beijing Super Power Co.). Each site represented an area of 40 by 40 km. The measured interval for the neutron probe was 0.2 m along the profile at each site. We measured the SWC two times (once in a wet season and another in a dry season) in 2012 to 2013. The mean value of these two measurements was taken as the SWC for the site.
The water storage (WS) can be calculated by
WS SWC j jD=å [1]
where WS is the water storage in each site (m), SWCj is the observed soil water content for the jth soil layer (m3 m−3) in each site, and Dj is the depth of the jth soil layer (= 0.2 m).
We used the method of radial basis function interpolation (RBFI) in the ArcGIS software (Version 10.3) to generate a distri-bution map of WS from the calculated WS values in the observed sites. The mean value and root mean square of the prediction errors by the RBFI were −0.0024 m and 0.204 m, respectively.
The water storage capacity is defined as the amount of water stored in the vadose zone within a given area and can be calcu-lated from
( )WSC WSi iA=å [2]
while the mean water storage is given by
WSCWS
iA=
å [3]
where WSC is the water storage capacity (m3), WSi is the soil water storage for the ith pixel on the SWS map (m), WS is the mean WS (m), and Ai is the area of the ith pixel (m2).
Estimation of Water Storagein the Deep Vadose Zone
Two dominant factors, historical precipitation and soil tex-ture as mentioned above, were used to retrieve the SWC of the deep vadose zone (i.e., the deep SWC), represented by an average value from the 5-m depth to the GWT on a pixel in this study. Most observed root depths in the cropped and sparse-grass lands are within 2 m (Shan and Liang, 2006; Cheng et al., 2008; Fang et al., 2016); thus, an assumption was made that the SWC in the >2-m soil layer under these land uses, like the deep SWC, is influ-enced only by these two factors (Wang et al., 2009). In this sense, the relationship between the observed >2-m SWC in these land uses and precipitation, in fact, reflects the relationship for the deep soil. Consequently, the deep SWC could be retrieved from historic precipitation. Also, the observed SWC already contained the effects of soil texture because these sites were distributed across the CLP and had different soil textures. Thus, the factor of soil texture was no longer considered separately. We selected the 4- to 5-m SWC data for 135 sites (Fig. 2) to reduce the impact of roots. In this study, no irrigation was used at these sites and therefore was not considered.
The difference in bulk density (BD) between the upper and the deep vadose zone layers should be considered because the volu-metric water content is BD dependent. A transfer coefficient of BD was, thus, used to make the relationship based on the observed 4- to 5-m SWC data adaptable to the deep soil layer. The coefficient is determined as
d
s
BDBD
r = [4]
where r is the BD transfer coefficient, dBD is the mean BD value for the >5-m-depth soil layer of (g cm3), determined from the soil borehole data at five sites (from 5–147 m deep), and sBD is the mean BD value for the 4- to 5-m soil layer (g cm3), calculated from the BD data from the 135 sites. The values of dBD and sBDwere 1.58 and 1.35 g cm−3, respectively. Historical precipitation was represented by the mean annual precipitation data for 1963 to 2012 from 70 meteorological stations (Fig. 3A). The map of precipitation was also generated by the RBFI method with the mean value (−0.0029 m) and root mean square (0.07 m) of the prediction errors.
We used ArcGIS spatial analysis to extract the precipitation values at the 135 sites from the map of historic precipitation. Then, Fig. 2. Distribution map of observation sites.

VZJ | Advancing Critical Zone Science p. 4 of 10
Fig.
3. R
etrie
val o
f the
dee
p so
il w
ater
cont
ent (
SWC
): (A
) met
eoro
logi
cal s
tatio
ns an
d pr
ecip
itatio
n m
ap o
f the
Chi
nese
Loe
ss P
late
au (C
LP);
(B) l
ogist
ic re
gres
sion
curv
e bet
wee
n th
e obs
erve
d SW
C
and
prec
ipita
tion;
and
(C) m
ap o
f the
retr
ieve
d de
ep S
WC
for t
he C
LP.

VZJ | Advancing Critical Zone Science p. 5 of 10
a logistic equation was used for describing the relationship because it not only gave the best fit (the highest coefficient of determina-tion at a significance level of 0.99) but also had upper and lower limits that were in accordance with the upper (field capacity) and lower (permanent wilting point) limits of the SWC for a given soil. The relationship obtained by the logistic regression was satisfactory (R2 = 0.71 and p < 0.01):
( )0.1978
SWC 0.0721 exp 0.0411i
ikr
P P
ì üï ïï ïï ï= +í ýé ùï ï+ -ï ïë ûï ïî þ [5]
where SWCi is the retrieved soil water content from precipitation for the ith pixel on the map (m3 m−3), P is the mean precipitation (m) for 1963 to 2012 in the region, Pi is the precipitation (m) for the ith pixel on the map, and k is the unit transfer constant (=1 m3 m−3).
We used the map of historic precipitation and Eq. [5] to derive a map of the deep SWC by map algebra algorithms in the ArcGIS software (Fig. 3C).
Next, an elevation map of the GWT (Fig. 4A) was derived from previous studies (Yan et al., 2003; Hou et al., 2006; Zhu and Zhou, 2011; Chen et al., 2013). This map was subtracted from the digital elevation map of the targeted region to get a map of the thickness of the vadose zone (Fig. 4B). This thick-ness map minus 5 m was the thickness data for the deep vadose zone (below 5-m depth and above the GWT). The mean depth to groundwater, i.e., the mean thickness of the vadose zone, was calculated as 54.8 m and, consequently, the mean thickness of the deep vadose zone is 49.8 m (=54.8 − 5 m). The mean thick-ness of the loess (vadose and saturated zones) is 92.2 m (Zhu et al., 2018); thus, the mean thickness of the saturated zone is 37.4 m (= 92.2 − 54.8 m).
We used the thickness data for the deep vadose zone and the retrieved SWC to estimate the WS in this zone, which is calcu-lated as
WS SWCi iD=å [6]
where SWCi is the retrieved soil water content for the ith pixel on the map (m3 m−3) and Di is the thickness value for the ith pixel on the map (m).
Finally, we used Eq. [2] and [3] to calculate the water storage capacity and mean water storage, respectively, in the deep vadose zone.
Validation of the Retrieved Deep Soil Water ContentThe deep SWC is a basis for calculating WS in the deep vadose
zone. Hence, the accuracy of the retrieved deep SWC determined the reliability and accuracy of the estimated WS in the deep vadose zone. For validation, we observed the deep SWC at 16 sites, includ-ing five soil borehole sites (from the land surface to the GWT, with a maximum depth of 147 m) and 11 deep (0–21 m) soil sampling sites (Fig. 3C). We extracted the SWC values for these sites from the map of the retrieved deep SWC (Fig. 3C) as the calculated deep SWC. The validation of the deep SWC was made by comparing the observed and the calculated deep SWC in the sites (Fig. 5). The calculated and the observed SWC are basically distributed along a 1:1 line. The coefficient of the linear regression between them and the root mean square of the predication error are 0.96 and 0.017 m3 m−3, respectively, indicating a relatively accurate deep SWC map retrieved by Eq. [5]. The mean deep SWC in the CLP was calculated to be 0.201 m3 m−3.
Estimated Errors of the Vadose Zone WaterFor the upper vadose zone, the uncertainty of the estimate
is mainly from the RBFI. The root mean square of the predicted errors by the RBFI is 0.204 m, which is the deviation of the esti-mate. It could be expressed as a percentage by dividing by the estimated mean value. Also, the loess depths are often <1 m in the mountain areas (accounting for 10% of the typical loess region)
Fig. 4. Groundwater tables and thickness of the vadose zone across the Chinese Loess Plateau (CLP): (a) elevation map of the groundwater table (GWT) in the CLP, and (b) derived thickness map of the loess vadose zone.

VZJ | Advancing Critical Zone Science p. 6 of 10
due to steep slopes and forest vegetation. If we assumed the mean loess thickness in these areas is 1 m, the vadose zone water in these areas accounts for only 2% (=10% ´ 1 m [average loess thickness in the mountainous area]/5 m [thickness of the upper vadose zone]) of the total, which does not significantly affect the estimated WS in the upper vadose zone. As a result, the uncertainty of the upper vadose zone water can be determined.
For the deep vadose zone, the uncertainty of the estimate is mainly from the estimated errors of the precipitation map by the RBFI and the deep SWC retrieval by Eq. [5]. The root mean square of the predicted errors for precipitation is 0.07 m, thus the deviation can be calculated to be 14.7% (=0.07 m/0.474 m [average precipitation on the CLP]). The root mean square of the predicted errors for the deep SWC retrieval is 0.0467 m3 m−3, thus the deviation is 23.2% (=0.0467/0.201). The integrated deviation is then 27.5% [=100%Ö(14.72 + 23.22)]. Moreover, we only provide the mean SWC value in the deep vadose zone, i.e., we do not attempt to assess the vertical variation in SWC because loess, as an aeolian deposit, is relatively uniform in the profile (Jia et al., 2018; Zhu et al., 2019). Hence, the uncertainty of deep vadose zone water is the integrated deviation of precipita-tion and deep SWC retrieval.
ResultsDistribution of the Vadose Zone Water
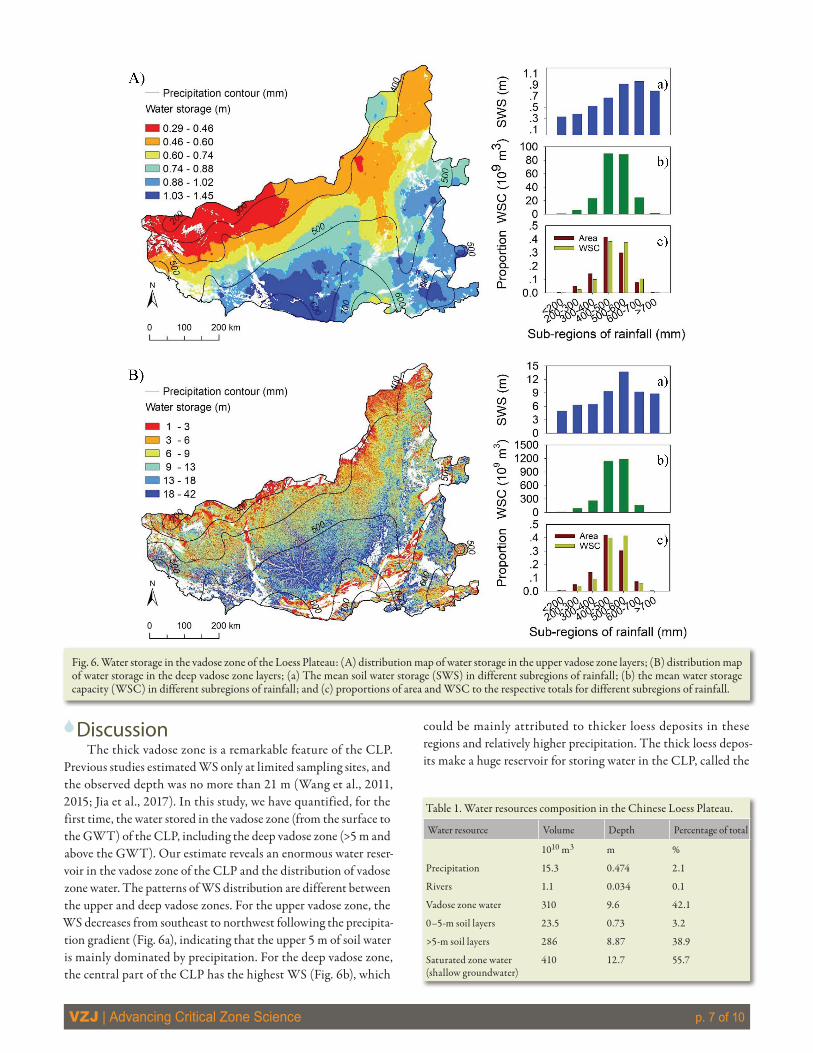
Figure 6A shows the distribution of WS in the upper vadose zone across the CLP. The white color in the map represents the mountain areas (the computed water storage does not cover these areas). The south and southeast parts of the CLP have the highest WS (red solid-line ellipses) and the northwest part has relatively lower WS (black dashed-line ellipse). The mean WS value was calculated to be 0.73 m in this vadose zone. The deviation of the estimate should be 27.9% (=0.204/0.73). The water storage capacity (WSC) in the upper vadose zone is 2.35
´ 1011 m3 (±7.9%), eight times larger than the average annual discharge of the Yellow River for 1952 to 2015 (Su and Li, 2016). The areas with 400 to 600 mm of precipitation, accounting for 72.0% of the total area, contain 76.0% of the total WS in this vadose zone.
Figure 6B shows the distribution of WS in the deep vadose zone across the CLP. The white color in the map represents the area with vadose zone thickness £5 m. The central regions have the highest WS (black dashed-line ellipse), and the northwest and southeast parts have relatively lower WS. The WSC in the deep vadose zone is 2.86 ´ 1012 m3 (±27.5%), 12 times larger than that in the upper vadose zone, and the mean WS value is 10.0 m. The areas with 400 to 600 mm of precipitation account for 81.0% of the total WS in this vadose zone.
The total WSC in the vadose zone of the CLP is 3.1 ´ 1012
m3 (±27.5%, which is mainly determined by the estimated error for the deep vadose zone water), and the mean WS is 9.6 m, show-ing an enormous water reservoir in the vadose zone of the CLP. The capacity of the total water reservoir is equal to an accumula-tion of 20 yr of mean annual precipitation (1963–2012) across the region or equivalent to a 20.8-mm depth of water covering the Earth’s land surface, which is 2.6 times the global surface (?5-cm depth) soil water storage (McColl et al., 2017). The proportions of the water stored in the upper and the deep vadose zones are 7.6 and 92.4%, respectively. The distribution pattern of WS in the vadose zone is similar to that in the deep vadose zone.
Soil Water Statusand Water Resources Composition
Based on our estimate of the water stored in the upper and deep vadose zones and the measured soil physical properties at the observed 323 sites, we evaluated the soil water status in the CLP. The mean SWC values in these two vadose zones are 0.146 m3 m−3
(=0.73/5) and 0.201 m3 m−3 (=10.0/49.8), respectively, which are equal to 47.4 and 65.3%, respectively, of the mean field capacity (=0.308 m3 m−3, derived from the 323 observation sites).
We further deduced the water resources composition across the CLP. The mean thickness of the saturated zone (=37.4 m) and the mean SWC in this zone were used to calculate the water stored in the saturated zone (referring to shallow groundwater resources). The mean saturated water content was determined from the 323 sites across the CLP as 0.34 m3 m−3. The water stored in the saturated zone is, therefore, 12.7 m (=0.34 ´ 37.4). Water in the rivers was calculated from discharge data at the entrance and outlet hydrologic stations in the middle reaches of the Yellow River (Su and Li, 2016) as 0.034 m.
Table 1 summarizes the water resource composition for the CLP. The vadose and the saturated zones store 42.1 and 55.7%, respectively, of water resources of the CLP. Water in the rivers is the smallest, accounting for only 0.1% of the water resources. The water stored in the upper and deep vadose zones accounts for 3.2 and 38.9%, respectively, of the water resources.
Fig. 5. Validation of the deep soil water content (SWC).
VZJ | Advancing Critical Zone Science p. 7 of 10
DiscussionThe thick vadose zone is a remarkable feature of the CLP.
Previous studies estimated WS only at limited sampling sites, and the observed depth was no more than 21 m (Wang et al., 2011, 2015; Jia et al., 2017). In this study, we have quantified, for the first time, the water stored in the vadose zone (from the surface to the GWT) of the CLP, including the deep vadose zone (>5 m and above the GWT). Our estimate reveals an enormous water reser-voir in the vadose zone of the CLP and the distribution of vadose zone water. The patterns of WS distribution are different between the upper and deep vadose zones. For the upper vadose zone, the WS decreases from southeast to northwest following the precipita-tion gradient (Fig. 6a), indicating that the upper 5 m of soil water is mainly dominated by precipitation. For the deep vadose zone, the central part of the CLP has the highest WS (Fig. 6b), which
could be mainly attributed to thicker loess deposits in these regions and relatively higher precipitation. The thick loess depos-its make a huge reservoir for storing water in the CLP, called the
Fig. 6. Water storage in the vadose zone of the Loess Plateau: (A) distribution map of water storage in the upper vadose zone layers; (B) distribution map of water storage in the deep vadose zone layers; (a) The mean soil water storage (SWS) in different subregions of rainfall; (b) the mean water storage capacity (WSC) in different subregions of rainfall; and (c) proportions of area and WSC to the respective totals for different subregions of rainfall.
Table 1. Water resources composition in the Chinese Loess Plateau.
Water resource Volume Depth Percentage of total
1010 m3 m %
Precipitation 15.3 0.474 2.1
Rivers 1.1 0.034 0.1
Vadose zone water 310 9.6 42.1
0–5-m soil layers 23.5 0.73 3.2
>5-m soil layers 286 8.87 38.9
Saturated zone water(shallow groundwater)
410 12.7 55.7

VZJ | Advancing Critical Zone Science p. 8 of 10
“soil reservoir” by local farmers, and play a key role in maintaining crop and other vegetation growth (Li, 2001; Li and Huang, 2008).
The huge capacity of vadose zone water indicates that it can buffer water resources and regulate ecosystems and water cycles in the CLP, as supposed to be. For instance, some deep-rooted plants such as alfalfa (Medicago sativa L.), Caragana korshinskii Kom., and Robinia sp. can grow well in the CLP due to water supply from the deep vadose zone; vadose zone water, being a main source of groundwater recharge, can deeply affect the water cycle in the CLP (Gao et al., 2015; Li et al., 2017). We also evaluated the cur-rent water status in the vadose zone of the CLP. The mean SWC in the upper vadose zone is only 0.146 m3 m−3, lower than 60% of the mean field capacity (usually regarded as the lower limit of a dried soil layer [Wang et al., 2011]). The low SWC in this vadose zone is mainly attributed to lower precipitation and revegetation (Yang, 2001; Jian et al., 2015; Feng et al., 2016; Li et al., 2016; Jia et al., 2017), which is also supported by in situ observations showing that the SWC in the 0- to 5-m soil layers has decreased by around 30% in the CLP, mainly because artificial shrub and forest vegetation can draw water from the soil into the atmosphere like a pump (Jia et al., 2017). Furthermore, the mean SWC in the deep vadose zone is 0.201 m3 m−3, a little higher than the lower limit of a dried soil layer. The soil water status indicates that the total amount of water in the vadose zone is large, but its average is small. In this sense, there is an urgent need to select some low-water-consumption plants to reduce water loss in the upper vadose zone to conserve soil water resources; otherwise, it will lead to a decrease in deep soil water and even groundwater recharge (Gao et al., 2015; Li et al., 2017). We also derived a soil water potential line of −1500 kPa, often being taken as the lower limit of plant-absorbing soil water, from the measured permanent wilting points of the soil at the 323 sites (Fig. 7). If revegetation is applied outside of the line, it is hard for plants to grow healthy because the soil water potential is lower than the plant root water suction. This line generally coincides with the 400-mm precipitation line (Fig. 7), suggesting that the areas with <400 mm of precipitation are not appropriate for implementing revegetation, especially with high-water-consumption plants such as shrub and forest; thus, natural conservation is the best choice for these areas.
Moreover, we deduced the water resource composition across the CLP from our estimates of the vadose and saturated zones water and the runoff discharge data. Water in the loess profiles (vadose and saturated zones) accounts for an overwhelming frac-tion of water resources (97.8%). Water in the rivers is the smallest (0.1%) and water stored in the upper 5-m vadose zone is the second smallest (3.2%). The small proportions of river water and the upper 5-m vadose zone water indicate that these two fractions of water are more easily affected by revegetation and climate change (Chen et al., 2015; Feng et al., 2016; Li et al., 2016; Jia et al., 2017). Many studies have demonstrated that the runoff and sediment from the CLP into the Yellow River has been largely reduced due to reveg-etation and climate change, and the carrying capacity of soil water for vegetation has almost reached its upper limit (Chen et al., 2015;
Feng et al., 2016). Hence, these parts of the water resource should receive more attention in water resource management and should be protected by urgently taking some measures.
ConclusionThe total capacity of water stored in the vadose zone of the
CLP is 3.1 ´ 1012 m3 (±27.5%), 92.4% of which is stored in the deep (>5 m and above the GWT) vadose zone. The distribution of WS is uneven across the CLP. For the upper 5-m vadose zone, stored water decreases from southeast to northwest following the precipitation gradient. For the deep vadose zone, the central part of the CLP has the highest WS and the northwest part has relatively lower WS. The SWCs in the upper and deep vadose zones are 47.4 and 65.3%, respectively, of the mean field capacity, indicating a low level of water status in the vadose zone. The vadose and saturated zones store 42.1 and 55.7%, respectively, of water resources; river water and the 0- to 5-m soil water account for only 0.1 and 3.2%, respectively, of the water resources.
This study presented new information on the vadose zone water and the water resources composition in the CLP. The stor-age capacity of vadose zone water is huge, but the water is at a low level, revealing a great effect of revegetation. Future revegetation should be targeted to select low-water-consumption plant species, particularly in areas with >400 mm of annual precipitation in the CLP. Generally, our findings highlight the current severe situa-tion of water resources in the CLP, providing key data for future policymaking on revegetation and water resources management in the CLP.
AcknowledgmentsThis work is supported by the National Natural Science Foundation of China (41530854 and 41571130081), the Youth Innovation Promotion Association of the Chinese Academy of Sciences (2017076), and the UK Natural Environment
Fig. 7. Map of precipitation contours and −1500 kPa soil water poten-tial line on the Loess Plateau.

VZJ | Advancing Critical Zone Science p. 9 of 10
Research Council (NE/N007409/1). We thank the Institute of Water Saving Agri-culture in Arid Areas of China, Northwest A&F University, and Changwu, An’sai, and Shenmu field experimental stations, the Institute of Soil and Water Conserva-tion, Chinese Academy of Sciences & Ministry of Water Resources, for providing experimental conditions.
ReferencesBai, S., Y. Wang, J. Ma, X. Wang, and Y. Zhou. 2016. Experimental study on
rainfall infiltration in semiarid region of the Loess Plateau. (In Chinese.) Agric. Res. Arid Area 34:218–223.
Chen, H., M. Shao, and Y. Li. 2008. The characteristics of soil water cycle and water balance on steep grassland under natural and simulated rainfall conditions in the Loess Plateau of China. J. Hydrol. 360:242–251. doi:10.1016/j.jhydrol.2008.07.037
Chen, J., Z. Liu, and X. Liu. 2013. Deep circulation groundwater maintains continuous deposition of dusty particles in Loess Plateau. (In Chinese.) Acta Geol. Sin. 87:278–287.
Chen, L., J. Wang, W. Wei, B. Fu, and D. Wu. 2010. Effects of land-scape restoration on soil water storage and water use in the Loess Plateau region, China. For. Ecol. Manage. 259:1291–1298. doi:10.1016/j.foreco.2009.10.025
Chen, Y., K. Wang, Y. Lin, W. Shi, Y. Song, and X. He. 2015. Balancing green and grain trade. Nat. Geosci. 8:739–741. doi:10.1038/ngeo2544
Cheng, L., W. Liu, and Z. Li. 2014. Soil water in deep layers under different land use patterns on the Loess Tableland. (In Chinese.) Acta Ecol. Sin. 34:1975–1983.
Cheng, X., M. Huang, and M. Shao. 2008. Root distribution and soil water dynamics of Medicago sativa L. and Stipa breviflora Griseb. (In Chinese.) Acta Agron. Sin. 16:170–175.
Dalton, F.N., W.N. Herkelrath, D.S. Rawlins, and J.D. Rhoades. 1984. Time-domain reflectometry: Simultaneous measurement of soil water content and electrical conductivity with a single probe. Science 224:989–990. doi:10.1126/science.224.4652.989
Fang, X., W. Zhao, L. Wang, Q. Feng, J. Ding, Y. Liu, and X. Zhang. 2016. Variations of deep soil moisture under different vegetation types and influencing factors in a watershed of the Loess Plateau, China. Hydrol. Earth Syst. Sci. 20:3309–3323. doi:10.5194/hess-20-3309-2016
Federer, C.A. 1979. A soil–plant–atmosphere model for transpira-tion and availability of soil water. Water Resour. Res. 15:555–562. doi:10.1029/WR015i003p00555
Feng, X., B. Fu, S. Piao, S. Wang, P. Ciais, Z. Zeng, et al. 2016. Revegetation in China’s Loess Plateau is approaching sustainable water resources limits. Nat. Clim. Change 6:1019–1022. doi:10.1038/nclimate3092
Fu, B., S. Wang, Y. Liu, J. Liu, W. Liang, and C. Miao. 2017. Hydrogeomor-phic ecosystem responses to natural and anthropogenic changes in the Loess Plateau of China. Annu. Rev. Earth Planet. Sci. 45:223–243. doi:10.1146/annurev-earth-063016-020552
Gao, Z., L. Zhang, L. Cheng, X. Zhang, T. Cowan, W. Cai, and W. Brut-saert. 2015. Groundwater storage in the Loess Plateau of China estimated from streamflow records. J. Hydrol. 530:281–290. doi:10.1016/j.jhydrol.2015.09.063
Gardner, W.R., and C.F. Ehlig. 1963. The influence of soil water on transpiration by plants. J. Geophys. Res. 68:5719–5724. doi:10.1029/JZ068i020p05719
Gleick, P.H. 1993. Water in crisis: A guide to the world’s fresh water re-sources. Oxford Univ. Press, Oxford, UK.
Hou, G., X. Lin, X. Su, X. Wang, and J. Liu. 2006. Groundwater system in Ordos cretaceous artisan basin (CAS). (In Chinese.) J. Jilin Univ., Earth Sci. Ed. 36:391–398.
Hou, Q., X. Huang, S. Han, and X. Zhang. 1991. The status of soil moistures and nutrients in small-old-tree stands and impact on tree growth. (In Chinese.) J. Soil Water Conserv. 5:75–83.
Huang, M., T. Dang, J. Gallichand, and M. Goulet. 2003. Effect of in-creased fertilizer applications to wheat crop on soil-water deple-tion in the Loess Plateau, China. Agric. Water Manage. 58:267–278. doi:10.1016/S0378-3774(02)00086-0
Huang, M., and J. Gallichand. 2006. Use of the SHAW model to as-sess soil water recovery after apple trees in the gully region of the Loess Plateau, China. Agric. Water Manage. 85:67–76. doi:10.1016/j.agwat.2006.03.009
Huisman, J.A., S.S. Hubbard, J.D. Redman, and A.P. Annan. 2003. Measuring soil water content with ground penetrating radar: A review. Vadose Zone J. 2:476–491. doi:10.2136/vzj2003.4760
Jia, X., M. Shao, D. Yu, Y. Zhang, and A. Binley. 2019. Spatial variations in soil-water carrying capacity of three typical revegetation spe-cies on the Loess Plateau, China. Agric. Ecosyst. Environ. 273:25–35. doi:10.1016/j.agee.2018.12.008
Jia, X., M. Shao, Y. Zhu, and Y. Luo. 2017. Soil moisture decline due to afforestation across the Loess Plateau, China. J. Hydrol. 546:113–122. doi:10.1016/j.jhydrol.2017.01.011
Jia, X., Y. Zhu, L. Huang, X. Wei, Y. Fang, L. Wu, et al. 2018. Min-eral N stock and nitrate accumulation in the 50 to 200 m profile on the Loess Plateau. Sci. Total Environ. 633:999–1006. doi:10.1016/j.scitotenv.2018.03.249
Jian, S., C. Zhao, S. Fang, and K. Yu. 2015. Effects of different veg-etation restoration on soil water storage and water balance in the Chinese Loess Plateau. Agric. For. Meteorol. 206:85–96. doi:10.1016/j.agrformet.2015.03.009
Li, J., B. Chen, X. Li, Y. Zhao, Y. Ciren, B. Jiang, et al.. 2008. Effects of deep soil desiccation on artificial forestlands in different vegetation zones on the Loess Plateau of China. Acta Ecol. Sin. 28:1429–1445. (In Chi-nese, with English abstract.) doi:10.1016/S1872-2032(08)60052-9
Li, S., W. Liang, B. Fu, Y. Lü, S. Wang, and H. Su. 2016. Vegetation changes in recent large-scale ecological restoration projects and subsequent impact on water resources in China’s Loess Plateau. Sci. Total Environ. 569-570:1032–1039. doi:10.1016/j.scitotenv.2016.06.141
Li, Y. 1982. The responses of water cycle in soil and their effect on water cycle for land in the loess region. (In Chinese.) Acta Ecol. Sin. 2:91–101.
Li, Y. 2001. Fluctuation of yield on high-yield field and desiccation of the soil on dryland. (In Chinese.) Turang Xuebao 38:353–356.
Li, Y., and M. Huang. 2008. Pasture yield and soil water depletion of con-tinuous growing alfalfa in the Loess Plateau of China. Agric. Ecosyst. Environ. 124:24–32. doi:10.1016/j.agee.2007.08.007
Li, Z., X. Chen, W. Liu, and B. Si. 2017. Determination of ground-water recharge mechanism in the deep loessial unsaturated zone by environmental tracers. Sci. Total Environ. 586:827–835. doi:10.1016/j.scitotenv.2017.02.061
Liu, T. 1985. Loess and the environment. Science Press, Beijing.
Liu, W., X. Zhang, T. Dang, Z. Ouyang, Z. Li, J. Wang, et al. 2010. Soil water dynamics and deep soil recharge in a record wet year in the south-ern Loess Plateau of China. Agric. Water Manage. 97:1133–1138. doi:10.1016/j.agwat.2010.01.001
McColl, K.A., S.H. Alemohammad, R. Akbar, A.G. Koning, S. Yueh, and D. Entekhabi. 2017. The global distribution and dynamics of surface soil moisture. Nat. Geosci. 10:100–104. doi:10.1038/ngeo2868
,Passioura J.B. 1982. Water in the soil–plant–atmosphere continuum. In: O.L. Lange et al., editors, Physiological plant ecology II: Water relations and carbon assimilation. Encyclopedia of Plant Physiology Vol. 12B. Springer, Berlin. p. 5–33.
Ren, Z., Z. Li, X. Liu, P. Li, S. Cheng, and G. Xu. 2018. Comparing watershed afforestation and natural revegetation impacts on soil moisture in the semiarid Loess Plateau of China. Sci. Rep. 8:2972–2981.
Schlesinger, W.H., and S. Jasechko. 2014. Transpiration in the global water cycle. Agric. For. Meteorol. 189–190:115–117. doi:10.1016/j.agrformet.2014.01.011
Smalley, I., S.B. Marković, and Z. Svirčev. 2011. Loess is [almost to-tally formed by] the accumulation of dust. Quat. Int. 240:4–11. doi:10.1016/j.quaint.2010.07.011
Shan, C., and Z. Liang. 2006. Relationship between root distribution of locust plantation and soil water in the Loess Plateau (in Chinese). J. Cent. South Univ. For. Technol. 26:19–21.
Wang, L., and J. Qu. 2009. Satellite remote sensing applications for surface soil moisture monitoring: A review. Front. Earth Sci. 3:237–247. doi:10.1007/s11707-009-0023-7

VZJ | Advancing Critical Zone Science p. 10 of 10
Wang, S., B. Fu, S. Piao, Y. Lü, P. Ciais, X. Feng, and Y. Wang. 2016. Reduced sediment transport in the Yellow River due to anthropogenic changes. Nat. Geosci. 9:38–41. doi:10.1038/ngeo2602
Wang, Y., W. Hu, Y. Zhu, M. Shao, S. Xiao, and C. Zhang. 2015. Vertical distri-bution and temporal stability of soil water in 21-m profiles under dif-ferent land uses on the Loess Plateau in China. J. Hydrol. 527:543–554. doi:10.1016/j.jhydrol.2015.05.010
Wang, Y., M. Shao, Y. Zhu, and Z. Liu. 2011. Impacts of land use and plant characteristics on dried soil layers in different climate regions on the Loess Plateau of China. Agric. For. Meteorol. 151:437–448. doi:10.1016/j.agrformet.2010.11.016
Wang, Z., B. Liu, G. Liu, and Y. Zhang. 2009. Soil water depletion by planted vegetation on the Loess Plateau. Sci. China Ser. D 52:835–842. doi:10.1007/s11430-009-0087-y
Wei, Y., J. Jiao, G. Zhao, H. Zhao, Z. He, and X. Mu. 2016. Spatial-temporal variation and periodic change in streamflow and suspended sediment discharge along the mainstream of the Yellow River during 1950–2013. Catena 140:105–115. doi:10.1016/j.catena.2016.01.016
Yan, B., J. Li, and B. Yang. 2003. Historical development of underground water harness for agriculture in Loess Plateau. (In Chinese.) Agric. Res. Arid Area. 21:112–116.
Yang, J., B. Li, and S. Liu. 2000. A large weighing lysimeter for evapotranspi-ration and soil‐water–groundwater exchange studies. Hydrol. Process-
es 14:1887–1897. doi:10.1002/1099-1085(200007)14:10<1887::AID-HYP69>3.0.CO;2-B
Yang, W. 2001. Soil water resources and afforestation in Loess Plateau. (In Chinese.) Ziran Ziyuan Xuebao 16:433–438.
Su, M.L., and W.X. Li, editors. 2016. Yellow River sediment bulletin. (In Chinese.) Yellow River Conservancy Press, Zhengzhou, China. http://www.yrcc.gov.cn/nishagonggao/2016/index.html#p=1
Zhang, C., P. Li, T. Li, and M. Zhang. 2014. In-situ observation on rainfall infiltration in loess. (In Chinese.) J. Hydrol. Eng. 45:728–734.
Zhao, J., X. Xu, X. Li, L. Zhang, and M. Yu. 2012. Characteristics of rainfall infiltration on Changwu tableland. (In Chinese.) Sci. Soil Water Conserv. 10:37–44.
Zhou, Q. 2001. Three-dimensional spatial and temporal monitoring of soil water content using electrical resistivity tomography. Water Resour. Res. 37:273–285. doi:10.1029/2000WR900284
Zhu, Y., X. Jia, and M. Shao. 2018. Loess thickness variations across the Loess Plateau of China. Surv. Geophys. 39:715–727. doi:10.1007/s10712-018-9462-6
Zhu, Y., X. Jia, J. Qiao, and M. Shao. 2019. What is the mass of loess in the Loess Plateau of China? Sci. Bull. 64:534–539. doi:10.1016/j.scib.2019.03.021
Zhu, Y., and B. Zhou. 2011. Quaternary diving system characteristics in Gansu Loess Plateau. (In Chinese.) Yellow River 33:51–53.