Embed Size (px)
Citation preview

Vol:.(1234567890)
Journal of Plant Growth Regulation (2018) 37:794–802https://doi.org/10.1007/s00344-017-9774-7
1 3
Unfolding Non-structural Carbohydrates from Sapling to Dying Black Locust on China’s Loess Plateau
Qingyin Zhang1 · Xiaoxu Jia2,3,4 · Ming’an Shao1,2,3 · Changkun Ma1
Received: 16 April 2017 / Accepted: 14 November 2017 / Published online: 6 December 2017 © Springer Science+Business Media, LLC, part of Springer Nature 2017
AbstractNon-structural carbohydrates (NSC) play important roles in metabolic processes of plants and represent important func-tional traits in plant adaptation to the external environment. However, there are few reports concerning intra-annual NSC distribution in temperate deciduous forests, especially for the purpose of comparison among different stand ages on China’s Loess Plateau. Here, NSC allocation dynamics with age ring-porous black locust tree was determined for the growing (May) and dormant (November) seasons over the period from sapling to dying trees—defined as a completely defoliated tree with dried branches in the growing season. It was noted that regardless of tree age, NSC concentration was highest in coarse roots [16.4 g per 100 g of dry mass (16.4% DM)] and stems (15.1% DM). At the tree level, NSC concentration was highest (14.3% DM) in a 30-year-old stand in November and lowest (4.1% DM) in dying stands in May. The pool of NSC at tree level was highest (25.2 kg DM per tree) in 30-year-old stands in November and lowest (0.13 kg DM per tree) in sapling stands in May. The concentration of NSC was significantly lower in May than in November for all tree ages, organs, and biochemical components. The results underscored the importance of NSC in plant growth on China’s Loess Plateau. It also provided a useful insight into the dynamics of NSC from sapling to dying broadleaved tree species.
Keywords Black locust · Non-structural carbohydrate · Dynamics · Concentration · Biomass
Introduction
Carbohydrate reserves are mobilized in trees to fuel mainte-nance and respiration during winter (Ögren 2000), cope with soil water deficit and support new growth in spring (Dunn and others 1990; Canham and others 1999). Carbohydrates
in plants are generally classified as structural (SC) and non-structural (NSC) carbohydrates (Li and others 2002, 2008). Mainly as soluble sugars and starch, NSCs are products of photosynthesis, which also provide substrates for growth and metabolism (Woodruff and Meinzer 2011). The con-tents of NSCs and their composition (ratio of glucose to starch) reflect the balance between carbon sources and sinks in plants (Chapin and others 1990; Hoch and others 2003; Würth and others 2005). Studies on intra-annual dynamics of NSC are needed to understand the response of tree growth to climate change (Adams and others 2013; Hartmann and others 2013; Andrew and others 2013; O’Brien and oth-ers 2014). Although the NSC pool is depleted if demand exceeds supply (for example, when metabolic and growth requirements are high), it is recharged if supply exceeds demand (for example, when environmental conditions per-mit high rates of photosynthesis or when metabolic and growth requirements are low) (Chapin and others 1990; Grulke and Retzlaff 2001).
The mobilization of seasonal reserves is fully documented for matured trees (Galiano and others 2011; Adams and others 2013) and saplings (Anderegg and Anderegg 2013;
* Xiaoxu Jia [email protected]
* Ming’an Shao [email protected]
1 College of Natural Resources and Environment, Northwest A&F University, Yangling 712100, China
2 Key Laboratory of Ecosystem Network Observation and Modeling, Institute of Geographic Sciences and Natural Resources Research, Chinese Academy of Sciences, Beijing 100101, China
3 College of Resources and Environment, University of Chinese Academy of Sciences, Beijing 100190, China
4 State Key Laboratory of Soil Erosion and Dryland Farming on the Loess Plateau, Northwest A&F University, Yangling 712100, China
795Journal of Plant Growth Regulation (2018) 37:794–802
1 3
O’Brien and others 2014), but less known for dying trees. Several studies have demonstrated changes in the alloca-tion of carbon between tree organs associated with age. For example, carbohydrates are mostly allocated to roots (espe-cially fine roots) in trees less than 20 years old, but to stems in older trees (Bartelink 1998; Grulke and Retzlaff 2001). This suggests that carbohydrate reserve dynamics in young trees cannot be extrapolated for adult trees without measur-ing carbohydrate contents in all the component organs of the tree (Barbaroux and others 2002). In addition, reductions in productivity associated with tree age and size in forest stands and individual trees following canopy closure are well docu-mented (Ryan and Waring 1992; Ryan and others 1997).
The content and allocation ratios of NSC in roots, stems, and twigs can vary during growing and dormant seasons in response to the use or storage of NSC (Salomón and others 2016). This suggests that enhanced NSC storage and con-sumption in the root system could reflect a trade-off between clonal vegetative resilience and aboveground performance. For black locust (Robinia pseudoacacia L.), there are studies on the effects of soil water content on carbohydrate parti-tioning in various organs of saplings (Ji and others 2009; Wang and others 2015). However, studies on the intra-annual dynamics of NSC from saplings to dying trees are scarce for deciduous temperate forest trees on China’s Loess Plateau.
China’s Loess Plateau is famous for its deep loess, poor land-use management, and high soil erosion. To improve the fragile ecosystem on the Loess Plateau, extensive veg-etation restoration and environmental protection programs have been implemented in the past decades (IPCC 2014). In addition, there has been a widespread use of black locust in the afforestation, the so-called ‘Grain for Green’ program (GFGP), of the naturally fragile ecosystem (Lü and others 2012). The focus of this program has been on ecological benefits such as increased soil carbon sequestration (Deng and others 2014), water loss reduction, soil erosion control (Brown and others 2007), and desertification control and biodiversity conservation (Porto and others 2009). However, the arising concern related with the current restoration pro-gram is the degradation of vegetation, including acceler-ated tree death and ‘‘small-aged-tree” phenomena where matured trees develop abnormally short trunks (Chen and others 2010).
Because NSC dynamics are critical for the growth and response of black locust to environmental disturbances, it was hypothesized that NSC concentration or pool reflects black locust growth. With the widespread implementation of GFGP, it was next hypothesized that NSC concentration and pool increase with increasing age of black locust tree, although a dying black locust tree depletes NSC concen-trations or pools at the tree scale. In this study, NSC con-centration was measured for saplings to dying black locust trees under growing and dormant seasons on China’s Loess
Plateau. Thus, the objectives of the study are (1) to compare NSC concentrations in roots, stems, branches, seeds, and leaves of black locust trees from sapling to dying; and (2) to quantify NSC concentrations and pools at the tree scale.
Materials and Methods
Study Sites
This study was conducted at the Yehe National Forestry Center, a managed forest extending over 10,996 ha in the Qishui watershed on the Loess Plateau of China (34.55°N, 107.90°E; 1080 m a.s.l.). The area has a homogeneous tem-perate continental climate with a mean annual temperature of 11.5 °C, ranging from − 2 °C in January to 26 °C in July. The mean annual regional precipitation is 592 mm, with 70% occurring in the growing season from June to Septem-ber. Only a few species of the forest trees, including Robinia pseudoacacia (L.), Pinus tabuliformis (Carr.) and Platycla-dus orientalis (L.) Franco, support abundant undergrowth vegetation. The forest is on a conservation easement and is relatively managed as open stands. The soil is more of clay, with sand and loam mixtures at different depths.
Plant Material
Following a feasibility study in March 2015, five pure stands were selected from saplings to dying trees (of 4-, 10-, 20-, and 30-year-old trees) over the space of 3 km (Table 1). In the study, a dying tree was defined as a completely defoliated tree with dried branches in the growing season. It is worth noting that dying trees covered an area of up 5 ha−1 in the 30-year-old stands in the east of the Loess Plateau. Most of the dying trees were 28 years old and were not influenced by biotic and fire agents. All five stands were on sunny slopes with a slope gradient of less than 20°, largely eliminating the effect of topography.
Early wood, late wood, and total wood ring widths were measured in May 2015 for 10 randomly selected trees in each stand using a 4.3-mm-diameter standard hand incre-ment borer (Häglof Company Group, Långsele, Sweden). The diameter at breast height (DBH) of the trees was meas-ured in the six stands in May 2015. The leaf area index (LAI) was calculated for July 2015 by processing digital hemispherical photographs using CAN-EYE (Demarez and others 2008).
In this study, plant saplings were collected in the grow-ing season (May 2015 with bud burst on April 25) and in the dormant season (November 2015 with leaf fall on Octo-ber 28). The dates respectively corresponded to the mini-mum and maximum pools of carbohydrates in black locust (Su 2016). The two key dates were also in sync with the

796 Journal of Plant Growth Regulation (2018) 37:794–802
1 3
conceptual model of the stand which stated that the NSC pool is depleted when demand exceeds supply in spring and the pool recharged when supply exceeds demand in autumn (Chapin and others 1990; Grulke and Retzlaff 2001). Then NSC concentration was compared between the two key periods.
Plant saplings were collected from various plant organs (> 5 mm coarse root, stem, bark, branch ,and leaf in May, and then seed in November) of five randomly selected trees per stand in May and November of 2015. The coarse roots were collected in May from five selected trees per stand. Also the stems were collected at breast height on the south side of the trunk. As the sapwood consisted of NSC almost from the plant stem (Barbaroux and others 2002; Andrew and others 2013), the analysis was conducted only on the outer 2 cm (sapwood) of each increment core from the selected trees per stand (except for the 4-year-old stand) using a 4.3-mm-diameter standard hand increment borer (Häglof Company Group, Långsele, Sweden). Because of the small stem diameter of the 4-year-old stand, samplings were col-lected from the stems of felled trees. Sun-exposed terminal branches were collected from the upper 1/3 of the canopy of the selected trees per stand in May. Stem bark (both outer and inner) was collected at breast height of the trees in May. The sampling methods of leaves and seeds were the same as those for branches. All the samples were collected late in the morning and sealed in plastic bags, labeled and stored in a cooler with ice within 1 h after collection. In November, a second sample was collected using the same methods. Each sample was collected in three replicates.
Carbohydrate Analyses
The analyses for NSC determination followed those described by Andrew and others (2013). Leaves, stems, branches, bark, and seeds were finely sliced with a razor blade and ground with a ball mill (FOSS CT410, Sweden). About 0.5 g of each plant powder organ was vacuum-infil-trated with 80% ethanol for 15 min and then boiled. Macer-ated samples were extracted three times with 7.5 ml of fresh 80% ethanol for 15 min and centrifuged at 7000 rpm (Zhang
and others 2013). Supernatants of each sample were com-bined, filtered through a 0.45-μm syringe filter and analyzed for soluble sugars. The ethanol-insoluble pellets were used to determine starch content.
The ethanol-soluble fractions were analyzed for sucrose, glucose, fructose, and sorbitol using a Waters (Milford, MA, USA) Alliance high-pressure liquid chromatographic (HPLC) system with a Waters Sugar-pak and solvent (Andrew and others 2013). Sugars were detected with a Waters 1525 refractive-index detector and Waters PC-based Breeze 2 software. The separated soluble sugars were identi-fied and quantified with known standards and converted to gram sugar per 100 g of dry mass of the sample.
Starch was extracted from the remaining dry matter in a boiling solution of 0.02 NaOH for 1 h, followed by hydrolysis to glucose with α-amyloglucosidase (EC 3.2.1.3, Boehringer Mannheim Biochemicals, Mannheim, Germany) in a 0.32 M citrate buffer (pH 4.2) at 48 °C for 30 min (Bar-baroux and others 2002). Glucose formed by hydrolysis was measured colorimetrically at 340 nm (spectrophotom-eter model 2550, Shimadzu, Japan). Starch concentrations were calculated from standard curves and expressed as gram starch per 100 g of dry mass of the sample. Total concentra-tion of NSC was calculated as the sum of concentrations of soluble sugars and starch for each organ.
Biomass Estimation
The leaf, stem, branch, and root biomasses were estimated using allometric relationships based on diameter at breast height (D) and height (H) of the tree (Bi and others 1993). The allometric relationships for black locust seed biomass were established by Wang and others (2005). The bark bio-mass was estimated by Shen and others (2015) for black locust on the Loess Plateau. To estimate the biomass of dying trees, a systematic search for black locust biomass estimation was done using Google Scholar Search. Different combinations of key words (‘‘black locust,’’ ‘‘Robinia pseu-doacacia,’’ ‘‘tree,’’ ‘‘forest,’’ ‘‘biomass,’’ and ‘‘productiv-ity’’) were used in the search. However, there was no empiri-cal formula for the estimation of the biomass of black locust.
Table 1 Mean stand characteristics, including coordinates and elevations of the sites, tree density, stand age, mean diameter at breast height (DBH), mean tree height, and leaf area index (LAI) in July 2015
Elev elevation, TD tree density, SA stand age, DBH diameter at breast height, TH tree height, BA basal area, LAI leaf area index
Stand Latitude/longitude Elev. (m) TD (ha−1) SA DBH (cm) TH (m) BA (m−2 ha−1) LAI
4-year 34°33′42″N, 107°54′49″E 1085 1000 3 2.2 ± 0.4 2.6 ± 1.1 0.4 1.4110-year 34°33′42″N, 107°54′37″E 1080 2500 10 11.2 ± 1.2 9.1 ± 0.9 24.6 3.4520-year 34°33′30″N, 107°54′41″E 1068 2000 22 14.1 ± 0.8 13.6 ± 1.6 31.2 2.4830-year 34°33′43″N, 107°54′58″E 1119 1000 31 21.8 ± 1.3 17.8 ± 1.3 37.3 1.74Dying 34°33′45″N, 107°55′13″E 1127 500 28 17.6 ± 2.3 10.6 ± 1.8 12.2 NA
797Journal of Plant Growth Regulation (2018) 37:794–802
1 3
Moreover, Chi and others (2016) noted through a destruc-tive method that the average biomass of dead black locust is 35 kg per tree, which is far below the estimated value in this study (83.9 kg per tree, Table 2). This discrepancy can be explained in terms of the finer DBH of dead black locust in the former study. In this study therefore, biomass was calculated and compared at the tree scale between different stands using allometric relationships as explained above. An allometric relationship was also used to estimate biomass of dying stands despite the fact that it over- or under-estimated biomass due to withered organs.
The biomass of different organs was estimated for each stand and carbohydrate concentrations in each organ aver-aged and weighted for each stand. Organ pools and con-centrations were calculated using the product of the total biomass of the respective organ. Then the total NSC pool per tree was obtained by summing up the pools for all of the organs.
Statistical Analyses
For each tree, species and concentration distribution was analyzed by the use of the various sources of variation—organ, sampling date, age class, and so on. A two-way anal-ysis of variance (ANOVA) was used to test the effects of the differences among sampling date and age class for each organ. In addition, the interaction between sampling date and age class for each organ was tested. Statistically signifi-cant differences at the organ scale were determined using the Student–Newman–Keuls multiple-range test at p < 0.05. All data were checked to conform with the assumptions of analysis of variance. All the statistical analyses were done in SPSS 18.0 (SPSS for Windows, Chicago, USA).
Results
Biomass Estimation
The biomass distribution in Table 2 showed differences between organs and stand ages. Seed biomass was ignored because it formed a very small fraction of the total biomass. Stem biomass represented 20, 40, 44, and 49 of total wood
biomass, respectively, for the 4-, 10-, 20-, and 30-year-old stands and 45% of the dying stands, contributing signifi-cantly to the respective total pools. Leaf biomass accounted for the lowest proportion of the total biomass, except for seed biomass.
Partitioning NSC Among Tree Organs and Age Class
The partitioning of NSC concentrations differed significantly among the tree organs (Fig. 1; Table 3). The concentrations were higher in coarse roots (16.4% DM) and stems (15.1% DM), and lower in leaves (5.1% DM), branches (2.5% DM), and bark (2.0% DM).
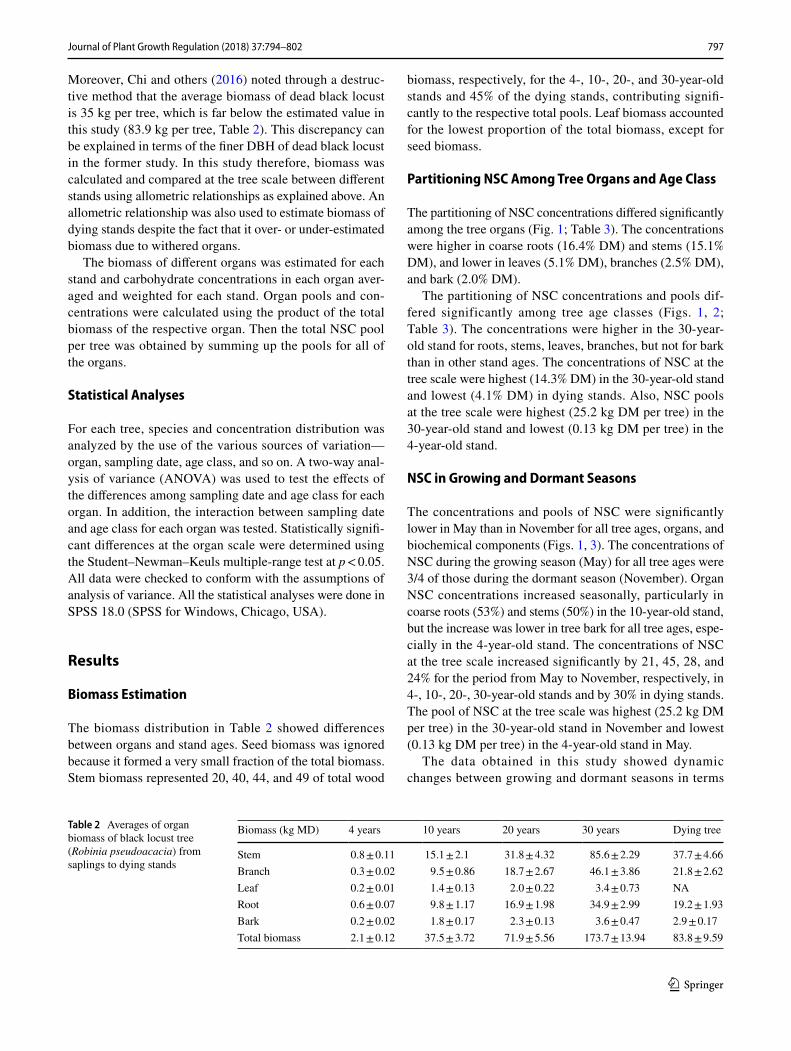
The partitioning of NSC concentrations and pools dif-fered significantly among tree age classes (Figs. 1, 2; Table 3). The concentrations were higher in the 30-year-old stand for roots, stems, leaves, branches, but not for bark than in other stand ages. The concentrations of NSC at the tree scale were highest (14.3% DM) in the 30-year-old stand and lowest (4.1% DM) in dying stands. Also, NSC pools at the tree scale were highest (25.2 kg DM per tree) in the 30-year-old stand and lowest (0.13 kg DM per tree) in the 4-year-old stand.
NSC in Growing and Dormant Seasons
The concentrations and pools of NSC were significantly lower in May than in November for all tree ages, organs, and biochemical components (Figs. 1, 3). The concentrations of NSC during the growing season (May) for all tree ages were 3/4 of those during the dormant season (November). Organ NSC concentrations increased seasonally, particularly in coarse roots (53%) and stems (50%) in the 10-year-old stand, but the increase was lower in tree bark for all tree ages, espe-cially in the 4-year-old stand. The concentrations of NSC at the tree scale increased significantly by 21, 45, 28, and 24% for the period from May to November, respectively, in 4-, 10-, 20-, 30-year-old stands and by 30% in dying stands. The pool of NSC at the tree scale was highest (25.2 kg DM per tree) in the 30-year-old stand in November and lowest (0.13 kg DM per tree) in the 4-year-old stand in May.
The data obtained in this study showed dynamic changes between growing and dormant seasons in terms
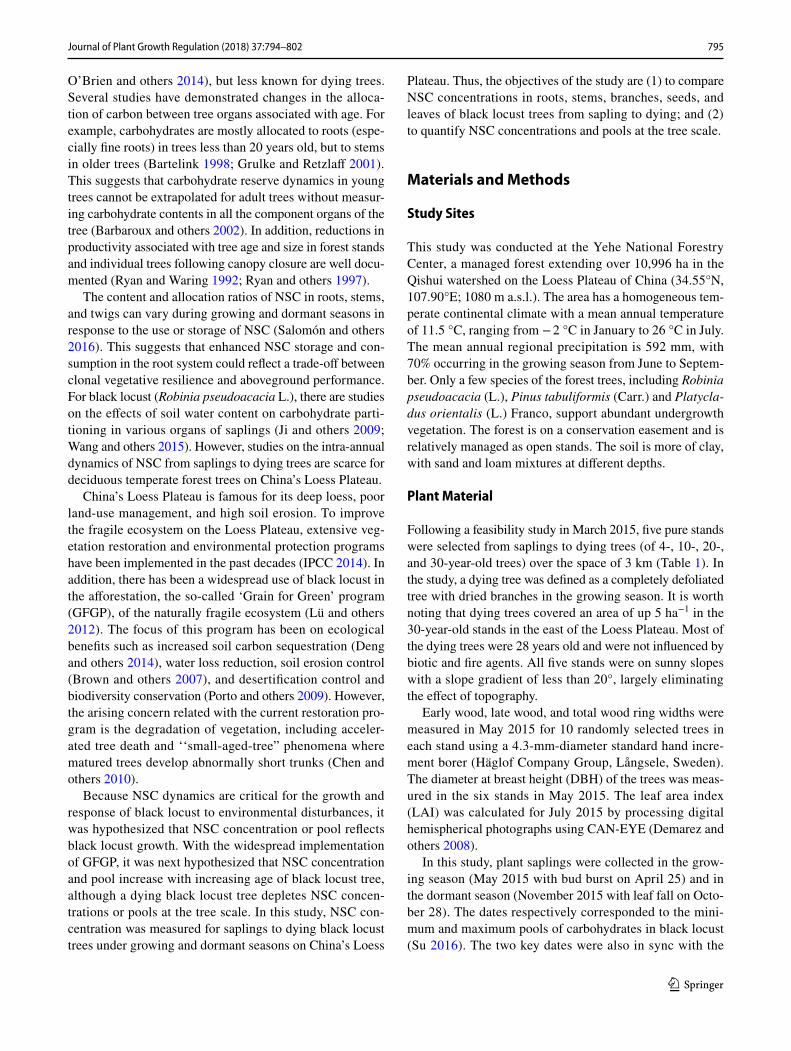
Table 2 Averages of organ biomass of black locust tree (Robinia pseudoacacia) from saplings to dying stands
Biomass (kg MD) 4 years 10 years 20 years 30 years Dying tree
Stem 0.8 ± 0.11 15.1 ± 2.1 31.8 ± 4.32 85.6 ± 2.29 37.7 ± 4.66Branch 0.3 ± 0.02 9.5 ± 0.86 18.7 ± 2.67 46.1 ± 3.86 21.8 ± 2.62Leaf 0.2 ± 0.01 1.4 ± 0.13 2.0 ± 0.22 3.4 ± 0.73 NARoot 0.6 ± 0.07 9.8 ± 1.17 16.9 ± 1.98 34.9 ± 2.99 19.2 ± 1.93Bark 0.2 ± 0.02 1.8 ± 0.17 2.3 ± 0.13 3.6 ± 0.47 2.9 ± 0.17Total biomass 2.1 ± 0.12 37.5 ± 3.72 71.9 ± 5.56 173.7 ± 13.94 83.8 ± 9.59

798 Journal of Plant Growth Regulation (2018) 37:794–802
1 3
of the partitioning of sugar and starch (Fig. 3). Sugar con-centrations remained unchanged for all organs of all tree ages between May and November, but starch concentra-tions were approximately two-fold higher during the dor-mant (November) than the growing (May) season for some
organs. The starch-to-sugar ratio in all the organs and across the tree ages surprisingly had a clear seasonal trend (Fig. 4). Sugar concentrations accounted for a much higher proportion of total NSC concentration in May (62‒77%) than in November (39‒54%) for all tree ages.
Fig. 1 Non-structural carbohydrate concentrations (starch + sugar) in each black locust plant organ from saplings to dying trees in May and November 2015. Plot a is for branch, b stem, c bark, d root, e leaf, and f seed. Error bars indicate standard deviations (n = 5 trees per
treatment). Different lowercase letters denote significant differences between sampling dates within a stand age and different capital let-ters denote significant differences between stand ages with the same sampling date (p < 0.05)
799Journal of Plant Growth Regulation (2018) 37:794–802
1 3
Discussions
NSC Distribution for Age Class and Plant Organ
Despite similar climatic and edaphic conditions, the con-centrations and pools of NCS differed at the tree scale from saplings to dying trees, which indicated that the partitioning of NSC varied with stand type. Consistent with other stud-ies (Niinemets 1997; Sala and Hoch 2009), the concentra-tion of NCS increased with increasing tree age, except for dying trees (Fig. 2), probably due to the large difference in photosynthesis among the tree stands (Körner 2003; Sala and Hoch 2009). Higher NSC concentrations in larger trees could also be partly associated with the higher light avail-ability to taller trees (Niinemets 2010). Tolerance to low light conditions decreased with increasing tree size due to lower photosynthetic rates and a higher fraction of non-pho-tosynthetic biomass (Valladares and Niinemets 2008). Sap-lings, however, allocated less carbon to storage than mature trees, even if grown under more light and optimal conditions (Niinemets 2010).
The estimated concentration of NCS in this study was higher for coarse roots and stems and lower for leaves (Fig. 1), which was in agreement with other studies on the distribution of NSC in deciduous plants (Samuelson and Kelly 1996; Bollmark and others 1999; Zhang and others 2015). The higher NSC concentration in roots and stems than in other parts of the black locust plant can be attrib-uted to the high metabolic activity of sapwood and the long transport function of carbohydrates (Yang and others 2016). In addition, roots and stems form an important NSC storage reserve, reflecting the buffering capacity of trees against stress (Galiano and others 2011). In this study, NSC concentration was lowest for leaves; generally 2/3 of the concentration in stems or roots for black locust (Zhang and others 2015) and also for other tree species (Barbaroux and others 2002). This could be related to the characteristics of carbon allocation and transport in tree plants (Yang and others 2016). Furthermore, big trees generally have a higher NSC concentration and pool than small trees (Figs. 1, 2). Again this could be explained by developed root systems
Table 3 Summary of two-way ANOVA for the effects of age (from saplings to dying stand) and sampling date on the distribution of carbohydrates in branches, stems, bark, and coarse roots of black locust trees (Robinia pseudoacacia)
Variable df Sugar Starch Total NSC
F P F P F P
Organ 3 158.2 0.000 35.9 0.000 186.5 0.000Date 1 5.4 0.023 315.1 0.000 143.2 0.000Age 5 58.4 0.000 11.2 0.000 59.1 0.583Organ × date 3 0.3 0.861 6.3 0.001 3.2 0.026Organ × age 15 14.6 0.000 1.7 0.056 10.6 0.000Date × age 5 0.3 0.900 0.7 0.653 0.9 0.514Organ × date × age 15 0.2 1.000 0.4 0.990 0.4 0.961
Fig. 2 Plots of NSC concentrations (a) and pools (b) at the tree scale for black locust (Robinia pseudoacacia) in May and November 2015. Leaf, stem, branch, and root biomass were estimated and extrapolated at the tree scale using allometric relationships based on stem diameter at breast height and the whole tree height. Note that missing leaf NSC data for November were neglected. Error bars indicate standard devi-ations (n = 5 trees per treatment). Different lowercase letters denote significant differences between sampling dates within a stand age and different capital letters denote significant differences between stand ages with the same sampling date (p < 0.05)

800 Journal of Plant Growth Regulation (2018) 37:794–802
1 3
considered to be large carbon sinks. This sink is often at the end of a long carbon transport chain which prevents the complete replenishment of NSC in roots (Minchin 2007). The tree-scale sampling for NSC concentration in this study represented the NSC budget for a whole tree because coarse roots, stems, and branches contribute substantially to the NSC pool (Würth and others 2005).
It is interesting to note that in this study, dying trees showed NSC pool depletion (Fig. 2). Firstly, for dying trees, photosynthetic capacity was not sufficient to provide the required energy to support plant respiration, thus the non-recharge of the NSC pool (Ni and others 2017). Secondly, decreasing biomass of dying trees resulted in the lowering of the NSCs pool. Generally, the degradation of vegetation could be explained by soil moisture decline. In arid and semi-arid regions, water is a key consideration for afforesta-tion efforts (Cao and others 2009; Jin and others 2011; Deng and others 2016). However, the widespread implementation
of GFGP has intensified the depletion of soil moisture (Jia and others 2017). In addition, forests are clearly not a suit-able choice of vegetation in areas with mean annual precipi-tation of less than 600 mm (Deng and others 2016). There-fore, determining the correct relationship between soil water availability and the NSC pool from saplings to dying trees can strengthen the existing understanding of the processes of growth and deterioration of forestry ecosystems.
NSCs in Growing and Dormant Seasons
Although the variations in NSC were very similar among all the tree ages, there were differences in NSC between grow-ing and dormant seasons. For example, total NSC and starch concentrations increased from May to November (Figs. 2, 3). The trends could be explained by the replenishment of NSC concentration during the summer growing season (for example, NSC increased from May to August, see Andrew
Fig. 3 Plots of sugar (glucose, sucrose, and fructose) (a, b) and starch (c, d) concentrations in black locust plant organs from saplings to dying trees in May and November 2015. Error bars indicate standard
errors (n = 5 trees per treatment). Leaf and seed samples were col-lected in May and November 2015, respectively

801Journal of Plant Growth Regulation (2018) 37:794–802
1 3
and others 2013), when photosynthesis exceeded metabolic demand for carbon. However, more sampling frequency is necessary for accurate determination of the dynamics of NSC concentrations. The conversion of (readily transported and metabolically active) sugar to (immobile and metaboli-cally inert) starch (Andrew and others 2013; Woodruff and Meinzer 2011) varies with season (Fig. 3). For example, the sugar concentration in May accounted for a much higher proportion (61‒77%) of NSC concentrations for all tree ages, whereas the starch concentration in November was higher than that of sugar for all tree ages. The increase in starch concentration from May to November was due to the larger increase in total NSC concentration over the same period. This conformed well with the standard conceptual model, for which the NSC pool is depleted when demand exceeds supply over the course of the summer growing season (for example, May), and the pool recharges when supply exceeds demand over the course of the winter dormant season (for example, November) (Chapin and others 1990; Grulke and Retzlaff 2001).
Clearly, the sampling for plant NSC in this study failed to capture the complete picture of the NSC budget at the tree scale. Long-term sampling and parallel data (for example, radial stem growth) are needed for a full understanding of carbohydrate demand and supply, together with the conver-sion of sugar to starch and vice versa, in different stand ages (Andrew and others 2013). It will also deepen the existing insight into the processes of mobilization of reserves (as storage in leaves, roots, stems and branches) and the influ-ences of the overall dynamics of the NSC budget at the tree scale.
Conclusions
A unique short-term study was conducted to quantify the seasonal variability of NSC concentrations using the dom-inant forest tree species on the Loess Plateau. The study showed that NSC concentrations at the tree scale generally increased with tree age. Intra-tree patterns of NSC distri-bution from saplings to dying trees were similar. NSC con-centrations and pools showed a highly seasonal dynamic at the tree scale. In the month of November, starch con-centrations were higher than sugar concentrations for all tree ages. Irrespective of the above findings, an accurate construction of the NSC budget requires a long sampling period and parallel data (stem growth) for measuring NSC concentrations in all plant organs, including fine roots and twigs. This would be critical for scaling up measured con-centrations to plantation, regional, and global scales.
Acknowledgements This study was supported by the National Natural Science Foundation of China (Nos. 41571130081 and 41390461), the National Key Project for Research and Development (2016YFC0501605), the Youth Innovation Promotion Association of Chinese Academy of Sciences (2017076), and the Program for Bingwei Excellent Talents from Institute of Geographic Sciences and Natu-ral Resources Research, CAS (2015RC204). We thank the editor and reviewers for the insightful comments and suggestions on this paper.
References
Adams HD, Germino MJ, Breshears DD, Barron-Gafford GA, Guar-diola M, Zou CB, Huxman TE (2013) Nonstructural leaf car-bohydrate dynamics of Pinus edulis during drought-induced tree mortality reveal role for carbon metabolism in mortality mechanism. New Phytol 197:1142–1151
Anderegg WRL, Anderegg LDL (2013) Hydraulic and carbohydrate changes in experimental drought-induced mortality of saplings in two conifer species. Tree Physiol 33:252–260
Andrew DR, Carbone MS, Keenan TF, Czimczik CI, Hollinger DY, Murakami P, Schaberg PG, Xu XM (2013) Seasonal dynamics and age of stemwood nonstructural carbohydrates in temperate forest trees. New Phytol 197:850–861
Barbaroux C, Bréda N, Dufrêne E (2002) Distribution of above-ground and below-ground carbohydrate reserves in adult trees of two contrasting broad-leaved species (Quercus petraea and Fagus sylvatica). New Phytol 157:605–615
Bartelink HH (1998) A model of dry matter partitioning in trees. Tree Physiol 18:91–101
Bi J, Huang ZZ, Wang ZL (1993) Studies on biomass dynamic of black locust tree. J Hebei For Coll 8:278–282
Bollmark L, Sennerby-Forsse L, Ericsson T (1999) Seasonal dynam-ics and effects of nitrogen supply rate on nitrogen and carbo-hydrate reserves in cutting-derived Salix viminalis plants. Can J For Res 29:85–94
Brown AE, Podger GM, Davidson AJ, Dowling TI, Zhang L (2007) Predicting the impact of plantation forestry on water users at local and regional scales-an example for the Murrumbidgee River Basin, Australia. For Ecol Manag 251:82–93
Fig. 4 Plot of starch-to-sugar ratios at the tree scale from saplings to dying trees in May and November 2015. Error bars indicate stand-ard deviations (n = 5 trees per treatment). Different lowercase letters denote significant differences between sampling dates within a stand age and different capital letters denote significant differences between stand ages with the same sampling date (p < 0.05)
802 Journal of Plant Growth Regulation (2018) 37:794–802
1 3
Canham CD, Kobe RK, Latty EF, Chazdon RL (1999) Interspecific and intraspecific variation in tree seedling survival: effects of allocation to roots versus carbohydrate reserves. Oecologia 121:1–11
Cao SX, Chen L, Yu XX (2009) Impact of China’s Grain for Green Project on the landscape of vulnerable arid and semi-arid agricul-tural regions: a case study in northern Shaanxi Province. J Appl Ecol 46:536–543
Chapin FS, Schulze ED, Mooney HA (1990) The ecology and econom-ics of storage in plants. Annu Rev Ecol Syst 21:423–447
Chen L, Wang J, Wei W, Fu B, Wu D (2010) Effects of landscape res-toration on soil water storage and water use in the Loess Plateau Region, China. For Ecol Manag 259:1291–1298
Chi Y, Guo Z, Shi HH, Shen CC, Liu YZ (2016) The plantation bio-mass on Beichangshan Island based on forest health. China Envi-ron Sci 36:2522–2535
Demarez V, Duthoit S, Baret F, Weiss M, Dedieu G (2008) Estimation of leaf area and clumping indexes of crops with hemispherical photographs. Agric For Meteorol 148:644–655
Deng L, Liu GB, Shangguan ZP (2014) Land-use conversion and changing soil carbon stocks in China’s ‘Grain-for-Green’ Pro-gram: a synthesis. Glob Change Biol 20:3544–3556
Deng L, Yan WM, Zhang YW, Shangguan ZP (2016) Severe depletion of soil moisture following land-use changes for ecological restora-tion: evidence from northern China. For Ecol Manag 366:1–10
Dunn JP, Potter DA, Kimmerer TW (1990) Carbohydrate reserves, radial growth, and mechanisms of resistance of oak trees to phloem-boring insects. Oecologia 83:458–468
Galiano L, Martinez-Vilalta J, Lloret F (2011) Carbon reserves and canopy defoliation determine the recovery of Scots pine 4 year after a drought episode. New Phytol 190:750–759
Grulke NE, Retzlaff WA (2001) Changes in physiological attributes of ponderosa pine from seedling to mature tree. Tree Physiol 21:275–286
Hartmann H, Ziegler W, Trumbore S (2013) Lethal drought leads to reduction in nonstructural carbohydrates in Norway spruce tree roots but not in the canopy. Funct Ecol 27:413–427
Hoch G, Richter A, Körner C (2003) Non-structural carbon compounds in temperate forest trees. Plant Cell Environ 26:1067–1081
IPCC (2014) Fifth assessment report, climate change 2014: synthesis report. Cambridge University Press, Cambridge
Ji ZB, Wang JX, Li JW, Xue S, Zhang ML (2009) Dynamic changes of soluble sugar in the seedlings of robinia pseudoacacia under drought stress and re-watering in different seasons. Acta Bot Boreal-Occident Sin 29:1358–1363
Jia XX, Shao MA, Zhu YJ, Luo Y (2017) Soil moisture decline due to afforestation across the Loess Plateau, China. J Hydrol 546:113–122
Jin TT, Fu BJ, Liu GH, Wang Z (2011) Hydrologic feasibility of arti-ficial forestation in the semi-arid Loess Plateau of China. Hydrol Earth Syst Sci 15:2519–2530
Körner C (2003) Carbon limitation in trees. J Ecol 91:4–17Li MH, Hoch G, Körner C (2002) Source/sink removal affects mobile
carbohydrates in Pinus cembra at the Swiss treeline. Trees-Struct Funct 16:331–337
Li MH et al (2008) Mobile carbohydrates in Himalayan treeline trees I. Evidence for carbon gain limitation but not for growth limitation. Tree Physiol 28:1287–1296
Lü YH, Fu BJ, Feng XM, Zeng Y, Liu Y, Chang RY, Sun G, Wu BF (2012) A policy-driven large scale ecological restoration: quanti-fying ecosystem services changes in the Loess Plateau of China. PLoS ONE 7:e31782
Minchin P (2007) Mechanistic modelling of carbon partitioning. In: Vos J, Marcelis L, de Visser P, Struik P, Evers J (eds) Func-tional–structural plant modelling in crop production. Springer, Dordrecht, pp 113–122
Ni YY, Chang EM, Liu JF, Jiang ZP (2017) Comparison on photosyn-thetic physiology in various age scions of Platycladus orientalis. J Northwest For Univ 32:19–24
Niinemets Ü (1997) Energy requirement for foliage construction depends on tree size in young Picea abies trees. Trees 11:420–431
Niinemets U (2010) Responses of forest trees to single and multiple environmental stresses from seedlings to mature plants: past stress history, stress interactions, tolerance and acclimation. For Ecol Manag 260:1623–1639
O’Brien MJ, Leuzinger S, Philipson CD, Tay J, Hector A (2014) Drought survival of tropical tree seedlings enhanced by non-structural carbohydrate levels. Nat Clim Change 4:710–714
Ögren E (2000) Maintenance respiration correlates with sugar but not nitrogen concentration in dormant plants. Physiol Plant 108:295–299
Porto P, Walling DE, Callegari G (2009) Investigating the effects of afforestation on soil erosion and sediment mobilisation in two small catchments in Southern Italy. Catena 79:181–188
Ryan MG, Waring RH (1992) Stem maintenance and stand develop-ment in a subalpine lodgepole pine forest. Ecol 73:2100–2108
Ryan MG, Binkley D, Fownes JH (1997) Age-related decline in for-est productivity: pattern and process. Adv Ecol Res 27:213–262
Sala A, Hoch G (2009) Height-related growth declines in ponderosa pine are not due to carbon limitation. Plant Cell Environ 32:22–30
Salomón R, Rodríguez-Calcerrada J, Zafra E (2016) Unearthing the roots of degradation of Quercus pyrenaica coppices: a root-to-shoot imbalance caused by historical management? For Ecol Manag 363:200–211
Samuelson LJ, Kelly JM (1996) Carbon partitioning and allocation in northern red oak seedlings and mature trees in response to ozone. Tree Physiol 16:853–858
Shen JP, Zhang WH, Li YH, He JF, Zhang H (2015) Biomass and car-bon density and patterns of their distribution in the plantations of Robinia pseudoacacia and Pinus tabulaeformis in Loess Gullies in Eastern Gansu. Sci Silvae Sin 51:1–7
Su J (2016) Studies on seasonal dynamic changes of fine root mor-phology and physiology of Robinia pseudoacacia in loess area. Northwest Agriculture & Forestry University, Yangling, China
Valladares F, Niinemets Ü (2008) Shade tolerance, a key plant feature of complex nature and consequences. Annu Rev Ecol Evol Syst 39:237–257
Wang BT, Wang Y, Guo JH, Zheng PL, Ma FB, Zhang H (2005) Effect on biomass of stand density of artificial Black Locust for-est in semi-arid region of Loess Plateau. Sci Soil Water Conserv 3:35–39
Wang X, Sun YL, Liu XP (2015) Effects of soil water contents on leaf photosynthesis and carbohydrate partitioning in Robinia pseudoa-cacia. J Northwest For Univ 30:20–25
Woodruff DD, Meinzer FC (2011) Water stress, shoot growth and stor-age of non-structural carbohydrates along a tree height gradient in a tall conifer. Plant Cell Environ 34:1920–1930
Würth MKR, Pelaez-Riedl S, Wright SJ, Korner C (2005) Non-struc-tural carbohydrate pools in a tropical forest. Oecologia 143:11–24
Yang QP, Zhang WD, Li RS, Xu M, Wang SL (2016) Different responses of non-structural carbohydrates in above-ground tis-sues/organs and root to extreme drought and re-watering in Chi-nese fir (Cunninghamia lanceolata) saplings. Trees. https://doi.org/10.1007/s00468-016-1419-0
Zhang HY, Wang CK, Wang XC, Cheng FY (2013) Spatial variation of non-structural carbohydrates in Betula platyphylla and Tilia amurensis stems. J Appl Ecol 24:3050–3056
Zhang T, Cao Y, Chen YM, Liu GB (2015) Non-structural carbohy-drate dynamics in Robinia pseudoacacia saplings under three levels of continuous drought stress. Trees 29:1837–1849