Embed Size (px)
Citation preview
lable at ScienceDirect
Journal of Environmental Radioactivity 167 (2017) 201e210
Contents lists avai
Journal of Environmental Radioactivity
journal homepage: www.elsevier .com/locate/ jenvrad
Tracing the source of sedimentary organic carbon in the Loess Plateauof China: An integrated elemental ratio, stable carbon signatures, andradioactive isotopes approach
Chun Liu a, b, d, Yuting Dong a, c, *, Zhongwu Li a, b, d, **, Xiaofeng Chang a, Xiaodong Nie b, d,Lin Liu a, Haibing Xiao a, Hassan Bashir b, d
a State Key Laboratory of Soil Erosion and Dryland Farming on the Loess Plateau, Institute of Soil and Water Conservation, Chinese Academy of Sciences,Yangling, Shanxi, 712100, PR Chinab College of Environmental Science and Engineering, Hunan University, Changsha 410082, PR Chinac Tianshui Soil and Water Conservation Experimental Station, Yellow River Conservancy Commission, Tianshui, Gansu Province, 741000, PR Chinad Key Laboratory of Environmental Biology and Pollution Control (Hunan University), Ministry of Education, Changsha 410082, PR China
a r t i c l e i n f o
Article history:Received 2 September 2016Received in revised form23 October 2016Accepted 25 October 2016Available online 11 November 2016
Keywords:Soil organic carbonIsotopesLand use typesSedimentCheck-damLoess Plateau
* Corresponding author. State Key Laboratory oFarming on the Loess Plateau, Institute of Soil andAcademy of Sciences, Yangling, Shanxi, 712100, PR Ch** Corresponding author. College of EnvironmentHunan University, Changsha, 410082, PR China.
E-mail addresses: [email protected] (Y. Dong), liz
http://dx.doi.org/10.1016/j.jenvrad.2016.10.0220265-931X/© 2016 Elsevier Ltd. All rights reserved.
a b s t r a c t
Soil erosion, which will induce the redistribution of soil and associated soil organic carbon (SOC) on theEarth's surface, is of critically importance for biogeochemical cycling of essential elements and terrestrialcarbon sequestration. Despite the importance of soil erosion, surprisingly few studies have evaluated thesources of eroded carbon (C). This study used natural abundance levels of the stable isotope signature(13C) and radioactive isotopes (137Cs and 210Pbex), along with elements ratio (C/N) based on a two endmember mixing model to qualitatively and quantitatively identify the sources of sedimentary OCretained by check dam in the Qiaozigou small watershed in the Loess Plateau, China. Sediment profiles (0e200 cm) captured at natural depositional area of the basin was compared to possible source materials,which included: superficial Loess mineral soils (0e20 cm) from three land use types [i.e., grassland(Medicago sativa), forestland (Robinia pseudoacacia.), shrubland (Prunus sibirica), and gully land (Loessparent material.)]. The results demonstrated that SOC in sediments showed significantly negative cor-relation with pH (P < 0.01), and positive correlation with soil water content (SWC) (P < 0.05). Thesedimentary OC was not derived from grasslands or gullies. Forestland and shrubland were two mainsources of eroded organic carbon within the surface sediment (0e60 cm deep), except for that in the 20e40 cm soil layer. Radionuclides analyses also implied that the surface sediments retained by check-dams mainly originated from soils of forestland and shrubland. Results of the two end-member mix-ing model demonstrated that more than 50% SOC (mean probability estimate (MPE) 50.13% via 13C and60.53% via C/N) in surface sediment (0e20 cm deep) derived from forestland, whereas subsurfacesedimentary SOC (20e200 cm) mainly resulted from shrubland (MPE > 50%). Although uncertainties onthe sources of SOC in deep soils exist, the soil organic d13C and C/N is still an effective indicator forsources of sedimentary organic carbon in the deposition zone in the short term (<10 years).
© 2016 Elsevier Ltd. All rights reserved.
1. Introduction
Soil organic carbon (SOC), the main component of largest
f Soil Erosion and DrylandWater Conservation, Chineseina.al Science and Engineering,
[email protected] (Z. Li).
terrestrial carbon pool, has played a pivotal role in global carboncycling (Xin et al., 2016). A small change in the SOC stocks mayresult in a significant variation in the atmospheric carbon dioxide,which will have impacts on global climate (Lü et al., 2012). Soilerosion, one of the most active mechanisms controlling soil for-mation and evolution, would facilitate not only the translocation ofsoil materials, but also the dynamic of soil organic carbon (Lal,2003; Ran et al., 2014). Until recently, with the removal of C-richtopsoil from eroding slope positions and burial at a depressionaland/or protected site, the redistribution of SOC caused by soil
C. Liu et al. / Journal of Environmental Radioactivity 167 (2017) 201e210202
erosion site still has been intensely debated in the literature as towhether the net impact of erosion on C cycling acts as a C source orsink (Smith et al., 2001; Lal, 2004; Berhe et al., 2007; Harden et al.,2008; Vandenbygaart et al., 2015; Doetterl et al., 2016). The dif-ference in sink/source terms mainly origins from variance in theapproaches used in each study and incomplete understanding ofthe interactions between erosion and C cycling at the process level,especially the considerable uncertainty as to the fate of the OM thatis exported out of eroding catchments (Liu et al., 2003; Doetterlet al., 2016). Therefore, tracing the movement of SOM fromeroding platforms of different land use types, as well as identifi-cation of its ultimate depositional setting within a catchment, isessential for quantifying the fate of laterally transported C on thelandscape (Berhe and Kleber, 2013; McCorkle et al., 2016).
Stable isotope analysis is a potentially powerful tool to deter-mine the sources of organic matter supporting foodwebs in aquaticenvironments and the contributions of catchment sources to in-stream particulate organic matter (Hein et al., 2003; Gellis andWalling, 2011; Laceby et al., 2015; McCorkle et al., 2016). The suc-cessful application of carbon isotope for tracing the source and fateof carbon by using the characteristics that have distinct value be-tween sources is found in previous studies (Ehleringer et al., 2000;Stevenson et al., 2005; Norra et al., 2005; Boeckx et al., 2006;Weihmann et al., 2007; Zhu and Liu, 2008). Traditionally, someradioactive isotopes (137Cs, 210Pb, and 7Be) are used to estimate therate of soil erosion and to infer associated rates of soil C erosion(Yoo et al., 2005; Simms et al., 2008; Kim, 2008; Klaminder et al.,2009; McCorkle et al., 2016), because they bind tightly to soilminerals and are only redistributed when the soil minerals aremobilized vertically or laterally (Alewell et al., 2009; Gellis andWalling, 2011; Kim et al., 2013). For instance, Li et al. (2006)demonstrated that 137Cs and 210Pbex, and SOC moved on thesloping land by the same physical mechanism during tillage oper-ations, and fallout137Cs and 210Pbex could be used directly forquantifying dynamic SOC redistribution as affected by tillageerosion on a steep backslope of the Chinese Loess Plateau.
Even though stable carbon isotopes aremost commonly used fortracing terrestrial carbon, the distinguishing of sources is notstraightforward since the isotopic composition is often overlapping(Schoeninger and Deniro, 1984). For this reason, an additionaltracer, the elemental C/N ratio, for example, is used along with thevalues of radioactive isotopes (137Cs and 210Pb) for distinguishingpotential sources of soil and its associated SOC under different landcover types or landform positions (Simms et al., 2008). Combina-tion techniques have been used to estimate organic carbon budgetsand relate biomarker composition to the source organic materialand depositional environment (Laceby et al., 2015; Wang et al.,2015b). Previous studies demonstrated that sedimentary carbonwasmainly derived from 1) plants production in situ through tissueresidues or via root exudates and symbiotic fungi (Trumbore andCzimczik, 2008) and 2) external soil and associated soil C inputsfrom the catchment sources by soil erosion (Zhang et al., 2013; Maet al., 2016). With the application of an end-member mixing modelbased on the tracers, the relative contribution of SOC from differentpotential sources to sedimentary OC are accurately quantified,which would have significant impacts on evaluating the region orglobal carbon budget (Berhe et al., 2007). Recently, McCorkle et al.(2016) demonstrated that 58e100% of the OM in the sediments wassourced from O-horizon material in the Bull catchment and O-ho-rizon material contributed 42e69% of the OM to the sediments inthe Providence catchment, USA, by using a two-end membermixing model (i.e.,13C and 15N as the tracers, respectively). Forinstance, Yu et al. (2010) also used a simple two end membermixing model based on the bulk organic d13C and C/N as indicatorsto identify the sedimentary OC sources in the Pearl River delta and
estuary, southern China, indicating that generally more than 50%TOM contributed to the sedimentary organic matter in the innerestuary.
The Loess Plateau in northwestern China is a well-known area,where severe soil erosion has induced more than 60% of the landbeing subjected to soil andwater losses, with an average annual soilloss of 2000e2500 t km�2 (Shi and Shao, 2000; Fu et al., 2011). Themain influencing factors are attributed to its high soil erodibilityand intensive human activities in this region (Fu et al., 2011). A largequantity of sediment pouring to the Yellow River in the middlereachmainly originates from the Loess Plateau (Hassan et al., 2008).The SOC can also be exported fromwatershed by soil erosion alongwith transportation of associated sediment (Fang et al., 2012; Zhanget al., 2013; Ran et al., 2014; Xin et al., 2016). Carbon and nitrogenlosses in the soil ecosystem have seriously depleted land resourcesand degraded the ecosystem in the Loess Plateau. Moreover, theloss of C and N nutrients have a significant impact on the biogeo-chemical cycles in the terrestrial and aquatic ecosystem, whichcontribute to aggravate global warming, air pollution, eutrophica-tion, diversity decline andwater quality deterioration (Melillo et al.,2002; Fu et al., 2010; Chen et al., 2015).
Since the 1950s, Chinese government has implemented long-term soil and water control measures, mainly including afforesta-tion, grass planting, terrace building, dam construction in gully, andwater conservancy projects in the tributaries (Xin et al., 2012).Check-dams are the most effective way to conserve soil and waterand have been widespread constructed in gullies on the LoessPlateau (Xu et al., 2004). Consequently, the intensity of soil erosionhas been greatly mitigated and the sediment originating from theLoess Plateau has shown a significantly decreased trend (Miao et al.,2010; Gao et al., 2010). In the past six decades, massive amounts ofSOCwere buried in thewatershed alongwith sediments trapped bycheck-dams and reservoirs, and accordingly, significant reductionin organic carbon that is exported to the ocean has been observed(Lu et al., 2013a; 2013b; Ran et al., 2013, 2014). However, owing tothe complex soil conditions and the diversity of potential carbonsources (autochthonous and allochthonous sources of carbon)during erosion and deposition process, little information regardingthe identification of erosion-induced soil organic carbon source insediments retained by check dams is available for the Loess Plateau,especially the contributions of potential carbon source underdifferent land use types (Lü et al., 2012; Cooper et al., 2015).
Therefore, the main objectives of this study were as follows: (i)to analyze the vertical distribution pattern of SOC content in sedi-ments retained by check dams and its influencing factor; (ii) toidentify the sedimentary SOC source via combination of isotopetraces and elements analysis; (iii) to assess quantitatively relativecontributions of soil organic carbon from different land use types tosedimentary SOC retained by check dams.
2. Materials and methods
2.1. Study area
The present study was conducted in a sub-catchment trappedby one check dam (0.04 km2), which is locatedwithin the Qiaozigousmall watershed (2.45 km2) in the loess hillyegully region of theLoess Plateau near Tianshui City, Gansu Province, China (105� 430 E,34� 360 N) (Fig. 1). The climate of study area is characterized byseasonal alternations of the East Asian summer and winter mon-soons, with a mean annual temperature of 10.7 �C and an annualmean precipitation of 542.5 mm. The precipitation occurs in theform of intense, short duration rainstorms between June andSeptember, with large inter-annual and annual variations. Accord-ing to the U.S. Soil Taxonomy, the main distributed soil type is black
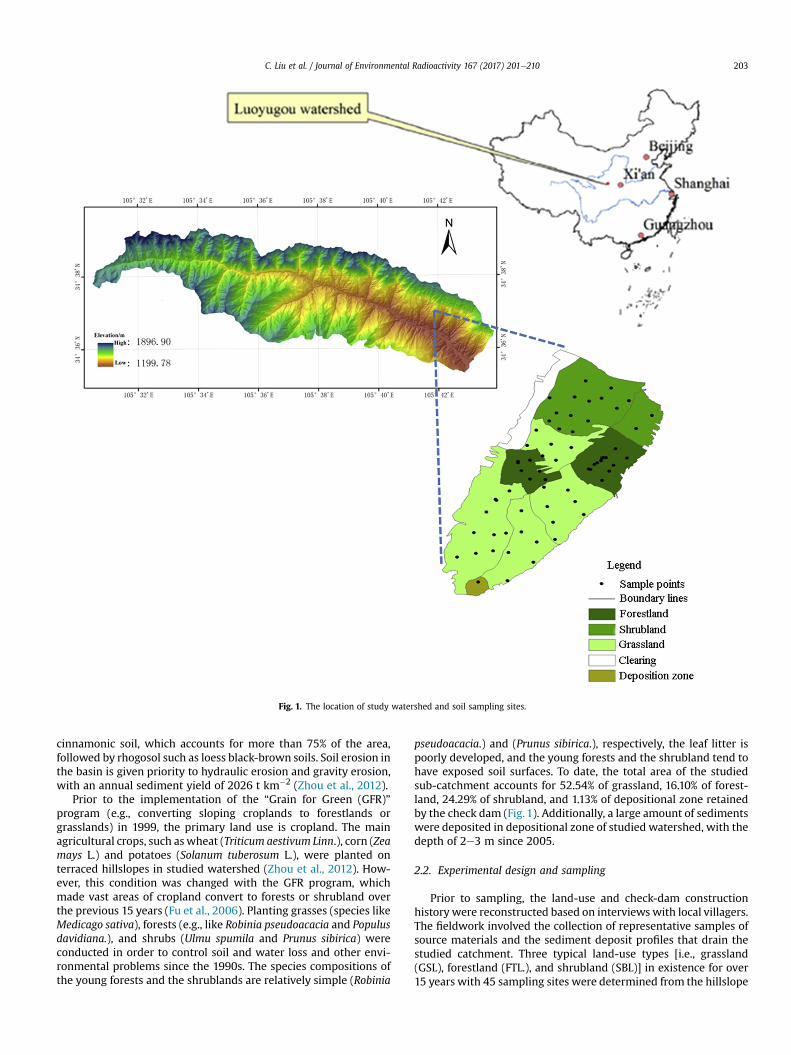
Fig. 1. The location of study watershed and soil sampling sites.
C. Liu et al. / Journal of Environmental Radioactivity 167 (2017) 201e210 203
cinnamonic soil, which accounts for more than 75% of the area,followed by rhogosol such as loess black-brown soils. Soil erosion inthe basin is given priority to hydraulic erosion and gravity erosion,with an annual sediment yield of 2026 t km�2 (Zhou et al., 2012).
Prior to the implementation of the “Grain for Green (GFR)”program (e.g., converting sloping croplands to forestlands orgrasslands) in 1999, the primary land use is cropland. The mainagricultural crops, such aswheat (Triticum aestivum Linn.), corn (Zeamays L.) and potatoes (Solanum tuberosum L.), were planted onterraced hillslopes in studied watershed (Zhou et al., 2012). How-ever, this condition was changed with the GFR program, whichmade vast areas of cropland convert to forests or shrubland overthe previous 15 years (Fu et al., 2006). Planting grasses (species likeMedicago sativa), forests (e.g., like Robinia pseudoacacia and Populusdavidiana.), and shrubs (Ulmu spumila and Prunus sibirica) wereconducted in order to control soil and water loss and other envi-ronmental problems since the 1990s. The species compositions ofthe young forests and the shrublands are relatively simple (Robinia
pseudoacacia.) and (Prunus sibirica.), respectively, the leaf litter ispoorly developed, and the young forests and the shrubland tend tohave exposed soil surfaces. To date, the total area of the studiedsub-catchment accounts for 52.54% of grassland, 16.10% of forest-land, 24.29% of shrubland, and 1.13% of depositional zone retainedby the check dam (Fig. 1). Additionally, a large amount of sedimentswere deposited in depositional zone of studied watershed, with thedepth of 2e3 m since 2005.
2.2. Experimental design and sampling
Prior to sampling, the land-use and check-dam constructionhistory were reconstructed based on interviews with local villagers.The fieldwork involved the collection of representative samples ofsource materials and the sediment deposit profiles that drain thestudied catchment. Three typical land-use types [i.e., grassland(GSL), forestland (FTL.), and shrubland (SBL)] in existence for over15 years with 45 sampling sites were determined from the hillslope
C. Liu et al. / Journal of Environmental Radioactivity 167 (2017) 201e210204
of the studied catchment, and 7 gully soil sampling sites (GYL) werealso selected as the potential organic carbon sources (Fig. 1). Soilsampling sites were selected on the basis of topography and slopepositions (upper, mid, lower) along the slope under different land-use types and along the stream in the small watershed. One soilsampling site was selected in the deposition zone as the sedimentdeposit profiles (Fig. 1). Meanwhile, aspects, gradients, and alti-tudes were recorded in situ at each quadrat using a global posi-tioning system receiver (GPS), with an accuracy of approximately1 m.
Sediment samples (0e200 cm deep) were taken from theselected check dam with the 20 cm intervals. A total of 30 bulksamples (1 kg) were collected using a 7.0 cm-diameter soil samplerfor the physico-chemical properties analysis with three duplicateseach layer. Meanwhile, soil profiles were dug with picks and spadesat identical soil layer intervals to estimate the soil bulk densityusing the soil cores (100 cm3 volume stainless steel tubes) withthree replicates at each sampling site. A total of 62 bulk soil samplesfrom each land-use type and gully were collected using a 7.0 cm-diameter soil sampler in the surface soil layer (0e20 cm). Eachsample was a mixture of three sub-samples taken from differentsampling points in order to provide a composite sample. The bulksamples were extruded from the core to 30 cm deep for thedetermination of 137Cs and 210Pbex to calculate the erosion intensityin each sampling point using a 5-cm diameter soil auger with threereplications. Weeds and litterfall were cleared up before the sam-pling process.
2.3. Laboratory analysis
Soil samples were analyzed at the State Key Laboratory of SoilErosion and Dryland Farming on the Loess Plateau, Institute of Soiland Water Conservation, Chinese Academy of Sciences. Prior tolaboratory analysis, visible root residues and stones in the soilsamples were removed. The samples were air-dried at room tem-perature, weighed, and divided into two parts, one passing througha 2 mm sieve for the measurement of soil texture, pH, 137Cs and210Pbex concentrations, and the other passing through a 0.25 mmmesh for the measurement of SOC and total soil nitrogen (TSN)contents (Li et al., 2017). The soil pH was determined with asoilewater ratio of 1:2.5 using HI 3221 pH meter (Hanna In-struments Inc., USA). The soil bulk density (BD) and soil watercontent (SWC) were measured by the volumetric ring method(Carter, 1993). The SOC and TSN contents were determined usingthe dichromate oxidation method (Nelson and Sommers, 1982) andthe modified Kjeldahl method (Liu et al., 1996). The soil texture andspecific surface area (SSA) were analyzed using a Laser Particle SizeAnalyzer (Mastersizer, 2000; Marlven, Ltd. UK); the measurementsspanned sizes from 0.02 to 2000 mm. In addition, the concentrationof DOC was determined following Jones’ procedure (Jones andWillett, 2006). Briefly, fresh soil was extracted with 0.5 M K2SO4in the 150 cm3 Erlenmeyer flasks on a reciprocating shaker at aspeed of 250 rpm, with a shaking time of 1 h at a temperature of20 �C and a soil-to-solution (0.5 M K2SO4 solution) ratio of 1:5 (w/v). After shaking, the extracts were centrifuged at 2500 rpm for20 min and the supernatant was filtered through a 0.45 mm filterbefore the analysis of DOC (Ma et al., 2016). The DOC was deter-mined by using Shimadzu TOC-VCPH (Shimadzu Corp., Kyoto,Japan), with the accuracies of 0.01 mg/L. The soil samples of <2 mmfraction were stored for 28 days prior to assaying to achieve equi-librium between in situ 226Ra and its daughter 222Rn before mea-surement of 210Pbex, which was determined by subtracting 214Pbfrom the total measured 210Pb (Li et al., 2006). The activities of 137Cs(at 662 keV) and 210Pbex (at 46.5 keV) were measured by lowbackground gamma spectrometry, using a hyper-pure coaxial
germanium detector (GMX50, PerkinElmer) linked to a multi-channel digital analyzer system. The counting time in all caseswas over 20,000 s, providing an analytical precision of 6% for 137Cs,10% for 210Pb (Ma et al., 2016). Prior to determine the d13C values, allsoil samples were acidified with 1 M HCl to remove all traces ofinorganic carbon, then frozen and freeze-dried. The d13C valueswere determined using an elemental analyzer (EA e CE 1500 NA,Carlo Erba) interfaced with an isotope-ratio mass spectrometer(IRMS) (VG Iso-prime). The d13C values are calculated as the relativedeviation between the measured 13C/12C ratio (Rsample) and the13C/12C ratio of the international standard Vienna Pee Dee Belem-nite (V-PDB) (Rstandard), as follows: 13C (‰) ¼ [(Rsample/Rstandard)�1]� 1000. The precision of the d13C values reported hereis estimated at ± 0.01‰ based on repeated measurements of alaboratory standard.
2.4. Member mixing model and statistics
We plotted d13C versus C/N ratio to identify potential sources oferoded organic carbon (i.e., Grassland, Forestland, Shrubland, andGully land) for the sediment captured within basins at the depo-sitional area (McCorkle et al., 2016). A two-end member mixingmodel (Phillips and Koch, 2002) was then used to quantitativelydetermine the contribution from the different sources to sedi-mentary OC retained by check dams as follows:
d13CS ¼ fR d13CR þ fA d13CA (1)
1 ¼ fR þ fA (2)
where the subscripts R, A represent two land-use types sources(RPL and ATL) and the subscript S represents a mixture (sedimentsin the depositional zone), respectively, f represents the fractionalcontribution of soil carbon from each land use type source to thesediments in the depositional zone, d13C represents the stable soilorganic carbon isotopic signatures. Similarly, the same formulationcan be used for other tracers (C/N).
All statistical tests were conducted using SPSS version 18.0 (SPSSInc., Chicago, IL, USA). All variables (BD; pH; sand, silt, and claycontent; SWC, SOC and TSN contents; C/N ratio and DOC concen-tration) were treated with mean ± standard deviation and coeffi-cient of variation (CV) in all soil samples. A linear regressionanalysis was conducted to test the Pearson correlation coefficient(r) between SOC and soil physico-chemical properties. Significantdifferences were evaluated at the 0.05 levels using the least sig-nificant differences (LSD).
3. Results
3.1. Vertical distribution of SOC and physico-chemical properties inthe sediment
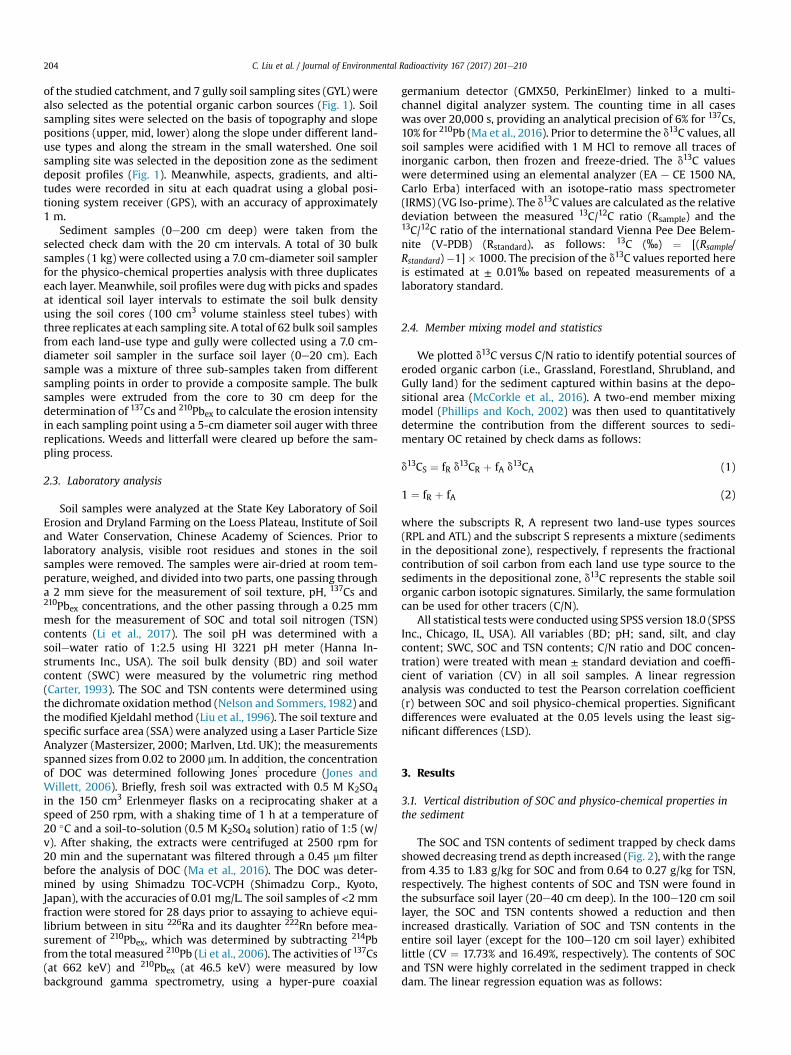
The SOC and TSN contents of sediment trapped by check damsshowed decreasing trend as depth increased (Fig. 2), with the rangefrom 4.35 to 1.83 g/kg for SOC and from 0.64 to 0.27 g/kg for TSN,respectively. The highest contents of SOC and TSN were found inthe subsurface soil layer (20e40 cm deep). In the 100e120 cm soillayer, the SOC and TSN contents showed a reduction and thenincreased drastically. Variation of SOC and TSN contents in theentire soil layer (except for the 100e120 cm soil layer) exhibitedlittle (CV ¼ 17.73% and 16.49%, respectively). The contents of SOCand TSN were highly correlated in the sediment trapped in checkdam. The linear regression equation was as follows:
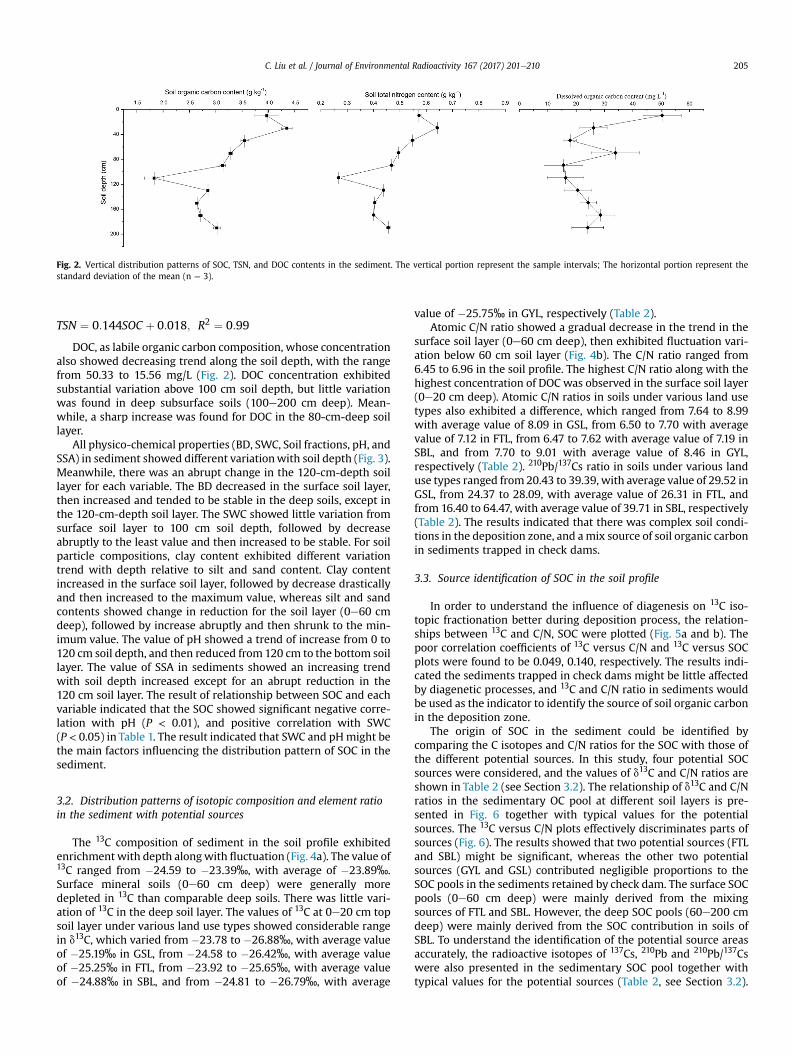
Fig. 2. Vertical distribution patterns of SOC, TSN, and DOC contents in the sediment. The vertical portion represent the sample intervals; The horizontal portion represent thestandard deviation of the mean (n ¼ 3).
C. Liu et al. / Journal of Environmental Radioactivity 167 (2017) 201e210 205
TSN ¼ 0:144SOC þ 0:018; R2 ¼ 0:99
DOC, as labile organic carbon composition, whose concentrationalso showed decreasing trend along the soil depth, with the rangefrom 50.33 to 15.56 mg/L (Fig. 2). DOC concentration exhibitedsubstantial variation above 100 cm soil depth, but little variationwas found in deep subsurface soils (100e200 cm deep). Mean-while, a sharp increase was found for DOC in the 80-cm-deep soillayer.
All physico-chemical properties (BD, SWC, Soil fractions, pH, andSSA) in sediment showed different variationwith soil depth (Fig. 3).Meanwhile, there was an abrupt change in the 120-cm-depth soillayer for each variable. The BD decreased in the surface soil layer,then increased and tended to be stable in the deep soils, except inthe 120-cm-depth soil layer. The SWC showed little variation fromsurface soil layer to 100 cm soil depth, followed by decreaseabruptly to the least value and then increased to be stable. For soilparticle compositions, clay content exhibited different variationtrend with depth relative to silt and sand content. Clay contentincreased in the surface soil layer, followed by decrease drasticallyand then increased to the maximum value, whereas silt and sandcontents showed change in reduction for the soil layer (0e60 cmdeep), followed by increase abruptly and then shrunk to the min-imum value. The value of pH showed a trend of increase from 0 to120 cm soil depth, and then reduced from 120 cm to the bottom soillayer. The value of SSA in sediments showed an increasing trendwith soil depth increased except for an abrupt reduction in the120 cm soil layer. The result of relationship between SOC and eachvariable indicated that the SOC showed significant negative corre-lation with pH (P < 0.01), and positive correlation with SWC(P < 0.05) in Table 1. The result indicated that SWC and pHmight bethe main factors influencing the distribution pattern of SOC in thesediment.
3.2. Distribution patterns of isotopic composition and element ratioin the sediment with potential sources
The 13C composition of sediment in the soil profile exhibitedenrichment with depth alongwith fluctuation (Fig. 4a). The value of13C ranged from �24.59 to �23.39‰, with average of �23.89‰.Surface mineral soils (0e60 cm deep) were generally moredepleted in 13C than comparable deep soils. There was little vari-ation of 13C in the deep soil layer. The values of 13C at 0e20 cm topsoil layer under various land use types showed considerable rangein d13C, which varied from �23.78 to �26.88‰, with average valueof �25.19‰ in GSL, from �24.58 to �26.42‰, with average valueof �25.25‰ in FTL, from �23.92 to �25.65‰, with average valueof �24.88‰ in SBL, and from �24.81 to �26.79‰, with average
value of �25.75‰ in GYL, respectively (Table 2).Atomic C/N ratio showed a gradual decrease in the trend in the
surface soil layer (0e60 cm deep), then exhibited fluctuation vari-ation below 60 cm soil layer (Fig. 4b). The C/N ratio ranged from6.45 to 6.96 in the soil profile. The highest C/N ratio along with thehighest concentration of DOC was observed in the surface soil layer(0e20 cm deep). Atomic C/N ratios in soils under various land usetypes also exhibited a difference, which ranged from 7.64 to 8.99with average value of 8.09 in GSL, from 6.50 to 7.70 with averagevalue of 7.12 in FTL, from 6.47 to 7.62 with average value of 7.19 inSBL, and from 7.70 to 9.01 with average value of 8.46 in GYL,respectively (Table 2). 210Pb/137Cs ratio in soils under various landuse types ranged from20.43 to 39.39, with average value of 29.52 inGSL, from 24.37 to 28.09, with average value of 26.31 in FTL, andfrom 16.40 to 64.47, with average value of 39.71 in SBL, respectively(Table 2). The results indicated that there was complex soil condi-tions in the deposition zone, and amix source of soil organic carbonin sediments trapped in check dams.
3.3. Source identification of SOC in the soil profile
In order to understand the influence of diagenesis on 13C iso-topic fractionation better during deposition process, the relation-ships between 13C and C/N, SOC were plotted (Fig. 5a and b). Thepoor correlation coefficients of 13C versus C/N and 13C versus SOCplots were found to be 0.049, 0.140, respectively. The results indi-cated the sediments trapped in check dams might be little affectedby diagenetic processes, and 13C and C/N ratio in sediments wouldbe used as the indicator to identify the source of soil organic carbonin the deposition zone.
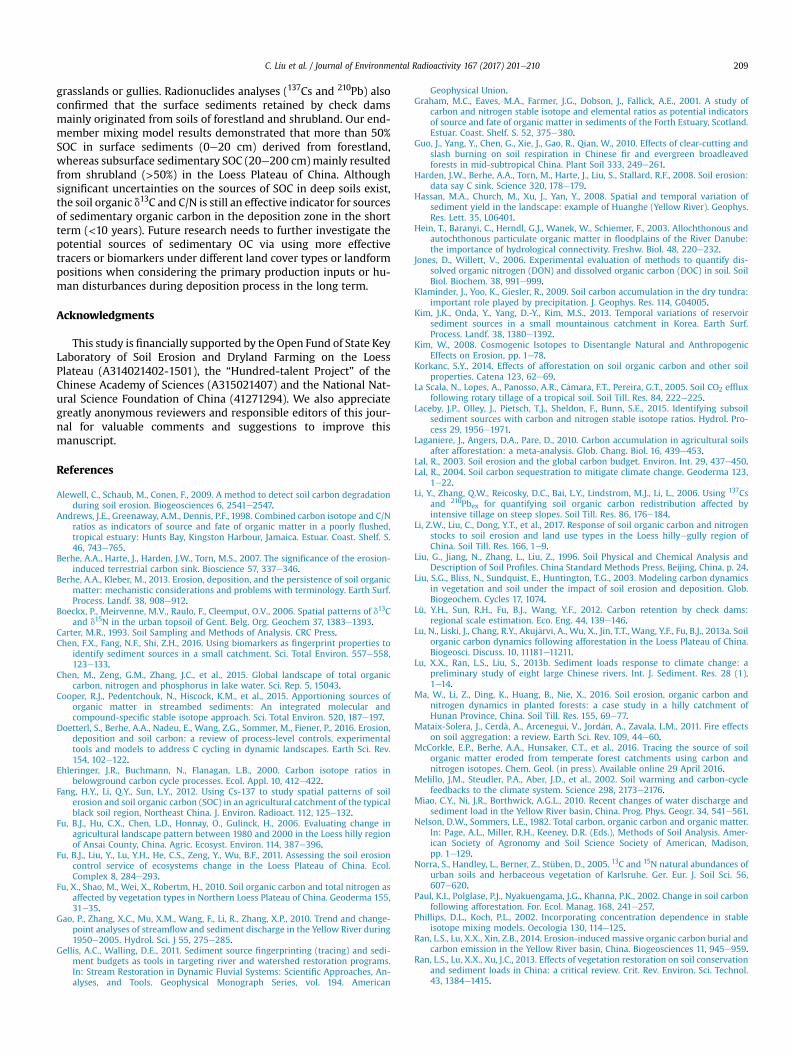
The origin of SOC in the sediment could be identified bycomparing the C isotopes and C/N ratios for the SOC with those ofthe different potential sources. In this study, four potential SOCsources were considered, and the values of d13C and C/N ratios areshown in Table 2 (see Section 3.2). The relationship of d13C and C/Nratios in the sedimentary OC pool at different soil layers is pre-sented in Fig. 6 together with typical values for the potentialsources. The 13C versus C/N plots effectively discriminates parts ofsources (Fig. 6). The results showed that two potential sources (FTLand SBL) might be significant, whereas the other two potentialsources (GYL and GSL) contributed negligible proportions to theSOC pools in the sediments retained by check dam. The surface SOCpools (0e60 cm deep) were mainly derived from the mixingsources of FTL and SBL. However, the deep SOC pools (60e200 cmdeep) were mainly derived from the SOC contribution in soils ofSBL. To understand the identification of the potential source areasaccurately, the radioactive isotopes of 137Cs, 210Pb and 210Pb/137Cswere also presented in the sedimentary SOC pool together withtypical values for the potential sources (Table 2, see Section 3.2).
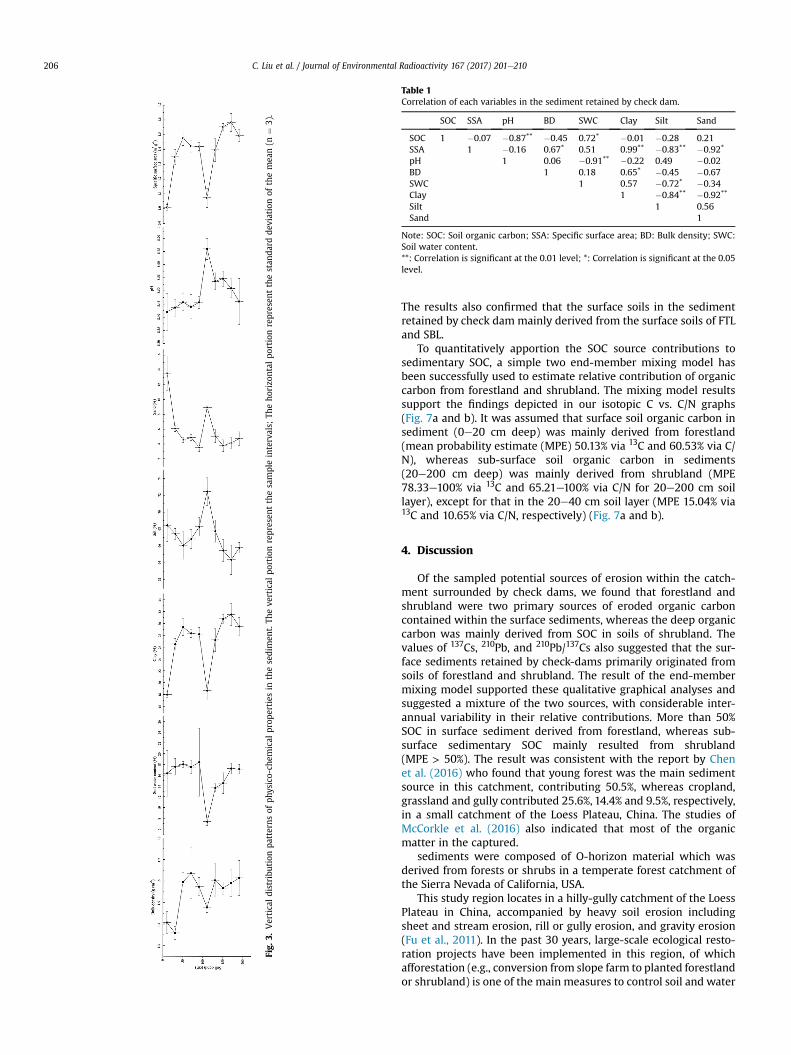
Fig.
3.Verticaldistribu
tion
patterns
ofph
ysico-ch
emical
prop
erties
inthesedimen
t.Th
eve
rtical
portionrepresen
tthesampleintervals;
Theho
rizo
ntal
portionrepresen
tthestan
dard
deviationof
themea
n(n
¼3).
Table 1Correlation of each variables in the sediment retained by check dam.
SOC SSA pH BD SWC Clay Silt Sand
SOC 1 �0.07 �0.87** �0.45 0.72* �0.01 �0.28 0.21SSA 1 �0.16 0.67* 0.51 0.99** �0.83** �0.92*
pH 1 0.06 �0.91** �0.22 0.49 �0.02BD 1 0.18 0.65* �0.45 �0.67SWC 1 0.57 �0.72* �0.34Clay 1 �0.84** �0.92**
Silt 1 0.56Sand 1
Note: SOC: Soil organic carbon; SSA: Specific surface area; BD: Bulk density; SWC:Soil water content.**: Correlation is significant at the 0.01 level; *: Correlation is significant at the 0.05level.
C. Liu et al. / Journal of Environmental Radioactivity 167 (2017) 201e210206
The results also confirmed that the surface soils in the sedimentretained by check dam mainly derived from the surface soils of FTLand SBL.
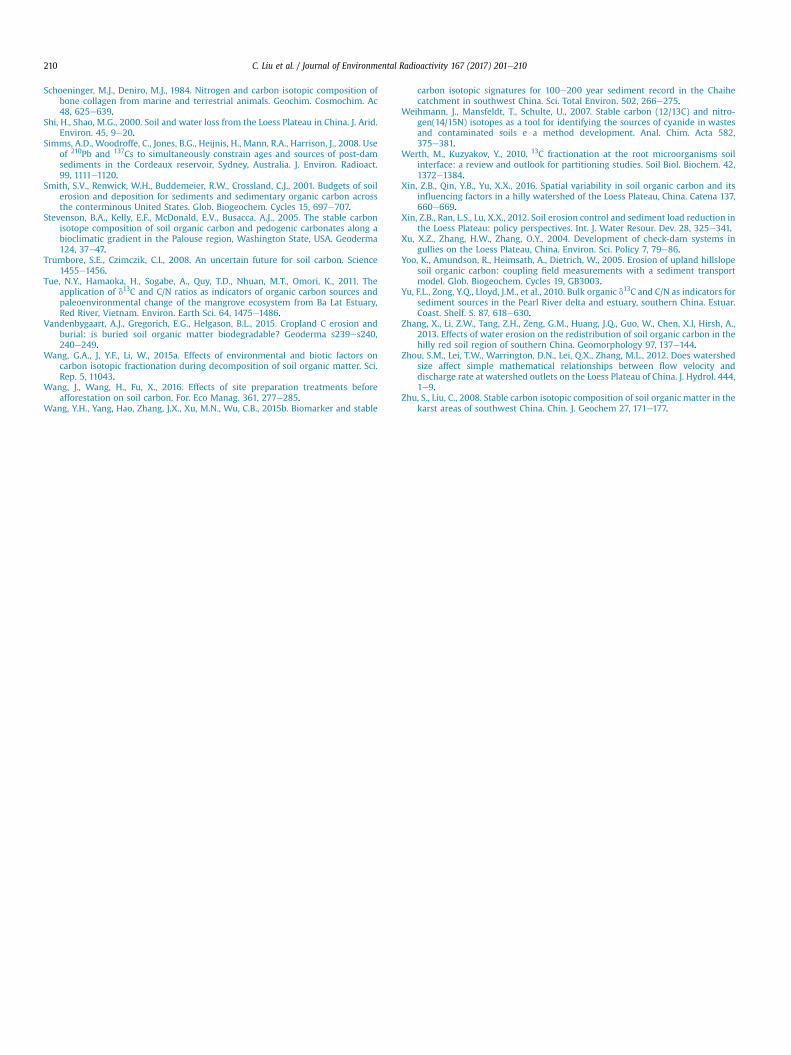
To quantitatively apportion the SOC source contributions tosedimentary SOC, a simple two end-member mixing model hasbeen successfully used to estimate relative contribution of organiccarbon from forestland and shrubland. The mixing model resultssupport the findings depicted in our isotopic C vs. C/N graphs(Fig. 7a and b). It was assumed that surface soil organic carbon insediment (0e20 cm deep) was mainly derived from forestland(mean probability estimate (MPE) 50.13% via 13C and 60.53% via C/N), whereas sub-surface soil organic carbon in sediments(20e200 cm deep) was mainly derived from shrubland (MPE78.33e100% via 13C and 65.21e100% via C/N for 20e200 cm soillayer), except for that in the 20e40 cm soil layer (MPE 15.04% via13C and 10.65% via C/N, respectively) (Fig. 7a and b).
4. Discussion
Of the sampled potential sources of erosion within the catch-ment surrounded by check dams, we found that forestland andshrubland were two primary sources of eroded organic carboncontained within the surface sediments, whereas the deep organiccarbon was mainly derived from SOC in soils of shrubland. Thevalues of 137Cs, 210Pb, and 210Pb/137Cs also suggested that the sur-face sediments retained by check-dams primarily originated fromsoils of forestland and shrubland. The result of the end-membermixing model supported these qualitative graphical analyses andsuggested a mixture of the two sources, with considerable inter-annual variability in their relative contributions. More than 50%SOC in surface sediment derived from forestland, whereas sub-surface sedimentary SOC mainly resulted from shrubland(MPE > 50%). The result was consistent with the report by Chenet al. (2016) who found that young forest was the main sedimentsource in this catchment, contributing 50.5%, whereas cropland,grassland and gully contributed 25.6%, 14.4% and 9.5%, respectively,in a small catchment of the Loess Plateau, China. The studies ofMcCorkle et al. (2016) also indicated that most of the organicmatter in the captured.
sediments were composed of O-horizon material which wasderived from forests or shrubs in a temperate forest catchment ofthe Sierra Nevada of California, USA.
This study region locates in a hilly-gully catchment of the LoessPlateau in China, accompanied by heavy soil erosion includingsheet and stream erosion, rill or gully erosion, and gravity erosion(Fu et al., 2011). In the past 30 years, large-scale ecological resto-ration projects have been implemented in this region, of whichafforestation (e.g., conversion from slope farm to planted forestlandor shrubland) is one of the main measures to control soil and water
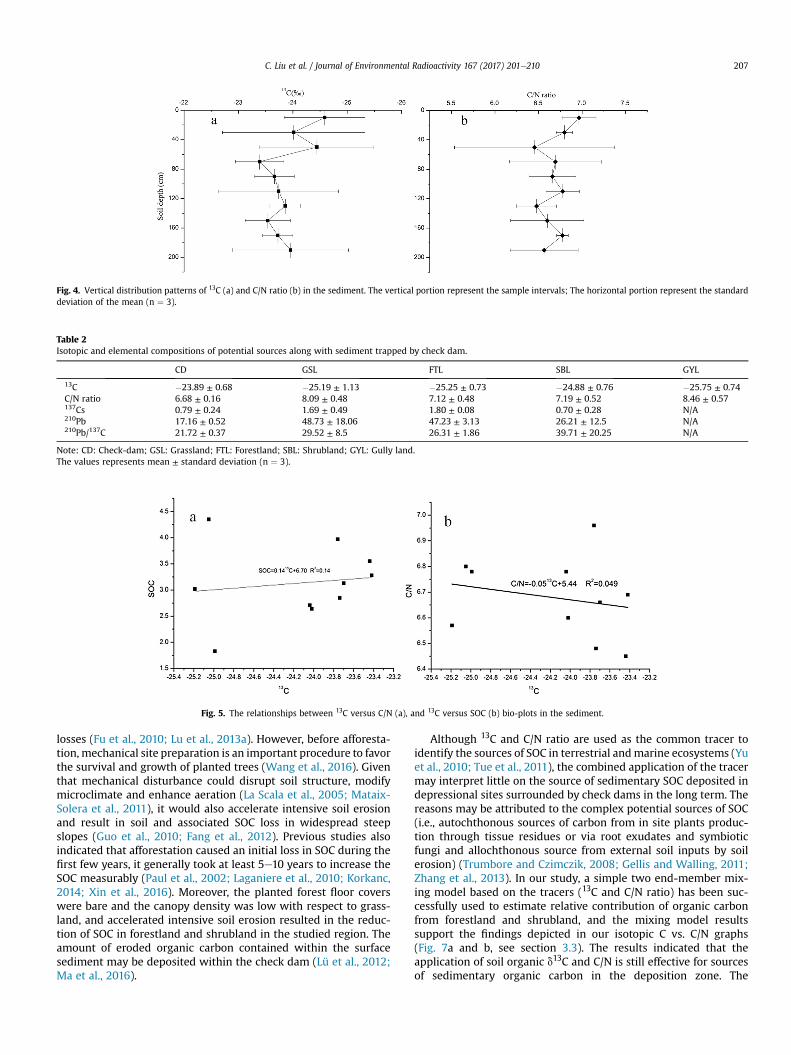
Fig. 4. Vertical distribution patterns of 13C (a) and C/N ratio (b) in the sediment. The vertical portion represent the sample intervals; The horizontal portion represent the standarddeviation of the mean (n ¼ 3).
Table 2Isotopic and elemental compositions of potential sources along with sediment trapped by check dam.
CD GSL FTL SBL GYL
13C �23.89 ± 0.68 �25.19 ± 1.13 �25.25 ± 0.73 �24.88 ± 0.76 �25.75 ± 0.74C/N ratio 6.68 ± 0.16 8.09 ± 0.48 7.12 ± 0.48 7.19 ± 0.52 8.46 ± 0.57137Cs 0.79 ± 0.24 1.69 ± 0.49 1.80 ± 0.08 0.70 ± 0.28 N/A210Pb 17.16 ± 0.52 48.73 ± 18.06 47.23 ± 3.13 26.21 ± 12.5 N/A210Pb/137C 21.72 ± 0.37 29.52 ± 8.5 26.31 ± 1.86 39.71 ± 20.25 N/A
Note: CD: Check-dam; GSL: Grassland; FTL: Forestland; SBL: Shrubland; GYL: Gully land.The values represents mean ± standard deviation (n ¼ 3).
Fig. 5. The relationships between 13C versus C/N (a), and 13C versus SOC (b) bio-plots in the sediment.
C. Liu et al. / Journal of Environmental Radioactivity 167 (2017) 201e210 207
losses (Fu et al., 2010; Lu et al., 2013a). However, before afforesta-tion, mechanical site preparation is an important procedure to favorthe survival and growth of planted trees (Wang et al., 2016). Giventhat mechanical disturbance could disrupt soil structure, modifymicroclimate and enhance aeration (La Scala et al., 2005; Mataix-Solera et al., 2011), it would also accelerate intensive soil erosionand result in soil and associated SOC loss in widespread steepslopes (Guo et al., 2010; Fang et al., 2012). Previous studies alsoindicated that afforestation caused an initial loss in SOC during thefirst few years, it generally took at least 5e10 years to increase theSOC measurably (Paul et al., 2002; Laganiere et al., 2010; Korkanc,2014; Xin et al., 2016). Moreover, the planted forest floor coverswere bare and the canopy density was low with respect to grass-land, and accelerated intensive soil erosion resulted in the reduc-tion of SOC in forestland and shrubland in the studied region. Theamount of eroded organic carbon contained within the surfacesediment may be deposited within the check dam (Lü et al., 2012;Ma et al., 2016).
Although 13C and C/N ratio are used as the common tracer toidentify the sources of SOC in terrestrial andmarine ecosystems (Yuet al., 2010; Tue et al., 2011), the combined application of the tracermay interpret little on the source of sedimentary SOC deposited indepressional sites surrounded by check dams in the long term. Thereasons may be attributed to the complex potential sources of SOC(i.e., autochthonous sources of carbon from in site plants produc-tion through tissue residues or via root exudates and symbioticfungi and allochthonous source from external soil inputs by soilerosion) (Trumbore and Czimczik, 2008; Gellis and Walling, 2011;Zhang et al., 2013). In our study, a simple two end-member mix-ing model based on the tracers (13C and C/N ratio) has been suc-cessfully used to estimate relative contribution of organic carbonfrom forestland and shrubland, and the mixing model resultssupport the findings depicted in our isotopic C vs. C/N graphs(Fig. 7a and b, see section 3.3). The results indicated that theapplication of soil organic d13C and C/N is still effective for sourcesof sedimentary organic carbon in the deposition zone. The
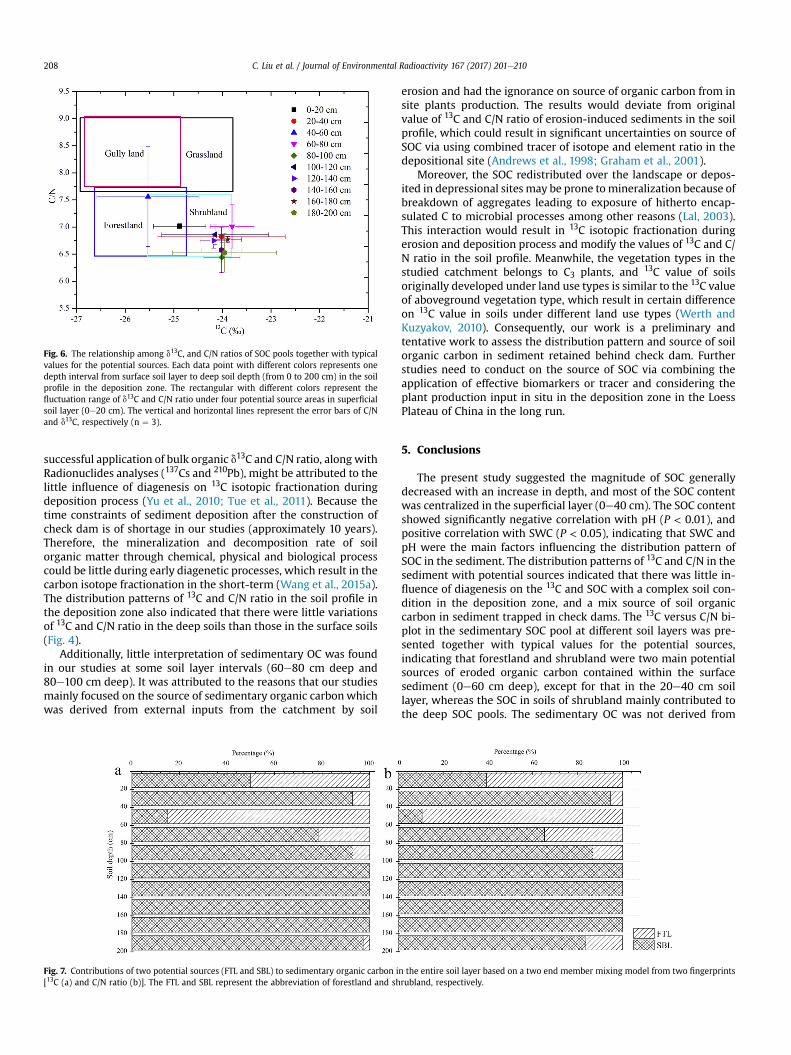
Fig. 6. The relationship among d13C, and C/N ratios of SOC pools together with typicalvalues for the potential sources. Each data point with different colors represents onedepth interval from surface soil layer to deep soil depth (from 0 to 200 cm) in the soilprofile in the deposition zone. The rectangular with different colors represent thefluctuation range of d13C and C/N ratio under four potential source areas in superficialsoil layer (0e20 cm). The vertical and horizontal lines represent the error bars of C/Nand d13C, respectively (n ¼ 3).
C. Liu et al. / Journal of Environmental Radioactivity 167 (2017) 201e210208
successful application of bulk organic d13C and C/N ratio, along withRadionuclides analyses (137Cs and 210Pb), might be attributed to thelittle influence of diagenesis on 13C isotopic fractionation duringdeposition process (Yu et al., 2010; Tue et al., 2011). Because thetime constraints of sediment deposition after the construction ofcheck dam is of shortage in our studies (approximately 10 years).Therefore, the mineralization and decomposition rate of soilorganic matter through chemical, physical and biological processcould be little during early diagenetic processes, which result in thecarbon isotope fractionation in the short-term (Wang et al., 2015a).The distribution patterns of 13C and C/N ratio in the soil profile inthe deposition zone also indicated that there were little variationsof 13C and C/N ratio in the deep soils than those in the surface soils(Fig. 4).
Additionally, little interpretation of sedimentary OC was foundin our studies at some soil layer intervals (60e80 cm deep and80e100 cm deep). It was attributed to the reasons that our studiesmainly focused on the source of sedimentary organic carbonwhichwas derived from external inputs from the catchment by soil
Fig. 7. Contributions of two potential sources (FTL and SBL) to sedimentary organic carbon i[13C (a) and C/N ratio (b)]. The FTL and SBL represent the abbreviation of forestland and sh
erosion and had the ignorance on source of organic carbon from insite plants production. The results would deviate from originalvalue of 13C and C/N ratio of erosion-induced sediments in the soilprofile, which could result in significant uncertainties on source ofSOC via using combined tracer of isotope and element ratio in thedepositional site (Andrews et al., 1998; Graham et al., 2001).
Moreover, the SOC redistributed over the landscape or depos-ited in depressional sites may be prone tomineralization because ofbreakdown of aggregates leading to exposure of hitherto encap-sulated C to microbial processes among other reasons (Lal, 2003).This interaction would result in 13C isotopic fractionation duringerosion and deposition process and modify the values of 13C and C/N ratio in the soil profile. Meanwhile, the vegetation types in thestudied catchment belongs to C3 plants, and 13C value of soilsoriginally developed under land use types is similar to the 13C valueof aboveground vegetation type, which result in certain differenceon 13C value in soils under different land use types (Werth andKuzyakov, 2010). Consequently, our work is a preliminary andtentative work to assess the distribution pattern and source of soilorganic carbon in sediment retained behind check dam. Furtherstudies need to conduct on the source of SOC via combining theapplication of effective biomarkers or tracer and considering theplant production input in situ in the deposition zone in the LoessPlateau of China in the long run.
5. Conclusions
The present study suggested the magnitude of SOC generallydecreased with an increase in depth, and most of the SOC contentwas centralized in the superficial layer (0e40 cm). The SOC contentshowed significantly negative correlation with pH (P < 0.01), andpositive correlation with SWC (P < 0.05), indicating that SWC andpH were the main factors influencing the distribution pattern ofSOC in the sediment. The distribution patterns of 13C and C/N in thesediment with potential sources indicated that there was little in-fluence of diagenesis on the 13C and SOC with a complex soil con-dition in the deposition zone, and a mix source of soil organiccarbon in sediment trapped in check dams. The 13C versus C/N bi-plot in the sedimentary SOC pool at different soil layers was pre-sented together with typical values for the potential sources,indicating that forestland and shrubland were two main potentialsources of eroded organic carbon contained within the surfacesediment (0e60 cm deep), except for that in the 20e40 cm soillayer, whereas the SOC in soils of shrubland mainly contributed tothe deep SOC pools. The sedimentary OC was not derived from
n the entire soil layer based on a two end member mixing model from two fingerprintsrubland, respectively.
C. Liu et al. / Journal of Environmental Radioactivity 167 (2017) 201e210 209
grasslands or gullies. Radionuclides analyses (137Cs and 210Pb) alsoconfirmed that the surface sediments retained by check damsmainly originated from soils of forestland and shrubland. Our end-member mixing model results demonstrated that more than 50%SOC in surface sediments (0e20 cm) derived from forestland,whereas subsurface sedimentary SOC (20e200 cm)mainly resultedfrom shrubland (>50%) in the Loess Plateau of China. Althoughsignificant uncertainties on the sources of SOC in deep soils exist,the soil organic d13C and C/N is still an effective indicator for sourcesof sedimentary organic carbon in the deposition zone in the shortterm (<10 years). Future research needs to further investigate thepotential sources of sedimentary OC via using more effectivetracers or biomarkers under different land cover types or landformpositions when considering the primary production inputs or hu-man disturbances during deposition process in the long term.
Acknowledgments
This study is financially supported by the Open Fund of State KeyLaboratory of Soil Erosion and Dryland Farming on the LoessPlateau (A314021402-1501), the “Hundred-talent Project” of theChinese Academy of Sciences (A315021407) and the National Nat-ural Science Foundation of China (41271294). We also appreciategreatly anonymous reviewers and responsible editors of this jour-nal for valuable comments and suggestions to improve thismanuscript.
References
Alewell, C., Schaub, M., Conen, F., 2009. A method to detect soil carbon degradationduring soil erosion. Biogeosciences 6, 2541e2547.
Andrews, J.E., Greenaway, A.M., Dennis, P.F., 1998. Combined carbon isotope and C/Nratios as indicators of source and fate of organic matter in a poorly flushed,tropical estuary: Hunts Bay, Kingston Harbour, Jamaica. Estuar. Coast. Shelf. S.46, 743e765.
Berhe, A.A., Harte, J., Harden, J.W., Torn, M.S., 2007. The significance of the erosion-induced terrestrial carbon sink. Bioscience 57, 337e346.
Berhe, A.A., Kleber, M., 2013. Erosion, deposition, and the persistence of soil organicmatter: mechanistic considerations and problems with terminology. Earth Surf.Process. Landf. 38, 908e912.
Boeckx, P., Meirvenne, M.V., Raulo, F., Cleemput, O.V., 2006. Spatial patterns of d13Cand d15N in the urban topsoil of Gent. Belg. Org. Geochem 37, 1383e1393.
Carter, M.R., 1993. Soil Sampling and Methods of Analysis. CRC Press.Chen, F.X., Fang, N.F., Shi, Z.H., 2016. Using biomarkers as fingerprint properties to
identify sediment sources in a small catchment. Sci. Total Environ. 557e558,123e133.
Chen, M., Zeng, G.M., Zhang, J.C., et al., 2015. Global landscape of total organiccarbon, nitrogen and phosphorus in lake water. Sci. Rep. 5, 15043.
Cooper, R.J., Pedentchouk, N., Hiscock, K.M., et al., 2015. Apportioning sources oforganic matter in streambed sediments: An integrated molecular andcompound-specific stable isotope approach. Sci. Total Environ. 520, 187e197.
Doetterl, S., Berhe, A.A., Nadeu, E., Wang, Z.G., Sommer, M., Fiener, P., 2016. Erosion,deposition and soil carbon: a review of process-level controls, experimentaltools and models to address C cycling in dynamic landscapes. Earth Sci. Rev.154, 102e122.
Ehleringer, J.R., Buchmann, N., Flanagan, L.B., 2000. Carbon isotope ratios inbelowground carbon cycle processes. Ecol. Appl. 10, 412e422.
Fang, H.Y., Li, Q.Y., Sun, L.Y., 2012. Using Cs-137 to study spatial patterns of soilerosion and soil organic carbon (SOC) in an agricultural catchment of the typicalblack soil region, Northeast China. J. Environ. Radioact. 112, 125e132.
Fu, B.J., Hu, C.X., Chen, L.D., Honnay, O., Gulinck, H., 2006. Evaluating change inagricultural landscape pattern between 1980 and 2000 in the Loess hilly regionof Ansai County, China. Agric. Ecosyst. Environ. 114, 387e396.
Fu, B.J., Liu, Y., Lu, Y.H., He, C.S., Zeng, Y., Wu, B.F., 2011. Assessing the soil erosioncontrol service of ecosystems change in the Loess Plateau of China. Ecol.Complex 8, 284e293.
Fu, X., Shao, M., Wei, X., Robertm, H., 2010. Soil organic carbon and total nitrogen asaffected by vegetation types in Northern Loess Plateau of China. Geoderma 155,31e35.
Gao, P., Zhang, X.C., Mu, X.M., Wang, F., Li, R., Zhang, X.P., 2010. Trend and change-point analyses of streamflow and sediment discharge in the Yellow River during1950e2005. Hydrol. Sci. J 55, 275e285.
Gellis, A.C., Walling, D.E., 2011. Sediment source fingerprinting (tracing) and sedi-ment budgets as tools in targeting river and watershed restoration programs.In: Stream Restoration in Dynamic Fluvial Systems: Scientific Approaches, An-alyses, and Tools. Geophysical Monograph Series, vol. 194. American
Geophysical Union.Graham, M.C., Eaves, M.A., Farmer, J.G., Dobson, J., Fallick, A.E., 2001. A study of
carbon and nitrogen stable isotope and elemental ratios as potential indicatorsof source and fate of organic matter in sediments of the Forth Estuary, Scotland.Estuar. Coast. Shelf. S. 52, 375e380.
Guo, J., Yang, Y., Chen, G., Xie, J., Gao, R., Qian, W., 2010. Effects of clear-cutting andslash burning on soil respiration in Chinese fir and evergreen broadleavedforests in mid-subtropical China. Plant Soil 333, 249e261.
Harden, J.W., Berhe, A.A., Torn, M., Harte, J., Liu, S., Stallard, R.F., 2008. Soil erosion:data say C sink. Science 320, 178e179.
Hassan, M.A., Church, M., Xu, J., Yan, Y., 2008. Spatial and temporal variation ofsediment yield in the landscape: example of Huanghe (Yellow River). Geophys.Res. Lett. 35, L06401.
Hein, T., Baranyi, C., Herndl, G.J., Wanek, W., Schiemer, F., 2003. Allochthonous andautochthonous particulate organic matter in floodplains of the River Danube:the importance of hydrological connectivity. Freshw. Biol. 48, 220e232.
Jones, D., Willett, V., 2006. Experimental evaluation of methods to quantify dis-solved organic nitrogen (DON) and dissolved organic carbon (DOC) in soil. SoilBiol. Biochem. 38, 991e999.
Klaminder, J., Yoo, K., Giesler, R., 2009. Soil carbon accumulation in the dry tundra:important role played by precipitation. J. Geophys. Res. 114, G04005.
Kim, J.K., Onda, Y., Yang, D.-Y., Kim, M.S., 2013. Temporal variations of reservoirsediment sources in a small mountainous catchment in Korea. Earth Surf.Process. Landf. 38, 1380e1392.
Kim, W., 2008. Cosmogenic Isotopes to Disentangle Natural and AnthropogenicEffects on Erosion, pp. 1e78.
Korkanc, S.Y., 2014. Effects of afforestation on soil organic carbon and other soilproperties. Catena 123, 62e69.
La Scala, N., Lopes, A., Panosso, A.R., Camara, F.T., Pereira, G.T., 2005. Soil CO2 effluxfollowing rotary tillage of a tropical soil. Soil Till. Res. 84, 222e225.
Laceby, J.P., Olley, J., Pietsch, T.J., Sheldon, F., Bunn, S.E., 2015. Identifying subsoilsediment sources with carbon and nitrogen stable isotope ratios. Hydrol. Pro-cess 29, 1956e1971.
Laganiere, J., Angers, D.A., Pare, D., 2010. Carbon accumulation in agricultural soilsafter afforestation: a meta-analysis. Glob. Chang. Biol. 16, 439e453.
Lal, R., 2003. Soil erosion and the global carbon budget. Environ. Int. 29, 437e450.Lal, R., 2004. Soil carbon sequestration to mitigate climate change. Geoderma 123,
1e22.Li, Y., Zhang, Q.W., Reicosky, D.C., Bai, L.Y., Lindstrom, M.J., Li, L., 2006. Using 137Cs
and 210Pbex for quantifying soil organic carbon redistribution affected byintensive tillage on steep slopes. Soil Till. Res. 86, 176e184.
Li, Z.W., Liu, C., Dong, Y.T., et al., 2017. Response of soil organic carbon and nitrogenstocks to soil erosion and land use types in the Loess hillyegully region ofChina. Soil Till. Res. 166, 1e9.
Liu, G., Jiang, N., Zhang, L., Liu, Z., 1996. Soil Physical and Chemical Analysis andDescription of Soil Profiles. China Standard Methods Press, Beijing, China, p. 24.
Liu, S.G., Bliss, N., Sundquist, E., Huntington, T.G., 2003. Modeling carbon dynamicsin vegetation and soil under the impact of soil erosion and deposition. Glob.Biogeochem. Cycles 17, 1074.
Lü, Y.H., Sun, R.H., Fu, B.J., Wang, Y.F., 2012. Carbon retention by check dams:regional scale estimation. Eco. Eng. 44, 139e146.
Lu, N., Liski, J., Chang, R.Y., Akuj€arvi, A., Wu, X., Jin, T.T., Wang, Y.F., Fu, B.J., 2013a. Soilorganic carbon dynamics following afforestation in the Loess Plateau of China.Biogeosci. Discuss. 10, 11181e11211.
Lu, X.X., Ran, L.S., Liu, S., 2013b. Sediment loads response to climate change: apreliminary study of eight large Chinese rivers. Int. J. Sediment. Res. 28 (1),1e14.
Ma, W., Li, Z., Ding, K., Huang, B., Nie, X., 2016. Soil erosion, organic carbon andnitrogen dynamics in planted forests: a case study in a hilly catchment ofHunan Province, China. Soil Till. Res. 155, 69e77.
Mataix-Solera, J., Cerd�a, A., Arcenegui, V., Jord�an, A., Zavala, L.M., 2011. Fire effectson soil aggregation: a review. Earth Sci. Rev. 109, 44e60.
McCorkle, E.P., Berhe, A.A., Hunsaker, C.T., et al., 2016. Tracing the source of soilorganic matter eroded from temperate forest catchments using carbon andnitrogen isotopes. Chem. Geol. (in press). Available online 29 April 2016.
Melillo, J.M., Steudler, P.A., Aber, J.D., et al., 2002. Soil warming and carbon-cyclefeedbacks to the climate system. Science 298, 2173e2176.
Miao, C.Y., Ni, J.R., Borthwick, A.G.L., 2010. Recent changes of water discharge andsediment load in the Yellow River basin, China. Prog. Phys. Geogr. 34, 541e561.
Nelson, D.W., Sommers, L.E., 1982. Total carbon, organic carbon and organic matter.In: Page, A.L., Miller, R.H., Keeney, D.R. (Eds.), Methods of Soil Analysis. Amer-ican Society of Agronomy and Soil Science Society of American, Madison,pp. 1e129.
Norra, S., Handley, L., Berner, Z., Stüben, D., 2005. 13C and 15N natural abundances ofurban soils and herbaceous vegetation of Karlsruhe. Ger. Eur. J. Soil Sci. 56,607e620.
Paul, K.I., Polglase, P.J., Nyakuengama, J.G., Khanna, P.K., 2002. Change in soil carbonfollowing afforestation. For. Ecol. Manag. 168, 241e257.
Phillips, D.L., Koch, P.L., 2002. Incorporating concentration dependence in stableisotope mixing models. Oecologia 130, 114e125.
Ran, L.S., Lu, X.X., Xin, Z.B., 2014. Erosion-induced massive organic carbon burial andcarbon emission in the Yellow River basin, China. Biogeosciences 11, 945e959.
Ran, L.S., Lu, X.X., Xu, J.C., 2013. Effects of vegetation restoration on soil conservationand sediment loads in China: a critical review. Crit. Rev. Environ. Sci. Technol.43, 1384e1415.
C. Liu et al. / Journal of Environmental Radioactivity 167 (2017) 201e210210
Schoeninger, M.J., Deniro, M.J., 1984. Nitrogen and carbon isotopic composition ofbone collagen from marine and terrestrial animals. Geochim. Cosmochim. Ac48, 625e639.
Shi, H., Shao, M.G., 2000. Soil and water loss from the Loess Plateau in China. J. Arid.Environ. 45, 9e20.
Simms, A.D., Woodroffe, C., Jones, B.G., Heijnis, H., Mann, R.A., Harrison, J., 2008. Useof 210Pb and 137Cs to simultaneously constrain ages and sources of post-damsediments in the Cordeaux reservoir, Sydney, Australia. J. Environ. Radioact.99, 1111e1120.
Smith, S.V., Renwick, W.H., Buddemeier, R.W., Crossland, C.J., 2001. Budgets of soilerosion and deposition for sediments and sedimentary organic carbon acrossthe conterminous United States. Glob. Biogeochem. Cycles 15, 697e707.
Stevenson, B.A., Kelly, E.F., McDonald, E.V., Busacca, A.J., 2005. The stable carbonisotope composition of soil organic carbon and pedogenic carbonates along abioclimatic gradient in the Palouse region, Washington State, USA. Geoderma124, 37e47.
Trumbore, S.E., Czimczik, C.I., 2008. An uncertain future for soil carbon. Science1455e1456.
Tue, N.Y., Hamaoka, H., Sogabe, A., Quy, T.D., Nhuan, M.T., Omori, K., 2011. Theapplication of d13C and C/N ratios as indicators of organic carbon sources andpaleoenvironmental change of the mangrove ecosystem from Ba Lat Estuary,Red River, Vietnam. Environ. Earth Sci. 64, 1475e1486.
Vandenbygaart, A.J., Gregorich, E.G., Helgason, B.L., 2015. Cropland C erosion andburial: is buried soil organic matter biodegradable? Geoderma s239es240,240e249.
Wang, G.A., J, Y.F., Li, W., 2015a. Effects of environmental and biotic factors oncarbon isotopic fractionation during decomposition of soil organic matter. Sci.Rep. 5, 11043.
Wang, J., Wang, H., Fu, X., 2016. Effects of site preparation treatments beforeafforestation on soil carbon. For. Eco Manag. 361, 277e285.
Wang, Y.H., Yang, Hao, Zhang, J.X., Xu, M.N., Wu, C.B., 2015b. Biomarker and stable
carbon isotopic signatures for 100e200 year sediment record in the Chaihecatchment in southwest China. Sci. Total Environ. 502, 266e275.
Weihmann, J., Mansfeldt, T., Schulte, U., 2007. Stable carbon (12/13C) and nitro-gen(14/15N) isotopes as a tool for identifying the sources of cyanide in wastesand contaminated soils e a method development. Anal. Chim. Acta 582,375e381.
Werth, M., Kuzyakov, Y., 2010. 13C fractionation at the root microorganisms soilinterface: a review and outlook for partitioning studies. Soil Biol. Biochem. 42,1372e1384.
Xin, Z.B., Qin, Y.B., Yu, X.X., 2016. Spatial variability in soil organic carbon and itsinfluencing factors in a hilly watershed of the Loess Plateau, China. Catena 137,660e669.
Xin, Z.B., Ran, L.S., Lu, X.X., 2012. Soil erosion control and sediment load reduction inthe Loess Plateau: policy perspectives. Int. J. Water Resour. Dev. 28, 325e341.
Xu, X.Z., Zhang, H.W., Zhang, O.Y., 2004. Development of check-dam systems ingullies on the Loess Plateau, China. Environ. Sci. Policy 7, 79e86.
Yoo, K., Amundson, R., Heimsath, A., Dietrich, W., 2005. Erosion of upland hillslopesoil organic carbon: coupling field measurements with a sediment transportmodel. Glob. Biogeochem. Cycles 19, GB3003.
Yu, F.L., Zong, Y.Q., Lloyd, J.M., et al., 2010. Bulk organic d13C and C/N as indicators forsediment sources in the Pearl River delta and estuary, southern China. Estuar.Coast. Shelf. S. 87, 618e630.
Zhang, X., Li, Z.W., Tang, Z.H., Zeng, G.M., Huang, J.Q., Guo, W., Chen, X.l, Hirsh, A.,2013. Effects of water erosion on the redistribution of soil organic carbon in thehilly red soil region of southern China. Geomorphology 97, 137e144.
Zhou, S.M., Lei, T.W., Warrington, D.N., Lei, Q.X., Zhang, M.L., 2012. Does watershedsize affect simple mathematical relationships between flow velocity anddischarge rate at watershed outlets on the Loess Plateau of China. J. Hydrol. 444,1e9.
Zhu, S., Liu, C., 2008. Stable carbon isotopic composition of soil organic matter in thekarst areas of southwest China. Chin. J. Geochem 27, 171e177.